

Abstract
Previous studies identified a role for latent herpesvirus infection in cross-protection against infection and exacerbation of chronic inflammatory diseases. Here, we identified more than 500 genes differentially expressed in spleens, livers, or brains of mice latently infected with gammaherpesvirus 68 and found that distinct sets of genes linked to different pathways were altered in the spleen compared to those in the liver. Several of the most differentially expressed latency-specific genes (e.g., the gamma interferon [IFN-γ], Cxcl9, and Ccl5 genes) are associated with known latency-specific phenotypes. Chronic herpesvirus infection, therefore, significantly alters the transcriptional status of host organs. We speculate that such changes may influence host physiology, the status of the immune system, and disease susceptibility.
TEXT
Herpesviruses transit between lytic and latent life cycles and cause lifelong infection of their hosts. Following acute lytic infection of various cell types, herpesviruses establish latency, defined experimentally as the presence of the viral genome without production of infectious virus (1). Humans are chronically infected with numerous viruses, including several herpesviruses (1). However, the effect of chronic viral infection on the host is not well understood. We and others have shown that latent viral infection can protect hosts from lethal challenges with bacteria and lymphoma cells (2–4). This latency-induced cross-protection is associated with activation of macrophages, production of the inflammatory cytokine, gamma interferon (IFN-γ), and arming of natural killer cells (2, 3). Latent murine gammaherpesvirus 68 (MHV68, γHV-68, MuHV-4) also modulates adenovirus and plasmodium infections (5, 6). MHV68 is implicated in exacerbating experimental autoimmune encephalomyelitis (EAE), a rodent model for multiple sclerosis (7, 8), as well as a mouse model of inflammatory bowel disease (9). Together, these studies are consistent with chronic or latent herpesvirus infection having substantial effects on host immune responses to unrelated antigens. This led us to determine whether latent herpesvirus infection induces distinct transcriptional changes in specific organs by analyzing microarray data from RNA extracted from spleens, livers, and brains of mice infected with MHV68 or a mutant MHV68 virus with a stop codon in open reading frame 73 (ORF73) (ORF73.stop) that undergoes acute replication but is defective in the establishment of latency (10, 11).
Chronic MHV68 infection alters the host transcriptional profile.
To determine whether chronic MHV68 infection alters the host transcriptional profile in various organs, we infected 7- to 9-week-old male C57BL/6J mice intranasally with wild-type (WT) MHV68, ORF73.stop mutant virus, or “mockulum” (mock) as previously described (2). After cardiac perfusion with phosphate-buffered saline (PBS) to diminish numbers of peripheral blood cells in tissue, brains, livers, and spleens were harvested at 28 days postinfection (dpi), a time point at which we know that latency is established and at which cross-protection against bacteria is apparent (2–4, 12). Mice were handled in accordance with federal and Washington University regulations.
To identify the gene signature of latent infection, we analyzed the microarray data using two methods: (i) factorial analysis to identify genes with significant fold change differences between wild-type (WT) MHV68-infected mice and ORF73.stop-infected mice and (ii) a two-way analysis of variance (ANOVA) to identify genes that were significantly differentially expressed due to the type of tissue, the virus, or the combination of these two factors (P value < 0.05 for reported genes in each analysis). Differential expression analysis was performed in the MATLAB software environment. For both analyses, differentially expressed genes were identified by first comparing mock-infected mice to mice infected with ORF73.stop or WT MHV68. Next, we compared the gene expression profiles of differentially expressed genes from mice infected with ORF73.stop virus to those for mice infected with WT MHV68 to identify a set of genes specifically differentially expressed in mice that were infected with the latency-sufficient WT MHV68. We considered this set of genes to be specific to latent infection. Five hundred fifty-two genes were identified by both methods as differentially expressed in virus-infected hosts, and we considered this our high-confidence gene set (Fig. 1; see also Data Set S1 in the supplemental material). Of these 552 genes, 550 genes were specifically differentially expressed in latently infected animals and 2 genes were specifically differentially expressed in ORF73.stop-infected mice.
FIG 1.
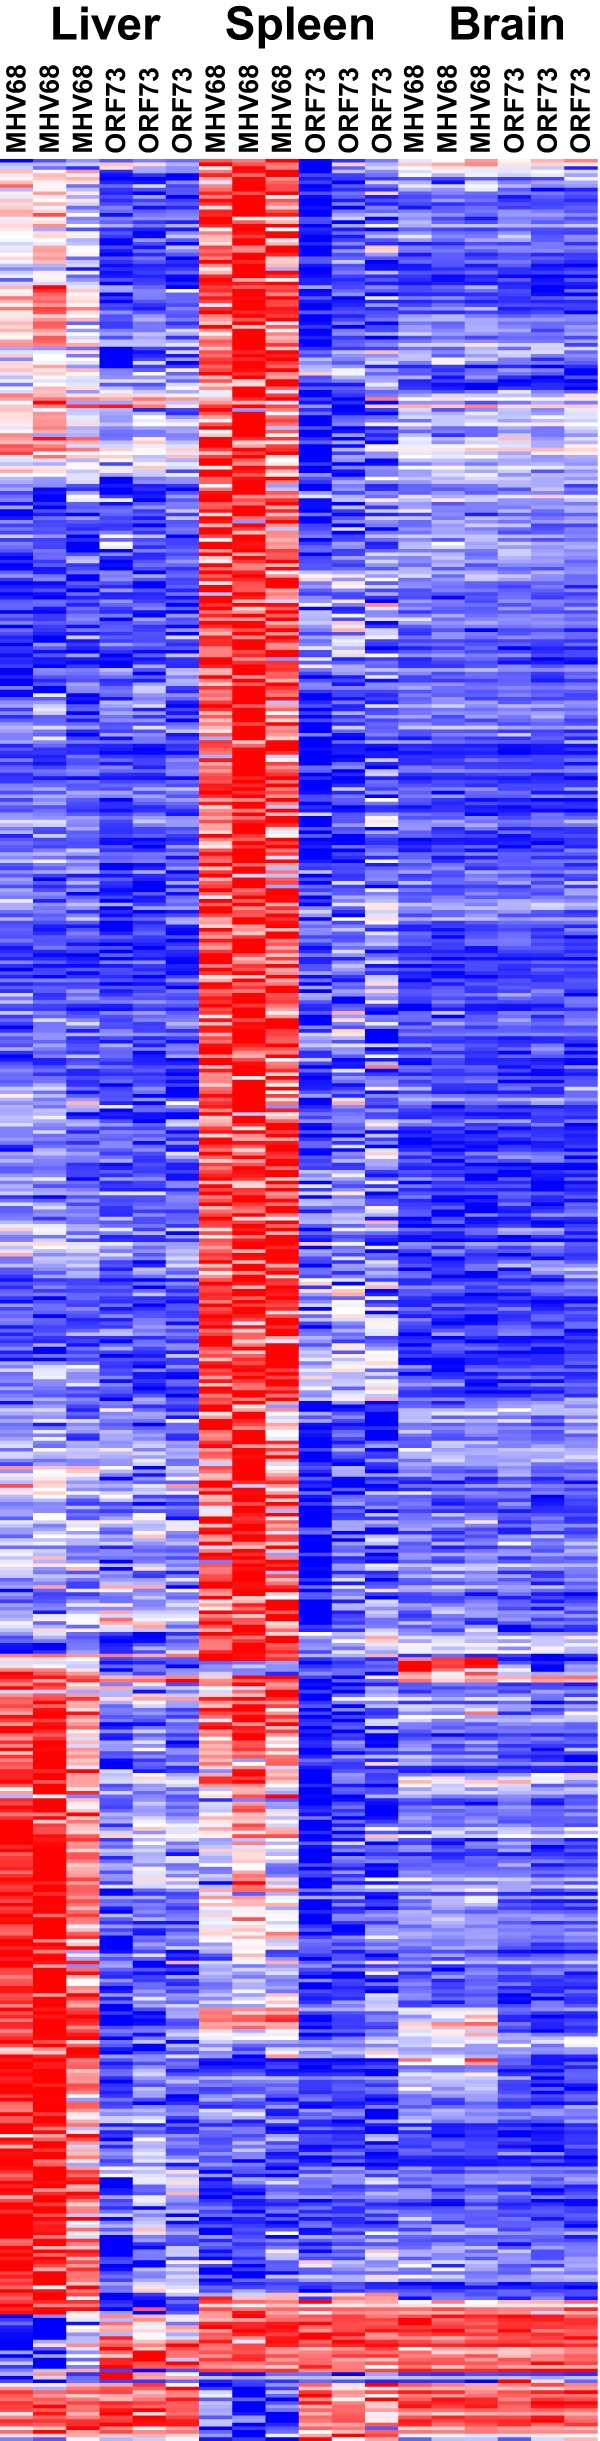
Latent MHV68 alters host gene expression. Male C57BL/6 mice were infected intranasally with MHV68, ORF73.stop mutant virus (ORF73), or mockulum (mock), and spleens, livers, and brains (3 experiments) were harvested at 28 dpi. RNA was extracted using the ToTALLY RNA kit (Ambion) from tissues incubated in RNAlater-ICE (Ambion). Equal amounts of RNA were pooled from three to four mice per condition for each microarray chip. RNA was labeled and hybridized to Affymetrix M430 2.0 microarrays at the Multiplexed Gene Analysis Core Facility at Washington University in St. Louis, MO. Data were normalized using the Robust Multi-array Average normalization routine in Affymetrix's Expression Console software. Microarray data were analyzed by both factorial analysis and two-way ANOVA. Differentially expressed genes identified by both analyses are shown in the heat map after hierarchical clustering of the genes. The heat map represents the fold change relative to results for mock-infected mice, with red representing the row maximum and blue the row minimum value. Statistical significance was performed by using a standard Student t test in the case of factorial analysis. P values were corrected for multiple hypothesis testing. Gene expression differences were considered significant if the adjusted P value was <0.05 and a >1.5-fold change was observed in expression levels.
Some genes are regulated with oscillations in the circadian rhythm. In fact, a recent study delineated a role for the circadian clock in expression and function of an innate immune response gene, encoding Toll-like receptor 9, highlighting the importance of controlling for diurnal gene regulation in studies of infection and immunity (13). Since two of the liver and spleen data sets were consistently collected in either the morning or afternoon, we included a third data set for which all samples were collected within 2 h. We also computationally tested whether circadian rhythm genes were present in our list of genes regulated by latent infection. Only 3 of 67 genes related to circadian rhythm in MSigDB (Molecular Signatures Database) were present in our list of latency-specific host genes, indicating that the time of harvest did not significantly confound our results.
To confirm the reproducibility of the latency-specific differential gene expression that we observed, we compared our gene expression signature in the spleens of latently infected mice to a complementary data set of gene expression in spleens of latently infected mice, independently generated by another group (14). There were 309 genes in common between these two data sets (P = 1.8876e−24 by a hypergeometric test). Furthermore, we used a direct quantitative correlation computation to compare the data sets. Since the data sets were profiled on distinct platforms (Illumina versus Affymetrix), we identified the most similar probes on the two platforms using the Smith-Waterman local alignment algorithm to compute a sequence nucleotide alignment score. After selecting matched pairs of probes, we evaluated the correlation between fold change in expression as observed in the two data sets. The regression coefficient between the comparable sets of data was 0.67. Together, these analyses demonstrate a significant overlap between spleen data sets generated using distinct platforms at different institutions and indicate that the gene expression changes we identified are robust. Our data extend these findings by analyzing gene expression in additional tissues, specifically the liver and brain.
To further validate our microarray findings, we selected 10 genes that we identified as specifically differentially expressed in latently infected animals for confirmation by quantitative real-time PCR (qRT-PCR) (Fig. 2 and Table 1). Genes were selected to encompass a range of fold changes and differential expression patterns (some specific to the spleen, some specific to the liver, and some differentially expressed in both tissues) and relationship to known pathways (e.g., IFN-γ signaling) or diseases (e.g., genome-wide association studies of multiple sclerosis or celiac disease) of interest. Our analyses predicted that the basic leucine zipper transcription factor, ATF-like (Batf), IFN-γ, and the interleukin 18 receptor accessory protein (Il18rap) were upregulated in the spleens of latently infected mice; vascular cell adhesion molecular 1 (Vcam1), spleen tyrosine kinase (Syk), and pleckstrin (Plek) were upregulated in the livers of latently infected mice; and gamma interferon-induced GTPase (Igtp), interferon-inducible GTPase 1 (Iigp1), and guanylate binding protein 1 (Gbp1) were upregulated in both livers and spleens, while macrophage receptor with collagenous structure (Marco) was upregulated in livers but downregulated in spleens. We confirmed latency-specific differential expression for 7 of 10 genes and 14 of 18 predictions. We found that Gbp1, Igtp, Iigp1, Marco, Syk, and Vcam1 but not Batf or Plek were differentially expressed in the livers of latently infected mice and that Gbp1, IFN-γ, Igtp, Iigp1, Marco, and Syk but not Batf, Il18rap, Plek, or Vcam1 were differentially expressed in the spleens of latently infected mice (Fig. 2). These results demonstrate that our computational analyses specifically identified many genes differentially expressed in latently infected animals.
FIG 2.

Validation of microarray analyses by qRT-PCR. RNA pooled from three to four mice per condition was treated with Turbo DNase (Life Technologies) before cDNA synthesis using 1 μg RNA, oligo(dT)12-18, and Superscript II reverse transcriptase (Life Technologies). qPCR was performed with cDNA from livers (A) or spleens (B) using Power SYBR green master mix (Applied Biosystems) with the indicated gene-specific primers (Table 1). Data were collected from 4 independent experiments. Transcript levels were normalized to the level of glyceraldehyde-3-phosphate dehydrogenase (GAPDH) within each sample and compared to the level in mock-infected mice using the ΔΔCT method (where CT is the threshold cycle). Data are presented as means ± SEM. Statistical analyses were performed by using the Mann-Whitney U test. ∗, P < 0.05; ns, not significant; nd, could not reliably detect target.
TABLE 1.
Primers used in this study for qRT-PCR
| Target | Primer sequencea |
|
|---|---|---|
| F primer | R primer | |
| Batf | TCAAGAAGGGGAGCCAGCTA | GCAGCGATGCGATTCTTCTC |
| Gbp1 | AAGAAGTGAAGCAGGGGACA | GCGGCTTCTGCTTTTATACG |
| IFNγ | CCTGCGGCCTAGCTCTGA | TGGCAGTAACAGCCAGAAACAG |
| Igtp | CCTGTTTTAGCCCGTCTTTTCACG | TCCTTCAGAGAGAACGCCTTATTGC |
| Iigp1 | CATTGAAAAGAAGCGGCAATTT | CAGTGCGGTAGAATTTCATGCT |
| Il18rap | CAGATCATCTCACCGGCCTC | AAACACCCAGCCCAAACAGA |
| Marco | TCATGGCCATCCACCTGATC | GCCCACTGCAGCGAGAAGAA |
| Plek | TCCTGGATAGCCCTGATGCT | TCACCCCCAGCAGGATCATA |
| Syk | GCCTTGCTAAGTGCGACATTG | GGCTATGCAGCCTTTGTAGCTTT |
| Vcam1 | CTGGGAAGCTGGAACGAAGT | GCCAAACACTTGACCGTGAC |
| GAPDH | TGCCCCCATGTTTGTGATG | TGTGGTCATGAGCCCTTCC |
F, forward; R, reverse.
To identify the genes with the largest differential gene expression in latently infected animals, we calculated the signal-to-noise ratio for each gene in each tissue by determining the difference between the mean fold change of results for MHV68 versus those for mock and ORF73.stop versus mock, scaled by the variance between these (i.e., the sum of the standard deviations). For genes detected by multiple probes, we averaged the fold change across the probes and then computed the signal-to-noise ratio using the average fold change values. Genes were ranked in order of the absolute value of the signal-to-noise ratio. We selected the top 50 genes identified in this signal-to-noise analysis and identified those that overlapped with the genes detected as statistically significant in our previous analyses (see Data Set S1 in the supplemental material). This conservative approach generated a set of genes (Tables 2 to 4) that exhibit infection-related changes in expression, which we then used as a substrate for considering the biological pathways that might be altered by chronic viral infection in different organs.
TABLE 2.
Genes most differentially expressed in spleens of latently infected mice
| Gene IDa | Gene name | Signal-to-noise ratio | Up or down relative to ORF73.stop |
|---|---|---|---|
| CXCL9 | Chemokine (C-X-C motif) ligand 9 | 22.9176 | Up |
| SAA3 | Serum amyloid A3 | 14.5842 | Up |
| TTC39C | Tetratricopeptide repeat domain 39C | 10.3055 | Up |
| GBP1 | Guanylate binding protein 1, interferon inducible | 10.1534 | Up |
| IGTP | Interferon gamma-induced GTPase | 10.0122 | Up |
| TIMP1 | Tissue inhibitor of metalloproteinase 1 | 9.8577 | Up |
| GZMB | Granzyme B | 8.3171 | Up |
| MELK | Maternal embryonic leucine zipper kinase | 7.8645 | Up |
| INCENP | Inner centromere protein | 7.499 | Up |
| GPNMB | Glycoprotein (transmembrane) nmb | 7.1763 | Up |
| AA467197 | Expressed sequence AA467197 | 6.9617 | Up |
| OSBPL3 | Oxysterol binding protein-like 3 | 6.7681 | Up |
| MKI67 | Antigen identified by monoclonal antibody Ki 67 | 6.5786 | Up |
| FABP5 | Fatty acid binding protein 5, epidermal | 6.5125 | Up |
| IFNG | Interferon gamma | 6.4947 | Up |
| RRM2 | Ribonucleotide reductase M2 | 5.999 | Up |
| MARCO | Macrophage receptor with collagenous structure | -5.7155 | Down |
| GBP2 | Guanylate binding protein 2 | 5.6835 | Up |
| 2410003J06RIK | Mageb16 melanoma antigen family B, 16 | 5.6572 | Up |
| XDH | Xanthine dehydrogenase | 5.5757 | Up |
| STX3 | Syntaxin 3 | 5.2772 | Up |
| BHLHE40 | Basic helix-loop-helix family, member e40 | 5.2416 | Up |
| IL1RL1 | Interleukin 1 receptor-like 1 | 5.1771 | Up |
| CDC45L | Cell division cycle 45 | 5.1685 | Up |
| TRAFD1 | TRAF type zinc finger domain containing 1 | 5.126 | Up |
| TAP1 | Transporter 1, ATP-binding cassette, subfamily B (MDR/TAP) | 5.1003 | Up |
| PARP9 | Poly(ADP-ribose) polymerase family, member 9 | 4.9727 | Up |
| CDC6 | Cell division cycle 6 | 4.9208 | Up |
| IIGP1 | Interferon-inducible GTPase 1 | 4.9031 | Up |
| IRG1 | Immunoresponsive gene 1 | 4.8747 | Up |
| PDCD1 | Programmed cell death 1 | 4.8335 | Up |
| RACGAP1 | Rac GTPase-activating protein 1 | 4.7826 | Up |
| HK2 | Hexokinase 2 | 4.766 | Up |
| CDKN1A | Cyclin-dependent kinase inhibitor 1A (P21) | 4.6531 | Up |
| KIF4 | Kinesin family member 4 | 4.6377 | Up |
| UBAC1 | Ubiquitin-associated domain-containing 1 | 4.6097 | Up |
| UPP1 | Uridine phosphorylase 1 | 4.5889 | Up |
| DTX1 | Deltex 1 homolog | −4.5719 | Down |
| CLEC4D | C-type lectin domain family 4, member d | 4.5384 | Up |
| PDCD1LG2 | Programmed cell death 1 ligand 2 | 4.5238 | Up |
| STAT1 | Signal transducer and activator of transcription 1 | 4.4588 | Up |
ID, identifier.
TABLE 4.
Genes most differentially expressed in brains of latently infected mice
| Gene IDa | Gene name | Signal-to-noise ratio | Up or down relative to ORF73.stop |
|---|---|---|---|
| IIGP1 | Interferon-inducible GTPase 1 | 8.358 | Up |
| GBP2 | Guanylate binding protein 2 | 6.2147 | Up |
| H2-Q7 | Histocompatibility 2, Q region locus 7 | 5.3892 | Up |
| H2-K1 | Histocompatibility 2, K1, K region | 4.5909 | Up |
| GBP6 | Guanylate binding protein 6 | 4.0888 | Up |
| CCL5 | Chemokine (C-C motif) ligand 5 | 3.6399 | Up |
| MS4A4B | Membrane-spanning 4 domains, subfamily A, member 4B | 3.2078 | Up |
| IGTP | Interferon gamma-induced GTPase | 3.1533 | Up |
| H2-EB1 | Histocompatibility 2, class II antigen E beta | 3.1481 | Up |
| MPA2L | Guanylate binding protein 6 | 2.5005 | Up |
| CXCL9 | Chemokine (C-X-C motif) ligand 9 | 2.4388 | Up |
| H2-AA | Histocompatibility 2, class II antigen A, alpha | 2.414 | Up |
| PSMB9 | Proteasome (prosome, macropain) subunit, beta type 9 (large multifunctional peptidase 2) | 1.9199 | Up |
| PLAC8 | Placenta-specific 8 | 0.9556 | Up |
ID, identifier.
Distinct pathways are regulated by latent viral infection in livers and spleens.
Using hierarchical clustering, we found that the differentially expressed genes covaried by organ (Fig. 1). We identified a subset of genes that were primarily differentially expressed in the liver and a separate subset of genes that were primarily differentially expressed in the spleen, with modest overlap between the two tissues. To determine the specific cellular pathways altered in the organs of latently infected mice, we used MSigDB to evaluate pathway enrichment by gene set enrichment analysis (15). To determine the pathways enriched by latent viral infection, we used factorial analysis to determine the differentially expressed genes in each organ in WT MHV68-infected mice compared to those for mock-infected mice and then removed any genes that were also differentially expressed in ORF73.stop-infected mice. The numbers of genes that were differentially expressed in both WT MHV68 and ORF73.stop-infected mice compared to those for mock infection were modest (65 for liver, 15 for spleen, and 1 for brain). Of the 736 genes differentially expressed in the spleens of latently infected mice, we found that most genes were associated with cell cycle pathways (Fig. 3A). This is consistent with a previous report of differential gene expression in the spleens of mice infected with MHV68, the betaherpesvirus, murine cytomegalovirus (MCMV), or the human alphaherpesvirus, herpes simplex virus (HSV) (14). In contrast, of the 538 genes differentially expressed in the livers of latently infected mice, most differentially expressed genes were associated with immune signaling and immune response pathways, including interferon signaling (Fig. 3B). The immune-related gene expression changes detected in the liver were consistent with histological sections in which foci of inflammatory cells were visible from mice infected with WT MHV68 but not ORF73.stop virus or mock-infected mice and likely reflected the immigration of inflammatory cells rather than changes in resident hepatocytes (data not shown). Because of the potential of diurnal gene regulation as a confounding factor and the fact that the circadian rhythm was identified as a significant pathway for differentially expressed genes in WT MHV68-infected livers compared to livers from mock-infected mice, we identified the circadian genes (Clock, Cpt1a, Elovl3, Per1, and Per2 genes) that were differentially expressed in the livers of latently infected mice and repeated pathway analysis with these removed to test their effect on latency-specific pathways. The pathway of genes involved in platelet activation, signaling, and aggregation was no longer statistically significant. The number of genes in the overlap with the pathway of genes involved in metabolism of lipids and lipoproteins decreased by 3, and the negative log of the q value decreased to 4.0915 from 5.9586. All of the other pathways were insensitive to the removal of the circadian clock genes. Although there were few genes whose expression changed in the brains of latently infected mice (n = 32), many of the genes altered in the brain were also differentially expressed in the liver or spleen of latently infected mice (see Fig. 1). The pathways significantly enriched in brains of latently infected mice were predominantly related to the immune system and interferon signaling (Fig. 3C). Finally, we tested what pathways were enriched across multiple tissues. We found that there were 109 genes that were differentially expressed in both livers and spleens of latently infected mice. The immune system generally and interferon signaling specifically were the most significant pathways for these overlapping genes (data not shown). Taken together, these results demonstrate that latent viral infection differentially altered host gene expression specifically by tissue type, suggesting that there are distinct tissue responses to the host inflammatory response induced by chronic infection and that the modest number of common gene expression changes across tissues may be largely attributable to chronic interferon signaling (2).
FIG 3.

Pathway analysis of differentially expressed genes in latently infected mice. Gene overlap analyses of differentially expressed genes in spleens (A), livers (B), or brains (C) of MHV68-infected mice. A list of latent infection-specific differentially expressed genes was identified by comparing MHV68-infected mice to mock-infected mice and then removing genes that overlapped with those differentially expressed for ORF73.stop-infected mice compared to expression for mock-infected mice. Pathways were identified using MSigDB's Canonical Pathway gene set. The 50 most significant pathways for spleens (A) or livers (B) are displayed. The x axis represents the q value, indicating the significance of enrichment for a given gene set. The values are plotted on a negative log10 scale. Gene sets with values of >1.3 (q < 0.05) were significantly enriched.
Differentially expressed genes are significantly associated with genes regulated by the cytokine gamma interferon.
IFN-γ is required for controlling MHV68 reactivation from latency and persistent viral replication and is elevated in the serum of latently infected mice (2, 16–18). Previous work suggested that IFN-γ is critical to latency-induced cross-protection against bacterial challenges and that central nervous system (CNS)-infiltrating T cells in MHV68-exacerbated EAE produce elevated levels of IFN-γ (2, 7). Our microarray pathway analysis also confirmed that the IFN-γ pathway was one of the most significantly enriched pathways in livers and brains of latently infected mice. To confirm that host genes induced in the setting of chronic MHV68 infection are also regulated by IFN-γ, we compared our list of genes differentially expressed in mice infected with WT MHV68 (relative to expression in mock-infected mice) to a list of IFN-γ-regulated genes in murine bone marrow-derived macrophages (19). We found that there was significant overlap between IFN-γ-regulated genes in bone marrow-derived macrophages and tissues from MHV68-infected mice. Of the 359 genes regulated by IFN-γ, 59 were regulated in the livers (P = 2.4390e−27), 72 were regulated in the spleens (P = 7.4127e−33), and 12 were regulated in the brains (P = 1.8151e−13) of latently infected mice (Fig. 4; see also Data Set S2 in the supplemental material). Many of the most differentially expressed genes in all three tissues from latently infected mice (Tables 2 to 4) are known to be induced by IFN-γ, including genes encoding the Igtp, Iigp1, Gbps, Ccl5, Cxcl9, and MHC molecules. IFN-γ itself was significantly upregulated in the latently infected mouse spleen (Fig. 2 and Table 2), an organ in which significantly reduced Listeria and Yersinia titers are observed in latently infected animals, suggesting a mechanism by which latently infected mice resist lethal bacterial challenges (2). Interestingly, the key IFN-γ signaling molecule, Stat1, was one of the most upregulated genes in both livers and spleens of latently infected mice (Tables 2 and 3). This suggests that active interferon signaling was also present in the livers of latently infected mice where Listeria titers are reduced (2). These results suggest that many of the genes differentially expressed in latently infected mice were a result of elevated IFN-γ levels in the host, which have been detected during chronic MHV68 infection and are mechanistically important to latency-induced cross-protection (2).
FIG 4.

Overlap of genes regulated by IFN-γ and latent viral infection. Heat map of differentially expressed genes in livers, spleens, or brains from MHV68-infected mice (compared to mock-infected mice) that significantly overlapped with genes altered by IFN-γ in bone marrow-derived macrophages. The heat map displays the fold change relative to results for mock-infected mice, with red representing the row maximum and blue the row minimum value. Statistical significance was assessed by a hypergeometric test. Nominal P values were used.
TABLE 3.
Genes most differentially expressed in livers of latently infected mice
| Gene IDa | Gene name | Signal-to-noise ratio | Up or down relative to ORF73.stop |
|---|---|---|---|
| IGTP | Interferon gamma induced GTPase | 7.3767 | Up |
| MS4A4B | Membrane-spanning 4 domains, subfamily A, member 4B | 6.1604 | Up |
| IIGP1 | Interferon inducible GTPase 1 | 5.726 | Up |
| STAT1 | Signal transducer and activator of transcription 1 | 5.4494 | Up |
| PTPN18 | Protein tyrosine phosphatase, non-receptor type 18 | 5.4011 | Up |
| FYB | FYN binding protein | 5.0647 | Up |
| H2-Q7 | Histocompatibility 2, Q region locus 7 | 5.013 | Up |
| LY6A | Lymphocyte antigen 6 complex, locus A | 4.7926 | Up |
| LCK | Lymphocyte protein tyrosine kinase | 4.7378 | Up |
| SAA3 | Serum amyloid A 3 | 4.6449 | Up |
| GZMK | Granzyme K | 4.6062 | Up |
| GZMA | Granzyme A | 4.2374 | Up |
| GPR65 | G-protein-coupled receptor 65 | 4.142 | Up |
| BC023105 | cDNA sequence BC023105 | 4.0748 | Up |
| RGS1 | Regulator of G-protein signaling 1 | 4.0444 | Up |
| MPA2L | Guanylate binding protein 6 | 4.022 | Up |
| LST1 | Leukocyte specific transcript 1 | 3.9534 | Up |
| SAMHD1 | SAM domain and HD domain, 1 | 3.9515 | Up |
| S100A4 | S100 calcium binding protein A4 | 3.9262 | Up |
| GBP8 | Guanylate-binding protein 8 | 3.8212 | Up |
| ZBP1 | Z-DNA binding protein 1 | 3.8156 | Up |
| PITPNM1 | Phosphatidylinositol transfer protein, membrane-associated 1 | 3.752 | Up |
| FCGR4 | Fc receptor, IgG, low affinity IV | 3.678 | Up |
| TAP1 | Transporter 1, ATP-binding cassette, subfamily B (MDR/TAP) | 3.5956 | Up |
| PTGER4 | Prostaglandin E receptor 4 (subtype EP4) | 3.5583 | Up |
| CAR14 | Carbonic anhydrase 14 | -3.4574 | Down |
| ADCY7 | Adenylate cyclase 7 | 3.4362 | Up |
| GBP2 | Guanylate binding protein 2 | 3.373 | Up |
| CCL5 | Chemokine (C-C motif) ligand 5 | 3.3726 | Up |
| H2-AA | Histocompatibility 2, class II antigen A, alpha | 3.3344 | Up |
| PSMB8 | Proteasome (prosome, macropain) subunit, beta type 8 (large multifunctional peptidase 7) | 3.2619 | Up |
| H2-K1 | Histocompatibility 2, K1, K region | 3.2481 | Up |
| S100A6 | S100 calcium binding protein A6 (calcyclin) | 3.2016 | Up |
| EPB4.1L3 | Erythrocyte protein band 4.1-like 3 | 3.15 | Up |
| LAPTM5 | Lysosome-associated protein transmembrane 5 | 3.1224 | Up |
ID, identifier.
EAE exacerbation by latent MHV68 is associated not only with IFN-γ but also with increased inflammatory infiltration into the CNS and elevated serum levels of the chemokines Ccl5 and Cxcl9, which are known to attract T cells (7). Although the authors were unable to detect these chemokines in the CNS of latently infected mice, Ccl5 and Cxcl9 are significantly elevated in mouse sera from latently infected mice at the onset of EAE symptoms (7). Importantly, we detected Ccl5 and Cxcl9 as two of the most differentially expressed transcripts in the brains of latently infected mice (Table 4). These data suggest that elevated expression of Ccl5 and Cxcl9 in the brain during latent infection may induce T cell migration into the CNS, leading to augmented EAE symptoms.
Activated macrophages have been implicated in several models of latency-induced cross-protection, including challenges with bacteria and influenza virus (2, 20). Specifically, these models have identified activated macrophages as those expressing increased major histocompatibility complex (MHC) class II molecules. Genes encoding MHC class II molecules, specifically H2-Aa and H2-Eb1, were among the most highly differentially expressed genes in the livers and brains of latently infected mice (Tables 3 and 4). These data confirm that latent MHV68 infection can induce upregulation of MHC class II molecules in multiple organs with implications for cross-protection against a range of infectious challenges.
Here, we have shown that chronic herpesvirus infection can profoundly alter gene expression in the host in a tissue-specific manner. The observed host transcriptional changes induced by latent infection were predominantly changes in immune-related genes. However, the specific genes and pathways induced in latently infected animals differed by tissue type. Whether this was due to local differences in the inflammatory milieu or differential tissue responses to the same stimulus is unknown. However, given the differential effects of interferons and interferon-regulated molecules in different cell types (21–26), it is reasonable to hypothesize that the differences observed here were the result of differential cell responses and cell composition in specific organs.
It is interesting to speculate on what effects the gene expression changes induced by latent viral infection might have on the function of host tissues. Previous studies delineating a role for MHV68 in exacerbating EAE pathology (7, 8), in addition to the importance of IFN-γ in EAE pathogenesis (27) and in the induction of many of the changes observed here, suggest that the gene expression changes induced in the setting of latent viral infection may alter the course of chronic disease pathogenesis. In a previous study of splenic gene expression changes in response to HSV, MCMV, or MHV68 infection, the authors identified virus-specific changes (14), suggesting that there may be important, dynamic, and complex gene expression changes in a human host infected with multiple viruses. Taken together, these results demonstrate that chronic viral infection can have profound and distinct effects on the host, with potential implications for tissue function and pathogenesis of chronic disease in susceptible hosts.
Microarray data accession number.
Microarray data have been deposited in GeoArchive, series number GSE51365.
Supplementary Material
ACKNOWLEDGMENTS
This work was supported by NIH grants CA096511 and AI084887 (to H.V.W.) and DK043351 (to R.X.). S.P.C. is supported by NIH F30 HL099019, and T.A.R. was supported by the Damon Runyon Cancer Research Foundation. We thank the Genome Technology Access Center in the Department of Genetics at Washington University School of Medicine for performing microarrays. The Center is partially supported by NCI Cancer Center Support Grant P30 CA91842 to the Siteman Cancer Center and by ICTS/CTSA grant UL1 TR000448 from the National Center for Research Resources (NCRR), a component of the National Institutes of Health (NIH), and NIH Roadmap for Medical Research.
This publication is solely the responsibility of the authors and does not necessarily represent the official view of NCRR or NIH.
We thank Darren Kreamalmeyer for expert animal care, members of the Virgin lab for helpful discussions and review of the manuscript, Weixiong Zhang and Michael Stevens for initial discussion of the data, and Erik Barton for sharing data.
Footnotes
Published ahead of print 23 October 2013
Supplemental material for this article may be found at http://dx.doi.org/10.1128/JVI.02708-13.
REFERENCES
- 1.Virgin HW, Wherry EJ, Ahmed R. 2009. Redefining chronic viral infection. Cell 138:30–50. 10.1016/j.cell.2009.06.036 [DOI] [PubMed] [Google Scholar]
- 2.Barton ES, White DW, Cathelyn JS, Brett-McClellan KA, Engle M, Diamond MS, Miller VL, Virgin HW. 2007. Herpesvirus latency confers symbiotic protection from bacterial infection. Nature 447:326–329. 10.1038/nature05762 [DOI] [PubMed] [Google Scholar]
- 3.White DW, Keppel CR, Schneider SE, Reese TA, Coder J, Payton JE, Ley TJ, Virgin HW, Fehniger TA. 2010. Latent herpesvirus infection arms NK cells. Blood 115:4377–4383. 10.1182/blood-2009-09-245464 [DOI] [PMC free article] [PubMed] [Google Scholar]
- 4.Yager EJ, Szaba FM, Kummer LW, Lanzer KG, Burkum CE, Smiley ST, Blackman MA. 2009. Gamma-herpesvirus-induced protection against bacterial infection is transient. Viral Immunol. 22:67–71. 10.1089/vim.2008.0086 [DOI] [PMC free article] [PubMed] [Google Scholar]
- 5.Haque A, Rachinel N, Quddus MR, Haque S, Kasper LH, Usherwood E. 2004. Co-infection of malaria and gamma-herpesvirus: exacerbated lung inflammation or cross-protection depends on the stage of viral infection. Clin. Exp. Immunol. 138:396–404. 10.1111/j.1365-2249.2004.02652.x [DOI] [PMC free article] [PubMed] [Google Scholar]
- 6.Nguyen Y, McGuffie BA, Anderson VE, Weinberg JB. 2008. Gammaherpesvirus modulation of mouse adenovirus type 1 pathogenesis. Virology 380:182–190. 10.1016/j.virol.2008.07.031 [DOI] [PMC free article] [PubMed] [Google Scholar]
- 7.Casiraghi C, Shanina I, Cho S, Freeman ML, Blackman MA, Horwitz MS. 2012. Gammaherpesvirus latency accentuates EAE pathogenesis: relevance to Epstein-Barr virus and multiple sclerosis. PLoS Pathog. 8:e1002715. 10.1371/journal.ppat.1002715 [DOI] [PMC free article] [PubMed] [Google Scholar]
- 8.Peacock JW, Elsawa SF, Petty CC, Hickey WF, Bost KL. 2003. Exacerbation of experimental autoimmune encephalomyelitis in rodents infected with murine gammaherpesvirus-68. Eur. J. Immunol. 33:1849–1858. 10.1002/eji.200323148 [DOI] [PMC free article] [PubMed] [Google Scholar]
- 9.Nelson DA, Petty CC, Bost KL. 2009. Infection with murine gammaherpesvirus 68 exacerbates inflammatory bowel disease in IL-10-deficient mice. Inflamm. Res. 58:881–889. 10.1007/s00011-009-0059-x [DOI] [PubMed] [Google Scholar]
- 10.Fowler P, Marques S, Simas JP, Efstathiou S. 2003. ORF73 of murine herpesvirus-68 is critical for the establishment and maintenance of latency. J. Gen. Virol. 84:3405–3416. 10.1099/vir.0.19594-0 [DOI] [PubMed] [Google Scholar]
- 11.Moorman NJ, Willer DO, Speck SH. 2003. The gammaherpesvirus 68 latency-associated nuclear antigen homolog is critical for the establishment of splenic latency. J. Virol. 77:10295–10303. 10.1128/JVI.77.19.10295-10303.2003 [DOI] [PMC free article] [PubMed] [Google Scholar]
- 12.Tibbetts SA, Loh J, Van Berkel V, McClellan JS, Jacoby MA, Kapadia SB, Speck SH, Virgin HW., IV 2003. Establishment and maintenance of gammaherpesvirus latency are independent of infective dose and route of infection. J. Virol. 77:7696–7701. 10.1128/JVI.77.13.7696-7701.2003 [DOI] [PMC free article] [PubMed] [Google Scholar]
- 13.Silver AC, Arjona A, Walker WE, Fikrig E. 2012. The circadian clock controls toll-like receptor 9-mediated innate and adaptive immunity. Immunity 36:251–261. 10.1016/j.immuni.2011.12.017 [DOI] [PMC free article] [PubMed] [Google Scholar]
- 14.White DW, Beard RS, Barton ES. 2012. Immune modulation during latent herpesvirus infection. Immunol. Rev. 245:189–208. 10.1111/j.1600-065X.2011.01074.x [DOI] [PMC free article] [PubMed] [Google Scholar]
- 15.Subramanian A, Tamayo P, Mootha VK, Mukherjee S, Ebert BL, Gillette MA, Paulovich A, Pomeroy SL, Golub TR, Lander ES, Mesirov JP. 2005. Gene set enrichment analysis: a knowledge-based approach for interpreting genome-wide expression profiles. Proc. Natl. Acad. Sci. U. S. A. 102:15545–15550. 10.1073/pnas.0506580102 [DOI] [PMC free article] [PubMed] [Google Scholar]
- 16.Gangappa S, van Dyk LF, Jewett TJ, Speck SH, Virgin HW. 2002. Identification of the in vivo role of a viral bcl-2. J. Exp. Med. 195:931–940. 10.1084/jem.20011825 [DOI] [PMC free article] [PubMed] [Google Scholar]
- 17.Steed AL, Barton ES, Tibbetts SA, Popkin DL, Lutzke ML, Rochford R, Virgin HW., IV 2006. Gamma interferon blocks gammaherpesvirus reactivation from latency. J. Virol. 80:192–200. 10.1128/JVI.80.1.192-200.2006 [DOI] [PMC free article] [PubMed] [Google Scholar]
- 18.Tibbetts SA, van Dyk LF, Speck SH, Virgin HW. 2002. Immune control of the number and reactivation phenotype of cells latently infected with a gammaherpesvirus. J. Virol. 76:7125–7132. 10.1128/JVI.76.14.7125-7132.2002 [DOI] [PMC free article] [PubMed] [Google Scholar]
- 19.Maloney NS, Thackray LB, Goel G, Hwang S, Duan E, Vachharajani P, Xavier R, Virgin HW. 2012. Essential cell-autonomous role for interferon (IFN) regulatory factor 1 in IFN-gamma-mediated inhibition of norovirus replication in macrophages. J. Virol. 86:12655–12664. 10.1128/JVI.01564-12 [DOI] [PMC free article] [PubMed] [Google Scholar]
- 20.Saito F, Ito T, Connett JM, Schaller MA, Carson WF, IV, Hogaboam CM, Rochford R, Kunkel SL. 27 June 2013. MHV68 latency modulates the host immune response to influenza A virus. Inflammation. 10.1007/s10753-013-9668-1 [DOI] [PMC free article] [PubMed] [Google Scholar]
- 21.Cho H, Shrestha B, Sen GC, Diamond MS. 2013. A role for Ifit2 in restricting West Nile virus infection in the brain. J. Virol. 87:8363–8371. 10.1128/JVI.01097-13 [DOI] [PMC free article] [PubMed] [Google Scholar]
- 22.Daffis S, Samuel MA, Keller BC, Gale M, Jr, Diamond MS. 2007. Cell-specific IRF-3 responses protect against West Nile virus infection by interferon-dependent and independent mechanisms. PLoS Pathog. 3:e106. 10.1371/journal.ppat.0030106 [DOI] [PMC free article] [PubMed] [Google Scholar]
- 23.Henig N, Avidan N, Mandel I, Staun-Ram E, Ginzburg E, Paperna T, Pinter RY, Miller A. 2013. Interferon-beta induces distinct gene expression response patterns in human monocytes versus T cells. PLoS One 8:e62366. 10.1371/journal.pone.0062366 [DOI] [PMC free article] [PubMed] [Google Scholar]
- 24.Presti RM, Popkin DL, Connick M, Paetzold S, Virgin HW. 2001. Novel cell type-specific antiviral mechanism of interferon gamma action in macrophages. J. Exp. Med. 193:483–496. 10.1084/jem.193.4.483 [DOI] [PMC free article] [PubMed] [Google Scholar]
- 25.Terenzi F, White C, Pal S, Williams BR, Sen GC. 2007. Tissue-specific and inducer-specific differential induction of ISG56 and ISG54 in mice. J. Virol. 81:8656–8665. 10.1128/JVI.00322-07 [DOI] [PMC free article] [PubMed] [Google Scholar]
- 26.Waddell SJ, Popper SJ, Rubins KH, Griffiths MJ, Brown PO, Levin M, Relman DA. 2010. Dissecting interferon-induced transcriptional programs in human peripheral blood cells. PLoS One 5:e9753. 10.1371/journal.pone.0009753 [DOI] [PMC free article] [PubMed] [Google Scholar]
- 27.Lees JR, Golumbek PT, Sim J, Dorsey D, Russell JH. 2008. Regional CNS responses to IFN-gamma determine lesion localization patterns during EAE pathogenesis. J. Exp. Med. 205:2633–2642. 10.1084/jem.20080155 [DOI] [PMC free article] [PubMed] [Google Scholar]
Associated Data
This section collects any data citations, data availability statements, or supplementary materials included in this article.