

Abstract
Human mannose-binding lectin (MBL) encoded by the MBL2 gene is a pattern recognition protein and has been associated with many infectious diseases, including malaria. We sought to investigate the contribution of functional MBL2 gene variations to Plasmodium falciparum malaria in well-defined cases and in matched controls. We resequenced the 8.7 kb of the entire MBL2 gene in 434 individuals clinically classified with malaria from regions of India where malaria is endemic. The study cohort included 176 patients with severe malaria, 101 patients with mild malaria, and 157 ethnically matched asymptomatic individuals. In addition, 830 individuals from 32 socially, linguistically, and geographically diverse endogamous populations of India were investigated for the distribution of functional MBL2 variants. The MBL2 −221C (X) allelic variant is associated with increased risk of malaria (mild malaria odds ratio [OR] = 1.9, corrected P value [PCorr] = 0.0036; severe malaria OR = 1.6, PCorr = 0.02). The exon1 variants MBL2*B (severe malaria OR = 2.1, PCorr = 0.036; mild versus severe malaria OR = 2.5, PCorr = 0.039) and MBL2*C (mild versus severe malaria OR = 5.4, PCorr = 0.045) increased the odds of having malaria. The exon1 MBL2*D/*B/*C variant increased the risk for severe malaria (OR = 3.4, PCorr = 0.000045). The frequencies of low MBL haplotypes were significantly higher in severe malaria (14.2%) compared to mild malaria (7.9%) and asymptomatic (3.8%). The MBL2*LYPA haplotypes confer protection, whereas MBL2*LXPA increases the malaria risk. Our findings in Indian populations demonstrate that MBL2 functional variants are strongly associated with malaria and infection severity.
INTRODUCTION
Malaria is one of the major causes of morbidity and mortality in tropical and subtropical countries, with an estimated 1.24 million mortality in 2010, mostly in Africa (1, 2). Human malaria is caused by the hematoprotozoan parasite of the genus Plasmodium with five different species (i.e., P. falciparum, P. vivax, P. ovale, P. malariae, and P. knowlesi) infecting humans. The pathogenesis of malaria is complex and multigenic, and the severity depends on the complex interplay between host genetic makeup, the parasite virulence, and its transmission dynamics, as well as the host immune responses (3, 4). Innate immune components mediate humoral immune responses to malaria by involving various complement proteins (5, 6). The innate immune system mainly relies on diverse pattern-recognizing receptor or soluble pathogen-recognizing molecules (PRMs) (7, 8) that recognize molecular motifs on the surfaces of microorganisms. Mannose-binding lectin (MBL) is a C-type soluble PRMs secreted by the liver as part of the acute-phase response and plays an important role in the recognition, initiation, regulation, and amplification of innate immune defense (9). The human MBL encoded by MBL2 mapped to 10q21.1 is a 32-kDa polypeptide, made up of 248 amino acids, having an N-terminal cysteine-rich segment, a collagen-like domain, a helical coiled-coil neck region, and a C-terminal glucoconjugate recognition domain (10). The structural subunit is a homotrimer of 96 kDa with a triple helix at its collagen-like domain. The functional MBL complex is a bouquet-like hexamer that circulates in serum (11, 12). MBL binds to an array of glycoconjugates on the surface of bacteria, yeasts, viruses, and parasitic protozoa, including P. falciparum (13), and activates the complement system. MBL interacts with MBL-associated serine proteases (MASP-1, -2, and -3 and Map19) and activates the membrane attack complex or complement-mediated phagocytosis (9, 11, 13) and also regulates the release of proinflammatory cytokines (14).
MBL2 genetic variants have been shown to associate with many infectious diseases such as malaria, leishmaniasis, leprosy, schistosomiasis, trypanosomiasis, HIV infection, and autoimmune disease (9, 14–21). Three single-nucleotide polymorphisms (SNPs) in promoters and a 5′ untranslated region [(−550:rs11003125: G>C, H/L), (−221:rs7096206 G>C, Y/X), and (+4:rs7095891 C>T, P/Q)] are functionally characterized to alter the transcriptional levels and hence the serum MBL levels (22–24). In particular, promoter alleles −550L, −221X, and +4P are associated with lower MBL serum levels (13), whereas three nonsynonymous structural variants in exon1 of MBL2 at codons 52, 54, and 57 of the collagen-like domain [(rs5030737: p.Arg52Cys:MBL2*D), (rs1800450: p.Gly54Asp:MBL2*B), and (rs1800451: p.Gly57Glu:MBL2*C)] independently interfere with the formation of higher MBP oligomers, leading to alterations in the functional activity of the protein and their circulating levels (11, 25–30). Such structural variant alleles have been designated as O haplotype, whereas the normal MBL2 allele has been designated as A haplotype (31). Further, these six SNPs (L/H, X/Y, P/Q, MBL2*D, MBL2*B, and MBL2*C) have been shown to be in linkage disequilibrium (LD) and form eight common “secretor haplotypes” (HYPA, LYPA, LYQA, LXPA, HYPD, LYPB, LYQC, and LYPD) (8, 25, 32). These secretor haplotypes not only regulate the serum levels of functional MBL molecule but also modulate the complement activation (22, 26, 27, 33, 34). MBL2*HYPA, LYQA, and LYPA are associated with high expression of MBL protein, whereas MBL2*LXPA, HYPD, LYPB, and LYQC are associated with low expression of MBL protein (32, 35) and modulate the MBL concentration in healthy individuals from undetectable levels to 1,000-fold (36, 37).
To the best of our knowledge, no studies to date have investigated the association of MBL2 functional variants with malarial susceptibility in Indian populations. We sought here to investigate the contribution of polymorphisms in the entire MBL2 gene with P. falciparum malaria infection in well-defined malaria cases and in matched controls. Moreover, Indian populations are unique in their origin and have developed unique variations due to isolation from rest of the world for thousands of years (38, 39). Since the entire Indian subcontinent represents an area where malaria is endemic, we extended our study to 32 socially, linguistically, and geographically diverse endogamous Indian populations who live in this region.
MATERIALS AND METHODS
Sampling.
A total of 1,264 individuals were included in the present study, including 434 ethnically matched case-control samples that included asymptomatic individuals (n = 157, mean age of 29.7 ± 19.62 years, and a male/female ratio of 2:65), individuals with mild malaria (n = 101, mean age of 30.24 ± 15.71 years, and a male/female ratio of 67:34), and patients with severe malaria (n = 176, mean age of 26.13 ± 12.32 years, and a male/female ratio of 103:73), as well as 830 individuals from 32 socially, linguistically, and geographically diverse endogamous populations of India. Patient samples were collected from those who were visiting or admitted with malaria for treatment at Ispat General Hospital, Rourkela, India, and Pt. Jawaharlal Nehru Memorial Medical College, Raipur, India. These are regions of India where P. falciparum is endemic. Microscopic results for all of the samples were revalidated for the presence of P. falciparum by PCR using species-specific primers; targeting conserved the 18S rRNA gene of the parasite (40). Samples were clinically characterized according to World Health Organization (WHO) 2010 guidelines (41) and as described previously (42, 43). WHO guidelines define severe malaria by the presence of one or more of the facultative signs of severe malaria: cerebral malaria, convulsions, hypoglycemia, hemoglobinuria, prostration, and respiratory distress (acidotic breathing). Laboratory findings included hypoglycemia (blood glucose level of <2.2 mmol/liter or <40 mg/dl), metabolic acidosis (plasma bicarbonate level, <15 mmol/liter), severe normocytic anemia (hemoglobin, <50 g/liter; packed cell volume, <15%), hyperparasitemia (>2% of infected red blood cells [RBCs] or 100,000 infected cells/μl in low-transmission areas or >5% of infected RBCs or 250,000 infected cells/μl in high-transmission areas), hyperlactatemia (lactate, >5 mmol/liter), renal impairment (serum creatinine, >265 μmol/liter), and a Blantyre coma score of ≤3. Similarly, mild malaria is defined by a parasitemia of 1,000 to 50,000/μl on admission, no schizontemia, circulating leukocytes containing malarial pigment at <50/μl, nonhomozygous for hemoglobin S, hemoglobin level at >80 g/liter, platelets at >50/nl, leukocytes at <12/nl, lactate at <3 mmol/liter, and blood glucose at >50 mg/dl. The asymptomatic control samples were collected from the same region where malaria is endemic and had no clinical signs of malaria irrespective of a few circulating parasites during sample collection. The clinical details of the patients included in the present study are given in Table 1.
TABLE 1.
Clinical characterization of patient samplesa
| Clinical parameterb | Severe malaria (n = 176) | Mild malaria (n = 101) |
|---|---|---|
| Parasitemia (% of infected RBCs) | 2.53 ± 1.16 | 1.08 ± 0.69 |
| Hemoglobin (g/dl) | 5.68 ± 1.37 | 8.93 ± 2.40 |
| Blood glucose (mg/dl) | 43.92 ± 13.81 | 80.74 ± 19.36 |
| Blantyre coma score | <3 | |
| No. of patients | ||
| CM | 71 | |
| ARF | 93 | |
| IVH | 83 | |
| CM+ARF | 44 | |
| CM+IVH | 51 | |
| ARF+IVH | 56 | |
| CM+ARF+IVH | 35 | |
| Death | 6 |
All patients with severe malaria were hospitalized due to complications related to one or more of the conditions listed in Table 1. Artesunate (2.4 mg/kg of body weight) was the main antimalarial treatment given intravenously, along with other supportive treatments, such as antibiotics, fluids, and ventilator support. Hemodialysis was performed, when required, in cases of renal failure. All mild malaria cases recovered with treatment uneventfully. All samples were checked for the HbS phenotype.
CM, cerebral malaria; ARF, acute renal failure; IVH, intravascular hemolysis.
Ethics statement.
The institutional ethical committees for the Centre for Cellular and Molecular Biology, Hyderabad, India, the Ispat General Hospital, Rourkela, Orissa, India, and the Pt. Jawaharlal Nehru Memorial Medical College, Raipur, Chhattisgarh, India, all approved the study. Informed written consent was obtained from each individual.
Gene sequencing.
Genomic DNA was isolated from whole blood according to a previously described protocol (44). The reference genomic sequences were obtained from the Ensembl database under Ensembl ID ENSG00000165471 (www.ensembl.org). PCR and sequencing primers were designed using NCBI Primer-BLAST (http://www.ncbi.nlm.nih.gov/tools/primer-blast), MacVector (MacVector, Inc., USA), and Amplify 3X software (http://engels.genetics.wisc.edu/amplify). We resequenced 8.7 kb of the MBL2 gene, which includes ∼1 kb each of the upstream and downstream regions. The target regions of MBL2 were PCR amplified using the primer pairs MBL2_F (5′-ATTACCCTGACCCAGGCCACTGTCTTCT-3′) and MBL2_R (5′-TACATAACATTGACCCCAAACCATAGCAAG-3′). PCR amplifications were performed on a GeneAmp 9700 (Applied Biosystems) and using a thermal cycler (Eppendorf) with a long-range PCR kit (Qiagen, Germany) according to the manufacturer's protocol. The thermal cycling parameters consisted of an initial denaturation at 93°C for 3 min, followed by 35 cycles of 45 s at 93°C, 25 s at 66°C, and 9 min at 68°C.
Only the upstream promoter and first exonic regions (∼1.4 kb) were resequenced for population samples. We PCR amplified the target region using two primer pairs—MBL2_UPE1_1F (5′-TCTGTGACTTTCCTCCATTATCTGT-3′)/MBL2_UPE1_1R (5′-TGGAAGACTATAAACATGCTTTCGG-3′) and MBL2_UPE1_2F (5′-CATTCTCATTCCCTAAGCTAACAGG-3′)/MBL2_UPE1_2R (5′-CTGGCAAGACAACTATTAGTCACAA-3′)—and an Emerald PCR master mix (TaKaRa). The thermal cycling parameters consisted of an initial denaturation at 95°C for 5 min, followed by 35 cycles of 30 s at 95°C, 25 s at 62°C, and 3 min at 72°C. PCR amplification was followed by Exo-SAP treatment (USB Corp., USA) according to the manufacturer's protocol. Exo-SAP-treated amplicons were sequenced directly by using a BigDye Terminator v3.1 cycle sequencing kit (Applied Biosystems) on an ABI 3730xl DNA analyzer. The 8.7-kb fragments were sequenced using 17 internal primers (see File S1 in the supplemental material). Sequence variations were identified by assembling DNA sequences with the reference sequence using AutoAssembler software (Applied Biosystems). Variations obtained were validated and reconfirmed in a subset of samples by resequencing and visual confirmation of electropherograms. Novel haplotypes were reconfirmed by subsequent resequencing.
Statistical analysis.
Risk estimates of severe and mild malaria were derived by comparison to the asymptomatic control group. We compared genotype, allele, and haplotype distributions for (i) asymptomatic versus mild-malaria groups, (ii) asymptomatic versus severe-malaria groups, and (iii) mild-malaria versus severe-malaria groups. The data were analyzed using Intercooled Stata v9.1, and the level of significance was set to a P value of <0.05. The allele and genotype frequencies were analyzed by simple allele/genotype counting and an expectation-maximum algorithm. The significance of deviations from Hardy-Weinberg (HW) equilibrium was tested using plink v1.7 (45). The allele and genotype distributions and tests of association were performed using plink. A two-tailed Fisher exact test was performed to determine the differences in allele frequencies and genotype distributions. Linkage disequilibrium (LD) analysis was performed by Haploview v4.2 (46). Bonferroni corrections were applied for multiple comparisons.
RESULTS
Sequencing of the complete MBL2 gene, along with ∼1 kb each of the upstream and downstream, led to the detection of a total of 30 polymorphic loci: 29 SNPs and a 6-bp deletion in the promoter region. We observed a novel SNP in the 3′ untranslated region at the genomic coordinate position g.54526021C>A. The genotype and allele distribution of all the variations among the case-control groups is summarized in File S2 in the supplemental material. All observed and investigated loci were in HW equilibrium. The detected variants after exon1 do not significantly contribute in any comparisons. The LD between the promoter and exon1 MBL2 variants in different groups is shown in Fig. 1. The promoter region of the asymptomatic group was in stronger LD compared to the cases of mild and severe malaria. The genotype and allele distributions observed in different groups and their respective associations are summarized in Table 2.
FIG 1.

LD pattern of MBL2 variants in asymptomatic, mild, and severe malaria groups. Empty squares indicate a high degree of LD (D′ = 1). Numbers indicate the D′ value expressed as a percentile.
TABLE 2.
MBL2 polymorphisms present in the promoter and first exonic region and comparison of genotypes and alleles among case-control groups
| SNP position | No. (%) of patients |
Genotype comparisona |
|||||||
|---|---|---|---|---|---|---|---|---|---|
| Asymptomatic (n = 157) | Mild malaria (n = 101) | Severe malaria (n = 176) | Asymptomatic vs mild |
Asymptomatic vs severe |
Mild vs severe |
||||
| OR (95% CI) | P | OR (95% CI) | P | OR (95% CI) | P | ||||
| rs11003125 (−550C/G) | |||||||||
| CC (LL) | 93 (59.2) | 66 (65.4) | 104 (59.1) | R | R | R | |||
| GC (HL) | 51 (32.5) | 29 (28.7) | 59 (33.5) | NS | NS | NS | |||
| GG (HH) | 13 (8.3) | 6 (5.9) | 13 (7.4) | NS | NS | NS | |||
| C (L) | 237 (75.5) | 161 (79.7) | 267 (75.9) | R | R | R | |||
| G (H) | 77 (24.5) | 41 (20.3) | 85 (24.1) | NS | NS | NS | |||
| rs7096006 (−221G/C) | |||||||||
| GG (YY) | 98 (62.4) | 40 (39.6) | 84 (47.7) | R | R | R | |||
| GC (YX) | 49 (31.2) | 51 (50.5) | 73 (41.5) | 2.55 (1.4–4.5) | 0.0021 | NS | NS | ||
| CC (XX) | 10 (6.4) | 10 (9.9) | 19 (10.8) | NS | NS | NS | |||
| G (Y) | 245 (78) | 131 (64.9) | 241 (68.5) | R | R | R | |||
| C (X) | 69 (22) | 71 (35.1) | 111 (31.5) | 1.9 (1.3–2.9) | 0.0036 | 1.6 (1.1–2.4) | 0.02 | NS | |
| rs7095891 (+4C/T) | |||||||||
| CC (PP) | 68 (43.3) | 56 (55.4) | 90 (51.1) | R | R | R | |||
| CT (PQ) | 69 (44) | 35 (34.6) | 77 (43.8) | NS | NS | NS | |||
| TT (QQ) | 20 (12.7) | 10 (9.9) | 9 (5.1) | NS | 0.34 (0.13–0.85) | 0.043 | NS | ||
| C (P) | 205 (65.3) | 147 (72.8) | 257 (73) | R | R | R | |||
| T (Q) | 109 (34.7) | 55 (27.2) | 95 (27) | NS | NS | NS | |||
| MBL2* exon1 (codon 52) C>T | |||||||||
| CC | 153 (97.5) | 98 (97) | 162 (92.1) | R | R | R | |||
| CT | 4 (2.6) | 3 (3) | 14 (8) | NS | NS | NS | |||
| TT | 0 (0) | 0 (0) | 0 (0) | NS | NS | NS | |||
| C | 310 (98.7) | 199 (98.5) | 338 (96) | R | R | R | |||
| T | 4 (1.3) | 3 (1.5) | 14 (4) | NS | NS | NS | |||
| MBL2* exon1 (codon 54) G>A | |||||||||
| GG | 140 (89.2) | 91 (90.1) | 138 (78.4) | R | R | R | |||
| GA | 16 (10.2) | 10 (9.9) | 36 (20.5) | NS | 2.3 (1.2–4.6) | 0.03 | NS | ||
| AA | 1 (0.6) | 0 (0) | 2 (1.1) | NS | NS | NS | |||
| G | 296 (94.3) | 192 (95) | 312 (88.6) | R | R | R | |||
| A | 18 (5.7) | 10 (5) | 40 (11.4) | NS | 2.1 (1.1–3.99) | 0.036 | 2.5 (1.2–5.6) | 0.039 | |
| MBL2* exon1 (codon 57) G>A | |||||||||
| GG | 144 (91.7) | 99 (98) | 159 (90.3) | R | R | R | |||
| GA | 13 (8.3) | 2 (2) | 16 (9.1) | NS | NS | NS | |||
| AA | 0 (0) | 0 (0) | 1 (0.6) | NS | NS | NS | |||
| G | 301 (95.9) | 200 (99) | 334 (94.9) | R | R | R | |||
| A | 13 (4.1) | 2 (1) | 18 (5.1) | NS | NS | 5.4 (1.3–48) | 0.045 | ||
| Mbl2* exon1 codons 52+54+57 | |||||||||
| AA | 125 (79.6) | 87 (86.1) | 108 (61.4) | R | R | R | |||
| AO | 31 (19.7) | 14 (13.9) | 65 (36.9) | NS | 2.4 (1.4–4.1) | 0.0012 | 3.7 (1.9–7.7) | 0.00008 | |
| OO | 1 (0.6) | 0 (0) | 3 (1.7) | NS | NS | NS | |||
| A | 281 (89.5) | 188 (93.1) | 281 (79.8) | R | R | R | |||
| O | 33 (10.5) | 14 (6.9) | 71 (20.2) | NS | 2.1 (1.4–3.5) | 0.0018 | 3.4 (1.8–6.7) | 0.000045 | |
NS, not significant; R, reference. P values were corrected for multiple comparisons by Bonferroni's method.
Odds of malaria (asymptomatic versus mild malaria).
The genotype frequencies of the promoter polymorphism −221G>C (rs7096206; MBL2:Y/X) differ significantly between the asymptomatic and mild-malaria groups (Table 2). The frequency of heterozygous genotype YX (−221GC) was significantly higher in subjects with mild malaria (P = 0.0021) compared to asymptomatic controls (after multiple correction) (Table 2 and Fig. 2). Similarly, the frequency of allele X was significantly higher in patients with mild malaria compared to asymptomatic controls (asymptomatic versus mild, P = 0.0036; Table 2 and Fig. 2). These finding suggests that the −221GC heterozygous bears an increased risk toward mild malaria. None of the other variations were associated with mild malaria (Table 2 and see File S2 in the supplemental material).
FIG 2.
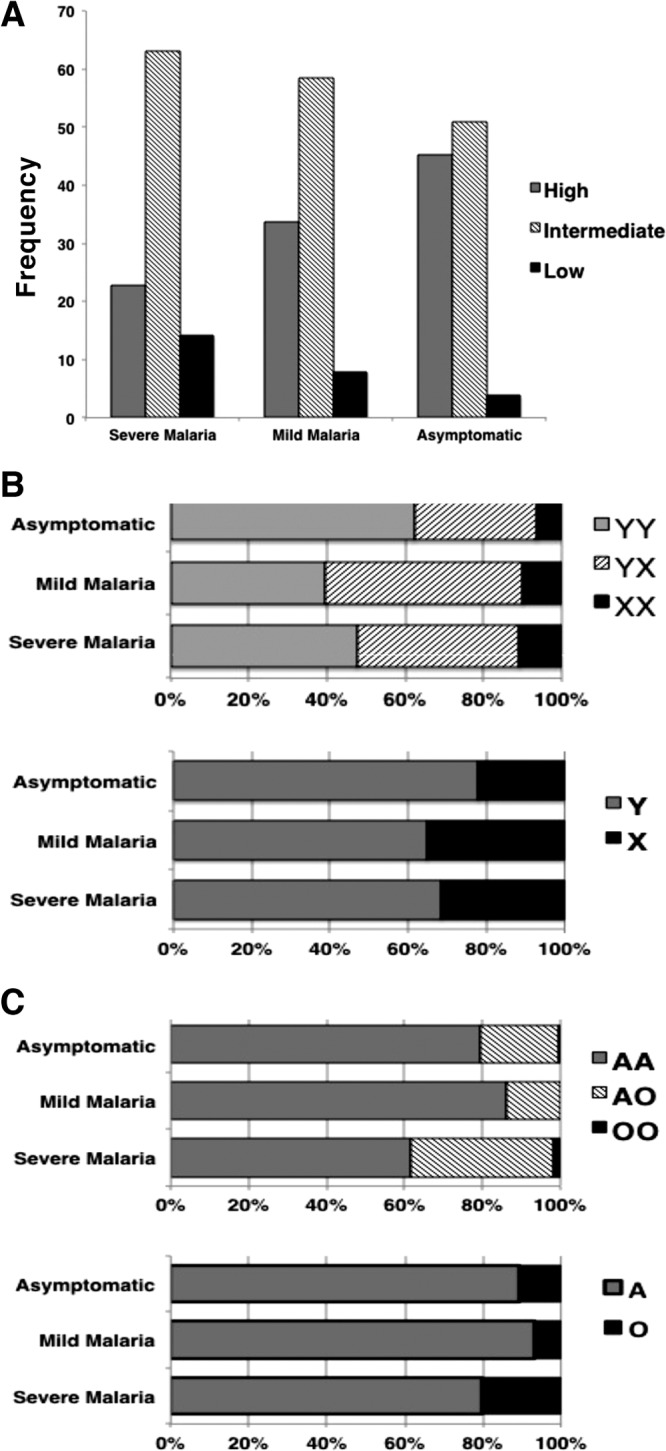
Distribution of MBL2 variants in various case-control groups. (A to C) Distribution of high-, intermediate-, and low-serum MBL2 haplotypes (A), XY variants (B), and exon1 structural variants A and O allele (C) [(−221:rs7096206 G>C, Y/X), (rs5030737: p.Arg52Cys:MBL2*D), (rs1800450: p.Gly54Asp:MBL2*B), and (rs1800451: p.Gly57Glu:MBL2*C)]. Exon1 structural variant alleles (D, B, and C) have been designated as the O haplotype, whereas the normal MBL2 allele is designated as A.
Earlier studies demonstrated that the MBL2 serum levels are modulated by −221 G/C variant and three structural variants of exon1. Therefore, we studied the genotypes of variants in promoter (−221G/C) and exon1 (codons 52 [MBL2*D], 54 [MBL2*B], and 57 [MBL2*C]) together and investigated for their influence in serum MBL levels (high [YA/YA], intermediate [YA/YO, XA/XA, and XA/YA], and low [YO/YO, XA/YO, and XA/XO] MBL producers). We observed that the diplotype YA/YO was significantly low in frequency in the group with mild malaria (P = 0.033) compared to asymptomatic individuals (Table 3 and Fig. 2).
TABLE 3.
Distribution of combined genotypes for variants at −221G/C and exon1 at codons 52 (MBL2*D), 54 (MBL2*B), and 57 (MBL2*C)
| Promoter (-221) + exon1 | No. (%) of patients |
Genotype comparisona |
|||||||
|---|---|---|---|---|---|---|---|---|---|
| Asymptomatic vs mild |
Asymptomatic vs severe |
Mild vs severe |
|||||||
| Asymptomatic (n = 157) | Mild malaria (n = 101) | Severe malaria (n = 176) | OR (95% CI) | P | OR (95% CI) | P | OR (95% CI) | P | |
| YA/YA | 71 (45.22) | 34 (33.66) | 40 (22.73) | NS | 0.35 (0.21–0.58) | 0.00003 | NS | ||
| YA/YO | 26 (16.56) | 6 (5.94) | 43 (24.43) | 0.3 (0.1–0.8) | 0.033 | NS | 5.1 (2.04–15.2) | 0.0003 | |
| YO/YO | 1 (0.64) | 0 | 1 (0.57) | NA | NS | NA | |||
| XA/YA | 44 (28.02) | 43 (42.57) | 50 (28.41) | NS | NS | 0.53 (0.31–0.92) | 0.05 | ||
| XA/XA | 10 (6.37) | 10 (9.90) | 18 (10.23) | NS | NS | NS | |||
| XA/YO | 5 (3.18) | 8 (7.92) | 21 (11.93) | NS | 4.1 (1.4–14.3) | 0.01 | NS | ||
| XA/XO | 0 | 0 | 1 (0.57) | NA | NA | NA | |||
| XO/YO | 0 | 0 | 2 (1.13) | NA | NA | NA | |||
NS, not significant; NA, not applicable. P values were corrected for multiple comparisons by Bonferroni's method.
The reconstructed MBL2 secretor haplotype distributions and their comparison among case-control groups are summarized in Table 4. Apart from the eight well-known MBL2 secretor haplotypes, we observed four novel MBL2 secretor haplotypes: MBL2*HYQA, MBL2*HYQC, MBL2*LXPB, and MBL2*LYQB. We observed that the low-serum MBL2 haplotype MBL2*LXPA was significantly more frequent in the group with mild malaria compared to the asymptomatic group (P = 0.0045) (Table 4). None of the other reconstructed haplotypes contributed significantly to association.
TABLE 4.
Distribution and comparison of MBL2 secretor haplotypes in case and control groups
| Haplotype or comparisona | No. (%) of patients |
Genotype comparisonb |
|||||||
|---|---|---|---|---|---|---|---|---|---|
| Asymptomatic (n = 314) | Mild malaria (n = 202) | Severe malaria (n = 352) | Asymptomatic vs mild |
Asymptomatic vs severe |
Mild vs severe |
||||
| OR (95% CI) | P | OR (95% CI) | P | OR (95% CI) | P | ||||
| High MBL secretor haplotypes | |||||||||
| MBL2*HYPA | 66 (21.02) | 34 (16.83) | 70 (19.88) | NS | NS | NS | |||
| MBL2*LYPA | 48 (15.28) | 31 (15.34) | 29 (8.23) | NS | 0.5 (0.3–0.8) | 0.015 | 0.5 (0.27–0.85) | 0.02 | |
| MBL2*LYQA | 94 (29.93) | 51 (25.24) | 76 (21.59) | NS | 0.6 (0.45–0.9) | 0.048 | NS | ||
| MBL2*HYQA† | 2 (0.66) | 3 (1.48) | 0 | NS | NA | NA | |||
| Low MBL secretor haplotypes | |||||||||
| MBL2*LXPA | 68 (21.65) | 70 (34.65) | 106 (30.11) | 1.9 (0.3–2.9) | 0.0045 | 1.56 (1.1–2.2) | 0.042 | NS | |
| MBL2*LYPB | 18 (5.73) | 9 (4.45) | 32 (9.09) | NS | NS | NS | |||
| MBL2*LYQC† | 8 (2.55) | 0 | 12 (3.41) | NA | NS | NA | |||
| MBL2*HYPD | 4 (1.27) | 2 (0.99) | 8 (2.27) | NS | NS | NS | |||
| MBL2*HYQC | 6 (1.91) | 2 (0.99) | 5 (1.42) | NS | NS | NS | |||
| MBL2*LYPD | 0 | 0 | 6 (1.70) | NA | NA | NA | |||
| MBL2*LXPB† | 0 | 0 | 4 (1.13) | NA | NA | NA | |||
| MBL2*LYQB† | 0 | 0 | 4 (1.13) | NA | NA | NA | |||
| High vs low | |||||||||
| High‡ | 210 (66.88) | 119 (58.91) | 175 (49.71) | 0.075 | 0.5 (0.45–0.68) | 0.00002 | NS | ||
| Low§ | 104 (33.12) | 83 (41.09) | 177 (50.28) | 0.075 | 2 (1.5–2.8) | 0.00002 | NS | ||
†, Novel secretor haplotypes observed in this study; ‡, high expression of MBL2* (HYPA + LYQA + LYPA + HYQA); §, low expression of MBL2* (LXPA + LYPB + LYQC + HYPD + LYPD + HYQC + LXPB + LYQB).
NS, not significant; NA, not applicable. P values were corrected for multiple comparisons by Bonferroni's method.
Odds of severe malaria (asymptomatic versus severe malaria).
Although the frequency of the heterozygous genotype −221G>C (Y/X) was significantly higher in subjects with mild malaria (P = 0.0021), we did not determine its contribution to severe malaria compared to the asymptomatic control (after multiple correction) (Table 2). However, the frequency of allele −221X was significantly higher in patients with severe malaria compared to asymptomatic controls (P = 0.02) (Table 2).
The distribution of the structural variant MBL2*B (rs1800451: codon 54, G>A) differed significantly between asymptomatic and severe malaria (Table 2). The heterozygous genotype GA (MBL2*AB) was observed significantly at high levels (P = 0.03) compared to asymptomatic controls (Table 2). Further, the frequency of minor allele A (MBL2*B) was significantly greater in cases of severe malaria (P = 0.036) (after multiple corrections) (Table 2). These findings suggest that the structural variant MBL2*B, which interferes with oligomerization and hence the low level of functional MBL, is a risk factor for P. falciparum malaria (Table 2). Further, when we grouped all three structural variants of exon1 (MBL2*D/B/C), we observed a significantly higher frequency of heterozygous genotype MBL2*AO (P = 0.0021) compared to the control group. We also observed similar trends in allelic distribution. The frequency of allele MBL2*O was significantly higher in the group with severe malaria (P = 0.0018) compared to the asymptomatic controls (Table 2).
Diplotype analysis shows that the frequency of the high-MBL-producer diplotype (YA/YA) was significantly low (P = 0.00003) in the severe-malaria group compared to asymptomatic controls (Table 3 and Fig. 2). Similarly, the high MBL2 secretor haplotypes MBL2*LYPA and MBL2*LYQA were significantly less frequent in the severe-malaria group compared to the asymptomatic group (MBL2*LYPA [P = 0.015] and MBL2*LYQA [P = 0.048) (Table 4). Further, we grouped the MBL2 haplotypes into two groups: the secretor haplotypes that lead to a high level of functional MBL (HYPA + LYQA + LYPA + HYQA) made up one group, and those that lead to a low level (LXPA + LYPB + LYQC + HYPD + LYPD + HYQC + LXPB + LYQB) made up another. We observed a significant difference between asymptomatic subjects and those with severe malaria. The high-MBL-producing haplotypes were significantly less frequent (P = 0.00002), while the low-serum-MBL haplotypes were significantly more frequent (P = 0.00002) in the group with severe malaria compared to the asymptomatic controls (Table 4).
Odds of malaria progression (mild malaria versus severe malaria).
The exon1 structural variants (MBL2*D, MBL2*B, and MBL2*C) differ significantly between mild and severe malaria cases. We observed that the frequency of the minor allele A at codon 54 (MBL2*B) was higher in severe malaria (P = 0.039) compared to mild malaria (Table 2). Similarly, the frequency of minor allele A at codon 57 (MBL2*C) was significantly higher in severe-malaria cases than in cases of mild malaria (P = 0.045) (Table 2). The combined genotypes of three structural variants of exon1 show that the allele O (MBL2*D, MBL2*B, and MBL2*C) was significantly more frequent in individuals with severe malaria (P = 0.000045) compared to those with mild malaria (Table 2).
In line to this observation, the frequency of the high-serum-MBL secretor haplotype MBL2*LYPA was lower in cases of severe malaria than in the mild-malaria group (P = 0.02) (Table 4). This suggests that the exon1 structural variant that affects the oligomerization increases the risk of severe malaria.
MBL2 genotype and haplotype distribution in ethnic populations of India.
To characterize MBL2 polymorphisms in different ethnic populations of India, we extended our study to 830 individuals from 32 socially, linguistically, and geographically diverse endogamous populations of India. The population details and genotype distribution of functional variants (−550C>G, −221G>C, +4C>T, MBL2*D, MBL2*B, and MBL2*C) that affects serum MBL levels are summarized Table 5. The frequency of low MBL2 secretor haplotypes varies significantly between Indian populations (low, 0 to 62.5%) (Fig. 3). We did not observe low-MBL2 haplotypes in two of the investigated tribal populations (Subba and Gond), whereas an ancestral tribal population Juang revealed a high (62.5%) frequency. However, the distribution of the AO and XY diplotypes showed that the high prevalence of the low-MBL2 haplotype in Juang is mainly due to promoter variant (X, 62.50%) and not because of structural variants (O, 17.19%) (Fig. 3). Similarly, Subba tribes had high frequencies of A (78.13%) and Y (68.75%) alleles, and the resulting major genotype YA (Fig. 3). Further, the MBL2 exon1 variant MBL2*B is the prevalent form of structural variant in most of the Indian populations (Fig. 3).
TABLE 5.
Geographical origin, ethnicity, linguistic affiliation, and genotype distributions of populations in the present study
| Serial no. | Population | Social designation | Language family | State | Indian regiona | Sample size | Genotype distributionb |
|||||
|---|---|---|---|---|---|---|---|---|---|---|---|---|
| −550C>G |
−221G>C |
+4C>T |
MBL2*D |
MBL2*B |
MBL2*C |
|||||||
| CC/CG/GG | GG/CG/CC | CC/CT/TT | CC/CT/TT | GG/AG/AA | GG/AG/AA | |||||||
| 1 | Thapa | Caste | Tibeto-Burman | Nepal | Nepal | 32 | 12:18:02 | 16:16:00 | 15:14:03 | 31:01:00 | 24:08:00 | 30:02:00 |
| 2 | Bharia | Tribe | Dravidian | Madhya Pradesh | CI | 31 | 18:12:01 | 6:20:05 | 20:11:00 | 31:00:00 | 22:09:00 | 30:01:00 |
| 3 | Kol | Tribe | Indo-European | Madhya Pradesh | CI | 29 | 15:12:02 | 7:12:10 | 22:07:00 | 27:02:00 | 24:05:00 | 29:00:00 |
| 4 | Kurmi | Caste | Indo-European | Madhya Pradesh | CI | 26 | 10:15:01 | 16:09:01 | 15:08:03 | 25:01:00 | 19:07:00 | 24:02:00 |
| 5 | Kanyakubja | Caste | Indo-European | Madhya Pradesh | CI | 28 | 19:08:01 | 13:14:01 | 14:06:08 | 28:00:00 | 24:04:00 | 28:00:00 |
| 6 | Juang | ATPc | Austro-Asiatic | Orissa | CI | 32 | 23:09:00 | 2:20:10 | 12:18:02 | 31:01:00 | 23:09:00 | 29:03:00 |
| 7 | Maria | Tribe | Austro-Asiatic | Orissa | CI | 80 | 41:36:03 | 42:31:07 | 32:38:10 | 76:04:00 | 61:18:01 | 71:09:00 |
| 8 | Bho | Tribe | Indo-European | Uttaranchal | NI | 24 | 15:07:02 | 13:10:01 | 7:15:02 | 24:00:00 | 20:04:00 | 20:04:00 |
| 9 | Oraon | Tribe | Indo-European | Jharkhand | CI | 28 | 12:13:03 | 15:10:03 | 14:11:03 | 27:01:00 | 21:06:01 | 26:02:00 |
| 10 | Munda | Tribe | Austro-Asiatic | Jharkhand | CI | 30 | 15:13:02 | 12:15:03 | 15:13:02 | 30:00:00 | 24:06:00 | 28:02:00 |
| 11 | Santhal | Tribe | Austro-Asiatic | Jharkhand | CI | 41 | 23:15:03 | 17:17:07 | 20:14:07 | 41:00:00 | 33:08:00 | 37:04:00 |
| 12 | Rajgond | Tribe | Indo-European | Madhya Pradesh | CI | 26 | 5:14:07 | 17:09:00 | 13:12:01 | 20:06:00 | 19:07:00 | 22:04:00 |
| 13 | Sonker | Caste | Indo-European | Madhya Pradesh | CI | 27 | 11:14:02 | 18:07:02 | 9:14:04 | 25:02:00 | 19:08:00 | 26:01:00 |
| 14 | Thoti | Caste | Dravidian | Andhra Pradesh | AP | 27 | 12:13:02 | 17:07:03 | 15:09:03 | 27:00:00 | 21:05:01 | 24:03:00 |
| 15 | Banjara | Nomadic | Indo-European | Rajasthan | WI | 35 | 18:13:04 | 24:09:02 | 17:17:01 | 34:01:00 | 25:10:00 | 34:01:00 |
| 16 | Bhil | Tribe | Indo-European | Gujarat | WI | 21 | 12:07:02 | 12:06:03 | 11:10:00 | 21:00:00 | 16:04:01 | 21:00:00 |
| 17 | Changapa | Tribe | Tibeto-Burman | North East | NE | 20 | 7:06:07 | 11:05:04 | 10:10:00 | 16:04:00 | 16:04:00 | 20:00:00 |
| 18 | ChakhesNaga | Tribe | Tibeto-Burman | Nagaland | NE | 18 | 11:06:01 | 14:03:01 | 12:06:00 | 18:00:00 | 12:06:00 | 18:00:00 |
| 19 | Mizo | ATP | Tibeto-Burman | Mizoram | NE | 20 | 7:12:01 | 13:06:01 | 9:10:01 | 20:00:00 | 13:07:00 | 19:01:00 |
| 20 | Aonaga | ATP | Tibeto-Burman | Nagaland | NE | 19 | 3:12:04 | 12:06:01 | 17:02:00 | 19:00:00 | 15:04:00 | 19:00:00 |
| 21 | Nagaseema | Tribe | Tibeto-Burman | Nagaland | NE | 24 | 7:12:05 | 12:10:02 | 10:11:03 | 24:00:00 | 18:06:00 | 23:01:00 |
| 22 | Nyshi | Tribe | Tibeto-Burman | Arunachal Pradesh | NE | 17 | 0:10:07 | 12:03:02 | 11:04:02 | 15:02:00 | 13:04:00 | 15:02:00 |
| 23 | Bhootia | Tribe | Tibeto-Burman | Sikkim | NE | 20 | 2:06:12 | 16:04:00 | 15:05:00 | 16:04:00 | 15:05:00 | 20:00:00 |
| 24 | Khasi | Tribe | Tibeto-Burman | Meghalaya | NE | 22 | 3:13:06 | 15:07:00 | 13:08:01 | 21:01:00 | 15:07:00 | 22:00:00 |
| 25 | Puma | Tribe | Tibeto-Burman | Sikkim | NE | 15 | 7:04:04 | 10:05:00 | 15:00:00 | 15:00:00 | 6:07:02 | 15:00:00 |
| 26 | Sherpa | Tribe | Tibeto-Burman | Sikkim | NE | 21 | 6:12:03 | 16:05:00 | 8:12:01 | 21:00:00 | 16:05:00 | 14:06:01 |
| 27 | Subba | Tribe | Tibeto-Burman | Darjeeling/WB | NE | 16 | 0:12:04 | 10:06:00 | 12:04:00 | 15:01:00 | 14:02:00 | 12:04:00 |
| 28 | Birhor | ATP | Austro-Asiatic | Jharkhand | CI | 31 | 13:10:08 | 21:07:03 | 16:10:05 | 31:00:00 | 25:05:01 | 18:10:03 |
| 29 | Lambadi | Tribe | Dravidian | Andhra Pradesh | AP | 19 | 8:09:02 | 13:04:02 | 11:06:02 | 9:00:00 | 11:07:01 | 11:06:02 |
| 30 | Kabutariyan | Caste | Indo-European | Uttar Pradesh | NI | 28 | 15:10:03 | 15:11:02 | 15:12:01 | 28:00:00 | 24:04:00 | 26:02:00 |
| 31 | Gond | Tribe | Dravidian | Chhattisgarh | CI | 10 | 3:04:03 | 6:03:01 | 5:04:01 | 10:00:00 | 10:00:00 | 10:00:00 |
| 32 | G.Andamanese | ATP | Andamanese | Andaman | Andaman | 13 | 1:02:10 | 6:05:02 | 13:00:00 | 11:02:00 | 13:00:00 | 13:00:00 |
| Total | 830 | |||||||||||
AP, Andhra Pradesh; CI, central India; NI, north India; NE, northeast India; WI, west India; WB, west Bengal.
Genotype distributions were in HW equilibrium at 0.05 level.
ATP, ancestral primitive tribe.
FIG 3.

Distribution of MBL2 variants in 32 Indian populations across India. (A to D) Distribution of MBL2 haplotypes (A), AO variants (B), XY variants (C), and exon1 structural variants MBL2*B, MBL2*C and MBL2*D (D) [(−221:rs7096206 G>C, Y/X), (rs5030737: p.Arg52Cys:MBL2*D), (rs1800450: p.Gly54Asp:MBL2*B) and (rs1800451: p.Gly57Glu:MBL2*C)]. Structural variant alleles (D, B, and C) have been designated as O haplotype, whereas the normal MBL2 allele is designated as A.
DISCUSSION
Mannose-binding lectin (MBL) is a soluble innate immune pathogen recognition protein that plays a vital role in defense during the early phase of infection (9). Several studies have shown that MBL2 genetic variants regulate the MBL serum levels in different autoimmune diseases and infectious diseases, such as malaria, leishmaniasis, leprosy, tuberculosis, schistosomiasis, trypanosomiasis, and HIV infection (9, 14–21). The clinical significance of MBL2 variants varies with the disease context in different world populations (21, 47–49).
We observed significant differences in genotype and allele frequencies among asymptomatic subjects and in patients with mild and severe malaria. The genotype and allele distribution of promoter polymorphism −221XY differed significantly between the asymptomatic and mild-malaria groups, as well as between the asymptomatic and severe-malaria groups, whereas the exon1 structural variants (MBL2*B) were associated with severe malaria only. Individuals homozygous for structural variants in exon1 (MBL2*B, MBL2*C, and MBL2*D) were rare. None of the other variations were associated with either mild or severe malaria. Earlier studies have documented the role of other functional MBL2 promoter polymorphism (−550HL) in several diseases (21, 50); however, we did not found any statistical significance in our study. We observed that the −221C(X) allele was found at significantly higher frequencies in malaria cases, which increases the risk for clinical malaria. We also observed that the structural MBL2 variants were significantly less frequent in asymptomatic subjects but higher in the severe-malaria group, showing that individuals with structural MBL2 variants are at higher risk for severe malaria. Thus, our findings suggest that MBL2 variants that decrease the plasma level of the functional MBL protein or encode dysfunctional proteins make their carriers susceptible to malaria. This result is in accordance with previous studies, which demonstrated that the low-serum-MBL genotype is a risk factor for malarial infection (5, 9, 32, 51); however, a study performed in Gambia (47) failed to replicate this association. The serum level of functional MBL is mainly regulated by the promoter polymorphism −221XY and exon1 structural variant A/O (O: MBL2*D, MBL2*B, and MBL2*C). We found all three structural variants in our study. The genotype YA/YA was found to be significantly less common in the severe-malaria group than in asymptomatic controls, whereas genotype XA/YO was more common. We also observed that the genotype YA/YO was significantly less common in mild-malaria cases compared to asymptomatic subjects. These findings indicate that a low-serum-MBL diplotype might be a risk factor for severe malaria while the intermediate-serum-MBL diplotype might be a risk factor for mild malaria.
Several studies have shown the effects of MBL2 secretor haplotypes in disease association studies (9, 21, 32). Our investigation of the MBL2 secretor haplotype also showed significant differences in haplotype carriages between various case-control groups. Stratification of our cohort based on MBL2 haplotypes showed that the haplotypes MBL2*LYPA and MBL2*LYQA were significantly less common in the severe-malaria group, whereas haplotype MBL2*LXPA was significantly less common in the mild-malaria group. This again elucidates that the individuals with the high-serum-MBL haplotype have low risk for malaria. In addition to the eight common haplotypes reported previously (9), we observed here four novel MBL2 secretor haplotypes, MBL2*HYQA, MBL2*HYQC, MBL2*LXPB, and MBL2*LYQB, although at much lower frequencies that were independently reconfirmed by subsequent sequencing procedures. The exceptional uncharacterized secretor haplotypes MBL2*LYQB and MBL2*HXPA have also been reported in Bakola Pygmy and Moroccan Berber populations, respectively (52).
Apart from structural variants, we did not observe any other variations that were statistically significant between the severe- and mild-malaria groups. The comparison shows that the structural variants are over-represented in severe cases, while the normal variants are over-represented in the mild-malaria group, suggesting that the severity of P. falciparum malaria is inversely proportional to the serum level of functional MBL.
In the present study, among 32 Indian populations across India, we observed that the frequency of MBL2 haplotypes, which leads to low level of serum MBL, varies drastically from 0% in Subba and Gond to 62.5% in an ancestral tribal population in Juang. The prevalence of low-MBL haplotypes in Juang is mainly due to the prevalence of X and is not due to structural variants. Further, high- and low-serum-MBL haplotypes are not restricted to a particular geographic region. In the same geographic region, populations show varied prevalences of MBL2 haplotypes and, hence, may show different levels of susceptibility to malaria and other infectious diseases. These findings are in agreement with the genetic structure of Indian populations, who maintain their unique genetic architecture, mainly due to endogamy marriage practice over the last several thousand years. This has been well supported by our earlier studies with mtDNA, Y chromosome, and autosomal genetic markers (38, 39, 42, 44). We also observed all three structural variants in exon1 (MBL2*D, MBL2*B, and MBL2*C) in Indian populations. In addition, the MBL2*D/B/C (>20%) and MBL2*Y (>75%) variants were observed at higher frequencies in Lambadi, Rajgond, Birhor, Subba, Sherpa, Bhootia, and Puma populations, suggesting a possible selective heterozygous advantage. MBL2*B is the most prevalent structural variant in Indian populations, in contrast to MBL2*C in African populations.
We investigated whether MBL2 functional variants can modulate or alter serum MBL levels; hence, individuals harboring these variants, secretor, or low or high producers have either increased or decreased risk per se. In conclusion, functional MBL2 genetic variants are significantly associated with malaria pathogenesis in Indian populations. To the best of our knowledge, this the first study of its kind, in which we studied the MBL2 variations in detail in diverse Indian populations. An individual with mild malaria can progress into a more severe form and so this is true for severe to mild malaria or asymptomatic to mild malaria. Therefore, further studies on ethnically different populations, as well as larger case-control and cohort studies, are strongly recommended in order to obtain better estimates of malarial risks associated with the MBL2 polymorphism.
Supplementary Material
ACKNOWLEDGMENTS
We thank everyone who provided blood samples and consent for genetic analysis. We also thank A. G. Reddy, CSIR–Centre for Cellular and Molecular Biology, Hyderabad, India, for help and support.
A.N.J. and K.T. planned and designed the experiment. S.S.P. and P.K.P. collected patient blood samples and carried out clinical assessments. A.N.J. analyzed the results. A.N.J., P.S., and V.K.S. prepared samples and performed experiments. T.P.V. rechecked the statistical analysis. A.N.J. prepared the manuscript. A.N.J., P.G.K., L.S., and K.T. prepared the final manuscript. L.S. and K.T. provided all of the materials and facilities and supervised the entire study.
This study was supported by a Council of Scientific and Industrial Research (CSIR), New Delhi, India, grant (BSC0121) to K.T., by a Senior Research Fellowship to A.N.J., by a Bhatnagar Fellowship (OLP0011) to L.S., and by a UK-India Education and Research Initiative grant (RG-4772) to K.T.
The authors declare that they have no conflict of interest or competing/financial interests.
Footnotes
Published ahead of print 14 October 2013
Supplemental material for this article may be found at http://dx.doi.org/10.1128/IAI.01041-13.
REFERENCES
- 1.Murray CJ, Rosenfeld LC, Lim SS, Andrews KG, Foreman KJ, Haring D, Fullman N, Naghavi M, Lozano R, Lopez AD. 2012. Global malaria mortality between 1980 and 2010: a systematic analysis. Lancet 379:413–431. 10.1016/S0140-6736(12)60034-8 [DOI] [PubMed] [Google Scholar]
- 2.Eid NA, Hussein AA, Elzein AM, Mohamed HS, Rockett KA, Kwiatkowski DP, Ibrahim ME. 2010. Candidate malaria susceptibility/protective SNPs in hospital and population-based studies: the effect of substructuring. Malar. J. 9:119. 10.1186/1475-2875-9-119 [DOI] [PMC free article] [PubMed] [Google Scholar]
- 3.Schuldt K, Kretz CC, Timmann C, Sievertsen J, Ehmen C, Esser C, Loag W, Ansong D, Dering C, Evans J, Ziegler A, May J, Krammer PH, Agbenyega T, Horstmann RD. 2011. A −436C>A polymorphism in the human FAS gene promoter associated with severe childhood malaria. PLoS Genet. 7:e1002066. 10.1371/journal.pgen.1002066 [DOI] [PMC free article] [PubMed] [Google Scholar]
- 4.Zakeri S, Pirahmadi S, Mehrizi AA, Djadid ND. 2011. Genetic variation of TLR-4, TLR-9, and TIRAP genes in Iranian malaria patients. Malar. J. 10:77. 10.1186/1475-2875-10-77 [DOI] [PMC free article] [PubMed] [Google Scholar]
- 5.Luty AJ, Kun JF, Kremsner PG. 1998. Mannose-binding lectin plasma levels and gene polymorphisms in Plasmodium falciparum malaria. J. Infect. Dis. 178:1221–1224. 10.1086/515690 [DOI] [PubMed] [Google Scholar]
- 6.Ouf EA, Ojurongbe O, Akindele AA, Sina-Agbaje OR, Van Tong H, Adeyeba AO, Kremsner PG, Kun JF, Velavan T. 2012. Ficolin-2 levels and FCN2 genetic polymorphisms as a susceptibility factor in schistosomiasis. J. Infect. Dis. 206:562–570. 10.1093/infdis/jis396 [DOI] [PubMed] [Google Scholar]
- 7.Barreiro LB, Ben-Ali M, Quach H, Laval G, Patin E, Pickrell JK, Bouchier C, Tichit M, Neyrolles O, Gicquel B, Kidd JR, Kidd KK, Alcais A, Ragimbeau J, Pellegrini S, Abel L, Casanova JL, Quintana-Murci L. 2009. Evolutionary dynamics of human Toll-like receptors and their different contributions to host defense. PLoS Genet. 5:e1000562. 10.1371/journal.pgen.1000562 [DOI] [PMC free article] [PubMed] [Google Scholar]
- 8.Thiel S, Frederiksen PD, Jensenius JC. 2006. Clinical manifestations of mannan-binding lectin deficiency. Mol. Immunol. 43:86–96. 10.1016/j.molimm.2005.06.018 [DOI] [PMC free article] [PubMed] [Google Scholar]
- 9.Boldt AB, Luty A, Grobusch MP, Dietz K, Dzeing A, Kombila M, Kremsner PG, Kun JF. 2006. Association of a new mannose-binding lectin variant with severe malaria in Gabonese children. Genes Immun. 7:393–400. 10.1038/sj.gene.6364312 [DOI] [PubMed] [Google Scholar]
- 10.Ezekowitz RA, Stahl PD. 1988. The structure and function of vertebrate mannose lectin-like proteins. J. Cell Sci. 1988(Suppl 9):121–133 [DOI] [PubMed] [Google Scholar]
- 11.Larsen F, Madsen HO, Sim RB, Koch C, Garred P. 2004. Disease-associated mutations in human mannose-binding lectin compromise oligomerization and activity of the final protein. J. Biol. Chem. 279:21302–21311. 10.1074/jbc.M400520200 [DOI] [PubMed] [Google Scholar]
- 12.Taylor ME, Brickell PM, Craig RK, Summerfield JA. 1989. Structure and evolutionary origin of the gene encoding a human serum mannose-binding protein. Biochem. J. 262:763–771 [DOI] [PMC free article] [PubMed] [Google Scholar]
- 13.Klabunde J, Uhlemann AC, Tebo AE, Kimmel J, Schwarz RT, Kremsner PG, Kun JF. 2002. Recognition of Plasmodium falciparum proteins by mannan-binding lectin, a component of the human innate immune system. Parasitol. Res. 88:113–117. 10.1007/s00436-001-0518-y [DOI] [PubMed] [Google Scholar]
- 14.Jack DL, Turner MW. 2003. Antimicrobial activities of mannose-binding lectin. Biochem. Soc. Trans. 31:753–757 [DOI] [PubMed] [Google Scholar]
- 15.Alonso DP, Ferreira AF, Ribolla PE, de Miranda Santos IK, do Socorro Pires e Cruz M, Aecio de Carvalho F, Abatepaulo AR, Lamounier Costa D, Werneck GL, Farias TJ, Soares MJ, Costa CH. 2007. Genotypes of the mannan-binding lectin gene and susceptibility to visceral leishmaniasis and clinical complications. J. Infect. Dis. 195:1212–1217. 10.1086/512683 [DOI] [PubMed] [Google Scholar]
- 16.Garred P, Richter C, Andersen AB, Madsen HO, Mtoni I, Svejgaard A, Shao J. 1997. Mannan-binding lectin in the sub-Saharan HIV and tuberculosis epidemics. Scand. J. Immunol. 46:204–208. 10.1046/j.1365-3083.1997.d01-111.x [DOI] [PubMed] [Google Scholar]
- 17.Klabunde J, Berger J, Jensenius JC, Klinkert MQ, Zelck UE, Kremsner PG, Kun JF. 2000. Schistosoma mansoni: adhesion of mannan-binding lectin to surface glycoproteins of cercariae and adult worms. Exp. Parasitol. 95:231–239. 10.1006/expr.2000.4539 [DOI] [PubMed] [Google Scholar]
- 18.Kelly P, Jack DL, Naeem A, Mandanda B, Pollok RC, Klein NJ, Turner MW, Farthing MJ. 2000. Mannose-binding lectin is a component of innate mucosal defense against Cryptosporidium parvum in AIDS. Gastroenterology 119:1236–1242. 10.1053/gast.2000.19573 [DOI] [PubMed] [Google Scholar]
- 19.Ip WK, Chan KH, Law HK, Tso GH, Kong EK, Wong WH, To YF, Yung RW, Chow EY, Au KL, Chan EY, Lim W, Jensenius JC, Turner MW, Peiris JS, Lau YL. 2005. Mannose-binding lectin in severe acute respiratory syndrome coronavirus infection. J. Infect. Dis. 191:1697–1704. 10.1086/429631 [DOI] [PMC free article] [PubMed] [Google Scholar]
- 20.Summerfield JA, Ryder S, Sumiya M, Thursz M, Gorchein A, Monteil MA, Turner MW. 1995. Mannose-binding protein gene mutations associated with unusual and severe infections in adults. Lancet 345:886–889. 10.1016/S0140-6736(95)90009-8 [DOI] [PubMed] [Google Scholar]
- 21.Antony JS, Ojurongbe O, van Tong H, Ouf EA, Engleitner T, Akindele AA, Sina-Agbaje OR, Adeyeba AO, Kremsner PG, Velavan TP. 2013. Mannose-binding lectin and susceptibility to schistosomiasis. J. Infect. Dis. 207:1675–1683. 10.1093/infdis/jit081 [DOI] [PMC free article] [PubMed] [Google Scholar]
- 22.Naito H, Ikeda A, Hasegawa K, Oka S, Uemura K, Kawasaki N, Kawasaki T. 1999. Characterization of human serum mannan-binding protein promoter. J. Biochem. 126:1004–1012. 10.1093/oxfordjournals.jbchem.a022543 [DOI] [PubMed] [Google Scholar]
- 23.Garred P, Larsen F, Seyfarth J, Fujita R, Madsen HO. 2006. Mannose-binding lectin and its genetic variants. Genes Immun. 7:85–94. 10.1038/sj.gene.6364283 [DOI] [PubMed] [Google Scholar]
- 24.Juliger S, Luckner D, Mordmuller B, May J, Weierich A, Lell B, Luty A, Kremsner PG, Kun JF. 2000. Promoter variants of the human mannose-binding lectin gene show different binding. Biochem. Biophys. Res. Commun. 275:617–622. 10.1006/bbrc.2000.3343 [DOI] [PubMed] [Google Scholar]
- 25.van der Werf MJ, de Vlas SJ, Brooker S, Looman CW, Nagelkerke NJ, Habbema JD, Engels D. 2003. Quantification of clinical morbidity associated with schistosome infection in sub-Saharan Africa. Acta Trop. 86:125–139. 10.1016/S0001-706X(03)00029-9 [DOI] [PubMed] [Google Scholar]
- 26.Madsen HO, Garred P, Thiel S, Kurtzhals JA, Lamm LU, Ryder LP, Svejgaard A. 1995. Interplay between promoter and structural gene variants control basal serum level of mannan-binding protein. J. Immunol. 155:3013–3020 [PubMed] [Google Scholar]
- 27.Terai I, Kobayashi K, Matsushita M, Miyakawa H, Mafune N, Kikuta H. 2003. Relationship between gene polymorphisms of mannose-binding lectin (MBL) and two molecular forms of MBL. Eur. J. Immunol. 33:2755–2763. 10.1002/eji.200323955 [DOI] [PubMed] [Google Scholar]
- 28.Lipscombe RJ, Sumiya M, Hill AV, Lau YL, Levinsky RJ, Summerfield JA, Turner MW. 1992. High frequencies in African and non-African populations of independent mutations in the mannose-binding protein gene. Hum. Mol. Genet. 1:709–715. 10.1093/hmg/1.9.709 [DOI] [PubMed] [Google Scholar]
- 29.Madsen HO, Garred P, Kurtzhals JA, Lamm LU, Ryder LP, Thiel S, Svejgaard A. 1994. A new frequent allele is the missing link in the structural polymorphism of the human mannan-binding protein. Immunogenetics. 40:37–44. 10.1007/BF00163962 [DOI] [PubMed] [Google Scholar]
- 30.Sumiya M, Super M, Tabona P, Levinsky RJ, Arai T, Turner MW, Summerfield JA. 1991. Molecular basis of opsonic defect in immunodeficient children. Lancet 337:1569–1570. 10.1016/0140-6736(91)93263-9 [DOI] [PubMed] [Google Scholar]
- 31.Velavan TP, Boldt AB, Tomiuk J, Seibold F, Schoepfer AM, Flogerzi B, Muller S, Abad-Grau Mdel M, Kremsner PG, Kun JF. 2010. Variant alleles of the mannose binding lectin 2 gene (MBL2) confer heterozygote advantage within Crohn's families. Scand. J. Gastroenterol. 45:1129–1130. 10.3109/00365521.2010.485324 [DOI] [PubMed] [Google Scholar]
- 32.Boldt AB, Messias-Reason IJ, Lell B, Issifou S, Pedroso ML, Kremsner PG, Kun JF. 2009. Haplotype specific-sequencing reveals MBL2 association with asymptomatic Plasmodium falciparum infection. Malar. J. 8:97. 10.1186/1475-2875-8-97 [DOI] [PMC free article] [PubMed] [Google Scholar]
- 33.Yazdanbakhsh M, Sacks DL. 2010. Why does immunity to parasites take so long to develop? Nat. Rev. Immunol. 10:80–81. 10.1038/nri2673 [DOI] [PMC free article] [PubMed] [Google Scholar]
- 34.Dommett RM, Klein N, Turner MW. 2006. Mannose-binding lectin in innate immunity: past, present and future. Tissue Antigens 68:193–209. 10.1111/j.1399-0039.2006.00649.x [DOI] [PMC free article] [PubMed] [Google Scholar]
- 35.Madsen HO, Satz ML, Hogh B, Svejgaard A, Garred P. 1998. Different molecular events result in low protein levels of mannan-binding lectin in populations from southeast Africa and South America. J. Immunol. 161:3169–3175 [PubMed] [Google Scholar]
- 36.Ip WK, Takahashi K, Ezekowitz RA, Stuart LM. 2009. Mannose-binding lectin and innate immunity. Immunol. Rev. 230:9–21. 10.1111/j.1600-065X.2009.00789.x [DOI] [PubMed] [Google Scholar]
- 37.Ezekowitz RA, Day LE, Herman GA. 1988. A human mannose-binding protein is an acute-phase reactant that shares sequence homology with other vertebrate lectins. J. Exp. Med. 167:1034–1046. 10.1084/jem.167.3.1034 [DOI] [PMC free article] [PubMed] [Google Scholar]
- 38.Reich D, Thangaraj K, Patterson N, Price AL, Singh L. 2009. Reconstructing Indian population history. Nature 461:489–494. 10.1038/nature08365 [DOI] [PMC free article] [PubMed] [Google Scholar]
- 39.Dhandapany PS, Sadayappan S, Xue Y, Powell GT, Rani DS, Nallari P, Rai TS, Khullar M, Soares P, Bahl A, Tharkan JM, Vaideeswar P, Rathinavel A, Narasimhan C, Ayapati DR, Ayub Q, Mehdi SQ, Oppenheimer S, Richards MB, Price AL, Patterson N, Reich D, Singh L, Tyler-Smith C, Thangaraj K. 2009. A common MYBPC3 (cardiac myosin binding protein C) variant associated with cardiomyopathies in South Asia. Nat. Genet. 41:187–191. 10.1038/ng.309 [DOI] [PMC free article] [PubMed] [Google Scholar]
- 40.Padley D, Moody AH, Chiodini PL, Saldanha J. 2003. Use of a rapid, single-round, multiplex PCR to detect malarial parasites and identify the species present. Ann. Trop. Med. Parasitol. 97:131–137. 10.1179/000349803125002977 [DOI] [PubMed] [Google Scholar]
- 41.WHO 2010. Guidelines for the treatment of malaria. World Health Organization, Geneva, Switzerland [Google Scholar]
- 42.Jha AN, Singh VK, Kumari N, Singh A, Antony J, van Tong H, Singh S, Pati SS, Patra PK, Singh R, Toan NL, Song le H, Assaf A, Messias-Reason IJ, Velavan TP, Singh L, Thangaraj K. 2012. IL-4 haplotype −590T, −34T, and intron-3 VNTR R2 is associated with reduced malaria risk among ancestral Indian tribal populations. PLoS One 7:e48136. 10.1371/journal.pone.0048136 [DOI] [PMC free article] [PubMed] [Google Scholar]
- 43.Jha AN, Singh VK, Singh R, Pati SS, Patra PK, Singh L, Thangaraj K. 2013. A rare non-synonymous c.102C>G SNP in the IFNB1 gene might be a risk factor for cerebral malaria in Indian populations. Infect. Genet. Evol. 14:369–374. 10.1016/j.meegid.2012.12.029 [DOI] [PubMed] [Google Scholar]
- 44.Thangaraj K, Joshi MB, Reddy AG, Gupta NJ, Chakravarty B, Singh L. 2002. CAG repeat expansion in the androgen receptor gene is not associated with male infertility in Indian populations. J. Androl. 23:815–818. 10.1002/j.1939-4640.2002.tb02338.x [DOI] [PubMed] [Google Scholar]
- 45.Purcell S, Neale B, Todd-Brown K, Thomas L, Ferreira MA, Bender D, Maller J, Sklar P, de Bakker PI, Daly MJ, Sham PC. 2007. PLINK: a tool set for whole-genome association and population-based linkage analyses. Am. J. Hum. Genet. 81:559–575. 10.1086/519795 [DOI] [PMC free article] [PubMed] [Google Scholar]
- 46.Barrett JC, Fry B, Maller J, Daly MJ. 2005. Haploview: analysis and visualization of LD and haplotype maps. Bioinformatics 21:263–265. 10.1093/bioinformatics/bth457 [DOI] [PubMed] [Google Scholar]
- 47.Bellamy R, Ruwende C, McAdam KP, Thursz M, Sumiya M, Summerfield J, Gilbert SC, Corrah T, Kwiatkowski D, Whittle HC, Hill AV. 1998. Mannose binding protein deficiency is not associated with malaria, hepatitis B carriage nor tuberculosis in Africans. QJM 91:13–18. 10.1093/qjmed/91.1.13 [DOI] [PubMed] [Google Scholar]
- 48.de Messias-Reason IJ, Boldt AB, Moraes Braga AC, Von Rosen Seeling Stahlke E, Dornelles L, Pereira-Ferrari L, Kremsner PG, Kun JF. 2007. The association between mannan-binding lectin gene polymorphism and clinical leprosy: new insight into an old paradigm. J. Infect. Dis. 196:1379–1385. 10.1086/521627 [DOI] [PubMed] [Google Scholar]
- 49.Thye T, Niemann S, Walter K, Homolka S, Intemann CD, Chinbuah MA, Enimil A, Gyapong J, Osei I, Owusu-Dabo E, Rusch-Gerdes S, Horstmann RD, Ehlers S, Meyer CG. 2011. Variant G57E of mannose binding lectin associated with protection against tuberculosis caused by Mycobacterium africanum but not by M. tuberculosis. PLoS One 6:e20908. 10.1371/journal.pone.0020908 [DOI] [PMC free article] [PubMed] [Google Scholar]
- 50.Boniotto M, Crovella S, Pirulli D, Scarlatti G, Spano A, Vatta L, Zezlina S, Tovo PA, Palomba E, Amoroso A. 2000. Polymorphisms in the MBL2 promoter correlated with risk of HIV-1 vertical transmission and AIDS progression. Genes Immun. 1:346–348. 10.1038/sj.gene.6363685 [DOI] [PubMed] [Google Scholar]
- 51.Holmberg V, Schuster F, Dietz E, Sagarriga Visconti JC, Anemana SD, Bienzle U, Mockenhaupt FP. 2008. Mannose-binding lectin variant associated with severe malaria in young African children. Microbes Infect. 10:342–348. 10.1016/j.micinf.2007.12.008 [DOI] [PubMed] [Google Scholar]
- 52.Verdu P, Barreiro LB, Patin E, Gessain A, Cassar O, Kidd JR, Kidd KK, Behar DM, Froment A, Heyer E, Sica L, Casanova JL, Abel L, Quintana-Murci L. 2006. Evolutionary insights into the high worldwide prevalence of MBL2 deficiency alleles. Hum. Mol. Genet. 15:2650–2658. 10.1093/hmg/ddl193 [DOI] [PubMed] [Google Scholar]
Associated Data
This section collects any data citations, data availability statements, or supplementary materials included in this article.