Abstract
Chemotherapy has been widely used in cancer treatment, but the prognosis of the cancer patients following chemotherapy has not been substantially improved. Alternative strategies such as immunotherapy and their combinations with chemotherapy are now being considered; however, the effects of chemotherapy on the immune responses of cancer cells are not fully understood. In the present studies, we reveal a potential link between chemotherapy and cancer immunoresistance, we first examined the effects of chemopreventive agent DDP on the expression of a cell surface glycopreotein Trop-2 in lung cancer cells, and found that DDP not only induce Trop-2 surface expression in human lung cancer cells, but also induce T-cell apoptosis effectively. In order to investigate the relationship between DDP-induced Trop-2 expression and T-cell apoptosis, we stably transfected A549 and PC14 lung cancer cells with Trop-2 shRNA, the DDP-induced Trop-2 surface expression was effectively decreased in stably transfected cell lines, but chemotherapeutic reagent-induced cell proliferation inhibition and apoptosis were increased through inhibition of the MAPK signaling pathway. In vivo animal experiments showed that Trop-2 knockdown tumors displayed a slower growth rate than the control xenografts. Importantly, DDP treatment exhibited a strong antitumor activity in the mice with Trop-2 knockdown tumors, but only a marginal effect in the control group. Taken together, our data show that DDP resistance in lung cancer cells could be induced through increased surface expression of Trop-2, which at least partially by interfering with MAPK pathway. These results provide novel insight into the function of Trop-2 and encourage the design and testing of approaches targeting this protein and its partners.
Keywords: Trop-2, lung cancer, immunoresistance, MAPK, DDP
Introduction
Despite significant progress in cancer therapy by conventional approaches of surgery, radiotherapy, and chemotherapy in the last decade, the overall survival rates of cancer patients have not been substantially improved.1 Among those approaches, chemotherapy has been widely used to inhibit cancer cell proliferation and induce cancer cell apoptosis; however, chemopreventive agents may not only directly cause immune cell death due to their cytotoxicity, but also alter tumor-reactive immune responses, so cancer immunoresistance and immune escape are major obstacles in chemotherapy. In recent years, immunotherapy as a complementary strategy could be helpful to eradicate cancer cells when combined with chemotherapy.2-5 Thus, a better understanding of how chemotherapy may affect the immune responses of cancer cells is necessary for the improvement of the efficacy of chemotherapy combining with immune remedy.
The tumor-associated calcium signal transducer (TROP2/TACSTD2) gene,6 is a surface glycoprotein originally identified in human placental trophoblast and subsequently reported to be highly expressed by various types of human carcinomas, such as pancreatic,7 gastric,8 oral,9 lung,10 laryngeal squamous cell carcinoma,11 and colorectal cancers,12-14 but rarely or restrictively expressed in normal adult tissues,15 and correlate with invasive behavior and poor prognosis, which suggests that it has a role in tumor progression. Trop-2 is also identified as a marker of a subpopulation of prostate basal cells in both murine and human,16 the Trop-2-expressing basal cells possesses stem cell capacities such as self-renewal, tissue regeneration, and multilineage differentiation, Stoyanova et al.17 further demonstrate that Trop-2 controls stem/progenitor self-renewal and tissue regeneration in the prostate. Trop-2 is thought to be a signal transducer playing a regulatory role in the growth of cancer cells18 and also in morphogenesis19 through regulating the intracellular calcium levels,20 Trop-2 has also been proposed as a target for anticancer immunotherapy,21 anti-Trop-2 monoclonal antibodies (mAbs) have been shown to kill uterine serous papillar carcinoma cells via Ab-dependent cell-mediated cytotoxicity in vitro;22 Trop-2 is a cell surface marker of gastric adenocarcinoma cell line (AGS), anti-Trop-2 conjugated liposomes loaded with apoptosis activator 2 on AGS cell line induces apoptosis effectively.23
Although Trop-2 expression is elevated in various carcinomas and serves as a marker of cancer immunotherapy, the biological role of Trop-2 in chemotherapy, and the correlation of Trop-2 with chemotherapy or immunotherapy are not well understood. In the present study, we demonstrate that Trop-2 confers resistance to DDP in vitro by reducing the sensitivity of lung cancer cells to apoptosis, which mediated via the MAPK signaling pathway. Furthermore, in contrast to previous studies majorly focused on the oncogene effects of Trop-2, our data show that Trop-2 plays an important immunoregulatory role in determining the resistance to DDP via increased surface expression in lung cancer cells. These findings provide new insight into the role of Trop-2 in cancer and may have important implications in the development of targeted therapeutic remedy to overcome DDP resistance, our findings also reveal a potential link between chemotherapy and immunoresistance.
Results
Overexpression of Trop-2 in lung cancer patients
Trop-2 expression levels in NSCLCs and paired normal lung tissues were examined by means of quantitative real-time RT-PCR. As shown in Table 1, all (100%) of 5 adenocarcinomas expressed Trop-2 ranging from 4.3 × 10⁻¹ to 3.9 × 101 (Trop-2 expression level in A549 lung cancer cells was defined as 1.0), and 15 squamous cell lung cancer tissues expressed Trop-2 at levels ranging from 8.0 × 10⁻¹ to 4.5 × 100. However, Trop-2 expression was detected in 0/11 paired normal lung tissues of patients.
Table 1. Clinical features of patients with lung cancer and WT1 expression in lung cancer tissues.
| Patient | Age (year) | Sex | Histology | TNM | Stage | Trop-2 mRNA level |
|---|---|---|---|---|---|---|
| 1 | 69 | F | Ad | T1N1M0 | IIA | 8.0 × 10⁻¹ |
| 2 | 55 | M | Ad | T1N1M0 | IIA | 4.0 × 100 |
| 3 | 56 | F | Ad | T2N1M0 | IIB | 0.7 × 100 |
| 4 | 50 | M | Ad | T2N0M0 | IB | 2.3 × 100 |
| 5 | 63 | F | Ad | T2N1M0 | IIB | 3.3 × 100 |
| 6 | 63 | M | Sq | T1N0M0 | IA | 6.0 × 10⁻¹ |
| 7 | 56 | M | Sq | T1N0M0 | IA | 8.0 × 10⁻¹ |
| 8 | 64 | F | Sq | T2N1M0 | IIB | 3.4 × 100 |
| 9 | 47 | M | Sq | T1N0M0 | IA | 0.5 × 10⁻¹ |
| 10 | 56 | M | Sq | T1N0M0 | IA | 4.5 × 10⁻¹ |
| 11 | 63 | M | Sq | T2N1M0 | IIB | 3.7 × 100 |
| 12 | 64 | M | Sq | T1N0M0 | IA | 6.0 × 10⁻¹ |
| 13 | 54 | M | Sq | T2N1M0 | IIB | 6.5 × 100 |
| 14 | 71 | M | Sq | T1N2M0 | IIIA | 5.4 × 100 |
| 15 | 61 | M | Sq | T1N1M0 | IIA | 10.0 × 100 |
| 16 | 75 | M | Sq | T2N1M0 | IIB | 3.5 × 100 |
| 17 | 53 | M | Sq | T2N0M0 | IB | 9.0 × 10⁻¹ |
| 18 | 59 | M | Sq | T1N2M0 | IIIA | 3.9 × 101 |
| 19 | 76 | M | Sq | T2N0M0 | IB | 0.5 × 100 |
| 20 | 66 | M | Sq | T2N0M0 | IB | 7.3 × 10⁻¹ |
Trop-2-knockdown results in proliferation inhibition and G2-phase accumulation
To investigate the physiological function of Trop-2, we used shRNA to create stable Trop-2 knockdown cell variants derived from A549 and PC14 cell lines. As compared with the parental and the nontarget shRNA-transfected control cell variants A549-NC and PC14-NC, their corresponding Trop-2 knockdown cell variants A549-shTrop-2 and PC14-shTrop-2 expressed very low levels of Trop-2, showing an effective knockdown of the Trop-2 protein (Fig. 1A).
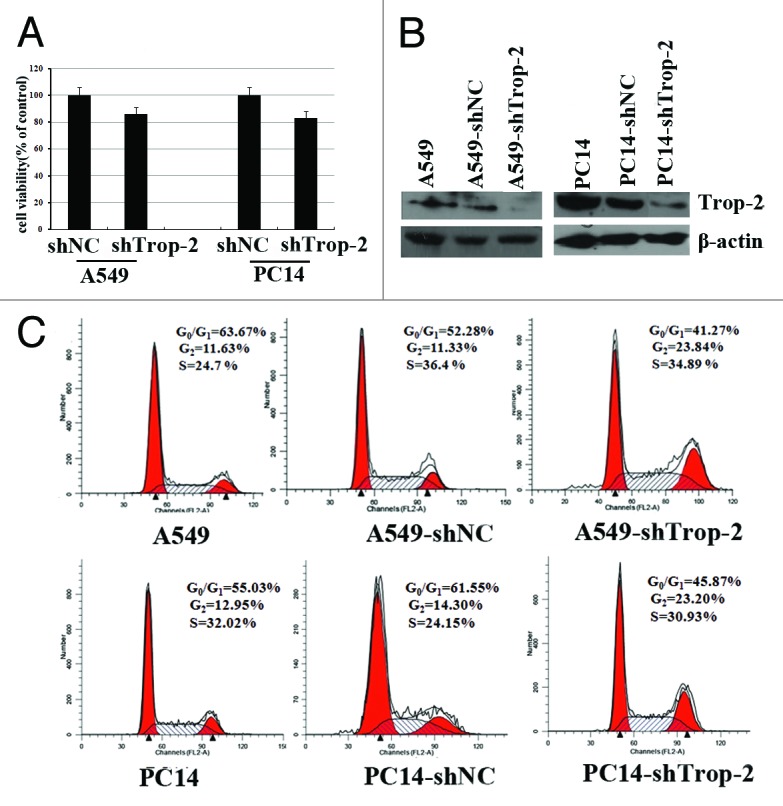
Figure 1. Trop2-knockdown results in proliferation inhibition and G2-phase accumulation in lung cancer cells. (A) Western blot analysis showing the Trop-2 protein level of A549 (left) and PC14 cells (right), stably transfected with either shNC or shTrop-2 and their corresponding parental cells. β-actin levels served as loading control. (B) Cell proliferation of A549 and PC14 lung cancer cells stably transfected with shTrop2 or nontarget control shRNA was detected by MTT assay. The viability of shNC transfected cells was considered as 100%. Data represented the mean ± SD of three independent experiments. (C) A549 and PC14 lung cancer cells were stably transfected with shTrop2 or nontarget control shRNA, cell cycle distribution was assessed by means of flow cytometry. The distribution of cells in the G1, S, and G2/M phases of the cell cycle were calculated and labeled.
To examine the effect of Trop-2 reduction on cell proliferation and cell cycle distribution, we then performed proliferation assays and FACS analysis. Cells were seeded in 96-well plates at 104 cells per well and 48 h later the cell viability was analyzed by MTT assay. Figure 1B showed that knockdown of Trop-2 caused a remarkable inhibition of cell proliferation in both A549 and PC14 cells compared with that of control cells. Moreover, FACS analysis revealed that Trop-2 shRNA-stable transfected cells exhibited a significantly higher proportion in G2 phase compared with that of control cells (Fig. 1C). These data demonstrate that Trop-2 reduction leads to growth arrest in G2 or reduction in progression through G2. To determine whether this effect is specific to lung cancer cells, we next performed the same experiments in Hela human cervical cancer cell line, and also observed a G2 accumulation Hela cell line post-shTrop-2 transfection (data not shown).
shRNA-mediated reduction in Trop-2 expression resulted in impaired cell motility and migration
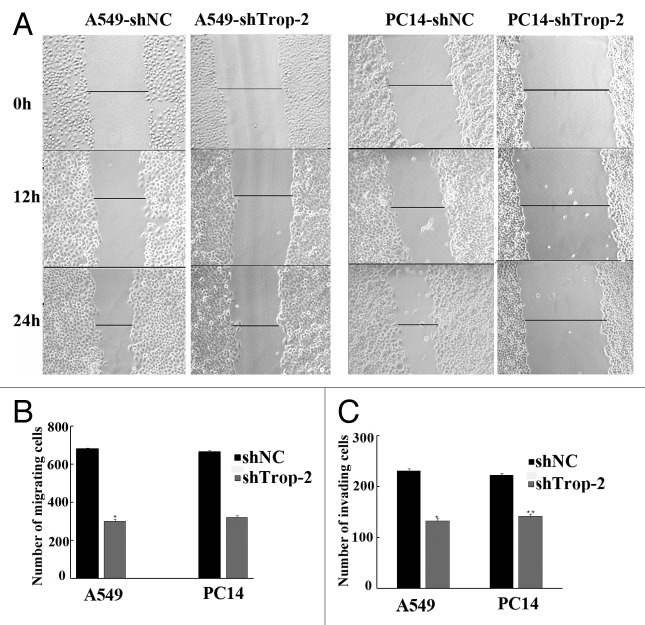
Parental lung cancer cells and shTrop-2 stably transfected cells were seeded in 12-well plates and allowed to attach overnight. Then we examined the role of each device on tumor cell migration by performing scratch assays, as shown in Figure 2A, the migration distances of A549-shTrop-2 and PC14-shTrop-2 were much slower than the scramble in both A549-shNC and PC14-shNC cells. The results revealed that cell migration was impaired when deficient of Trop-2, Figure 2B and Figure 2C also showed that the shTrop-2 inhibited migration and invasion of lung cancer cells. These data suggest that reduction of Trop-2 expression can inhibit early metastasis of lung cancer cells.
Figure 2. Regulation of migration, invasion by Trop-2 in lung cancer cells. (A) Motility assay. Photomicrographs demonstrating the results of the in vitro motility of in lung cancer cells using the simple scratch technique. Lung cancer cells were grown in monolayer, scratched and monitored every 6 h for 24 h. (B) Transwell migration assay. Lung cancer cells were plated in the top chamber of the transwell, cells migrated to the lower chambered were fixed with methanol, stained with crystal violet and counted. Data represent mean ± SD. *Significantly different from respective controls, P < 0.05. (C) Matrigel invasion assay. Lung cancer cells were plated onto the matrigel-coated membrane in the top chamber of the transwell for 24 h. Cells invaded to the lower chambered were fixed with methanol, stained with crystal violet and counted. Data represent mean ± SD. *Significantly different from respective controls, P < 0.05.
Induction of the Trop-2 expression in response to DDP in human lung cancer cells
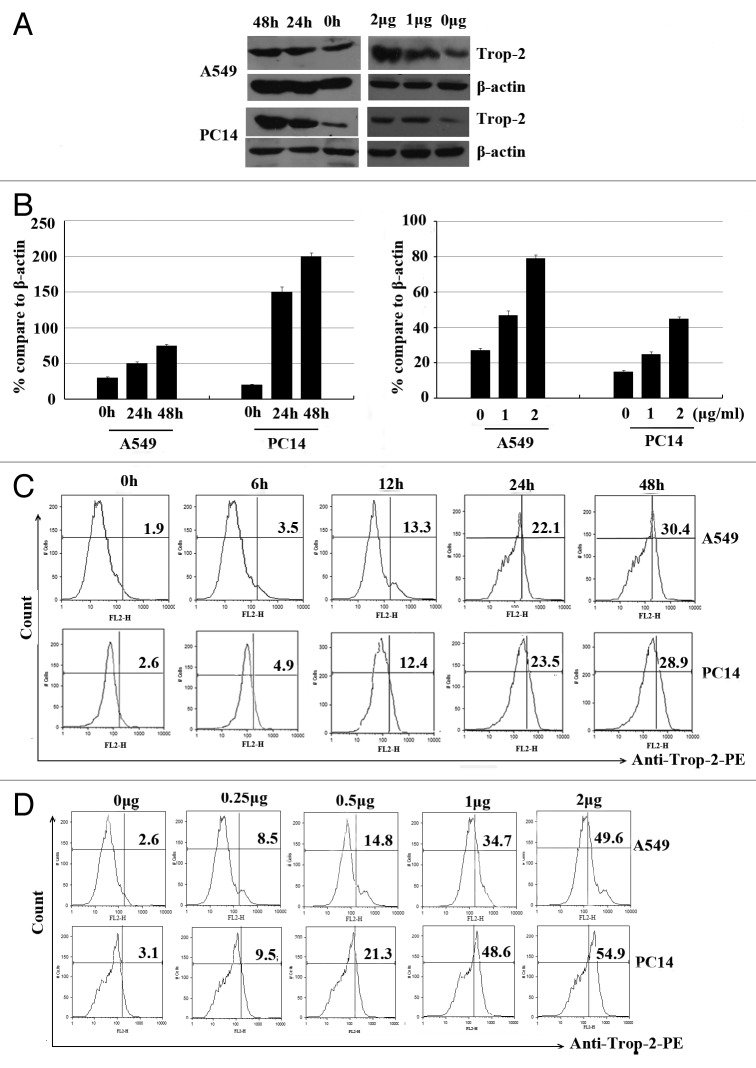
To determine the effect of the standard lung cancer chemotherapy reagent DDP on Trop-2 mRNA expression and protein level, A549 and PC14 cells were incubated with different concentrations of DDP for 24 h or incubated with 1 µg/ml DDP for 24 h or 48 h, respectively. Unexpected, the Trop-2 expression was increased in time- and dose-dependent manner in both cell lines as determined by western blot assay (Fig. 3A and B).
Figure 3. Dose- and time-dependent increase of the Trop-2 surface expression in response to DDP in human lung cancer cells. (A) A549 and PC14 cells were treated with different concentrations of DDP for 24 and 48 h, respectively, and Trop-2 expression was analyzed by western blot analysis. (B) Representative histograms and bar graphs show DDP-induced Trop-2 expression in lung cancer cells. Data are represented as mean ± SD from 3 independent experiments. (C) A549 and PC14 cells were treated with 1 µg/ml of DDP for different time points, Trop-2 expression was analyzed by flow cytomertry. (D) A549 and PC14 cells were treated with different concentrations of DDP for 24 h, Trop-2 expression was analyzed by flow cytometry.
Chemopreventive agents induce Trop-2 surface expression in lung cancer cells
We then assessed the effects of chemopreventive agents on Trop-2 surface expression in lung cancer cells, we first treated A549 and PC14 cells with 1 µg/ml of DDP, in the time course study, we observed an increase of Trop-2 surface expression as early as 12 h after the treatment, and its expression reached the highest level at 48 h after the treatment (Fig. 3C). We then examined the dose responses of DDP-induced Trop-2 surface expression. Figure 3D showed DDP induced dose-dependent increase of Trop-2 surface expression in A549 and PC14 cells. In addition, we examined whether other chemotherapeutic agents treatment could affect the surface expression of A549 cell line. We also demonstrated that As2O3 also induced Trop-2 surface expression in A549 cells (data not shown).
Chemopreventive agents promote Trop-2-specific T-cell apoptosis
We are wondering if the upregulated Trop-2 surface expression induced by DDP in lung cancer cells may affect cancer cell-reactive T-cell functions. Co-culture of T cells with A549 cells pre-treated with DDP increased the apoptosis of CD8+ T cells when compared with that of T cells cultured with untreated control cells (Fig. 4). As the effects of DDP treated cancer cells on the apoptosis of CD8+ T cells were completely inhibited by Trop-2 blocking antibody, so we conclude that DDP induces CD8+ T-cell apoptosis through Trop-2-dependent pathway.
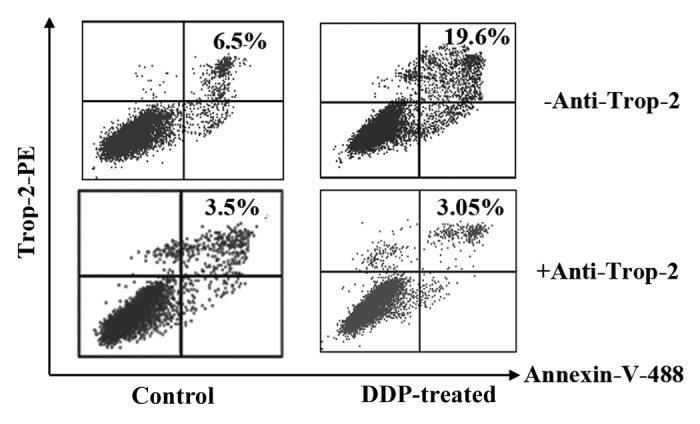
Figure 4. Chemopreventive agents promote Trop-2-specific T-cell apoptosis. DDP-pre-treated lung cancer cells induce Trop-2-specific T-cell apoptosis. A549 cancer cells were pre-treated with 1 µg/ml of DDP for 48 h. Mitomycin C was added to kill the cells. T cells were then co-cultured with mitomycin C-treated A549 cancer cells in the absence (top row) or presence (bottom row) of anti-Trop-2 mAb for 16 h. Cells were then harvested and stained with PE anti-Trop-2, Alexa Fluor 488 anti-annexin V and APC anti-CD8, and analyzed by flow cytometry for T-cell apoptosis in Trop-2+/CD8+ population. The results are representative of 3 independent experiments.
shRNA targeting Trop-2 sensitizes lung cancer cell lines to DDP treatment
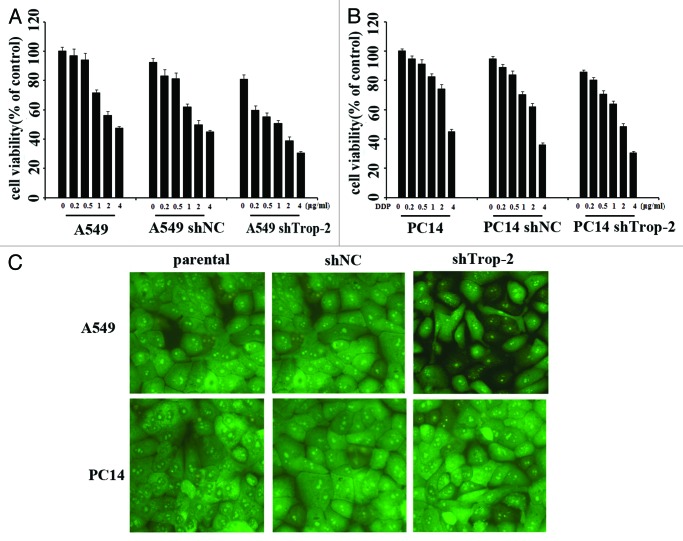
As DDP treatment could increase the Trop-2 expression, which then induces CD8+ T-cell apoptosis, so we thought this could be an obstacle for DDP in use of lung cancer treatment. Thus we were considering the effect of DDP treatment in combination with Trop-2 shRNA transfection. After treated with various concentrations of DDP for 72 h, cell viability of A549-shTrop-2 and PC14-shTrop-2 was then analyzed by MTT assay, cell apoptosis was also detected by AO/EB staining post 1 µg/ml DDP treatment. A dose-dependent inhibition of cell growth was observed in lung cancer cells (Fig. 5A), and the Trop-2 knockdown cells were about 2-fold more sensitive to DDP than parental and control cells. In A549 cells, the inhibition of cell growth was 51% after exposure to 1 µg/ml DDP in the Trop-2 knockdown A549-shTrop-2 cells compared with 29% and 37% in parental and control cells; in PC14 cells, the inhibition of cell growth was 37% after exposure to 1 µg/ml DDP in the Trop-2 knockdown PC14-shTrop-2 cells compared with 18% and 25% in parental and control cells. Statistical analysis shows that the difference between Trop-2 knockdown and control cells was significant in both A549 and PC14 cells. Our result also showed that downregulation of Trop-2 prior to treatment with DDP led to a much higher rate of apoptotic cells compared with the DDP treated parental cells by AO/EB staining (Fig. 5B). These results indicate that Trop-2 plays a role in tumor cell resistance to DDP.
Figure 5. Trop-2 silencing sensitizes lung cancer cells to DDP-induced proliferation inhibition and apoptosis. (A) Cell viability of A549, A549-shNC, A549-shTrop2 (left), PC14, PC14-shNC, and PC14-shTrop2 cell variants (right) following treatment with DDP at various concentrations for 72 h was assessed by MTT assay. Data are presented as the percentage of cell growth inhibition measured in DDP treated cells compared with untreated cells. The P value shows the difference between paclitaxel-treated Trop2 knockdown cells and parental cells. Columns, mean of 3 independent experiments done in triplicates; bars, SE; *significantly different from respective controls, P < 0.05. (B) A549, A549-shNC, A549-shTrop2 (up), PC14, PC14-shNC, and PC14-shTrop2 cell variants (down) were treated with 1 µg/ml of DDP for 24 h, apoptosis was detected by AO-EB staining.
Trop-2 regulates the activation of MAPK signaling pathway and its downstream antiapoptotic molecules
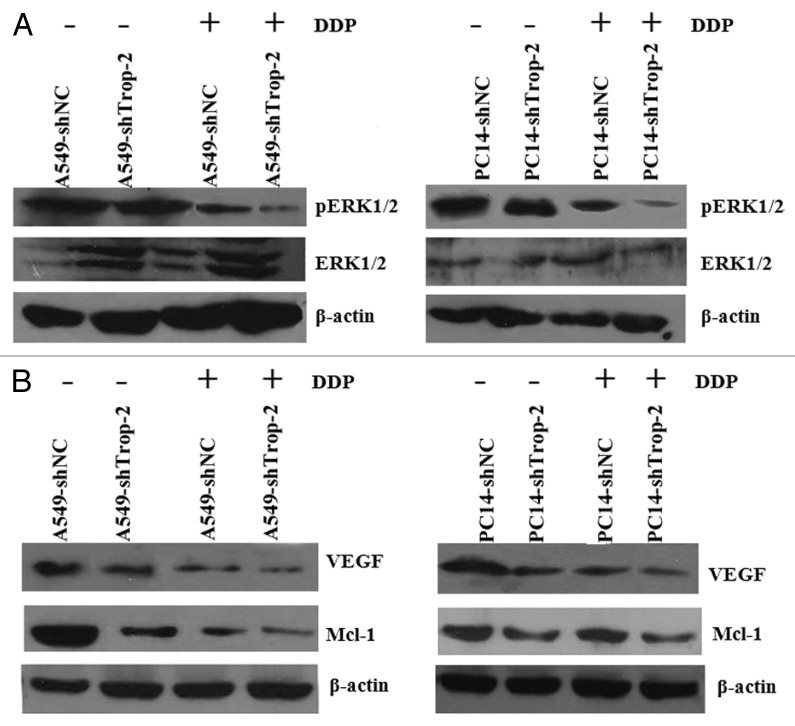
Since we observed chemo-sensitization accompanied by an increase in apoptosis in DDP-treated Trop-2 knockdown cells, we studied whether the effects of Trop-2 knockdown could be related to molecules and signaling pathways known to be involved in the apoptotic response. We then investigated the effects of Trop-2 knockdown on several signaling pathways, and we found that the MAPK signaling pathway activity was affected by shTrop-2 transfection. As seen in Figure 6A, the silencing of Trop-2 induced a dramatic reduction in the phosphorylation level of Erk, an indicator of MAPK activation, both in untreated and DDP-treated cells. Furthermore, Mcl-1 was dramatically repressed in Trop-2 silenced cells with reduced Erk phosphorylation (Fig. 6B). VEGF, another direct target of MAPK, was also, to a lesser extent, reduced in Trop-2 silenced cells (Fig. 6B). In summary, these indicate that the silencing of Trop-2 reduces the phosphorylation of Erk, which leads to decreased expression of the antiapoptotic proteins Mcl-1 and VEGF.
Figure 6. Trop-2 regulates the activation of MAPK signaling pathway and its downstream antiapoptotic molecules. Cells were treated with 1 µg/ml of DDP (72 h) or left untreated. Whole cell lysates were probed with indicated antibodies with β-actin as a loading control. (A) Trop-2 silencing suppressed ERK phosphorylation in A549 (left) or PC14 (right) cells. (B) Trop-2 silencing downregulated Mcl-1 and VEGF expression in A549 (left) or PC14 (right) cells.
Silencing of Trop-2 enhances cancer cell sensitivity to DDP treatment in a xenograft mouse model
The in vitro experiments with the A549 and PC14 cells showed that the cytotoxic effect of DDP was enhanced in cells with silenced Trop-2. Hence, we examined whether this could be observed also in vivo. A549 Trop-2 knockdown and control cells were injected s.c. in nude mice, and the animals were treated with DDP when the tumors had reached a mean diameter of 5 to 6 mm. As shown in Figure 7, the growth rate was reduced by the knockdown in Trop-2 alone, and whereas DDP had a marginal effect on the growth of A549-shNC tumors, it showed a strong antitumor effect in the mice carrying growth of A549-shTrop-2 xenografts. These in vivo results strongly support the effects observed in vitro that Trop-2 plays a critical role in DDP responsiveness of lung cancer cells.
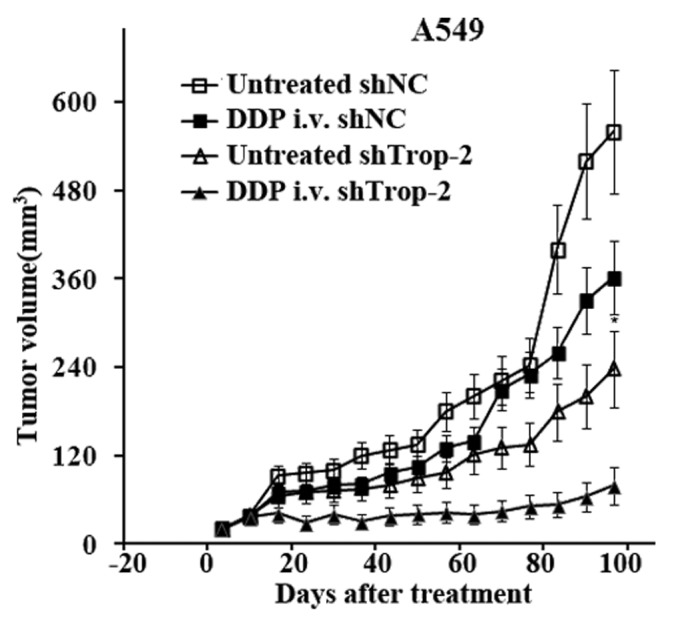
Figure 7. In vivo evaluation of combined Trop-2 and DDP therapy in A549 xenografts. Growth curves of lung cancer xenografts in nude mice established by s.c. injection of 5 × 10⁶ A549-shTrop-2 or A549-shNC cells in both flanks of nude mice treated with DDP (10 mg/kg). The drug was injected i.v. into the tail vein at day 0 when the mean tumor diameter was 5 to 6 mm, and the tumor diameter was measured 1 to 2 times per week. Each group consisted of 5 to 6 animals and the data are presented as mean of 2 independent experiments, data are represented as mean ± S.E.M, P < 0.01.
Discussion
Chemotherapy is widely used as one of the traditional method for cancer therapy, but cancer chemoresistance is a major obstacle. In recent years, complementary strategies such as immunotherapy could be helpful to eradicate cancer cells when combined with chemotherapy. Nevertheless, chemopreventive agents may not only directly cause immune cell death due to their cytotoxicity, but also alter tumor-reactive immune responses. Thus, a better understanding of how chemotherapy may affect the immune responses of cancer cells, and find the related signaling pathways involved in the process is necessary for the improvement of the efficacy of chemotherapy or chemotherapy in combination with immunotherapy.
In this study, we examined the role of Trop-2 in lung cancer, and there are three major findings. First, we found that cell surface glycoprotein Trop-2 is overexpressed in lung cancer specimens and several lung cancer cell lines, using shRNA approach we demonstrated that Trop-2 is involved in cell growth and cell cycle distribution in lung cancer cells; second, we showed that chemopreventive agents such as DDP and As2O3 can induce Trop-2 surface expression in human lung cancer cells, furthermore, the upregulated Trop-2 surface expression induced by chemopreventive agents effectively mediates T-cell apoptosis; third, Trop-2 shRNA induced knockdown of the Trop-2 protein in A549 cells resulted in increased sensitivity to the drug, whereas Trop-2 overexpressing parental cells were less sensitive to DDP-induced apoptosis, thus targeting Trop-2 could counteract cellular resistance to DDP.
Furthermore, in attempts to elucidate the mechanisms underlying the observed effects, we obtained the evidence for Trop-2 regulating key genes in the mitogen-activated protein kinase (MAPK)-related signaling pathway. MAPK cascades are demonstrated to be key signaling pathways involved in the regulation of normal cell proliferation, survival, and differentiation.24,25 Aberrant regulation of this pathway contributes to cancer and other human diseases. Three major types of MAPK families, extracellular response kinase (ERK), c-Jun NH2-terminal kinase (JNK), and p38, have been described in mammalian systems. In particular, the ERK signaling pathway which universally governs proliferation, differentiation and cell survival, is associated with resistance to apoptosis in malignant tumors. Many studies showed that inactivation of this pathway sensitizes cancer cells to anti-cancer drugs induced apoptosis,26,27 and the subject of intense research scrutiny leading to the development of pharmacologic inhibitors for the treatment of cancer. Yao et al.28 demonstrated that Trop-2 has the ability to activate ERK using gene-reporter assays, and Trop-2 expression contributes to tumor by activating the ERK/MAPK pathway. Guerra et al.29 further demonstrated a signaling-network-dependent, feedback mediated modulation of ERK by Trop-2, rather than an early activation step.
In the present study, we then analyzed the phosphorylation level of ERK and the expression changes of cyclin D1 and VEGF, and in transfectants with shTrop-2 or with control vectors. Cyclin D1 is downstream of ERK/MAPK,30 shTrop-2 stably transfected cells showed reduced phosphorylation level of ERK, and reduced cyclin D1 expression which could cause the G2 phase accumulation post transfection. We also find that the expression of VEGF—another ERK/MAPK signaling pathway downstream target31—is also reduced post shTrop-2 transfection.
In summary, our study investigating the role of Trop-2 in drug resistance shows that the protein confers resistance to DDP in vitro by reducing the sensitivity of lung cancer cells to apoptosis, mediated via the MAPK signaling pathway. Furthermore, in contrast to previous studies majorly focused on the oncogene effects of Trop-2, our data show that Trop-2 plays an important immunoregulatory role in determining the resistance to DDP via increased surface expression in lung cancer cells. These findings provide new insight into the role of Trop-2 in cancer and may have important implications in the development of targeted therapeutic remedy to overcome DDP resistance, our findings also reveal a potential link between chemotherapy and immunoresistance.
Materials and Methods
Tissue samples and cell lines
The non-small-cell lung cancer (NSCLC) cell lines (A549, PC14), were obtained from ATCC and propagated in the recommended media. Lung cancer specimens and paired normal lung tissues were obtained from the primary tumor site during operation (Thoracic Surgical Departments of the Tangdu Hospital). Clinicopathologic features in lung cancers are listed in Table 1. NSCLC stages were classified according to the UICC TNM classification. For the use of these clinical materials for research purpose, prior patients’ consents and approval from the Institutional Research Ethics Committee of Tangdu hospital were obtained. Written informed consents were signed by all the patients. Under sterile conditions, tumor samples of 0.5 cm in diameter were taken and shock-frozen in liquid nitrogen. Samples from macroscopically tumor-free margins of the operative specimens were also processed accordingly.
Drugs and antibodies
DDP (min. 94%) was purchased from Sigma-Aldrich. A 10 mM DDP stock solution was dissolved in PBS and stored at −20 °C until use. Monoclonal anti-human Trop-2, and goat anti-mouse secondary antibody for western blot were obtained from Santa Cruz Biotechnology, Inc. The anti-phospho-Akt(p- Thr473) was obtained from Cell Signaling.
Quantitative real-time RT-PCR
Quantitative real-time RT-PCR was performed using SYBR green master mix (Takara), according to the following PCR conditions: initial denaturation at 95 °C for 3 min followed by 30 cycles of amplification at 95 °C for 10 s and 60 °C for 15 s. The amplified fluorescent signal was detected by Roche LightCycler 480 (Roche Diagnostics). Relative quantification was assessed using secondary derivative maximum (Roche Diagnostics). Gene expression was normalized to GAPDH and differences in expression measured relative to the control (A549 cells). For each sample, all experiments were repeated in triplicate using two independent cDNA extractions with RNA isolated from 3 independent RNA extractions.
Generation of stable cell lines
Short hairpin RNA (shRNA) constructs against Trop-2 Was chemically synthesized by AuGCT Biotechnology. The sense oligonucleotide sequence was: 5′-GATCCCCAAG TGTCTGCTGC TCAATTCAAG AGTTGAGCAG CAGACACTTG GAGA-3′. After annealing, the oligonucleotides were inserted into the BamHI and HindIII sites of linearized pSilencer4.1-CMV neo vector (Ambion) according to the manufacturer’s instructions, and the recombinant vector was named as shTrop-2. The vector pSilencer4.1-CMV negative control was named as shNC.
Either Trop-2 shRNA construct or control vector were transfected into A549 and PC14 cells by using Lipofectamine 2000 (Invitrogen) according to the manufacturer’s protocols, followed by selection with 600 mg/mL G418 for 2 weeks. Antibiotic-resistant clones were isolated in medium with 500 mg/mL of G418. Reverse transcription PCR and immunoblotting were performed to confirm the knockdown of mRNA and protein of Trop-2 in those transfectants. The stably transfected cells were named as A549-shTrop-2, A549-shNC, PC14-shTrop-2, and PC14-shNC, respectively.
3-(4, 5-Dimethyl-thiazol-2-yl)-2, 5-diphenyltetrazolium bromide (MTT) assay
Cell proliferation was determined by MTT (Sigma) assay as described elsewhere32 Briefly, the stably transfected cells were plated in 96-well tissue culture plates at a density of 1 × 10⁴ cells per well and allowed to attach overnight, treated with different concentrations of DDP for 48 h, and then incubated with MTT (20 μl of 5 mg/mL) for 4 h. The formazan precipitate was dissolved in 150 μl of dimethylsulfoxide (DMSO) and the absorbance at 570 nm was measured by a benchmark microplate reader (Bio-Rad).
Cell cycle analysis
The effect of Trop-2 on cell cycle distribution was determined by flow cytometry using the cell cycle detection kit (Keygen). Briefly, adherent cells were collected, fixed with 70% ice-cold ethanol, and stored at 4 °C. For cell cycle analysis, the fixed cells were stained with propidiumiodide (PI) and the cell cycle distribution was performed by BD FACSCaliburTM (BD Biosciences) and analyzed by ModFIT software.
Cell migration assay
Cell motility was examined by scratch assay. Stably transfected cells were seeded in 6-well plates at a density of 1 × 10⁶ cells per well and incubated the dishes at 37 °C until cells reached 100% confluence. An artificial gap was then generated by scratching with a pipette tip. Photographic images were taken from each well immediately and again after every 6 h until 24 h using a digital camera system. The software program HMIAS-2000 was used to calculate the cell migration distance (mm). Each experiment was repeated at least 3 times.
Transwell migration assay
For transwell migration assays, 8 × 10⁴ cells were plated in the top chamber onto the noncoated membrane (24-well insert; pore size, 8 ml; Corning Costar) and allowed to migrate toward serum-containing medium in the lower chamber. Cells were fixed after 24 h of incubation with methanol for 10 min and stained with 0.1% crystal violet (2 mg/ml). The number of cells invading through the membrane was counted under a light microscope (3 random fields per well).
Transwell invasion assay
For invasion assay, 8 × 10⁴ cells were plated in the top chamber onto the Matrigel coated Membrane (24-well insert; pore size, 8 ml; Corning Costar). Lung cancer cells were plated in medium without serum or growth factors, and medium supplemented with serum was used as a chemoattractant in the lower chamber. The cells were incubated for 24 h and cells that did invade through the pores were removed by a cotton swab. Cells on the lower surface of the membrane were fixed with methanol for 10 min and stained with 0.1% crystal violet. The number of cells invading through the membrane was counted under a light microscope (40×, 3 random fields per well).
Western blotting
Protein extract was electrophoresed on a 10% SDS-polyacrylamide gel, transferred to NC membrane. After blocking the membrane was incubated overnight at 4 °C with primary antibodies. Primary antibodies were removed and the blots were extensively washed with TBST 3 times, then incubated for 1 h at room temperature with the secondary antibody. Following removal of the secondary antibody, blots were washed, and the specific bands were detected by chemiluminescence enhanced chemiluminescence kit (Santa Cruz).
Flow cytometry (FACS)
Trop-2 surface expressionwas analyzed by flow cytometry as Zhang et al. described previously.33 Briefly, lung cancer cells were harvested and washed with FACS buffer (PBS with 5% FBS buffer and 0.1% NaN3) for twice and then incubated with PE-anti human Trop-2 or isotype control antibodies for 30 min at 4 °C. Cells were then washed with FACS buffer and analyzed on a FACSCalibur flow cytometer with Cell Quest software (Becton Dickinson).
T-cell apoptosis assay
Peripheral blood mononuclear cells (PBMCs) were isolated using Lymphoprep density gradient centrifugation (Accurate Chemical) from healthy human donors. PBMCs were plated at a density of 1 × 10⁷/well in 6-well plates and stimulated with A549 lysate for 4 d to stimulate Trop-2 expression in PBMCs. Stimulated PBMCs were then harvested and purified by Lymphoprep density gradient centrifugation again, and then co-cultured with mitomycin C-treated A549 lung cancer cells at 10:1 ratio for 16 h. Ten micrograms per milliliter anti-Trop2 blocking antibody was added to indicated wells to examine Trop-2 specific in CD8+ T-cell apoptosis. PBMCs were then harvested and stained with PE-conjugated Trop-2, Alexa Fluor 488-conjugated annexin V and APC-conjugated CD8 antibodies. Trop-2-dependent CD8+ T-cell apoptosis was calculated as the percentage of annexinV+ cells in gated Trop-2+/CD8+ population.
Acridine orange–ethidium bromide (AO/EB) staining
Morphological evidence of apoptosis was obtained using AO/EB staining, and stained cells were examined using fluorescence microscopy. Viable cells were colored green with intact nuclei. Non-viable cells had bright orange chromatin. Apoptosis was demonstrated by the appearance of cell shrinkage with condensation and fragmentation of nuclei. Apoptotic cells were easily distinguished from necrotic cells because the latter appeared orange with a normal nuclear structure.
In vivo mouse model studies
Eight-week-old female BALB/c nu/nu mice were purchased from animal experiment center of the Fourth Military Medical University and bred under pathogen-free conditions. Animal experiments in this study were performed in accordance with medicine institutional guidelines of the Fourth Military Medical University. Mice were subcutaneously injected in the back with 5 × 10⁶ A549-shTrop-2 or A549-shNC cells in both flanks of nude mice treated with DDP (10 mg/kg). The drug was injected i.v. into the tail vein at day 0 when the mean tumor diameter was 5 to 6 mm, and the tumor diameter was measured 1 to 2 times per week. Tumor proliferation was evaluated by the average size of tumors and tumor size was calculated according to the formula: V = 0.4 × largest diameter × smallest diameter2 .
Statistical analysis
All experiments were performed a minimum of three times. Data represent the mean ± SD calculated from multiple independent experiments. Statistically significant differences for data points represent P < 0.05 and were calculated by using the unpaired t test. Quantitative real-time reverse transcription-PCR data were calculated with JMP 5 for Windows software (SAS Institute, Inc.). Differences between groups were estimated using the Student t test.
Acknowledgments
This study was supported by grants from National Natural Science Foundation of China (81201775).
Disclosure of Potential Conflicts of Interest
The authors have no conflict of interest.
Footnotes
Previously published online: www.landesbioscience.com/journals/cbt/article/26341
References
- 1.Cleator S, Parton M, Dowsett M. The biology of neoadjuvant chemotherapy for breast cancer. Endocr Relat Cancer. 2002;9:183–95. doi: 10.1677/erc.0.0090183. [DOI] [PubMed] [Google Scholar]
- 2.Hilton WM, Ercole B, Parekh DJ, Sonpavde G, Ghosh R, Svatek RS. Efficacy of combined intravesical immunotherapy and chemotherapy for non-muscle invasive bladder cancer. Expert Rev Anticancer Ther. 2011;11:949–57. doi: 10.1586/era.11.69. [DOI] [PubMed] [Google Scholar]
- 3.Lake RA, Robinson BW. Immunotherapy and chemotherapy--a practical partnership. Nat Rev Cancer. 2005;5:397–405. doi: 10.1038/nrc1613. [DOI] [PubMed] [Google Scholar]
- 4.Slovin S. Chemotherapy and immunotherapy combination in advanced prostate cancer. Clin Adv Hematol Oncol. 2012;10:90–100. [PubMed] [Google Scholar]
- 5.Recchia F, Candeloro G, Necozione S, Bisegna R, Bratta M, Rea S. Immunotherapy in patients with less than complete response to chemotherapy. Anticancer Res. 2009;29:567–72. [PubMed] [Google Scholar]
- 6.Ripani E, Sacchetti A, Corda D, Alberti S. Human Trop-2 is a tumor-associated calcium signal transducer. Int J Cancer. 1998;76:671–6. doi: 10.1002/(SICI)1097-0215(19980529)76:5<671::AID-IJC10>3.0.CO;2-7. [DOI] [PubMed] [Google Scholar]
- 7.Fong D, Moser P, Krammel C, Gostner JM, Margreiter R, Mitterer M, Gastl G, Spizzo G. High expression of TROP2 correlates with poor prognosis in pancreatic cancer. Br J Cancer. 2008;99:1290–5. doi: 10.1038/sj.bjc.6604677. [DOI] [PMC free article] [PubMed] [Google Scholar]
- 8.Mühlmann G, Spizzo G, Gostner J, Zitt M, Maier H, Moser P, Gastl G, Zitt M, Müller HM, Margreiter R, et al. TROP2 expression as prognostic marker for gastric carcinoma. J Clin Pathol. 2009;62:152–8. doi: 10.1136/jcp.2008.060590. [DOI] [PubMed] [Google Scholar]
- 9.Fong D, Spizzo G, Gostner JM, Gastl G, Moser P, Krammel C, Gerhard S, Rasse M, Laimer K. TROP2: a novel prognostic marker in squamous cell carcinoma of the oral cavity. Mod Pathol. 2008;21:186–91. doi: 10.1038/modpathol.3801001. [DOI] [PubMed] [Google Scholar]
- 10.Pak MG, Shin DH, Lee CH, Lee MK. Significance of EpCAM and TROP2 expression in non-small cell lung cancer. World J Surg Oncol. 2012;10:53. doi: 10.1186/1477-7819-10-53. [DOI] [PMC free article] [PubMed] [Google Scholar]
- 11.Wu H, Xu H, Zhang S, Wang X, Zhu H, Zhang H, Zhu J, Huang J. Potential therapeutic target and independent prognostic marker of TROP2 in laryngeal squamous cell carcinoma. Head Neck. 2012 doi: 10.1002/hed.23138. [DOI] [PubMed] [Google Scholar]
- 12.Fang YJ, Wang GQ, Lu ZH, Zhang L, Li JB, Wu XJ, Ding PR, Ou QJ, Zhang MF, Jiang W, et al. Different effects of ERβ and TROP2 expression in Chinese patients with early-stage colon cancer. Tumour Biol. 2012;33:2227–35. doi: 10.1007/s13277-012-0484-2. [DOI] [PubMed] [Google Scholar]
- 13.Ohmachi T, Tanaka F, Mimori K, Inoue H, Yanaga K, Mori M. Clinical significance of TROP2 expression in colorectal cancer. Clin Cancer Res. 2006;12:3057–63. doi: 10.1158/1078-0432.CCR-05-1961. [DOI] [PubMed] [Google Scholar]
- 14.Fang YJ, Lu ZH, Wang GQ, Pan ZZ, Zhou ZW, Yun JP, Zhang MF, Wan DS. Elevated expressions of MMP7, TROP2, and survivin are associated with survival, disease recurrence, and liver metastasis of colon cancer. Int J Colorectal Dis. 2009;24:875–84. doi: 10.1007/s00384-009-0725-z. [DOI] [PubMed] [Google Scholar]
- 15.Stepan LP, Trueblood ES, Hale K, Babcook J, Borges L, Sutherland CL. Expression of Trop2 cell surface glycoprotein in normal and tumor tissues: potential implications as a cancer therapeutic target. J Histochem Cytochem. 2011;59:701–10. doi: 10.1369/0022155411410430. [DOI] [PMC free article] [PubMed] [Google Scholar]
- 16.Goldstein AS, Lawson DA, Cheng D, Sun W, Garraway IP, Witte ON. Trop2 identifies a subpopulation of murine and human prostate basal cells with stem cell characteristics. Proc Natl Acad Sci U S A. 2008;105:20882–7. doi: 10.1073/pnas.0811411106. [DOI] [PMC free article] [PubMed] [Google Scholar]
- 17.Stoyanova T, Goldstein AS, Cai H, Drake JM, Huang J, Witte ON. Regulated proteolysis of Trop2 drives epithelial hyperplasia and stem cell self-renewal via β-catenin signaling. Genes Dev. 2012;26:2271–85. doi: 10.1101/gad.196451.112. [DOI] [PMC free article] [PubMed] [Google Scholar]
- 18.El Sewedy T, Fornaro M, Alberti S. Cloning of the murine TROP2 gene: conservation of a PIP2-binding sequence in the cytoplasmic domain of TROP-2. Int J Cancer. 1998;75:324–30. doi: 10.1002/(SICI)1097-0215(19980119)75:2<324::AID-IJC24>3.0.CO;2-B. [DOI] [PubMed] [Google Scholar]
- 19.Lü J, Izvolsky KI, Qian J, Cardoso WV. Identification of FGF10 targets in the embryonic lung epithelium during bud morphogenesis. J Biol Chem. 2005;280:4834–41. doi: 10.1074/jbc.M410714200. [DOI] [PubMed] [Google Scholar]
- 20.Ripani E, Sacchetti A, Corda D, Alberti S. Human Trop-2 is a tumor-associated calcium signal transducer. Int J Cancer. 1998;76:671–6. doi: 10.1002/(SICI)1097-0215(19980529)76:5<671::AID-IJC10>3.0.CO;2-7. [DOI] [PubMed] [Google Scholar]
- 21.Cubas R, Li M, Chen C, Yao Q. Trop2: a possible therapeutic target for late stage epithelial carcinomas. Biochim Biophys Acta. 2009;1796:309–14. doi: 10.1016/j.bbcan.2009.08.001. [DOI] [PubMed] [Google Scholar]
- 22.Varughese J, Cocco E, Bellone S, de Leon M, Bellone M, Todeschini P, Schwartz PE, Rutherford TJ, Pecorelli S, Santin AD. Uterine serous papillary carcinomas overexpress human trophoblast-cell-surface marker (Trop-2) and are highly sensitive to immunotherapy with hRS7, a humanized anti-Trop-2 monoclonal antibody. Cancer. 2011;117:3163–72. doi: 10.1002/cncr.25891. [DOI] [PMC free article] [PubMed] [Google Scholar]
- 23.Farivar TN, Najafipour R, Johari P. Nano - drug Delivery of Apoptosis Activator 2 to AGS Cells by Liposomes Conjugated with Anti-TROP2 Antibody. N Am J Med Sci. 2012;4:582–5. doi: 10.4103/1947-2714.103319. [DOI] [PMC free article] [PubMed] [Google Scholar]
- 24.Yang SH, Sharrocks AD, Whitmarsh AJ. MAP kinase signalling cascades and transcriptional regulation. Gene. 2013;513:1–13. doi: 10.1016/j.gene.2012.10.033. [DOI] [PubMed] [Google Scholar]
- 25.Chang L, Karin M. Mammalian MAP kinase signalling cascades. Nature. 2001;410:37–40. doi: 10.1038/35065000. [DOI] [PubMed] [Google Scholar]
- 26.Tang Y, Liu F, Zheng C, Sun S, Jiang Y. Knockdown of clusterin sensitizes pancreatic cancer cells to gemcitabine chemotherapy by ERK1/2 inactivation. J Exp Clin Cancer Res. 2012;31:73. doi: 10.1186/1756-9966-31-73. [DOI] [PMC free article] [PubMed] [Google Scholar]
- 27.Mayes PA, Degenhardt YY, Wood A, Toporovskya Y, Diskin SJ, Haglund E, Moy C, Wooster R, Maris JM. Mitogen-activated protein kinase (MEK/ERK) inhibition sensitizes cancer cells to centromere-associated protein E inhibition. Int J Cancer. 2013;132:E149–57. doi: 10.1002/ijc.27781. [DOI] [PMC free article] [PubMed] [Google Scholar]
- 28.Cubas R, Zhang S, Li M, Chen C, Yao Q. Trop2 expression contributes to tumor pathogenesis by activating the ERK MAPK pathway. Mol Cancer. 2010;9:253. doi: 10.1186/1476-4598-9-253. [DOI] [PMC free article] [PubMed] [Google Scholar]
- 29.Guerra E, Trerotola M, Aloisi AL, Tripaldi R, Vacca G, La Sorda R, Lattanzio R, Piantelli M, Alberti S. The Trop-2 signalling network in cancer growth. Oncogene. 2013;32:1594–600. doi: 10.1038/onc.2012.151. [DOI] [PubMed] [Google Scholar]
- 30.Watanabe M, Miyajima N, Igarashi M, Endo Y, Watanabe N, Sugano S. Sodium phenylacetate inhibits the Ras/MAPK signaling pathway to induce reduction of the c-Raf-1 protein in human and canine breast cancer cells. Breast Cancer Res Treat. 2009;118:281–91. doi: 10.1007/s10549-008-0215-y. [DOI] [PubMed] [Google Scholar]
- 31.Jing Y, Liu LZ, Jiang Y, Zhu Y, Guo NL, Barnett J, Rojanasakul Y, Agani F, Jiang BH. Cadmium increases HIF-1 and VEGF expression through ROS, ERK, and AKT signaling pathways and induces malignant transformation of human bronchial epithelial cells. Toxicol Sci. 2012;125:10–9. doi: 10.1093/toxsci/kfr256. [DOI] [PMC free article] [PubMed] [Google Scholar]
- 32.Mosmann T. Rapid colorimetric assay for cellular growth and survival: application to proliferation and cytotoxicity assays. J Immunol Methods. 1983;65:55–63. doi: 10.1016/0022-1759(83)90303-4. [DOI] [PubMed] [Google Scholar]
- 33.Zhang P, Sun D, Ke Y, Kaplan HJ, Shao H. The net effect of costimulatory blockers is dependent on the subset and activation status of the autoreactive T cells. J Immunol. 2007;178:474–9. doi: 10.4049/jimmunol.178.1.474. [DOI] [PMC free article] [PubMed] [Google Scholar]


