

A high-coverage potato tuber mitochondrial proteome uncovers many new proteins and functions, especially in coenzyme and iron metabolism, and many posttranslational modifications.
Abstract
Mitochondria are called the powerhouses of the cell. To better understand the role of mitochondria in maintaining and regulating metabolism in storage tissues, highly purified mitochondria were isolated from dormant potato tubers (Solanum tuberosum ‘Folva’) and their proteome investigated. Proteins were resolved by one-dimensional gel electrophoresis, and tryptic peptides were extracted from gel slices and analyzed by liquid chromatography-tandem mass spectrometry using an Orbitrap XL. Using four different search programs, a total of 1,060 nonredundant proteins were identified in a quantitative manner using normalized spectral counts including as many as 5-fold more “extreme” proteins (low mass, high isoelectric point, hydrophobic) than previous mitochondrial proteome studies. We estimate that this compendium of proteins represents a high coverage of the potato tuber mitochondrial proteome (possibly as high as 85%). The dynamic range of protein expression spanned 1,800-fold and included nearly all components of the electron transport chain, tricarboxylic acid cycle, and protein import apparatus. Additionally, we identified 71 pentatricopeptide repeat proteins, 29 membrane carriers/transporters, a number of new proteins involved in coenzyme biosynthesis and iron metabolism, the pyruvate dehydrogenase kinase, and a type 2C protein phosphatase that may catalyze the dephosphorylation of the pyruvate dehydrogenase complex. Systematic analysis of prominent posttranslational modifications revealed that more than 50% of the identified proteins harbor at least one modification. The most prominently observed class of posttranslational modifications was oxidative modifications. This study reveals approximately 500 new or previously unconfirmed plant mitochondrial proteins and outlines a facile strategy for unbiased, near-comprehensive identification of mitochondrial proteins and their modified forms.
Plant mitochondria participate in a number of processes in the plant cell depending on the cell, tissue, or organ type, the developmental stage, and the environmental conditions (Millar et al., 2011; Rasmusson and Møller, 2011). Important examples are energy metabolism, photorespiration, amino acid biosynthesis, coenzyme (vitamin) biosynthesis, and programmed cell death. All of these processes require that the mitochondria can exchange metabolic intermediates and information with the rest of the cell via membrane carriers and signaling pathways. Plant mitochondria also import more than 95% of their proteins across the inner and outer mitochondrial membranes (IMM and OMM, respectively). Finally, mitochondria are semiautonomous organelles capable of growing and dividing, and as such they perform DNA replication, DNA transcription, and protein biosynthesis, in addition to protein import.
All of these processes require proteins; therefore, the composition of the plant mitochondrial proteome changes depending on the conditions (Millar et al., 2005). It has been estimated that as many 2,000 to 3,000 gene products belong to the mitochondria in Arabidopsis (Arabidopsis thaliana), but it is not known how many are expressed in a single tissue under a specific set of conditions (Millar et al., 2005, 2006; Cui et al., 2011). To date, the most complete global proteomic study of isolated mitochondria identified 416 proteins in mitochondria from Arabidopsis cell cultures grown under standard conditions with no photosynthesis (Heazlewood et al., 2004). In the intervening years, a number of more focused proteomic studies have been performed mainly on Arabidopsis mitochondria, swelling the number of identified plant mitochondrial proteins to 660 nonredundant proteins (Heazlewood et al., 2004; Duncan et al., 2011; Klodmann et al., 2011; Lee et al., 2012; Tan et al., 2012). Missing from this list are many essential plant mitochondrial activities, including regulatory proteins, transcription factors, metabolite translocators, and the wealth of tRNA synthases and pentatricopeptide repeat (PPR) proteins (Havelund et al., 2013).
In yeast (Saccharomyces cerevisiae), about 850 proteins have been identified in isolated mitochondria, which is thought to provide 85% coverage of the proteome in this species (Premsler et al., 2009). A total of 1,117 proteins were identified in mitochondria from the nematode Caenorhabditis elegans (Li et al., 2009). The total mammalian mitochondria is predicted to contain 1,050 to 1,400 proteins (Calvo and Mootha, 2010), and a global proteomic study of mitochondria isolated from 14 mouse tissues using one-dimensional PAGE followed by liquid chromatography and two-dimensional mass spectrometry (LC-MS/MS) identified 1,098 different gene products (Pagliarini et al., 2008).
Considering that the total plant mitochondrial proteome is thought to contain almost twice as many proteins as the nematode and mammalian mitochondrial proteomes, it is likely that an in-depth proteomic study of one type of plant mitochondria would identify more than 1,000 proteins or about twice the previous most complete study. It is likely that newly discovered mitochondrial proteins would be of low abundance, which conceivably would lead to the discovery of new pathways and regulatory proteins, as well as providing additional information about established pathways.
In this study, we describe the proteome of potato (Solanum tuberosum) tuber mitochondria (POM). The potato tuber is a large, relatively homogenous storage organ, and POM are therefore expected to be similarly homogenous. There are well-established methods for isolating these mitochondria in a purified, intact, and functional form (Neuburger et al., 1982; Struglics et al., 1993; Considine et al., 2003), and their basic properties are therefore well characterized. In addition, the potato genome has recently been sequenced (Xu et al., 2011), which greatly simplifies the task of identifying potato proteins. Using a prefractionation by preparative SDS-PAGE followed by high-mass-accuracy LC-MS/MS, we have achieved a high proteome coverage of 1,060 proteins, discovered a number of new functions, and identified a large number of posttranslational modifications (PTMs), particularly oxidative modifications.
RESULTS
The Isolated POM Are Highly Purified
The isolation of pure organellar fractions from crude source material is the critical phase of any subproteome analysis. It has previously been established that very pure mitochondria can be obtained from potato tubers, which only contain 0.2% peroxisomes or plastids on a protein basis (Neuburger et al., 1982; Struglics et al., 1993; Considine et al., 2003). We employed this established procedure for the isolation of mitochondria with a recognized low contamination level.
We also tested the mitochondrial purity by western blotting using subcellular marker proteins. The proteins 14-3-3 and antienolase were used as reference markers for the cytosolic compartment, while α-carboxytransferase and pyruvate dehydrogenase E1 component subunit α (PDE1-α) were used as markers for the plastidic and the mitochondrial compartments, respectively. Anti-PDE1-α demonstrated the expected mitochondrial enrichment in the mitochondrial fraction, while there was no detectable cytosolic or plastidic contamination (Supplemental Fig. S1).
The Potato Tuber Mitochondrial Proteome Contains More Than 1,000 Proteins
Previous Arabidopsis mitochondrial proteome studies, both shotgun and targeted, have collectively identified a set of 660 nonredundant proteins (Heazlewood et al., 2004; Duncan et al., 2011; Klodmann et al., 2011; Lee et al., 2012; Tan et al., 2012). These studies employed primarily either two-dimensional gel electrophoresis or gel-free analyses followed by tandem mass spectrometry. In this study, we performed one-dimensional gel electrophoresis followed by liquid chromatography-tandem mass spectrometry (GeLC-MS/MS) to overcome the limitations of two-dimensional gels while allowing for preparative-level proteome interrogation. Using GeLC-MS/MS, proteins from each replicate were prefractionated by 12% SDS-PAGE and sectioned into 40 gel slices prior to trypsin digestion, effectively reducing sample complexity prior to LC-MS/MS (Fig. 1). To maximize the number of assignments, four complementary database-searching programs were employed simultaneously. Using a false discovery rate (FDR) cutoff of 1% at the protein level, this approach resulted in 7,346 assigned nonredundant peptides representing 1,060 protein groups, including 23 that are mitochondrially encoded. The average coverage was 24.9% (Table I; Supplemental Table S1).
Figure 1.

Work-flow chart for the isolation of mitochondria from potato tubers followed by protein separation, identification, and spectral counting-based quantification. First, mitochondria were isolated from potato tubers using Percoll gradients. Then, mitochondrial proteins were extracted and fractionated by SDS-PAGE. After gel segmentation, in-gel trypsin digestion was performed and peptides were injected into a liquid chromatography system coupled to a mass spectrometer. Database searching was carried out using four different algorithms (MS-GFDB, ProLuCID, MASCOT, and SEQUEST) and the potato genome database (http://www.potatogenome.net). The number of assigned tandem mass spectrometry spectra for each identified protein was determined, and the dNSAF was calculated for protein abundance estimation.
Table I. Functional distribution of the mitochondrial proteins from potato and Arabidopsis based on the functional classification made by Heazlewood et al. (2004).
The relative frequency (percentage) of proteins classified in each functional category in the Arabidopsis and potato proteome is shown. The fold change in protein numbers (potato/Arabidopsis) are in parentheses. The frequency of the relative protein abundance (percentage dNSAF) of each functional category in the potato proteome is also shown.
| Function | Arabidopsis |
Potato |
Percentage dNSAF | |||
|---|---|---|---|---|---|---|
| No. of Proteins | Percentage | No. of Proteins | Percentage | |||
| Energy | 98 | 23.6 | 125 | (1.3) | 11.8 | 11.5 |
| Metabolism | 81 | 19.5 | 216 | (2.6) | 20.4 | 21.1 |
| Protein fate | 53 | 12.7 | 102 | (1.9) | 9.6 | 9.3 |
| DNA synthesis and processing | 9 | 2.2 | 23 | (2.6) | 2.2 | 1.8 |
| Transcription | 8 | 1.9 | 13 | (1.6) | 1.2 | 0.9 |
| RNA processing | 14 | 3.4 | 104 | (7.4) | 9.8 | 11.1 |
| Protein synthesis | 15 | 3.6 | 126 | (8.4) | 11.9 | 12.0 |
| Defense, stress, detoxification | 16 | 3.8 | 30 | (1.9) | 2.8 | 2.8 |
| Communication/signaling | 19 | 4.6 | 39 | (2.1) | 3.7 | 3.8 |
| Transport | 19 | 4.6 | 59 | (3.5) | 5.6 | 5.1 |
| Miscellaneous | 4 | 1.0 | 0 | 0 | 0.0 | 0 |
| Structural organization | 9 | 2.2 | 5 | (0.6) | 0.5 | 0.3 |
| Unknown | 71 | 17.1 | 218 | (3.1) | 20.6 | 20.2 |
| Total | 416 | 1,060 | (2.5) | |||
Figure 2 shows the overlapped peptides and proteins identified using MS-GFDB (Kim et al., 2010), ProLuCID (Xu et al., 2006), SEQUEST (Eng et al., 1994) and MASCOT (Perkins et al., 1999). A comparison of these different search algorithms revealed that MS-GFDB outperformed the other search engines by identifying 85% of the total peptides, compared with 76% identified by ProLuCID, 46% by SEQUEST, and 37% by MASCOT.
Figure 2.

Numbers of peptides (A) and proteins (B) identified using different database search engines with a less than 1% protein FDR identification. The total numbers of nonredundant peptides and proteins were 7,346 and 1,060, respectively.
Evaluation of the Mitochondrial Proteome by Transient Fluorescence Assay in Tobacco Epidermal Cells
To evaluate the false positive rate of the mitochondrial proteome data, 20 different proteins were selected for further evaluation (Fig. 3; Supplemental Table S2; Supplemental Fig. S2). These selected proteins either were of relatively low abundance and/or their mitochondrial localization was at variance with previous reports. In other words, they were potential contaminants. An enhanced yellow fluorescent protein (EYFP) fluorescence tag was in frame fused at their C termini; each construct was mixed with a mitochondrial marker (CD3-986) and cotransformed into tobacco (Nicotiana tabacum) leaves for subcellular localization by fluorescence microscopy. Out of the total 20 constructs, 19 were detected in tobacco leaves at variable levels, and 18 of them were confirmed to localize to mitochondria. PGSC0003DMP400005581, which encodes a putative inorganic pyrophosphatase, was found to localize to chloroplasts (Fig. 3). Its ortholog in Arabidopsis (At5g09650) was confirmed to localize to chloroplasts (Schulze et al., 2004). So this protein is likely to be a contaminant.
Figure 3.
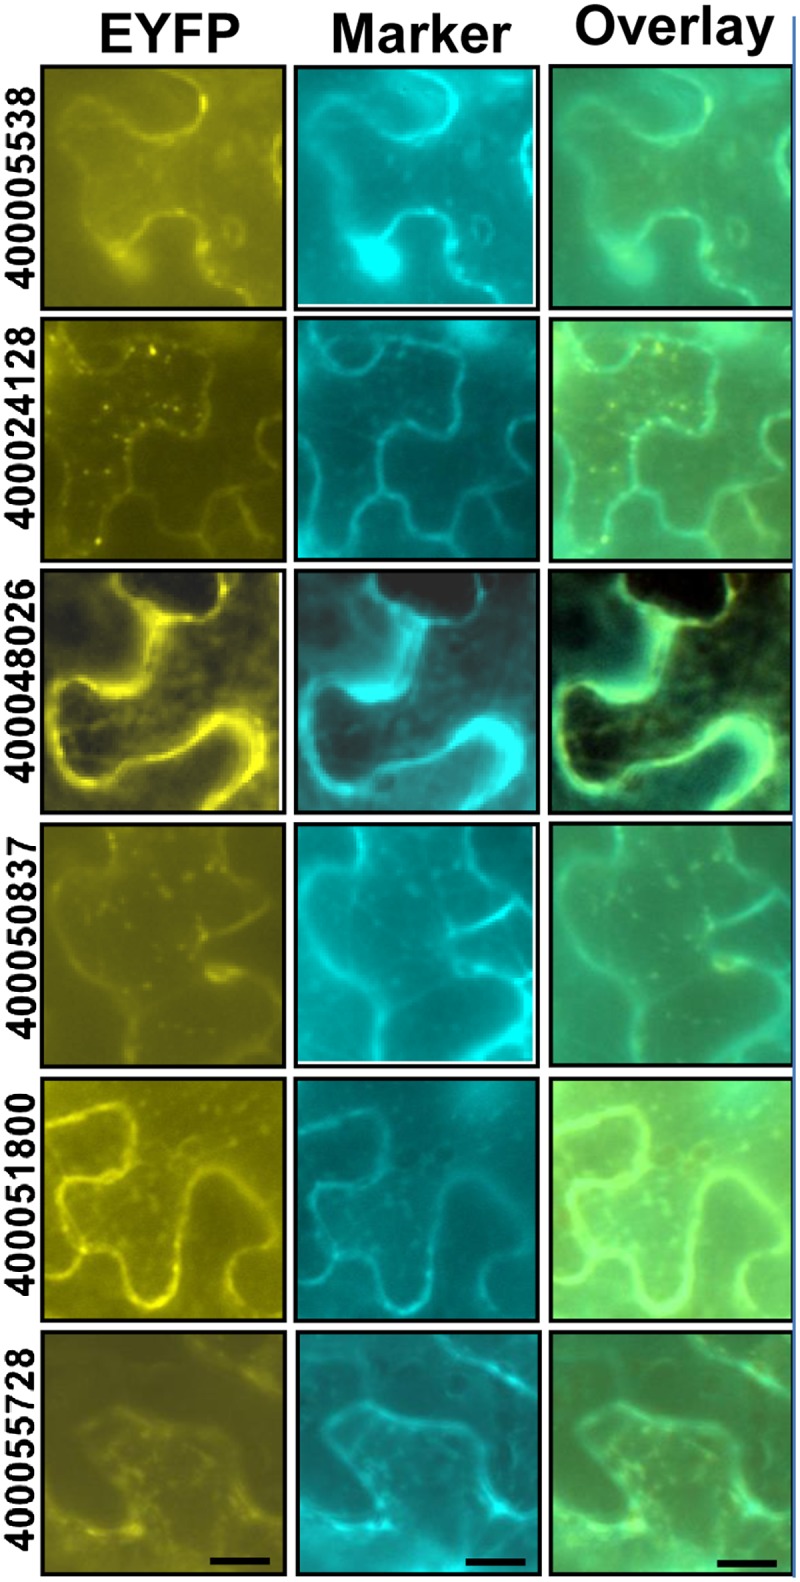
Subcellular localization study on a selected subset of proteins identified in this study. Twenty proteins that were identified in purified POM (Supplemental Table S2) were in-frame fused with the EYFP fluorescence tag and then transiently coexpressed with the mitochondrial marker CD3-986 in tobacco epidermal cells. The left lane shows the EYFP fluorescence of six out of the 19 constructs where expression was detected. The center lane shows the fluorescence of the mitochondrial marker. The right lane shows an overlay between the two types of fluorescence, and green color indicates the coincidence of the two probes (i.e. mitochondrial localization). The remaining 13 constructs are shown in Supplemental Figure S2. Bars = 12.5 μm.
Two proteins (PGSC0003DMP400035788 and PGSC0003DMP400024128) were found with dual localization. PGSC0003DMP400035788, annotated as a PPR-containing protein, was found to localize to both mitochondria and chloroplasts (Supplemental Fig. S2). Its ortholog in Arabidopsis (At3g46870) was identified as a plastid protein by organellar proteomics (Kleffmann et al., 2004); it also was identified as a Zn2+-immobilized metal affinity chromatography interaction protein in mitochondria (Tan et al., 2010). Its dual localization confirmation here resolved the controversy between these two independent investigations (Kleffmann et al., 2004; Tan et al., 2010). PGSC0003DMP400024128, which encodes RNA-BINDING PROTEIN24-LIKE, was found to localize to mitochondria and another unknown organelle (Supplemental Fig. S2). This protein has low abundance, and none of the subcellular prediction algorithms predicted it to localize to mitochondria.
Two proteins (PGSC0003DMP400012523 and PGSC0003DMP400050514) were observed to localize to mitochondria (Supplemental Fig. S2), and these observations contradict previous reports. The Arabidopsis ortholog of PGSC0003DMP400012523 (At1g78590) was reported to localize to the cytosol, although that conclusion is open to question, as no cytosolic marker was used (Chai et al., 2006). The Arabidopsis ortholog of PGSC0003DMP400050514 (At2g37250) was reported to locate to chloroplasts (Carrari et al., 2005). Since this Arabidopsis ortholog falls into the same phylogenetic group as the potato plastidial isoform of adenylate kinase, with which it showed 76% identity, it will require additional phylogenetic analysis to determine their orthologs. The existence of a mitochondrial isoform of adenylate kinase in potato tuber was first reported by Roberts et al. (1997).
In summary, these EYFP localization results are consistent with the conclusion that the POM are highly purified and that no more than 5% of the 1,060 identified mitochondrial proteins are false positives. This ratio could well be overestimated, since the candidates for the localization study were purposely selected based on their low abundance and their contradiction with reported results in the literature.
Categorization of the Identified Proteins According to Properties and Functions
Considering proteins only detected in at least two replicates, we have identified 884 protein groups (Supplemental Table S3), of which 32% were confirmed by ortholog analysis when compared with the Arabidopsis mitochondrial proteome (Heazlewood et al., 2004; Duncan et al., 2011; Klodmann et al., 2011; Lee et al., 2012; Tan et al., 2012). Thus, 528 new nonorthologous proteins are presented in this study, in comparison with all previous Arabidopsis mitochondrial proteome investigations. As shown in Figure 4, the potato mitochondrial proteins were distributed between 4 and 161 kD in size, between −0.9 and +0.3 in grand average hydropathy (GRAVY) score, and with pI values ranging from 4 to 11. A comparison of the physical properties of the potato versus the Arabidopsis mitochondrial proteome (Heazlewood et al., 2004) demonstrates that a much larger number of small proteins with negative GRAVY scores have been identified in the potato mitochondrial proteome (Fig. 4).
Figure 4.

Properties of the potato mitochondrial proteome (n = 1,060) as compared with the Arabidopsis mitochondrial proteome (n = 416; Heazlewood et al., 2004). Distribution of molecular mass (kD), pI, and GRAVY score are shown. A disproportionately large number of low-molecular-weight proteins with negative GRAVY scores were identified in the potato mitochondrial proteome.
Assigned potato mitochondrial proteins were annotated by BLAST querying against the nonredundant National Center for Biotechnology Information (NCBI) database and were classified based on the Gene Ontology terms related to biological process and molecular function (Supplemental Fig. S3). In addition, each protein was assigned to 13 general functional categories according to the classification by Heazlewood et al. (2004). The distribution of proteins classified in each category is compared between potato and Arabidopsis mitochondrial proteomes (Table I). The largest functional classes in the potato mitochondrial proteome were energy (12%), metabolism (20%), and protein synthesis (12%). Altogether, these proteins represent 45% of total protein abundance based on distributed normalized spectral abundance factor (dNSAF). These proteins are mainly involved in the tricarboxylic acid cycle, oxidative phosphorylation, and protein synthesis (mainly ribosomal and tRNA synthetase proteins). Around 23% of the identified proteins (also 23% of the abundance) were categorized in the RNA processing, DNA synthesis and processing, transcription, or protein fate classes. In addition, approximately 12% of the identified proteins (also 12% of the abundance) were related to transport, defense/detoxification, or signaling processes.
The number of proteins found in each functional category was higher for potato than for Arabidopsis, with the exception of structural organization, although the increase for the energy category was relatively small (1.3-fold; Table I). The most marked increase in the number of proteins identified was seen for RNA processing and protein synthesis, where 7.4- and 8.4-fold more proteins were found in potato, but also the category transport showed a large increase (3.6-fold). The relative frequency (%) of proteins in each category was very similar, with the exception of the energy category, which was significantly lower in potato, and RNA processing and protein synthesis, which were significantly higher. Unclassified proteins (i.e. proteins not confidently assigned to any functional class) constituted 21% of the total number of identified proteins (20% of the abundance) in the potato mitochondrial proteome (Table I).
A number of new proteins and enzymes were identified that increase our coverage of known mitochondrial processes and, more interestingly, extend the list of mitochondrial processes, for instance with respect to coenzyme and iron metabolism. This will be treated in “Discussion.”
The Abundance of Mitochondrial Proteins Varies More Than 1,800-Fold
It has been shown that in LC-MS/MS-based analysis of peptide mixtures, raw spectral counts correlate with relative protein abundance between different samples (Liu et al., 2004; Stevenson et al., 2009; Matros et al., 2011). However, to compare the relative abundance of different proteins within the same biological sample, spectral counts for each protein must be normalized. One of the most logical and promising strategies for normalization is based on protein length (Zhang et al., 2010).
In this work, proteins that were detected in at least two replicates (884 proteins) were assigned an abundance factor (Supplemental Table S3). For this, we calculated the dNSAF, which considers unique spectral counts and distributes the shared spectral counts matched to peptides assigned to homologous proteins. Spectral counts of each protein were then normalized by protein length (for details, see “Materials and Methods”).
Figure 5 shows the log10 transformed dNSAF distribution of the 884 potato mitochondrial proteins. Each bin corresponds to a 0.25 order of magnitude difference in the protein abundance. In this way, the potato mitochondrial protein abundance spans 3 orders of magnitude, ranging from −4.82 to −1.57 log10 values (Supplemental Table S3), giving a dynamic range of about 1,800-fold as calculated by the dNSAF. This is likely a low estimate of the dynamic range, as the most abundant proteins may be underestimated. The least abundant protein detected in the potato proteome was an RNase (GI 255538392), and the most abundant protein was a phosphate carrier protein (GI 255543593). Considering the previous mitochondrial study in Arabidopsis (Heazlewood et al., 2004), this study significantly increased the coverage of both low- and high-abundance proteins. For example, 53 predicted mitochondrial ribosomal proteins were confidently detected in at least two replicates in this study with an average abundance of −2.68 [log10(dNSAF)], against only three ribosomal proteins detected in the previous Arabidopsis study (Heazlewood et al., 2004). Also, 52 proteins involved in the uptake of a variety of metabolites (ADP/ATP, dicarboxylate, fumarate/succinate, phosphate, malate), including membrane carriers, transporters, and porins, were identified in the potato mitochondrial proteome with an average abundance of −3.31, while all previous Arabidopsis studies detected 19 proteins related to the same functional class. Proteins with well-known roles in primary mitochondrial metabolism, including proteins involved in oxidative phosphorylation via the respiratory complexes and proteins from the tricarboxylic acid cycle, were detected with an average abundance of −2.82, constituting around 28% of total protein abundance. We also quantified low-abundance proteins like those involved in RNA processing. For example, we quantified 62 PPR proteins, which have almost 2 orders of magnitude difference in expression levels (from −4.67 to −2.69 [log10(dNSAF)]; Supplemental Table S3).
Figure 5.

Abundance distribution of the potato mitochondrial proteome. Mitochondrial localization prediction results are superimposed on the protein abundance (spectral counting) [log10(dNSAF)]. Plus signs indicate mitochondrial localization by as many as five prediction programs, and the minus sign indicates localization by none. Each category on the x axis corresponds to a 0.25 order of magnitude difference in the abundance of proteins. The difference between the most abundant and the least abundant proteins was 1,778-fold. The abundance calculation for all proteins is found in Supplemental Table S3.
An overview of the number and abundance of the identified proteins belonging to major mitochondrial metabolic pathways is shown as heat maps in Figures 6 and 7. Figure 6 shows the whole mitochondrion, with processes placed in the known or presumptive mitochondrial subcompartments (OMM, intermembrane space, IMM, matrix), while Figure 7 shows the respiratory complexes and a few associated enzymes located in the IMM. Spectral counting should not be used to determine the stoichiometry of subunits in a complex, particularly membrane complexes. Having said that, the apparent wide variation in the amounts of the subunits (e.g. of complex V) is mainly due to the presence of low-abundance paralogs (Supplemental Table S3). If we compare the relative abundances of all the F1-ATPase subunits identified, they range between −3.72 and −1.96 [log10(dNSAF)], or almost 100-fold (Supplemental Table S3). However, if we only compare the most abundant paralogs of each of the five subunits identified, the range is much more narrow, between −2.91 and −1.96 [log10(dNSAF)], which is about 10-fold or about the same range as the expected 3:3:1:1:1 stoichiometry of the α, β, γ, δ, and ε subunits (von Ballmoos et al., 2009).
Figure 6.

Schematic representation showing proteins that were identified by GeLC-MS/MS in the mitochondrial preparation of potato tubers. Squares represent protein identification and abundance based on spectral counting. Each color represents a range of log10-transformed dNSAF (bottom left). Numbers in parentheses represent numbers of proteins found within the same range of abundance. Respiratory chain complexes are shown in detail in Figure 7. Black text indicates metabolic intermediates, and gray text indicates enzymes or proteins. ABC, ATP-binding cassette transporter; AC, aconitase; ACOT, acyl-CoA thioesterase9; ACS, long-chain acyl-CoA synthetase9; AlaAT, Ala aminotransferase; AOX, alternative oxidase; APX, ascorbate peroxidase; ASC; ascorbate; AspAT, Asp aminotransferase; BCKDH, branched-chain α-keto acid dehydrogenase; CI to CV, respiratory chain complexes I to V; CAC, carnitine/acylcarnitine carrier protein; Clp, ATP-dependent protease; CoA DHase, isovaleryl-CoA dehydrogenase; CS, citrate synthase; DHA, dehydroascorbate; DHAR, dehydroascorbate reductase; DIC, mitochondrial dicarboxylate carrier protein; DiT1, oxoglutarate malate transporter; d-LDH, d-lactate dehydrogenase; E1α, pyruvate dehydrogenase subunit α; E1β, pyruvate dehydrogenase subunit β; E2, dihydrolipoamide S-acetyltransferase; E3, dihydrolipoamide dehydrogenase; ECR, trans-2-enoyl-CoA reductase; EH, enoyl-CoA hydratase; ER, enoyl-acyl-carrier protein reductase; ETF, electron transfer flavoprotein; FCL, 5-formyltetrahydrofolate cycloligase; FDF, formyltetrahydrofolate deformylase-like; FUM, fumarase; GABA, γ-aminobutyric acid; GABA-T, γ-aminobutyric acid transaminase; GDC, Gly decarboxylase complex; GDH, Glu dehydrogenase; Gly-I, lactoylglutathione lyase; Gly-II, hydroxyacylglutathione hydrolase3; GPX, glutathione peroxidase; GR, glutathione reductase; GRX, glutaredoxin; GSH, reduced glutathione; GSSG, oxidized glutathione; GST, glutathione S-transferase; HAD, hydroxyacyl-thioester dehydratase; HMG lyase, hydroxymethylglutaryl-CoA lyase; ICDH, isocitrate dehydrogenase; Isc, iron-sulfur cluster assembly protein; MCAT, acyl-carrier protein S-malonyltransferase; MCC, 3-methylcrotonyl-CoA carboxylase; MCD, malonyl-CoA decarboxylase; MCP, mitochondrial carrier proteins; MDH, malate dehydrogenase; MDHA, monodehydroascorbate; MDHAR, monodehydroascorbate reductase; Me, methyl; MFT, mitochondrial folate transporter/carrier-like; MG hydratase, methylglutaconyl-CoA hydratase; MnSOD, superoxide dismutase; MPP, mitochondrial processing peptidase; mtDNA, mitochondrial DNA; NAD-ME, NAD-dependent malic enzyme; NDT, NAD transporter; 2-OGDH, 2-oxoglutarate dehydrogenase; P or Pi, inorganic phosphate; PDK, pyruvate dehydrogenase kinase; PGP, phospholipid hydroperoxide glutathione peroxidase; PHB, prohibitin; PIC, phosphate carrier protein; PRDX, peroxiredoxin; PSP, presequence protease; SAM, S-adenosyl-Met; SAMC, S-adenosyl-Met carrier protein; SAM-T, S-adenosyl-Met-dependent methyltransferase; SCaMC, calcium-binding mitochondrial carrier protein; SDH, succinate dehydrogenase; SFC, succinate/fumarate mitochondrial transporter; SHMT, Ser hydroxymethyltransferase; SSA, succinic semialdehyde; SSAD, succinic semialdehyde dehydrogenase; sucCoA-syn, succinyl-CoA synthetase; THF, tetrahydrofolate; ThPP, thiamine pyrophosphate; TIMs, import inner membrane translocases; TOMs, outer membrane translocases; TPC, thiamine pyrophosphate carrier; tRNAs, tRNA synthetases; TXNRD, thioredoxin reductase; TX-SH, thioredoxin reduced; TX-SS, thioredoxin oxidized; UCP, uncoupling protein; VDAC, voltage-dependent anion channel.
Figure 7.

Schematic representation showing the proteins identified by GeLC-MS/MS related to the functionality of mitochondrial respiratory chain complexes. AOX, Alternative oxidase; ATPase, ATP synthase; CI to CV, respiratory chain complexes I to V; Cyt B, cytochrome b; Cyt C, cytochrome c; Cyt c1, cytochrome c1; COX, cytochrome oxidase; Ddh, dihydroorotate dehydrogenase; ETF, electron transfer flavoprotein; exNDH, external NADH-ubiquinone oxidoreductase; GLDH, l-galactono-1,4-lactone dehydrogenase; inNDH, internal NADH-ubiquinone oxidoreductase; NAD-DH, NADH dehydrogenase (ubiquinone) subcomplex; Succ DH, succinate dehydrogenase; UCP, uncoupling protein; UQox, ubiquinone oxidized; UQred, ubiquinone reduced.
Prediction Programs for Mitochondrial Localization Recognize 63% of All Identified Proteins
There are a large number of programs available to predict subcellular localization based on the N-terminal region of proteins that may contain intrinsic targeting peptides (Schneider and Fechner, 2004). The protein sequences of the identified mitochondrial proteome were analyzed by five different prediction programs: TargetP (Emanuelsson et al., 2000), Predotar version 1.03 (Small et al., 2004), MitoProtII (Claros and Vincens, 1996), iPSORT (Bannai et al., 2002), and WoLF PSORT (Horton et al., 2007). Each program employs different methods for subcellular prediction and usually produces relatively large nonoverlapping sets of results (Heazlewood et al., 2004). Each prediction tool returned a variable percentage of mitochondrial positives, ranging from approximately 20% (WoLF PSORT) to 52% (MitoProtII) of the potato proteome (Supplemental Table S4). We also performed a relational evaluation of the overlapping positive predictions by different combinations of the prediction tools. When we considered multiple prediction tools together, the number of positive mitochondrial predictions decreased (Supplemental Table S4), indicating a much smaller agreement between programs. The combination of MitoProtII and iPSORT provided the best pair for prediction, resulting in 37% positive potato mitochondrial predicted proteins (Supplemental Table S4).
In all, 671 out of 1,060 proteins (63% of the total protein set) were predicted to be mitochondrial by at least one program, while 48% were predicted by two or more programs (Fig. 8). From the list of 389 proteins not predicted to be mitochondrial by any program, 44 proteins were confirmed OMM or IMM proteins related to the protein import system and uptake of metabolites (carriers, transporters, channels, and translocases), which are characterized by the absence of N-terminal targeting presequences (Millar and Heazlewood, 2003; Huang et al., 2010). In addition, 31 well-known mitochondrial proteins involved in the tricarboxylic acid cycle and the respiratory complexes, as well as 11 proteins encoded by mitochondrial genes, were also negative for mitochondrial localization prediction. These results show the limitations in assigning mitochondrial localization based solely on bioinformatics tools. The choice of prediction program can benefit different classes of proteins, and the absence of targeting presequences, due to the genuine lack of those N-terminal targeting signaling sequences (e.g. OMM or IMM proteins or mitochondrially encoded proteins) or due to incorrect annotation of the N termini of the sequences, can result in erroneous interpretation.
Figure 8.

Mitochondrial localization prediction (by iPSORT, MitoProtII, Predotar, TargetP, and WoLF PSORT). Plus signs indicate prediction to be mitochondrial by one to five programs, and the minus sign indicates prediction by none. Note that about 35% of the mitochondrial proteome (both potato and Arabidopsis) is not predicted to be mitochondrial by any of the five prediction programs. Combination details of the predictions are given in Supplemental Table S4.
In Figure 5, the subcellular prediction information is superimposed on the relative protein abundance. The data reveal that prediction results are comparable irrespective of protein abundance, suggesting that low-abundance proteins must also be considered as authentic mitochondrial proteins.
Proteins with Uncleaved N-Terminal Sequences Are Sometimes Further Processed
Semitryptic database querying resulted in 37 matches to the protein N terminus, indicating that these proteins do not contain a cleavable targeting peptide. Some of these peptides had the terminal Met removed, while others did not. The removal of the Met can be related to the length of the side chain of the second amino acid in the sequence (Giglione and Meinnel, 2001). If the second amino acid is Ala, Gly, Pro, Ser, or Thr, the initiating Met is removed by a Met aminopeptidase. On the other hand, if the side chain is large, in the case of Arg, Asn, Asp, Glu, Ile, Leu, or Lys, the Met is retained. Only Val appears to have an intermediate side chain specificity for Met cleavage, showing the initiating Met cleaved or uncleaved. As shown in Supplemental Table S5, our results confirm this specificity. The Met was removed when the second side chain was Lys, Ala, Pro, Ser, Thr, or Val and not removed when it was Lys, Asn, Asp, or Gln. Surprisingly, when the second residue was Gly, some sequences had Met removed but others did not.
Many of the proteins identified with an uncleaved N terminus were OMM proteins, including porins, or components of the respiratory complexes present in the IMM, such as NADH dehydrogenase, bc1 complex, and ATPase. Additionally, two mitochondrially encoded proteins were identified with intact N termini: a ribosomal protein (STmpRH_41) and a NADH dehydrogenase subunit (STmpRH_8; Supplemental Table S1).
The Majority of Proteins in the Potato Mitochondrial Proteome Are Posttranslationally Modified
The potato mitochondrial proteome was extensively searched for different types of PTMs (Supplemental Tables S6 and S7). We identified 3,066 PTM sites in a total of 556 proteins, which means that 52% of the entire potato mitochondrial proteome determined here exists in modified versions. Individual proteins contained up to eight types of PTMs and up to 50 different modification sites. The proteins with the most modifications (aconitase, 2-oxoglutarate dehydrogenase, succinate dehydrogenase, and Gly dehydrogenase) are all part of the tricarboxylic acid cycle or associated with it (Supplemental Table S7).
Mitochondria are not only the sites of oxygen consumption but also one of the sources of cellular reactive oxygen species (ROS; Møller, 2001). Therefore, we specifically focused our analyses on protein oxidation in the potato mitochondrial proteome. Oxidative modifications of Arg, Pro, Lys, Met, Thr, and Trp were detected. A total of 505 proteins contained at least one type of oxidative modification, giving a total of 2,471 sites of modification. As shown in Figure 9, Met sulfoxidation followed by Pro oxidation (either hydroxylation or carbonylation) and Lys hydroxylation are the most abundant types of PTMs in the proteome. Most of the modified proteins participate in the tricarboxylic acid cycle, respiratory complexes, protein import assembly, and protein synthesis (ribosomal proteins; Supplemental Table S7). The high frequency of Met sulfoxidation is in accordance with several reports that found sulfur amino acids to be more sensitive to oxidation by ROS than other amino acids (Stadtman et al., 2005).
Figure 9.

PTMs in the potato mitochondrial proteome. The list of PTMs analyzed can be found in Supplemental Table S6. Of the 1,060 potato mitochondrial protein groups, 559 (53%) had at least one PTM. Met oxidation followed by Pro and Lys oxidation are the most abundant types of PTM. Individual proteins contained up to nine types of PTMs (Supplemental Table S7).
Carbonylated proteins include both high- and low-abundance proteins spanning a variety of metabolic pathways (energy, metabolism, protein and DNA synthesis, protein fate, and transport). Among the highly abundant carbonylated proteins (abundance from −2.99 to −1.56 [log10(dNSAF)]), up to 50 oxidation sites were mapped to a single protein, Gly dehydrogenase (Supplemental Table S7). Other examples were proteins involved in the tricarboxylic acid cycle (aconitase, 2-oxoglutarate dehydrogenase, succinate dehydrogenase, citrate synthase, and isocitrate dehydrogenase), respiratory complexes (ATPase, cytochrome c1, and cytochrome c oxidase), chaperonins, carrier proteins (phosphate, oxoglutarate, and ADP/ATP), pyruvate dehydrogenase complex (E1 α- and β-subunits), and redox metabolism (peroxiredoxin, manganese [Mn]-superoxide dismutase [SOD], and monodehydroascorbate reductase). Many low-abundance proteins (−4.65 to −3.0 [log10(dNSAF)]) also showed a large number of oxidation sites, up to 25 sites. Proteins with more than 10 oxidation sites include FtsH proteases, monoxygenase, ATPase, and branched-chain α-keto acid dehydrogenase (Supplemental Table S7).
We also detected Asn deamidation (188 proteins), Lys acetylation (31 proteins) and methylation (63 proteins), and Ser/Thr phosphorylation (19 proteins). These proteins showed a wide range of relative abundance (−4.56 to −1.56 [log10(dNSAF)]) and constituted components of the tricarboxylic acid cycle and associated enzymes, chaperone system, respiratory complexes, protein import system, RNA processing, and carrier proteins.
DISCUSSION
The discord between the number of predicted and reported plant mitochondrial proteins is strikingly high, probably more so than for any other organelle. Despite this discord, no shotgun proteomic study of plant mitochondria has been published since 2005. Many advances in proteomics have occurred during the intervening time, including the development of best practices for unbiased protein prefractionation, sensitive and higher accuracy mass spectrometers, as well as various refinements in mass spectral data querying. In this study, we leverage developments on each of these fronts to offer a quantitative, unbiased, and comprehensive proteome resource for the plant mitochondrial community, including about 500 new experimentally identified plant mitochondrial proteins. We estimate that the coverage of the mitochondrial proteome is high (possibly as high as 85%; see Supplemental Text S1). Since the theoretical size of the plant mitochondrial proteome is about twice the size of the potato tuber proteome, it is likely that the specialized and physiological conditions of the tissue and its mitochondria placed a limit on the number of proteins identified. Thus, we can discuss not only proteins found but also comment with some confidence on proteins or protein groups underrepresented. This will be a recurrent theme in the following discussion as well as in Supplemental Text S1.
Prediction Programs
A comparison of five different subcellular localization prediction programs (TargetP, Predotar, MitoProtII, iPSORT, and WoLF PSORT) revealed a variable number of mitochondrial predictions, ranging from 20% to 52% of the entire experimentally determined mitochondrial proteome (Fig. 8; Supplemental Table S4). These values are low compared with the previous values of 70% to 90% reported in the original articles for these programs (Claros and Vincens, 1996; Emanuelsson et al., 2000; Small et al., 2004). This could be the result of bias in the protein training sets used in developing the programs. Also, we found that the combination of multiple prediction programs showed low numbers of overlapping positive predictions, indicating the divergence of the prediction methods employed by each tool. Overall, 63% of the potato mitochondrial proteome was predicted to be mitochondrially localized by at least one of the five prediction tools (Fig. 8; Supplemental Table S4). However, authentic mitochondrial proteins involved in the tricarboxylic acid cycle and the respiratory complexes as well as proteins characterized by the absence of targeting presequences (OMM or IMM and mitochondrially encoded proteins) were erroneously predicted to be nonmitochondrial. The number of such false negatives was only partially offset by the use of different algorithms, indicating that the results returned by such tools should be inspected carefully. False positives appear to be less of a problem with these prediction programs. Nevertheless, even if a protein is not predicted to be mitochondrial, one should not assume that it is a contaminant, as the accuracy of these programs is both variable and limited. As most of these programs are decades old, the development of new, improved programs, based on more comprehensive genomic sequences and proteomics data, is required to overcome the lack of accuracy observed.
Basic Metabolic Processes
The coverage of the well-known mitochondrial functions (tricarboxylic acid cycle, respiratory chain, transmembrane transporters, and turnover of amino acids, proteins, lipids, and fatty acids) was high, as shown in Figures 6 and 7 and listed in Supplemental Table S1. A detailed discussion of the potato tuber proteins identified for each group as well as for glycolysis and signaling is found in Supplemental Text S1. In the following, we will discuss a number of interesting protein groups linked to other important mitochondrial functions.
Biosynthesis of Coenzymes and Pyrimidines
Vitamins are coenzymes, which humans are unable to synthesize but acquire through their food, mostly from plants. Mitochondria are involved in the biosynthesis of several of the coenzymes in plant cells, and we have found a number of key enzymes in these processes, some of which have previously only been predicted.
Although NAD+ is the main pyridine coenzyme in mitochondria, a number of enzymes use NADP+ (Rasmusson and Møller, 1990; Møller and Rasmusson, 1998). NAD+ uptake into plant mitochondria was discovered in the 1980s using POM (Neuburger et al., 1985), but NADP+ uptake has also been inferred at least for pea (Pisum sativum) leaf mitochondria (Bykova and Møller, 2001). We here identify a NAD+ carrier as well as a NADH kinase (Supplemental Table S1). Three NAD(H) kinases are found in Arabidopsis, and one of them, nucleoside diphosphate kinase3, which appears to prefer NADH as substrate over NAD+, has been reported to be localized to peroxisomes in higher plants, while its analog in yeast is mitochondrial (Waller et al., 2010). The POM NADH kinase is predicted to be mitochondrial by three prediction programs and is of relatively low abundance (−3.87 [log10(dNSAF)]; Fig. 5; Supplemental Tables S1 and S3). Thus, in order to generate the NADP+/NADPH pool inside the POM, it appears that NAD+ is taken up, reduced by one of the many matrix dehydrogenases (e.g. in the tricarboxylic acid cycle), and then phosphorylated to give NADPH. This does not imply that NADPH/NADP+ ratios in the mitochondria are determined by this pathway; rather, the generation of the overall NADP+/NADPH pool size would be governed by the activities of the NAD+ transporter and the NADH kinase.
l-Galactono-1,4-lactone dehydrogenase, the last enzyme in one of the ascorbate biosynthetic pathways, which donates electrons to complex IV on the outer surface of the IMM (Bartoli et al., 2000) but is physically associated with complex I (Pineau et al., 2008), was found at above median quantities. Five different enzymes using ascorbic acid mainly for ROS detoxification were also found (see below). Clearly, ascorbate must be imported in some form, but the mitochondrial carrier protein family does not appear to include a carrier for ascorbate or dehydroascorbate (Taylor et al., 2010; Palmieri et al., 2011), and no such carrier was found in our study.
Tetrahydrofolate (vitamin B9) and its derivatives catalyze the addition or removal of C1 units (e.g. in the Gly decarboxylate reaction in the mitochondrial matrix, where a methyl group is transferred from one Gly molecule to another to form Ser). Folates consist of a pterin moiety, a p-aminobenzoate moiety, and a (poly)Glu tail, and the three parts are assembled in the mitochondria (Blancquaert et al., 2010). In the POM, we have found three enzymes involved in folate biosynthesis (dihydropterin pyrophosphokinase-dihydropteroate synthase, a molybdopterin biosynthesis protein, and polypolyglutamate synthase), four enzymes involved in the interconversion and transfer of different C1 units (5-formyltetrahydrofolate cycloligase, formyltetrahydrofolate deformylase-like, methenyltetrahydrofolate synthase domain-containing protein-like, and 5-methyltetrahydropteroyltriglutamate-homocysteine methyltransferase-like), and finally a folate carrier responsible for exporting folate to make the coenzyme available to the rest of the cell.
Biotin (vitamin B8) is a coenzyme involved in carboxylations, and the last steps in its biosynthesis are mitochondrial (Alban, 2011). We found the S-adenosyl-Met carrier responsible for the import of one of the precursors, but it was not predicted to be mitochondrial by any of the prediction programs. We also detected the adrenodoxin reductase involved in biotin biosynthesis and predicted to be mitochondrial by three programs (Supplemental Table S1). The adrenodoxin reductase uses adrenodoxin to reduce S-S bridges, and we found five ferredoxin analogs, which may well be adrenodoxin. Thus, a significant part of the biotin biosynthesis pathway is expressed in POM.
Pyrimidine biosynthesis mostly takes place in the cytosol and the nucleus in mammalian cells, but the fourth reaction in the pathway, catalyzed by dihydroorotate dehydrogenase, takes place on the outer IMM surface (Löffler et al., 2005). Heazlewood et al. (2004) found this enzyme in Arabidopsis mitochondria, and in POM it is present at higher than median relative abundance (Supplemental Table S3), confirming that it is mitochondrial and probably donates its electrons to ubiquinone as in mammalian mitochondria (Fig. 7).
The identification in this one investigation of so many enzymes involved in coenzyme biosynthesis in the mitochondrion is a good demonstration of the power of applying high-resolution and highly sensitive mass spectrometry-based proteomic tools to important questions in plant biochemistry.
DNA and RNA
We identified DNA polymerases, RNA polymerases, RNA helicase, histones, a histone-modifying enzyme, a topoisomerase, transcription factors, and a transcription termination factor, most at low abundances (Supplemental Tables S1 and S3) and representing almost all of the components required for DNA replication and transcription. Three of the five histones identified are of a type recently reported to be present in plant mitochondria (Zanin et al., 2010).
PPR Proteins
PPR proteins are one of the most prolific protein families in plants, while it is virtually absent in animals (Small and Peeters, 2000). The majority of the 450 PPR proteins in Arabidopsis are predicted to be mitochondrial, where about half are thought to be involved in RNA editing and the remainder in other types of RNA processing (Fujii and Small, 2011). In Arabidopsis mitochondria, Heazlewood et al. (2004) found 10 PPR proteins, while in POM, we found 71. From the total of 71 PPR proteins, we relatively quantified (dNSAF) 62 PPR proteins found in at least two replicates. The abundance of these PPR proteins varied by almost 2 orders of magnitude based on dNSAF values. Only seven PPR proteins can be considered to be present at high relative abundance (−2.9 to −2.6 [log10(dNSAF)]), whereas 23 can be considered medium relative abundance (−3.9 to −3.0 [log10(dNSAF)]) and 32 can be considered low relative abundance (−4.67 to −4.0 [log10(dNSAF)]).
Since 450 PPR proteins are present in Arabidopsis (Fujii and Small, 2011), and since the potato tuber genome contains many more genes than the Arabidopsis genome, it is very likely that at least 300 PPR proteins are targeted to the mitochondria in some potato tissue under some conditions. In spite of the fact that all proteins encoded in mitochondrial DNA are subunits in the constitutively expressed respiratory complexes or appear to be essential housekeeping proteins, the finding of “only” 71 PPR proteins indicates that many RNA-related processes are inactive in POM. In mitochondria from perennial ryegrass (Lolium perenne) reproductive tissues, a transcript profile showed that the expression of several mitochondrially expressed ribosomal proteins was very low (Islam et al., 2013). This may mean that their expression, and the associated RNA-related processes including PPR proteins, are dependent on the tissue and/or environmental conditions.
Turnover of ROS
The mitochondrion is one of the major sites of ROS production in the cell (Maxwell et al., 1999; Møller, 2001; Foyer and Noctor, 2003); therefore, it also contains a number of enzymes or enzyme systems capable of removing ROS. We found three of the four enzymes in the ascorbate-glutathione pathway, glutathione reductase, ascorbate peroxidase, and monodehydroascorbate reductase (dehydroascorbate reductase was not detected; Jimenez et al., 1997; Chew et al., 2003) with very similar relative abundances (−3.9 to −3.6 [log10(dNSAF)]), except for one, monodehydroascorbate reductase (GI 350536875), which presented higher relative abundance (−2.8 [log10(dNSAF)]; Fig. 5). Also, we identified both the classical mitochondrial Mn-SOD as well as a copper/zinc [Cu/Zn]-SOD, which at least in yeast is found in the mitochondrial intermembrane space (O’Brien et al., 2004). Mn- and Cu/Zn-SODs showed high (−1.7 [log10(dNSAF)]) and medium (−3.5 [log10(dNSAF)]) relative abundances, respectively.
We found thioredoxin (−3.1 [log10(dNSAF)]) and thioredoxin reductase, phospholipid hydroperoxide glutathione peroxidase (−3.2 log10[dNSAF]), and peroxiredoxin (−2.6 log10[dNSAF]) all in medium relative abundance. In other words, all four predicted NADPH-consuming enzyme systems involved in removing hydrogen peroxide or hydrogen peroxide-induced peroxidation products (Møller, 2007) are expressed in POM, which appear well armed to deal with oxidative stress.
Finally, we detected two catalases, one at low level (−4.4 [log10(dNSAF)]) and one at medium level (−2.6 [log10(dNSAF)]). Although POM only contain a maximum of 0.2% peroxisomes on a protein basis, the catalases could be contaminants, since catalase makes up approximately 50% of all the peroxisomal protein in potato tubers (Struglics et al., 1993). However, catalase has been reported to be present inside rat heart mitochondria (Radi et al., 1991), so the parsimonious explanation of catalase inside plant mitochondria cannot be excluded.
Metal Ion Turnover
Mitochondria contain many proteins, particularly redox-active enzymes, which bind metal ions often at their catalytic sites. As mitochondria are also involved in the biosynthesis of succinate dehydrogenase iron-sulfur subunit (FeS) centers and hemes, the concentration of metal ion is high in mitochondria (Tan et al., 2010). However, because free metal ions can interact with hydrogen peroxide and form the highly reactive and damaging hydroxyl radical, which can lead to protein oxidation (see below), it is very important for the cell to keep metal ions safely bound to proteins at all stages of metal ion uptake and metabolism (Kell, 2009, 2010; Møller et al., 2011). We found a number of prominent metal-containing proteins, including the FeS proteins and the copper/iron-containing cytochromes in the electron transport chain, but also Mn- and Cu/Zn-SOD and tricarboxylic acid cycle enzymes like aconitase (iron). In addition, we found the iron-storing ferritin (low abundance) and the complete pathway for the biosynthesis of FeS clusters: frataxin, iron-sulfur cluster assembly proteins, iron-sulfur cluster scaffold protein, iron-sulfur cluster cochaperone protein, Cys desulfurase, and ferredoxin (all medium abundance; Ye and Rouault, 2010).
A Majority of Potato Mitochondrial Proteins Are Posttranslationally Modified
More than half the proteins detected in the potato mitochondrial proteome were posttranslationally modified on at least one site. And about 100 proteins had more than 10 PTM sites. The most modified protein, Gly dehydrogenase, had as many as 50 PTM events of six different kinds, including 24 Met oxidations, three Asp deamidations, and 12 Pro oxidations (Supplemental Table S7). In most cases, the spectral counts were very low for each modified peptide identified. It is likely that the coverage of modified peptides was underestimated, as PTMs such as Lys or Arg oxidation cause missed trypsin cleavage sites, resulting in larger peptides that are more difficult to ionize and fragment.
The large number of PTM sites on some proteins could give rise to a very large number of differentially modified versions of the protein, unless the PTMs are introduced in an ordered rather than a random manner (Thelen and Miernyk, 2012). A relatively unexplored research area is the interaction between different PTMs. At least in one case, we know that such an interaction takes place. The oxidation of a Met residue to Met sulfoxide next to a potential phosphorylation site abolishes the phosphorylation on that site, and this is likely a regulatory mechanism, as this first step in Met oxidation is reversible (Huang et al., 2010).
In Supplemental Text S1, we analyze phosphorylated proteins, oxidized proteins, and proteins with acetylated and methylated Lys residues.
CONCLUSION
A comprehensive shotgun proteomic investigation of POM led to the detection of 1,060 proteins, which appear to represent more than 85% of the proteins expressed in the POM. A significant disparity was observed between the proteins actually identified in the proteome and those predicted to be targeted to the proteome by the five most commonly used prediction algorithms. Less than 50% of the proteins determined to be present in the mitochondrial proteome were predicted to be thus localized by at least two of these programs. Indeed, only 63% were thus predicted by at least one program. This clearly demonstrates that current bioinformatics tools, while often useful, can be very inadequate at predicting biological function and localization.
The broad coverage observed in the POM proteome allowed for the investigation of processes that are important for mitochondrial function, such as metabolism and respiration and posttranslational regulation of protein function. The electron transport chain was well covered in the POM proteome, with all complexes being well represented. In addition, three different alternative NAD(P)H dehydrogenases were present at significant levels, as were all members of the tricarboxylic acid cycle, except fumarase, suggesting that noncyclic modes of operation are likely to be functional. In addition, the biosynthesis of many coenzymes was well represented in the proteome, supporting the role of the mitochondrion in the production of these important molecules. The general processes of amino acid biosynthesis and lipid metabolism were well supported in the proteome. The fact that a number of glycolytic enzymes were detected can be explained by their association with the OMM. A number of other processes important to mitochondrial function and replication were well supported, including transport, protein synthesis, regulation of gene expression within the mitochondria, and metal ion regulation.
Finally, a large number of protein PTMs were found in the mitochondrial proteome, with over 50% of proteins possessing such modifications and several proteins possessing over a dozen modifications, such as phosphorylation and oxidative modifications. The ease with which these modifications were found is a testament to the power of the approach used. The fact that so many proteins contained at least one, and many contained more than one, PTM suggests that this mode of functional regulation plays an important role in the mitochondria. It further suggests that approaches beyond transcriptional profiling will be not only desired, but required, if we are to better understand how mitochondria help plants respond to stress and changing environments.
MATERIALS AND METHODS
Isolation of Mitochondria
Mitochondria were isolated from potato (Solanum tuberosum ‘Folva’) tubers by the method of Considine et al. (2003) with minor modifications. All procedures were done at 4°C. Peeled tubers were homogenized using a juice extractor into an equal volume of extraction medium (0.6 m mannitol, 20 mm MOPS-KOH [pH 7.3], 2 mm EDTA, 25 mm Cys, and 0.3% [w/v] bovine serum albumin). The homogenate was left standing for 5 min, allowing starch to sediment before it was filtered through two layers of cotton towel, and centrifuged at 3,000g for 5 min. The supernatant was centrifuged at 18,000g for 10 min to recover an organelle pellet. The pellet was resuspended in mannitol buffer (0.3 m mannitol, 10 mm MOPS-KOH [pH 7.3], and 0.1% [w/v] bovine serum albumin) and layered on top of a Percoll step gradient of 50%, 28%, and 20% in mannitol buffer. After centrifugation at 40,000g for 30 min, the pale mitochondrial band was recovered from the 28%/50% Percoll interface. After washing, the mitochondria were further purified on a second self-forming Percoll gradient of 28% Percoll in Suc buffer (0.3 m Suc, 10 mm MOPS-KOH [pH 7.3], and 0.1% [w/v] bovine serum albumin). The protein concentration was estimated by measuring A280 using a NanoDrop 1000 spectrophotometer (Thermo Fisher Scientific).
Gel Electrophoresis
One-dimensional SDS-PAGE (20 × 20 cm) performed according to Laemmli (1970) was employed as a prefractionation step. Isolated mitochondria (250 µg) and size marker proteins (protein ladder product no. 26630; Thermo Scientific Pierce) were dissolved in sample buffer (NuPAGE), placed at 65°C for 15 min, and resolved by 12% SDS-PAGE. After protein migration, proteins were stained with colloidal Coomassie Brilliant Blue. Then, each gel lane was sliced into 40 segments and diced into approximately 1-mm cubes followed by gel destaining and in-gel digestion as described by Balbuena et al. (2011).
Liquid Chromatography-Mass Spectrometry
A two-column system was used. Both columns were in-house packed with C18 reverse-phase material (ReproSil, C18 AQ 3 μm; Dr. Maisch) in fused silica. The precolumn had an i.d. of 100 μm and a length of 2 cm. The analytical column had an i.d. of 75 μm and a length of 15 cm. The flow of 250 nL min−1 was delivered by an EASY nLC system (Thermo Fisher Scientific), and the peptides were eluted using a 21-min gradient from 0% to 40% B buffer (A buffer, 0.1% formic acid; B buffer, 0.1% formic acid and 90% acetonitrile [all v/v]). The flow from the analytical column was coupled to an LTQ-Orbitrap XL mass spectrometer (Thermo Fisher Scientific). The instrument was run in positive ion mode. Full-scan mass spectrometry spectra (from mass-to-charge ratio [m/z] 300 to m/z 1,800) were acquired in the Orbitrap with resolution of 60,000 at m/z 400. The up to five most intense ions with charge states larger than +1 were sequentially isolated for fragmentation in the linear ion trap using collision-induced dissociation. Former target ions selected for fragmentation were dynamically excluded for 30 s. For accurate mass measurements, the lock mass option was enabled in mass spectrometry mode, and the polydimethylcyclosiloxane ions generated in the electrospray process (m/z = 445.120025) were used for internal recalibration in real time, resulting in a mass accuracy of approximately 2 ppm.
Database Searching and Protein Identification
Acquired tandem mass spectrometry spectra were searched using different algorithms against the potato protein database (http://solanaceae.plantbiology.msu.edu/pgsc_download.shtml). To estimate the protein FDR, randomized sequences were combined with the forward database in a concatenated format. MASCOT server 2.3.01, SEQUEST, MS-GFDB (Kim et al., 2010), and ProLuCID (Xu et al., 2006) were used to interpret the data set using similar parameters. MASCOT and SEQUEST were integrated within the Proteome Discoverer 1.3 software package (Thermo Fisher Scientific). Raw files (Thermo Fisher Scientific) were converted to ms2 and mzXML files prior to analysis by ProLuCID and MS-GFDB. All search engines were configured to the following parameters: molecular weight range between 200 and 2,000; 1,000 ppm of precursor ion tolerance; fragment tolerance of 1.0 D oxidation of Met and Asn deamidation as variable modifications and carbamidomethylation of Cys as a static modification; two allowed missed trypsin cleavages. After searches, the peptide spectra matched (PSM) were filtered with a 5-ppm precursor ion tolerance, achieving an FDR lower than 1% at the protein level for each biological replicate.
All the mass spectrometry data from each gel slice were searched and merged for each replicate. The results from different programs were combined in order to complement observations that came from different processes of data mining, without compromising the accuracy. To do this, a high stringency on precursors (5 ppm) was applied.
Filtered data were uploaded to the Protein Herder module within the Compass package (Wenger et al., 2011) for protein grouping. At this step, all sets of indistinguishable proteins, which were identified by the same peptides, were combined into protein groups.
Purity Assessment of Mitochondrial Preparations
Total protein and mitochondrial protein-enriched fractions from potato tubers were separated by SDS-PAGE. From each fraction, 20 μg of proteins was loaded on the gel. Blotting was performed as described previously by Stevenson et al. (2009) to polyvinylidene difluoride membranes (GE Healthcare). Antibodies directed against 14-3-3, enolase, plastidic α-carboxytransferase, and mitochondrial PDE1-α were used to assess mitochondrial protein enrichment in the preparations. Immunodetection of proteins bound to polyvinylidene difluoride membranes was performed using the colorimetric alkaline phosphatase and peroxidase substrate detection system (Sigma-Aldrich).
Subcellular Localization Study
Total RNA was isolated from potato tuber by using the method described by Kumar et al. (2007). A complementary DNA (cDNA) library was then synthesized by Moloney murine leukemia virus reverse transcriptase reaction (Promega) with random hexamer. Potato cDNA was PCR amplified from a cDNA library by a pair of gene-specific primers; BamHI and NotI restriction enzyme cutting sites were added to forward and reverse primers, respectively (Supplemental Table S8). The PCR fragments were cloned into pGEM-T easy vector (Promega), the insertions were dropped off by BamHI and NotI double digestion, and the insertions were cloned into pE6c entry vector, such that an EYFP fluorescence tag was fused in frame with potato proteins at the C terminus (Dubin et al., 2008). The cassette was then moved into the binary vector pSITE-0B by Gateway LR clonase (Chakrabarty et al., 2007).
For the colocalization assay, mitochondrial marker (CD3-986) binary plasmid with a cyan fluorescent protein (CFP) fluorescence tag was ordered from the Arabidopsis Biological Resource Center (Nelson et al., 2007). The binary constructs were transformed into Agrobacterium tumefaciens AGL1 strain. The potato EYFP fusion construct was individually mixed with the CFP mitochondrial marker and cotransformed into tobacco (Nicotiana tabacum) leaves. Transformation was performed by following the procedure described by Sparkes et al. (2006). An Olympus IX70 microscope controlled by MetaMorph (version 6.3; Molecular Devices) software was used for image capture, and Chroma filters 49001 and 49003 were applied for the CFP and EYFP channels, respectively.
PTMs
Multiple PTMs were searched against a concatenated database containing forward and randomized protein sequences previously identified in the general proteome-searching approach. The searches were performed using SEQUEST, MASCOT, and MS-GFDB programs. For each round of PTM searching, a maximum of two different variable modifications (PTMs) were configured. Precursor ion tolerance was set to 100 ppm, and two missed tryptic cleavages were allowed. Carbamidomethylation of Cys was configured as a static modification, and the PTMs of interest were configured as a variable modification. After searches, the data set was filtered using 5 ppm as precursor ion tolerance, achieving FDR lower than 1%. Only PTMs detected in at least two replicates were considered. The spectra assigned to peptides with oxidation sites were searched against the database, allowing all types of oxidation sites at the same time, to make sure that the oxidation sites were reproducible compared with the first database search.
Semitryptic Database Searching
All mass spectrometry data were reanalyzed using the MS-GFDB program against the identified protein sequence database, allowing semitryptic peptides and 100 ppm of precursor ion tolerance. Carbamidomethylation of Cys was configured as a static modification, and Met oxidation was configured as a variable modification. The PSM obtained were filtered out using 5 ppm as precursor ion tolerance, resulting in an FDR lower than 1%.
Prediction of Subcellular Localization
Predictions of subcellular localization for identified proteins were taken using the full-length protein sequences and five programs: TargetP version 1.1 (http://www.cbs.dtu.dk/services/TargetP/; Emanuelsson et al., 2000), Predotar version 1.03 (http://urgi.versailles.inra.fr/predotar/predotar.html; Small et al., 2004), MitoProtII (http://ihg.gsf.de/ihg/mitoprot.html; Claros and Vincens, 1996), iPSORT (http://ipsort.hgc.jp/; Bannai et al., 2002), and WoLF PSORT (http://wolfpsort.org/; Horton et al., 2007).
Mr and pI
Mr and pI of proteins were obtained using the Compute pI/Mw Web server (http://web.expasy.org/compute_pi/; Bjellqvist et al., 1994; Gasteiger et al., 2005). The GRAVY score was computed based on the Kyte-Doolittle hydropathy scale (Kyte and Doolittle, 1982). Bioinformatics computations were performed using Python version 2.7. The Arabidopsis (Arabidopsis thaliana) mitochondrial proteome list is based on Supplemental Table S1 in Heazlewood et al. (2004).
Protein Abundance Calculation
The total number of PSM for each protein identified was extracted from the Protein Herder module of the Compass software (Wenger et al., 2011) for each biological replicate. Only proteins identified in at least two replicates were considered for quantification based on the dNSAF score (Zhang et al., 2010). Spectral counts for each protein or group of proteins were used to estimate protein abundance.
For protein abundance estimation, the PSM produced by each program were unified by an in-house-developed script. Only different scans for a given protein detected by multiple programs were considered for calculation of total spectral counts, which means that repeated scans were considered only once in the calculation of total spectral counts. Therefore, the total spectral count of each protein was calculated by the sum of PSM (nonredundant scans) produced by different algorithms.
The dNSAF considers the spectral counts of shared peptides and distributes them based on a distribution factor (d):
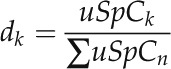 |
where k denotes a protein identity and n is the total number of proteins, while uSpC represents the sum of spectra matched to peptides mapping uniquely to the respective protein. So, for a given protein k, d is equal to the total uSpC mapped to this protein divided by the total number of uSpC from all n proteins with which protein k shares peptide(s).
Then, the dNSAF for a given protein, k, is calculated as follows:
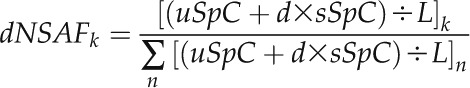 |
where sSpC corresponds to the total number of spectra from peptides shared among related proteins and L represents the length of the protein. In this way, the sSpC are distributed among the proteins, avoiding the same spectrum being counted multiple times.
Annotation and Functional Classification
Protein annotation and classification were performed based on matching the protein sequences against the nonredundant NCBI database and Gene Ontology functional classification using the Blast2GO tool (Conesa et al., 2005). Protein sequences were aligned using the BLASTP algorithm against the nonredundant NCBI database using the following parameters: report a maximum of five BLAST hits, 0.1 for the expected value, and minimum high-scoring segment pair length equal to 33. Mapping and annotation steps were performed using Blast2GO default values. GOslim annotation, which comprises the utilization of cut-down versions of the GO ontologies, was performed using the plant slim (http://www.geneontology.org/GO.slims.shtml). Gene Ontology distribution graphs related to biological process and molecular function were generated and analyzed at the fourth level of depth. Also, each protein was assigned to general functional categories according to Heazlewood et al. (2004).
Repository Data
Raw files as well peptide and protein identification files exported for each search engine (SEQUEST, MASCOT, MS-GFDB, and ProLuCID) have been deposited in a public repository, the ProteomeXchange Consortium (http://proteomecentral.proteomexchange.org), via the PRIDE partner repository (Vizcaíno et al., 2013) with the data set identifier PXD000149 (available at http://www.ebi.ac.uk/pride/). Phosphopeptides and respective spectral data have been deposited at the Plant Protein Phosphorylation Database (available at http://p3db.org).
Sequence data from this article can be found in the Potato Database (http://solanaceae.plantbiology.msu.edu/) under PGSC accession numbers provided in the Supplementary Tables.
Supplemental Data
The following materials are available in the online version of this article.
Supplemental Figure S1. SDS-PAGE and corresponding immunoblots of enriched mitochondrial protein fraction and total protein extract from potato tubers.
Supplemental Figure S2. Subcellular localization study on a selected subset of proteins identified.
Supplemental Figure S3. Gene Ontology term distribution related to the biological processes and molecular functions of the proteins identified in the POM.
Supplemental Table S1. List of 1,060 protein groups identified by GeLC-MS/MS in isolated mitochondria from potato tubers.
Supplemental Table S2. List of selected candidate proteins for validation by subcellular localization in tobacco leaf.
Supplemental Table S3. Label-free quantification based on spectral counting (884 proteins).
Supplemental Table S4. Mitochondrial localization prediction results (for potato and Arabidopsis mitochondrial proteomes) with different combinations of prediction programs.
Supplemental Table S5. Proteins with noncleaveable N-terminal presequences identified by LC-MS/MS.
Supplemental Table S6. Monoisotopic mass changes used to identify the posttranslational modifications.
Supplemental Table S7. Posttranslational modifications detected in the mitochondrial proteome of potato.
Supplemental Table S8. List of forward and reverse primer sequences used in this study for gene cloning.
Supplemental Text S1. Supplemental discussion.
Acknowledgments
We are grateful to Drs. Katherine Beard and Lee J. Sweetlove for a study visit by J.F.H. to their laboratory at the University of Oxford.
Glossary
- IMM
inner mitochondrial membrane
- OMM
outer mitochondrial membrane
- PPR
pentatricopeptide repeat
- LC-MS/MS
liquid chromatography and two-dimensional mass spectrometry
- POM
potato tuber mitochondria
- FDR
false discovery rate
- GeLC-MS/MS
gel electrophoresis followed by liquid chromatography-tandem mass spectrometry
- GRAVY
grand average hydropathy
- NCBI
National Center for Biotechnology Information
- dNSAF
distributed normalized spectral abundance factor
- PTM
posttranslational modification
- ROS
reactive oxygen species
- Mn
manganese
- SOD
superoxide dismutase
- Cu/Zn
copper/zinc
- FeS
succinate dehydrogenase iron-sulfur subunit
- m/z
mass-to-charge ratio
- PSM
peptide spectrum matched
- cDNA
complementary DNA
- EYFP
enhanced yellow fluorescent protein
- CFP
cyan fluorescent protein
References
- Alban C. (2011) Biotin (vitamin B8) synthesis in plants. Adv Bot Res 59: 39–66 [Google Scholar]
- Balbuena TS, Salas JJ, Martínez-Force E, Garcés R, Thelen JJ. (2011) Proteome analysis of cold acclimation in sunflower. J Proteome Res 10: 2330–2346 [DOI] [PubMed] [Google Scholar]
- Bannai H, Tamada Y, Maruyama O, Nakai K, Miyano S. (2002) Extensive feature detection of N-terminal protein sorting signals. Bioinformatics 18: 298–305 [DOI] [PubMed] [Google Scholar]
- Bartoli CG, Pastori GM, Foyer CH. (2000) Ascorbate biosynthesis in mitochondria is linked to the electron transport chain between complexes III and IV. Plant Physiol 123: 335–344 [DOI] [PMC free article] [PubMed] [Google Scholar]
- Bjellqvist B, Basse B, Olsen E, Celis JE. (1994) Reference points for comparisons of two-dimensional maps of proteins from different human cell types defined in a pH scale where isoelectric points correlate with polypeptide compositions. Electrophoresis 15: 529–539 [DOI] [PubMed] [Google Scholar]
- Blancquaert D, Storozhenko S, Loizeau K, De Steur H, De Brouwer V, Viaene J, Ravanel S, Rébeillé F, Lambert W, Van Der Straeten D. (2010) Folates and folic acid: from fundamental research toward sustainable health. Crit Rev Plant Sci 29: 14–35 [Google Scholar]
- Bykova NV, Møller IM. (2001) Involvement of matrix NADP turnover in the oxidation of NAD-linked substrates by pea leaf mitochondria. Physiol Plant 111: 448–456 [DOI] [PubMed] [Google Scholar]
- Calvo SE, Mootha VK. (2010) The mitochondrial proteome and human disease. Annu Rev Genomics Hum Genet 11: 25–44 [DOI] [PMC free article] [PubMed] [Google Scholar]
- Carrari F, Coll-Garcia D, Schauer N, Lytovchenko A, Palacios-Rojas N, Balbo I, Rosso M, Fernie AR. (2005) Deficiency of a plastidial adenylate kinase in Arabidopsis results in elevated photosynthetic amino acid biosynthesis and enhanced growth. Plant Physiol 137: 70–82 [DOI] [PMC free article] [PubMed] [Google Scholar]
- Chai MF, Wei PC, Chen QJ, An R, Chen J, Yang SH, Wang XC. (2006) NADK3, a novel cytoplasmic source of NADPH, is required under conditions of oxidative stress and modulates abscisic acid responses in Arabidopsis. Plant J 47: 665–674 [DOI] [PubMed] [Google Scholar]
- Chakrabarty R, Banerjee R, Chung SM, Farman M, Citovsky V, Hogenhout SA, Tzfira T, Goodin M. (2007) PSITE vectors for stable integration or transient expression of autofluorescent protein fusions in plants: probing Nicotiana benthamiana-virus interactions. Mol Plant Microbe Interact 20: 740–750 [DOI] [PubMed] [Google Scholar]
- Chew O, Whelan J, Millar AH. (2003) Molecular definition of the ascorbate-glutathione cycle in Arabidopsis mitochondria reveals dual targeting of antioxidant defenses in plants. J Biol Chem 278: 46869–46877 [DOI] [PubMed] [Google Scholar]
- Claros MG, Vincens P. (1996) Computational method to predict mitochondrially imported proteins and their targeting sequences. Eur J Biochem 241: 779–786 [DOI] [PubMed] [Google Scholar]
- Conesa A, Götz S, García-Gómez JM, Terol J, Talón M, Robles M. (2005) Blast2GO: a universal tool for annotation, visualization and analysis in functional genomics research. Bioinformatics 21: 3674–3676 [DOI] [PubMed] [Google Scholar]
- Considine MJ, Goodman M, Echtay KS, Laloi M, Whelan J, Brand MD, Sweetlove LJ. (2003) Superoxide stimulates a proton leak in potato mitochondria that is related to the activity of uncoupling protein. J Biol Chem 278: 22298–22302 [DOI] [PubMed] [Google Scholar]
- Cui JA, Liu JH, Li YH, Shi TL. (2011) Integrative identification of Arabidopsis mitochondrial proteome and its function exploitation through protein interaction network. PLoS ONE 6: e16022. [DOI] [PMC free article] [PubMed] [Google Scholar]
- Dubin MJ, Bowler C, Benvenuto G. (2008) A modified Gateway cloning strategy for overexpressing tagged proteins in plants. Plant Methods 4: 3. [DOI] [PMC free article] [PubMed] [Google Scholar]
- Duncan O, Taylor NL, Carrie C, Eubel H, Kubiszewski-Jakubiak S, Zhang B, Narsai R, Millar AH, Whelan J. (2011) Multiple lines of evidence localize signaling, morphology, and lipid biosynthesis machinery to the mitochondrial outer membrane of Arabidopsis. Plant Physiol 157: 1093–1113 [DOI] [PMC free article] [PubMed] [Google Scholar]
- Emanuelsson O, Nielsen H, Brunak S, von Heijne G. (2000) Predicting subcellular localization of proteins based on their N-terminal amino acid sequence. J Mol Biol 300: 1005–1016 [DOI] [PubMed] [Google Scholar]
- Eng JK, McCormack AL, Yates JR III. (1994) An approach to correlate tandem mass spectral data of peptides with amino acid sequences in a protein database. J Am Soc Mass Spectrom 5: 976–989 [DOI] [PubMed] [Google Scholar]
- Foyer CH, Noctor G. (2003) Redox sensing and signalling associated with reactive oxygen in chloroplasts, peroxisomes and mitochondria. Physiol Plant 119: 355–364 [Google Scholar]
- Fujii S, Small I. (2011) The evolution of RNA editing and pentatricopeptide repeat genes. New Phytol 191: 37–47 [DOI] [PubMed] [Google Scholar]
- Gasteiger E, Hoogland C, Gattiker A, Duvaud S, Wilkins MR, Appel RD, Bairoch A (2005) Protein identification and analysis tools on the ExPASy server. In JM Walker, ed, The Proteomics Protocols Handbook, Humana Press, Totowa, NJ, pp 571–607 [Google Scholar]
- Giglione C, Meinnel T. (2001) Organellar peptide deformylases: universality of the N-terminal methionine cleavage mechanism. Trends Plant Sci 6: 566–572 [DOI] [PubMed] [Google Scholar]
- Havelund JF, Thelen JJ, Møller IM. (2013) Biochemistry and proteomics of mitochondria from non-photosynthetic tissues. Front Plant Sci 4: 51. [DOI] [PMC free article] [PubMed] [Google Scholar]
- Heazlewood JL, Tonti-Filippini JS, Gout AM, Day DA, Whelan J, Millar AH. (2004) Experimental analysis of the Arabidopsis mitochondrial proteome highlights signaling and regulatory components, provides assessment of targeting prediction programs, and indicates plant-specific mitochondrial proteins. Plant Cell 16: 241–256 [DOI] [PMC free article] [PubMed] [Google Scholar]
- Horton P, Park KJ, Obayashi T, Fujita N, Harada H, Adams-Collier CJ, Nakai K. (2007) WoLF PSORT: protein localization predictor. Nucleic Acids Res 35: W585–W587 [DOI] [PMC free article] [PubMed] [Google Scholar]
- Huang Y, Houston NL, Tovar-Mendez A, Stevenson SE, Miernyk JA, Randall DD, Thelen JJ. (2010) A quantitative mass spectrometry-based approach for identifying protein kinase clients and quantifying kinase activity. Anal Biochem 402: 69–76 [DOI] [PubMed] [Google Scholar]
- Islam MS, Studer B, Byrne SL, Farrell JD, Panitz F, Bendixen C, Møller IM, Asp T. (2013) The genome and transcriptome of perennial ryegrass mitochondria. BMC Genomics 14: 202. [DOI] [PMC free article] [PubMed] [Google Scholar]
- Jimenez A, Hernandez JA, Del Rio LA, Sevilla F. (1997) Evidence for the presence of the ascorbate-glutathione cycle in mitochondria and peroxisomes of pea leaves. Plant Physiol 114: 275–284 [DOI] [PMC free article] [PubMed] [Google Scholar]
- Kell DB. (2009) Iron behaving badly: inappropriate iron chelation as a major contributor to the aetiology of vascular and other progressive inflammatory and degenerative diseases. BMC Med Genomics 2: 2. [DOI] [PMC free article] [PubMed] [Google Scholar]
- Kell DB. (2010) Towards a unifying, systems biology understanding of large-scale cellular death and destruction caused by poorly liganded iron: Parkinson’s, Huntington’s, Alzheimer’s, prions, bactericides, chemical toxicology and others as examples. Arch Toxicol 84: 825–889 [DOI] [PMC free article] [PubMed] [Google Scholar]
- Kim S, Mischerikow N, Bandeira N, Navarro JD, Wich L, Mohammed S, Heck AJR, Pevzner PA. (2010) The generating function of CID, ETD, and CID/ETD pairs of tandem mass spectra: applications to database search. Mol Cell Proteomics 9: 2840–2852 [DOI] [PMC free article] [PubMed] [Google Scholar]
- Kleffmann T, Russenberger D, von Zychlinski A, Christopher W, Sjölander K, Gruissem W, Baginsky S. (2004) The Arabidopsis thaliana chloroplast proteome reveals pathway abundance and novel protein functions. Curr Biol 14: 354–362 [DOI] [PubMed] [Google Scholar]
- Klodmann J, Senkler M, Rode C, Braun HP. (2011) Defining the protein complex proteome of plant mitochondria. Plant Physiol 157: 587–598 [DOI] [PMC free article] [PubMed] [Google Scholar]
- Kumar GN, Iyer S, Knowles NR. (2007) Extraction of RNA from fresh, frozen, and lyophilized tuber and root tissues. J Agric Food Chem 55: 1674–1678 [DOI] [PubMed] [Google Scholar]
- Kyte J, Doolittle RF. (1982) A simple method for displaying the hydropathic character of a protein. J Mol Biol 157: 105–132 [DOI] [PubMed] [Google Scholar]
- Laemmli UK. (1970) Cleavage of structural proteins during the assembly of the head of bacteriophage T4. Nature 227: 680–685 [DOI] [PubMed] [Google Scholar]
- Lee CP, Eubel H, Solheim C, Millar AH. (2012) Mitochondrial proteome heterogeneity between tissues from the vegetative and reproductive stages of Arabidopsis thaliana development. J Proteome Res 11: 3326–3343 [DOI] [PubMed] [Google Scholar]
- Li J, Cai T, Wu P, Cui Z, Chen X, Hou J, Xie Z, Xue P, Shi L, Liu P, et al. (2009) Proteomic analysis of mitochondria from Caenorhabditis elegans. Proteomics 9: 4539–4553 [DOI] [PubMed] [Google Scholar]
- Liu H, Sadygov RG, Yates JR., III (2004) A model for random sampling and estimation of relative protein abundance in shotgun proteomics. Anal Chem 76: 4193–4201 [DOI] [PubMed] [Google Scholar]
- Löffler M, Fairbanks LD, Zameitat E, Marinaki AM, Simmonds HA. (2005) Pyrimidine pathways in health and disease. Trends Mol Med 11: 430–437 [DOI] [PubMed] [Google Scholar]
- Matros A, Kaspar S, Witzel K, Mock HP. (2011) Recent progress in liquid chromatography-based separation and label-free quantitative plant proteomics. Phytochemistry 72: 963–974 [DOI] [PubMed] [Google Scholar]
- Maxwell DP, Wang Y, McIntosh L. (1999) The alternative oxidase lowers mitochondrial reactive oxygen production in plant cells. Proc Natl Acad Sci USA 96: 8271–8276 [DOI] [PMC free article] [PubMed] [Google Scholar]
- Millar AH, Heazlewood JL. (2003) Genomic and proteomic analysis of mitochondrial carrier proteins in Arabidopsis. Plant Physiol 131: 443–453 [DOI] [PMC free article] [PubMed] [Google Scholar]
- Millar AH, Heazlewood JL, Kristensen BK, Braun HP, Møller IM. (2005) The plant mitochondrial proteome. Trends Plant Sci 10: 36–43 [DOI] [PubMed] [Google Scholar]
- Millar AH, Whelan J, Small I. (2006) Recent surprises in protein targeting to mitochondria and plastids. Curr Opin Plant Biol 9: 610–615 [DOI] [PubMed] [Google Scholar]
- Millar AH, Whelan J, Soole KL, Day DA. (2011) Organization and regulation of mitochondrial respiration in plants. Annu Rev Plant Biol 62: 79–104 [DOI] [PubMed] [Google Scholar]
- Møller IM. (2001) Plant mitochondria and oxidative stress: electron transport, NADPH turnover and metabolism of reactive oxygen species. Annu Rev Plant Physiol Plant Mol Biol 52: 561–591 [DOI] [PubMed] [Google Scholar]
- Møller IM (2007) Mitochondrial electron transport and oxidative stress. In DM Logan, ed, Plant Mitochondria. Annual Plant Reviews. Blackwell Publishing, Oxford, pp 185–211 [Google Scholar]
- Møller IM, Rasmusson AG. (1998) The role of NADP in the mitochondrial matrix. Trends Plant Sci 3: 21–27 [Google Scholar]
- Møller IM, Rogowska-Wrzesinska A, Rao RS. (2011) Protein carbonylation and metal-catalyzed protein oxidation in a cellular perspective. J Proteomics 74: 2228–2242 [DOI] [PubMed] [Google Scholar]
- Nelson BK, Cai X, Nebenführ A. (2007) A multicolored set of in vivo organelle markers for co-localization studies in Arabidopsis and other plants. Plant J 51: 1126–1136 [DOI] [PubMed] [Google Scholar]
- Neuburger M, Day DA, Douce R. (1985) Transport of NAD+ in Percoll-purified potato tuber mitochondria: inhibition of NAD+ influx and efflux by N-4-azido-2-nitrophenyl-4-aminobutyryl-3′-NAD+. Plant Physiol 78: 405–410 [DOI] [PMC free article] [PubMed] [Google Scholar]
- Neuburger M, Journet EP, Bligny R, Carde JP, Douce R. (1982) Purification of plant mitochondria by isopycnic centrifugation in density gradients of Percoll. Arch Biochem Biophys 217: 312–323 [DOI] [PubMed] [Google Scholar]
- O'Brien KM, Dirmeier R, Engle M, Poyton RO. (2004) Mitochondrial protein oxidation in yeast mutants lacking manganese- (MnSOD) or copper- and zinc-containing superoxide dismutase (CuZnSOD). J Biol Chem 279: 51817–51827 [DOI] [PubMed] [Google Scholar]
- Pagliarini DJ, Calvo SE, Chang B, Sheth SA, Vafai SB, Ong SE, Walford GA, Sugiana C, Boneh A, Chen WK, et al. (2008) A mitochondrial protein compendium elucidates complex I disease biology. Cell 134: 112–123 [DOI] [PMC free article] [PubMed] [Google Scholar]
- Palmieri F, Pierri CL, De Grassi A, Nunes-Nesi A, Fernie AR. (2011) Evolution, structure and function of mitochondrial carriers: a review with new insights. Plant J 66: 161–181 [DOI] [PubMed] [Google Scholar]
- Perkins DN, Pappin DJ, Creasy DM, Cottrell JS. (1999) Probability-based protein identification by searching sequence databases using mass spectrometry data. Electrophoresis 20: 3551–3567 [DOI] [PubMed] [Google Scholar]
- Pineau B, Layoune O, Danon A, De Paepe R. (2008) L-Galactono-1,4-lactone dehydrogenase is required for the accumulation of plant respiratory complex I. J Biol Chem 283: 32500–32505 [DOI] [PubMed] [Google Scholar]
- Premsler T, Zahedi RP, Lewandrowski U, Sickmann A. (2009) Recent advances in yeast organelle and membrane proteomics. Proteomics 9: 4731–4743 [DOI] [PubMed] [Google Scholar]
- Radi R, Turrens JF, Chang LY, Bush KM, Crapo JD, Freeman BA. (1991) Detection of catalase in rat heart mitochondria. J Biol Chem 266: 22028–22034 [PubMed] [Google Scholar]
- Rasmusson AG, Møller IM. (1990) NADP-utilizing enzymes in the matrix of plant mitochondria. Plant Physiol 94: 1012–1018 [DOI] [PMC free article] [PubMed] [Google Scholar]
- Rasmusson AG, Møller IM (2011) Mitochondrial electron transport and plant stress. In F Kempken, ed, Plant Mitochondria. Springer, New York, pp 357–381 [Google Scholar]
- Roberts JK, Aubert S, Gout E, Bligny R, Douce R. (1997) Cooperation and competition between adenylate kinase, nucleoside diphosphokinase, electron transport, and ATP synthase in plant mitochondria studied by 31P-nuclear magnetic resonance. Plant Physiol 113: 191–199 [DOI] [PMC free article] [PubMed] [Google Scholar]
- Schneider G, Fechner U. (2004) Advances in the prediction of protein targeting signals. Proteomics 4: 1571–1580 [DOI] [PubMed] [Google Scholar]
- Schulze S, Mant A, Kossmann J, Lloyd JR. (2004) Identification of an Arabidopsis inorganic pyrophosphatase capable of being imported into chloroplasts. FEBS Lett 565: 101–105 [DOI] [PubMed] [Google Scholar]
- Small I, Peeters N, Legeai F, Lurin C. (2004) Predotar: a tool for rapidly screening proteomes for N-terminal targeting sequences. Proteomics 4: 1581–1590 [DOI] [PubMed] [Google Scholar]
- Small ID, Peeters N. (2000) The PPR motif: a TPR-related motif prevalent in plant organellar proteins. Trends Biochem Sci 25: 46–47 [DOI] [PubMed] [Google Scholar]
- Sparkes IA, Runions J, Kearns A, Hawes C. (2006) Rapid, transient expression of fluorescent fusion proteins in tobacco plants and generation of stably transformed plants. Nat Protoc 1: 2019–2025 [DOI] [PubMed] [Google Scholar]
- Stadtman ER, Van Remmen H, Richardson A, Wehr NB, Levine RL. (2005) Methionine oxidation and aging. Biochim Biophys Acta 1703: 135–140 [DOI] [PubMed] [Google Scholar]
- Stevenson SE, Chu Y, Ozias-Akins P, Thelen JJ. (2009) Validation of gel-free, label-free quantitative proteomics approaches: applications for seed allergen profiling. J Proteomics 72: 555–566 [DOI] [PubMed] [Google Scholar]
- Struglics A, Fredlund KM, Rasmusson AG, Møller IM. (1993) The presence of a short redox chain in the membrane of potato tuber peroxisomes and the association of malate dehydrogenase with the membrane. Physiol Plant 88: 19–28 [Google Scholar]
- Tan YF, Millar AH, Taylor NL. (2012) Components of mitochondrial oxidative phosphorylation vary in abundance following exposure to cold and chemical stresses. J Proteome Res 11: 3860–3879 [DOI] [PubMed] [Google Scholar]
- Tan YF, O’Toole N, Taylor NL, Millar AH. (2010) Divalent metal ions in plant mitochondria and their role in interactions with proteins and oxidative stress-induced damage to respiratory function. Plant Physiol 152: 747–761 [DOI] [PMC free article] [PubMed] [Google Scholar]
- Taylor NL, Howell KA, Heazlewood JL, Tan TY, Narsai R, Huang S, Whelan J, Millar AH. (2010) Analysis of the rice mitochondrial carrier family reveals anaerobic accumulation of a basic amino acid carrier involved in arginine metabolism during seed germination. Plant Physiol 154: 691–704 [DOI] [PMC free article] [PubMed] [Google Scholar]
- Thelen JJ, Miernyk JA. (2012) The proteomic future: where mass spectrometry should be taking us. Biochem J 444: 169–181 [DOI] [PubMed] [Google Scholar]
- Vizcaíno JA, Côté RG, Csordas A, Dianes JA, Fabregat A, Foster JM, Griss J, Alpi E, Birim M, Contell J, et al. (2013) The PRoteomics IDEntifications (PRIDE) database and associated tools: status in 2013. Nucleic Acids Res 41: D1063–D1069 [DOI] [PMC free article] [PubMed] [Google Scholar]
- von Ballmoos C, Wiedenmann A, Dimroth P. (2009) Essentials for ATP synthesis by F1F0 ATP synthases. Annu Rev Biochem 78: 649–672 [DOI] [PubMed] [Google Scholar]
- Waller JC, Dhanoa PK, Schumann U, Mullen RT, Snedden WA. (2010) Subcellular and tissue localization of NAD kinases from Arabidopsis: compartmentalization of de novo NADP biosynthesis. Planta 231: 305–317 [DOI] [PubMed] [Google Scholar]
- Wenger CD, Phanstiel DH, Lee MV, Bailey DJ, Coon JJ. (2011) COMPASS: a suite of pre- and post-search proteomics software tools for OMSSA. Proteomics 11: 1064–1074 [DOI] [PMC free article] [PubMed] [Google Scholar]
- Xu T, Venable JD, Park SK, Cociorva D, Lu B, Liao L, Wohlschlegel J, Hewel J, Yates JR. (2006) ProLuCID, a fast and sensitive tandem mass spectra-based protein identification program. Mol Cell Proteomics 5: S174 [Google Scholar]
- Xu X, Pan S, Cheng S, Zhang B, Mu D, Ni P, Zhang G, Yang S, Li R, Wang J, et al. (2011) Genome sequence and analysis of the tuber crop potato. Nature 475: 189–195 [DOI] [PubMed] [Google Scholar]
- Ye H, Rouault TA. (2010) Human iron-sulfur cluster assembly, cellular iron homeostasis, and disease. Biochemistry 49: 4945–4956 [DOI] [PMC free article] [PubMed] [Google Scholar]
- Zanin MK, Donohue JM, Everitt BA. (2010) Evidence that core histone H3 is targeted to the mitochondria in Brassica oleracea. Cell Biol Int 34: 997–1003 [DOI] [PubMed] [Google Scholar]
- Zhang Y, Wen Z, Washburn MP, Florens L. (2010) Refinements to label free proteome quantitation: how to deal with peptides shared by multiple proteins. Anal Chem 82: 2272–2281 [DOI] [PubMed] [Google Scholar]