

Abstract
Current preclinical evaluations of nanoparticle taxanes have focused on the effect of nanoparticle size and shape on the efficacy and toxicity. It is generally assumed that nanoparticle therapeutics have the same cellular response on tumor and normal cells as their small molecule counterparts. Here, we show that nanoparticle taxanes can mediate cellular effects distinct from that of small molecule taxanes at the sub-therapeutic dose range. Cells that are exposed to two polymeric nanoparticle formulations of docetaxel were found to undergo a different cell cycle and cell fate than that of cells that were exposed to small molecule docetaxel. Our results suggest that nanoparticle formulation of therapeutics can affect the therapeutic effect of its cargo.
Keywords: Nanomedicine, Nanoparticle, Drug delivery, Cytotoxicity, Controlled drug release
Background
The taxane chemotherapeutics, which include paclitaxel, docetaxel (Dtxl) and carbazitaxel, is one of the most commonly utilized classes of anticancer agents. They are effective against a wide range of cancers, including ovarian, lung, head and neck, esophageal, prostate and breast cancers.1, 2 The major shortcoming of taxanes is their poor water solubility and the need for excipients for intravascular delivery.3 Since the excipients can cause life-threatening hypersensitivity reactions,4 there has been strong interest in developing novel excipient-free taxane formulations.5 One of the approaches is to utilize nanoparticle (NP) drug delivery vehicles to deliver taxanes.6 NP delivery not only overcomes the need for excipients, but also improves the delivery of taxane therapeutics to tumors.7, 8 Because of the favorable properties of NP taxanes, their clinical translation has been rapid. Today, there are two clinically approved NP formulations of paclitaxel with several NP formulations of Dtxl under clinical investigation.9, 10 Clinical data from the two approved NP paclitaxel formulations have shown that NP therapeutics have a lower toxicity profile than small molecule paclitaxel, even at higher doses, and do not incur hypersensitivity reactions.11, 12
The success of NP paclitaxel formulations has generated strong interest in preclinical and clinical development of novel NP taxanes.9 Current preclinical research is focused on understanding how NP properties, such as size13, 14 and shape,15, 16 can affect the therapeutics’ efficacy and toxicity. However, one area of research that has not been studied in detail is whether NP taxanes have the same effects as their small molecule counterparts at the cell biological level. At therapeutic doses, taxanes bind to microtubules, disrupt their dynamic instability and thus inhibit proper alignment of chromosomes during mitosis.17, 18 This defect nearly always leads to engagement of the spindle assembly checkpoint and a mitotic arrest.19 From this arrest, cells may either undergo apoptotic cell death or a process termed mitotic slippage, in which unaligned chromosomes are mis-segregated to daughter cells creating multi- or micronucleated progeny.20 These cells can survive and continue to divide as tetraploid cells or exit G1, undergoing cell death or senescence.20 While the mechanisms that direct cell fate responses to paclitaxel are still under investigation, it has been suggested that outcome can be dependent on both taxane dose and exposure time.21–23 The clinical effects of small molecule taxanes are well established based on more than two decades of clinical experience;1 however, it is unclear whether they can be directly translated to NP taxanes. Two key differences between NP taxanes and their small molecule counterparts suggest that their cellular effects can be different. First, current NP taxanes are generally polymeric NPs and release their cargo in a slow and controlled fashion.24 Thus, the taxane exposure level to a cell at any given time from NP taxanes is different from that of small molecule taxanes. Second, the controlled release property of NP taxanes also increases the exposure time of cells to taxane molecules. As both dose and exposure time may specify the response of cells to taxane therapeutics, it is likely that differences exist in cellular response between NP and small molecule taxanes.
The present work is motivated to study the influence of NP drug delivery on taxanes’ mitotic defects in tumor and normal cells. To accomplish this goal, we used Dtxl as a model therapeutic. We studied the cellular response of two distinct polymeric NP formulations of Dtxl: Docetaxel-PNP, a commercial polymeric NP micelle formulation of Dtxl currently under clinical investigation,25 and folate-targeted nanoparticle docetaxel (FT-NP Dtxl), a targeted lipid-polymer NP formulation of Dtxl that was synthesized by our laboratory. The cellular responses of NP Dtxl formulations and Dtxl were compared using the folate receptor overexpressing human epidermoid carcinoma (KB) cells and normal diploid BJ fibroblasts. These effects were determined at both therapeutic and sub-therapeutic concentrations of Docetaxel-PNP, FT-NP Dtxl and small molecule Dtxl on tumor and normal cells in vitro.
Methods
Materials
Docetaxel-PNP was provided by Samyang Corporation (Seoul, Korea) as a gift. Docetaxel-PNP is comprised of a biodegradable amphiphilic diblock copolymer, monomethoxy poly(ethylene glycol)-poly(D,L-lactide) (mPEG-PDLLA), sodium salt of D,L-poly(lactic acid) (D,L-PLACOONa), D-Mannitol, and docetaxel (about 0.8%).25 Docetaxel-PNP was re-suspended in phosphate buffered saline (PBS) prior to use. Dtxl was obtained from Sigma-Aldrich (St. Louis, MO, USA). Poly (D,L-lactide-coglycolide) (PLGA) with a 50:50 monomer ratio and viscosity of 0.72–0.92 dL/g was purchased from Durect Corporation (Pelham, AL, USA). Soybean lecithin consisting of 90–95% (w/w) phosphatidylcholine was obtained from MP Biomedicals (Solon, OH, USA). DSPE-PEG2000-COOH [1,2-distearoyl-sn-glycero-3-phosphoethanolamine-N-carboxy (polyethylene glycol) 2000] was purchased from Avanti Polar Lipids (Alabaster, AL, USA).
Synthesis of folate-targeted nanoparticle docetaxel (FT-NP Dtxl)
FT-NP Dtxl was synthesized from PLGA, soybean lecithin, and DSPE-PEG-COOH using a previously reported nanoprecipitation technique.26 Details are provided in Supplementary Materials, available online at http://www.nanomedjournal.com.
Characterization of Docetaxel-PNP and folate-targeted nanoparticle docetaxel (FT-NP Dtxl)
Docetaxel-PNP and FT-NP Dtxl size (diameter, nm) and surface charge (ζ-potential, mV) were characterized using a Zetasizer Nano Z dynamic light scattering detector (Malvern Instruments Ltd, Worcestershire, UK).
Docetaxel release characterization from Docetaxel-PNP
To measure the release profile of Dtxl from Docetaxel-PNP, 400 μL of Docetaxel-PNP solution at a concentration of 1 mg/mL was added equally into Slide-A-Lyzer MINI dialysis microtubes with a molecular weight cut-off of 2 kDa (Pierce, Rockford, IL, USA) and subjected to dialysis as described previously.27 30 μL of sample was collected and diluted using 120 μL of acetonitrile. Dtxl content was quantitatively analyzed using an Agilent 1100 HPLC (Paolo Alto, CA, USA) equipped with a C18 chromolith flash column (Merck KGaA Darmstadt, Germany). Dtxl absorbance was measured by a UV VIS detector at 228 nm and had a retention time of 9.5 min in 0.25 mL/min gradient of acetonitrile/water. The mobile phase composition was changed from 0% acetonitrile to 100% acetonitrile over a period of 11.0 minutes.
Cell culture
KB cells were acquired from the Tissue Culture Facility at the Lineberger Comprehensive Cancer Center at UNC. KB cells were maintained in folate-free RPMI 1640 (Gibco, Invitrogen, Carlsbad, CA, USA) supplemented with 10% fetal bovine serum (FBS) (Mediatech, Manassas, VA, USA), nonessential amino acids (Mediatech), and penicillin/streptomycin (Mediatech). BJ fibroblasts were immortalized with human telomerase reverse transcriptase (hTERT). BJ fibroblasts and maintained in DMEM (Gibco) supplemented with 10% FBS (Mediatech) and penicillin/streptomycin (Mediatech).
Flow cytometry
Cell cycle distribution was determined in KB cells with and without exposure to FT-NP Dtxl, Docetaxel-PNP, or small molecule Dtxl. Samples were harvested (including detached cells), suspended in PBS, fixed in 70% ethanol and their DNA content was evaluated after propidium iodide (Sigma) staining with RNase A (Invitrogen). Fluorescence-activated cell sorting analysis was carried out using a Beckman-Coulter CyAn ADP flow cytometer at the UNC Flow Cytometry Core Facility. A minimum of 30,000 cells was collected for each condition by Summit 4.3 (Dako, Copenhagen, Denmark), and cell cycle distribution was determined using the ModFit software package (Verity Software House, Topsham, ME, USA).
Live cell-imaging
KB green fluorescent protein (GFP)-histone 2B-expressing cells were obtained through viral transduction. Retrovirus was produced by Fugene (Roche, Indianapolis, IN, USA) transfection of 293 cells with pCLNCX-GFP-H2B and vesicular stomatitis virus G protein (VSV-G). KB cells at 60% confluence were transduced with virus in 4 μg/mL polybrene and stably expressing cells were selected using 500 μg/mL geneticin (Gibco). For live cell-imaging, cells were plated in a 96-well plate and treated with FT-NP Dtxl, Docetaxel-PNP, or small molecule Dtxl for 1 h followed by imaging on a BD Pathway 855 bioimager using a 20x high-numerical-aperture objective. Images were taken every 15 min for 60 h. Only cells appearing to undergo first mitosis in the presence of drug treatment were counted. Cells in mitosis during 24 h after drug treatment were regarded as undergoing first mitosis. Movies were generated from single images using ImageJ software.
Immunofluorescence
KB GFP-H2B cells and BJ GFP-H2B fibroblasts were fixed 60 hours post treatment in 3.7% formaldehyde, permeabilized for 10 minutes with 0.5% Triton X-100, and blocked in PBTA (PBS-5% bovine serum albumin-1% Tween) overnight at 4°C. Cells were stained with a primary antibody anti-β-tubulin (Sigma) at a dilution of 1:2000 for 1 h. Following washes with PBTA, an Alexa 488 secondary antibody (Invitrogen) was applied for 30 minutes at 37°C. Cells were visualized with an Olympus IX70 microscope equipped with a Hamamatsu camera.
Liquid chromatography/mass spectrometry
KB cells were treated with FT-NP Dtxl, Docetaxel-PNP, or small molecule Dtxl equivalent dose. Dtxl was extracted from cell lysates and reconstituted in 0.1% acetic acid in acetonitrile for analysis via liquid chromatography/mass spectrometry (LC/MS) using an Applied Biosystems API 4000 triple quadrupole mass spectrometer with an APCI interface. Paclitaxel (Sigma-Aldrich) was used as the internal standard. The lower limit of quantitation (LLOQ) of Dtxl was 5.0 ng/mL.
Results
For this study, we utilized two NP Dtxl formulations: Docetaxel-PNP and FT-NP Dtxl. We formulated FT-NP Dtxl to increase intracellular uptake in vitro since NPs coated with PEG polymer have lower cellular uptake.28 First the physical properties of the two NP Dtxl formulations were characterized. Dynamic Light Scattering (DLS) analysis demonstrated that Docetaxel-PNP possess sizes of 47±1.6 nm, surface charges (ζ potential) of −4.1 ±0.4 mV and a polydispersity of 0.15 ±0.05. Docetaxel-PNP releases docetaxel in a controlled fashion, with >95% drug release after 120 h (Figure S1 in Supporting Information). FT-NP Dtxl was previously characterized by DLS and found to possess sizes of 72 ± 4 nm and ζ potential of −42 ± 8 mV.27 The monodisperse NPs had a polydispersity index of 0.16 ± 0.05.27 FT-NP Dtxl also demonstrated controlled drug release kinetics with 95% of the drug released from the NP at 24 h.27
To compare the cellular response of KB carcinoma cells to Docetaxel-PNP, FT-NP Dtxl or small molecule Dtxl (polysorbate 80 formulation), we quantified the cell-cycle distribution of KB cells after treatment. KB cells that have been treated with the Dtxl formulations were stained with propidium iodide. Their cell cycle distribution was then determined using fluorescence-activated cell sorting (FACS). FACS measures the fluorescence intensity produced by propidium iodide, which binds stoichiometrically to DNA in cells. Since the DNA content is different between cell cycle phases, a frequency distribution or histogram of DNA fluorescence can be generated to show the proportion of cells in G1/G0 (normal DNA content, 2N), S (DNA synthesis) and G2/M (double DNA content, 4N) cell cycle phases. First, KB cells were treated with a therapeutic concentration (0.65 μM) of Docetaxel-PNP, FT-NP Dtxl or Dtxl equivalent. It was previously determined that 0.65 μM is the half maximal inhibitory concentration (IC50) of small molecule Dtxl in KB cells after 1 h treatment.27 The use of Dtxl equivalent dose of the Dtxl formulations provided the same intracellular concentration of Dtxl after 1 h exposure in KB cells (P>0.05) (Figure 1). Intracellular Dtxl concentration was quantified using liquid chromatography/mass spectrometry (LC/MS). The non-significant difference in cellular internalization between the NP formulations of Dtxl may be due to the differences in the size and formulation of these NPs. At 24 h post treatment, the cells were then fixed with 70% ethanol and treated with 2.5 μg/mL propidium iodide (PI) and 0.5 mg/mL RNase A in phosphate buffered saline. Histograms revealing the cells in the G1, S and G2/M cell cycle phases were generated using Modfit analysis software (Figure 2). As seen in Figure 2, a marked increase in G2/M (4N) DNA content was observed in cells exposed to FT-NP Dtxl, Docetaxel-PNP, or small molecule Dtxl compared to that of untreated KB cells. There was no significant difference in G2/M cell cycle accumulations between small molecule Dtxl and NP Dtxl formulations (Figure 2A). The drug carrier, FT-NP, also does not affect cell cycle progression (Figure S2 in Supporting Information). These results suggest that NP Dtxl formulations and small molecule Dtxl have similar effects on KB tumor cells at therapeutic concentrations.
Figure 1.
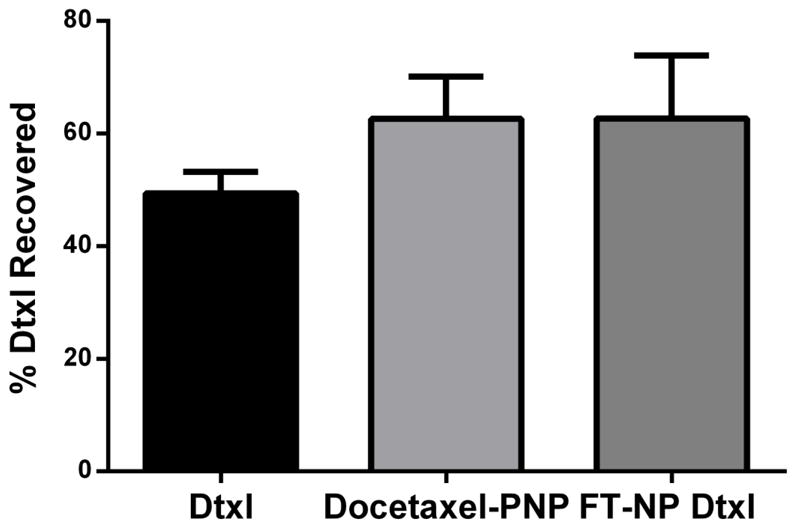
Quantification of the intracellular concentration of Dtxl in KB cells. KB cells were exposed to 20 nM concentrations of Docetaxel-PNP, or FT-NP Dtxl, or small molecule Dtxl equivalent for 1 h. Cells were harvested at 4 h post treatment. Dtxl doses were quantified using LC/MS.
Figure 2.

Cell cycle profile and mitotic progression of KB cells. Cells were exposed to 0.65 μM or 20 nM concentrations of Dtxl, Docetaxel-PNP or FT-NP Dtxl for 1 h. (A) Cell-associated DNA content was determined by propidium iodide staining followed by FACS. Representative FACS histograms are shown. (B) KB cells stably transfected with a GFP-H2B fusion construct were exposed to NP formulations of Dtxl or small molecule Dtxl for 1 h. After incubation, cells were imaged by live cell imaging for 60 h. Representative mitotic fates exhibited by treated KB cells after first mitosis are shown. (C) Percentage of cells in the modeled diploid cycle.
We also characterized the cellular response of KB cells to sub-therapeutic doses of FT-NP Dtxl, Docetaxel-PNP or Dtxl. Sub-therapeutic concentrations of Dtxl can occur in normal tissue after systemic administration, particularly for NP formulations as they have low distributions in normal tissue. Tumor cells can exhibit a range of sensitivities in the nM range to taxanes. Previous studies have reported that cells treated with low concentrations of taxanes (<20 nM) can exhibit aberrant mitosis, which is characterized by the presence of a subG1 phase of the cell cycle.29, 30 To determine whether aberrant mitosis is observed with NP Dtxl formulations and small molecule Dtxl in KB cells, we treated KB cells with decreasing concentrations of Docetaxel-PNP, FT-NP Dtxl, or small molecule Dtxl and evaluated the effects on cell cycle distribution. Surprisingly, we found that the cell cycle distribution is different between NP Dtxl formulations and Dtxl at 20 nM drug concentration. Cells treated with 20 nM concentration of small molecule Dtxl arrested in G2/M phase of the cell cycle (Figure 2). In contrast, cells treated with 20 nM Docetaxel PNP or FT-NP Dtxl exhibited a subG1, hypodiploid (less than 2N DNA content) population, suggesting aneuploidy (Figure 2). Additional experiments revealed that extending the incubation period of FT-NP Dtxl in cells lead to an increased accumulation of the cell population in the subG1 region (Figure S3 in Supporting Information). These results confirm that cells treated with sub-therapeutic concentrations of NP Dtxl formulations may undergo a different progression through the cell cycle compared to cells treated with small molecule Dtxl.
FACS is a cell-population-based method that relies on analysis of fixed cells and indirectly yields information on cell behavior in response to Dtxl treatment. To analyze the real time behavior of single cells, we carried out live cell imaging to monitor real-time dynamics of chromatin and determine mitotic transit time and cell fate at the single cell level. To do this, we engineered KB cells to express green fluorescent protein-histone 2B (GFP-H2B) fusion construct using a standard retroviral infection approach. We then performed live cell imaging. Subsequently, movies were generated from single images using ImageJ and we measured the length and outcome of mitosis by performing single-cell lineage tracing. Three phenotypes were observed through live cell imaging: 1) normal mitosis where mother cells divide into two daughters 2) mitotic death where cells undergoing a prolonged prometaphase and an inability to align on the metaphase plate and become pycnotic and 3) mitotic slippage where cells undergo a prolonged mitotic arrests followed by mis-segregation of chromosomes into 1 or more daughter cells. We exposed KB GFP-H2B expressing cells to therapeutic (0.65 uM) or sub-therapeutic (20 nM) Docetaxel-PNP, FT-NP Dtxl or small molecule Dtxl equivalent concentrations for 1 h and then immediately imaged for 60 hours. For lineage tracing experiments, only cells appearing to undergo first mitosis in the presence of drug treatment were counted. Cells in mitosis during 24 h after drug treatment were regarded as undergoing first mitosis. As expected, untreated KB cells stably expressing GFP-H2B undergo normal nuclear division into two daughter nuclei (Figure 2 and 3A). However, cells treated with a therapeutic dose of Docetaxel PNP, FT-NP Dtxl, or small molecule Dtxl exhibited a significantly prolonged mitosis compared to those of control cells (P<0.01) (Figure 3 and Movie S3). The prolonged mitosis was followed by cell death (Figure 4 and Movie S3). We then compared the chromatin dynamics of KB cells exposed to sub-therapeutic dose of Docetaxel PNP, FT-NP Dtxl and Dtxl. Cells that were exposed to Dtxl underwent mitotic delay and eventually cell death (Figure 3 and 4). In comparison, cells exposed to 20 nM Docetaxel-PNP or FT-NP Dtxl exhibited prolonged mitosis as well as mitotic slippage (P<0.01) (Figure 3 and Figure 4). Furthermore, only a small percentage of these cells underwent cell death within 60 h. This finding suggests that micronucleation in these cells is not coupled to cell death. Taken together, these observations are consistent with the FACS analysis of cell cycle distribution in KB cells treated with therapeutic or sub-therapeutic concentrations of polymeric nanoformulations of Dtxl and small molecule Dtxl. Live cell imaging suggests that the subG1 cells are due to mitotic slippage. These observations support that polymeric NP Dtxl formulations can lead to cellular responses different than that of small molecule Dtxl at a sub-therapeutic concentration.
Figure 3.

Fate profiles determined by live cell imaging. (A) Representative examples of fate profiles of KB carcinoma and BJ fibroblasts following exposure to 0.65 μM or 20 nM concentrations of Dtxl, Docetaxel-PNP or FT-NP Dtxl. (B) Lineage tracing was used to measure the length of mitosis as a function of the time in 50 cells.
Figure 4.

Immunostaining of β-tubulin (red). KB GFP-H2B cells and BJ GFP-H2B fibroblasts were exposed to 0.65 μM or 20 nM concentrations of Dtxl, Docetaxel-PNP, or FT-NP Dtxl for 1 h and then fixed and stained with β-tubulin (red) after live cell imaging.
The induction of cells in the subG1 phase and the development of micronucleated cells have been reported in cells treated with very low doses of taxanes.28, 30 Thus, we speculated that the cellular response difference between NP Dtxl and Dtxl was due to the controlled release property, which causes cells to be exposed to a lower concentration of Dtxl. To validate our hypothesis, we performed live cell imaging on KB GFP-H2B cells treated with decreasing doses of Dtxl. We found that when Dtxl concentration was decreased to 5 nM Dtxl, KB cells exhibited similar micronucleation as cells that were treated with 20 nM NP Dtxl (Figure 5). Our findings suggest that the cellular response of KB cells to 20 nM Docetaxel PNP or FT-NP Dtxl is similar to that of KB cells to 5 nM Dtxl.
Figure 5.

Quantification of KB GFP-H2B cells exposed to decreasing concentrations of small molecule Dtxl for 1 h. (A) Percentage of KB cells in mitosis was scored microscopically. (B) Percentage of mitotic cells in mitotic arrest and micronucleation was also scored.
To determine whether the findings also applied to normal cells that are exposed to NP formulations of Dtxl, we extended the live cell imaging analysis to normal diploid BJ GFP-H2B fibroblasts immortalized with human telomerase reverse transcriptase (hTERT). As expected, control BJ fibroblasts stably expressing GFP-H2B underwent normal nuclear division into two daughter nuclei (Figure 3A). Cells treated with 0.65 μM or 20 nM concentrations of small molecule Dtxl, Docetaxel-PNP, or FT-NP Dtxl exhibited a significantly prolonged mitosis compared to those of control cells (P<0.001) (Figure 3). However, in all conditions, the prolonged mitosis was not coupled to cell death (Figure 3 and Movie S5). This finding confirms that the Dtxl formulations were less cytotoxic to normal BJ fibroblasts than to KB carcinoma. A higher frequency of micronucleated cells were also observed at the therapeutic dose of small molecule Dtxl, Docetaxel-PNP, or FT-NP Dtxl compared to the sub-therapeutic dose (Figure 3A). These findings suggest that Dtxl concentration can also affect mitotic integrity and microtubule dynamics in normal diploid fibroblasts. We then compared the number of cells that became micronucleated after sub-therapeutic doses of small molecule Dtxl and NP Dtxl formulations (Figure 3A). The number of micronucleated cells was increased in cells treated with small molecule Dtxl compared to NP Dtxl formulations. Together, these observations confirm that Dtxl formulations are less cytotoxic to normal cells than to tumor cells. It also supports that polymeric NP Dtxl formulations can lead to effects different from that of small molecule Dtxl at a sub-therapeutic concentration in normal cells.
Discussion
In summary, we have demonstrated that the cellular response of tumor and normal cells to NP Dtxl is different from that of Dtxl at sub-therapeutic doses. In this dose range, we found that the cellular response of tumor cells to NP Dtxl is similar to that of cells exposed to a much lower equivalent dose of Dtxl, suggesting that the controlled drug release property of NP Dtxl is responsible for the difference in the cellular response. Polymeric NPs with controlled drug release properties can allow for increased drug exposure time in tumors without increasing toxicity systemically. However, sub-therapeutic concentrations of drug can also occur in normal tissue after systemic administration of NP formulations. Our results show that sub-therapeutic doses of taxanes from NP formulations lead to a different cellular response than small molecule taxanes in both tumor and normal tissue in vitro. At this dose range, NP formulations of taxanes do not lead to significant cell death in either tumor or normal cells. In addition, taxane formulations at the sub-therapeutic dose are less cytotoxic to normal cells than to tumor cells, which are consistent with clinical observations. NP taxanes are also less cytotoxic to normal cells at the sub-therapeutic dose than small molecule taxanes. Together, these findings suggest that NP formulations of taxanes may alter the therapeutic effect of small molecule taxanes at the sub-therapeutic dose. Such effects may account for the lower systemic toxicity of NP taxanes observed in clinical investigations. In conclusion, our group has demonstrated that NP formulation can affect the therapeutic effects of Dtxl at sub-therapeutic doses. It is the first evidence that NP formulation of a therapeutic can alter the drug’s mechanism of action. The methods used in this study can also help further elucidate how a drug imposes cell biological responses. Our findings suggest that mechanism of action studies can be important for novel NP formulations. It can also support further investigations on the effects of NP formulation and drug release kinetics on the efficacy and toxicity of NP therapeutics.
Supplementary Material
Acknowledgments
This work is supported by grants from the University Cancer Research Fund from the University of North Carolina. AZW is also supported by Career Development Award 5-K12-CA120780-01-05 and National Institutes of Health Center for Nanotechnology Excellence Grant 1-U54-CA151652-01. The UNC Flow Cytometry Core Facility is supported in part by an NCI Center Core Support Grant (P30CA06086) to the UNC Lineberger Comprehensive Cancer Center. AWW is supported by the National Institutes of Health/National Cancer Institute R00 Career Development Award CA128926 and R01 CA154699. RS is supported by the NIGMS Training Grant 5-T32-GM007040.
Footnotes
AZW is a consultant for Samyang Biopharmaceuticals, Inc. The authors declare no competing financial interest. An abstract regarding the research has been presented at the American Association for Cancer Research Annual Meeting in 2013.
Publisher's Disclaimer: This is a PDF file of an unedited manuscript that has been accepted for publication. As a service to our customers we are providing this early version of the manuscript. The manuscript will undergo copyediting, typesetting, and review of the resulting proof before it is published in its final citable form. Please note that during the production process errors may be discovered which could affect the content, and all legal disclaimers that apply to the journal pertain.
References
- 1.Rowinsky M, Eric K. The Development and Clinical Utility of the Taxane Class of Antimicrotubule Chemotherapy Agents. Annu Rev Med. 1997;48:353–74. doi: 10.1146/annurev.med.48.1.353. [DOI] [PubMed] [Google Scholar]
- 2.Goldspiel BR. Clinical Overview of the Taxanes. Pharmacotherapy. 1997;17:110S–25S. [PubMed] [Google Scholar]
- 3.Adams JD, Flora KP, Goldspiel BR, Wilson JW, Arbuck SG, Finley R. Taxol: a history of pharmaceutical development and current pharmaceutical concerns. J Natl Cancer Inst. 1993;15:141–7. [PubMed] [Google Scholar]
- 4.Rowinsky EK, Eisenhauer EA, Chaudhry V, Arbuck SG, Donehower RC. Clinical toxicities encountered with paclitaxel (Taxol) Semin Oncol. 1993;20:1–15. [PubMed] [Google Scholar]
- 5.Engels FK, Mathot RAA, Verweij J. Alternative drug formulations of docetaxel: a review. Anti-Cancer Drug. 2007;18:95–103. doi: 10.1097/CAD.0b013e3280113338. [DOI] [PubMed] [Google Scholar]
- 6.Ferrari M. Cancer nanotechnology: opportunities and challenges. Nat Rev Cancer. 2005;5:161–71. doi: 10.1038/nrc1566. [DOI] [PubMed] [Google Scholar]
- 7.Maeda H, Wu J, Sawa T, Matsumura Y, Hori K. Tumor vascular permeability and the EPR effect in macromolecular therapeutics: a review. J Control Release. 2000;65:271–84. doi: 10.1016/s0168-3659(99)00248-5. [DOI] [PubMed] [Google Scholar]
- 8.Fang J, Nakamura H, Maeda H. The EPR effect: Unique features of tumor blood vessels for drug delivery, factors involved, and limitations and augmentation of the effect. Adv Drug Deliver Rev. 2011;63:136–51. doi: 10.1016/j.addr.2010.04.009. [DOI] [PubMed] [Google Scholar]
- 9.Wang AZ, Langer R, Farokhzad OC. Nanoparticle Delivery of Cancer Drugs. Annu Rev Med. 2012;63:185–98. doi: 10.1146/annurev-med-040210-162544. [DOI] [PubMed] [Google Scholar]
- 10.Hrkach J, Von Hoff D, Ali MM, et al. Preclinical Development and Clinical Translation of a PSMA-Targeted Docetaxel Nanoparticle with a Differentiated Pharmacological Profile. Sci Transl Med. 2012;4:128ra39. doi: 10.1126/scitranslmed.3003651. [DOI] [PubMed] [Google Scholar]
- 11.Lee K, Chung H, Im S, et al. Multicenter phase II trial of Genexol-PM, a Cremophor-free, polymeric micelle formulation of paclitaxel, in patients with metastatic breast cancer. Breast Cancer Res Tr. 2008;108:241–50. doi: 10.1007/s10549-007-9591-y. [DOI] [PubMed] [Google Scholar]
- 12.Gradishar WJ, Tjulandin S, Davidson N, et al. Phase III Trial of Nanoparticle Albumin-Bound Paclitaxel Compared With Polyethylated Castor Oil Based Paclitaxel in Women With Breast Cancer. J Clin Oncol. 2005;23:7794–803. doi: 10.1200/JCO.2005.04.937. [DOI] [PubMed] [Google Scholar]
- 13.Chithrani BD, Ghazani AA, Chan WCW. Determining the Size and Shape Dependence of Gold Nanoparticle Uptake into Mammalian Cells. Nano Lett. 2006;6:662–8. doi: 10.1021/nl052396o. [DOI] [PubMed] [Google Scholar]
- 14.Rejman J, Oberle V, Zuhorn IS, Hoekstra D. Size-dependent internalization of particles via the pathways of clathrin- and caveolae-mediated endocytosis. Biochem J. 2004;377:159–69. doi: 10.1042/BJ20031253. [DOI] [PMC free article] [PubMed] [Google Scholar]
- 15.Burda C, Chen X, Narayanan R, El-Sayed MA. Chemistry and Properties of Nanocrystals of Different Shapes. Chem Rev. 2005;105:1025–102. doi: 10.1021/cr030063a. [DOI] [PubMed] [Google Scholar]
- 16.Huang X, Teng X, Chen D, Tang F, He J. The effect of the shape of mesoporous silica nanoparticles on cellular uptake and cell function. Biomaterials. 2010;31:438–48. doi: 10.1016/j.biomaterials.2009.09.060. [DOI] [PubMed] [Google Scholar]
- 17.Abal M, Andreu JM, Barasoain I. Taxanes: Microtubule and Centrosome Targets, and Cell Cycle Dependent Mechanisms of Action. Curr Cancer Drug Targets. 2003;3:193–203. doi: 10.2174/1568009033481967. [DOI] [PubMed] [Google Scholar]
- 18.Huizing MT, Misser VHS, Pieters RC, et al. Taxanes: A New Class of Antitumor Agents. Cancer Invest. 1995;13:381–404. doi: 10.3109/07357909509031919. [DOI] [PubMed] [Google Scholar]
- 19.Jordan MA, Wilson L. Microtubules as a target for anticancer drugs. Nat Rev Cancer. 2004;4:253–65. doi: 10.1038/nrc1317. [DOI] [PubMed] [Google Scholar]
- 20.Blagosklonny MV. Mitotic Arrest and Cell Fate: Why and How Mitotic Inhibition of Transcription Drives Mutually Exclusive Events. Cell Cycle. 2007;6:70–4. doi: 10.4161/cc.6.1.3682. [DOI] [PubMed] [Google Scholar]
- 21.Blajeski AL, Kottke TJ, Kaufmann SH. A Multistep Model for Paclitaxel-Induced Apoptosis in Human Breast Cancer Cell Lines. Exp Cell Res. 2001;270:277–88. doi: 10.1006/excr.2001.5349. [DOI] [PubMed] [Google Scholar]
- 22.Gascoigne KE, Taylor SS. How do anti-mitotic drugs kill cancer cells? J Cell Sci. 2009;122:2579–85. doi: 10.1242/jcs.039719. [DOI] [PubMed] [Google Scholar]
- 23.Torres K, Horwitz SB. Mechanisms of Taxol-induced Cell Death Are Concentration Dependent. Cancer Res. 1998;58:3620–6. [PubMed] [Google Scholar]
- 24.Pridgen EM, Langer R, Farokhzad OC. Biodegradable, polymeric nanoparticle delivery systems for cancer therapy. Nanomedicine. 2007;2:669–80. doi: 10.2217/17435889.2.5.669. [DOI] [PubMed] [Google Scholar]
- 25.Jung KH, Kim K-P, Yoon DH, et al. A phase I trial to determine the maximum tolerated dose and evaluate the safety and pharmacokinetics (PK) of docetaxel-PNP, polymeric nanoparticle formulation of docetaxel, in subjects with advanced solid malignancies. ASCO Meeting Abstracts. 2012;30:e13104. [Google Scholar]
- 26.Zhang L, Chan JM, Gu FX, et al. Self-Assembled Lipid Polymer Hybrid Nanoparticles: A Robust Drug Delivery Platform. ACS Nano. 2008;2:1696–702. doi: 10.1021/nn800275r. [DOI] [PMC free article] [PubMed] [Google Scholar]
- 27.Werner ME, Copp JA, Karve S, et al. Folate-Targeted Polymeric Nanoparticle Formulation of Docetaxel Is an Effective Molecularly Targeted Radiosensitizer with Efficacy Dependent on the Timing of Radiotherapy. ACS Nano. 2011;5:8990–8. doi: 10.1021/nn203165z. [DOI] [PMC free article] [PubMed] [Google Scholar]
- 28.Kamaly N, Xiao Z, Valencia PM, Radovic-Moreno AF, Farokhzad OC. Targeted polymeric therapeutic nanoparticles: design, development and clinical translation. Chem Soc Rev. 2012;41:2971–3010. doi: 10.1039/c2cs15344k. [DOI] [PMC free article] [PubMed] [Google Scholar]
- 29.Ikui AE, Yang C-PH, Matsumoto T, Horwitz SB. Low Concentrations of Taxol Cause Mitotic Delay Followed by Premature Dissociation of p55CDC from Mad2 and BubR1 and Abrogation of the Spindle checkpoint, Leading to Aneuploidy. Cell Cycle. 2005;4:1385–8. doi: 10.4161/cc.4.10.2061. [DOI] [PubMed] [Google Scholar]
- 30.Demidenko ZN, Kalurupalle S, Hanko C, Lim Cu, Broude E, Blagosklonny MV. Mechanism of G1-like arrest by low concentrations of paclitaxel: next cell cycle p53-dependent arrest with sub G1 DNA content mediated by prolonged mitosis. Oncogene. 2008;27:4402–10. doi: 10.1038/onc.2008.82. [DOI] [PubMed] [Google Scholar]
Associated Data
This section collects any data citations, data availability statements, or supplementary materials included in this article.