Abstract
Open angle glaucoma (OAG) is a severe ocular disease characterized by progressive and irreversible vision loss. While elevated intraocular pressure (IOP) is a well-established risk factor for OAG, the progression of OAG in many cases, despite IOP treatment, suggests that other risk factors must play significant roles in the development of the disease. For example, various structural properties of the eye, ocular blood flow properties, and systemic conditions have been identified as risk factors for OAG. Ethnicity has also been indicated as a relevant factor that affects the incidence and prevalence of OAG; in fact, OAG is the leading cause of blindness among people of African descent. Numerous clinical studies have been designed to examine the possible correlation and causation between OAG and these factors; however, these studies are met with the challenge of isolating the individual role of multiple interconnected factors. Over the last decade, various mathematical modeling approaches have been implemented in combination with clinical studies in order to provide a mechanical and hemodynamical description of the eye in relation to the entire human body and to assess the contribution of single risk factors to the development of OAG. This review provides a summary of the clinical evidence of ocular structural differences, ocular vascular differences and systemic vascular differences among people of African and European descent, describes the mathematical approaches that have been proposed to study ocular mechanics and hemodynamics while discussing how they could be used to investigate the relevance to OAG of racial disparities, and outlines possible new directions of research.
Keywords: Mathematical Modeling, Glaucoma, Blood Flow, Ocular Mechanics, Ocular Hemodynamics
1. Introduction
Open angle glaucoma (OAG) is a chronic optic neuropathy characterized by progressive retinal ganglion cell death, structural changes to the retina and optic nerve head, and irreversible visual field loss. OAG is often called “the sneak thief of sight” because it has no symptoms until noticeable vision loss has occurred. Vision loss begins in the periphery, as shown in Figure 1. Visual acuity (or sharpness of vision) is maintained until late in the disease; consequently, patients only become aware of vision loss once the disease is already quite advanced. OAG is the second leading cause of blindness worldwide (after cataracts)(24, 66) and is the leading cause of blindness among people of African descent (AD).(23, 38, 60) Unfortunately, OAG is not curable and the vision lost cannot be regained.
Fig. 1.
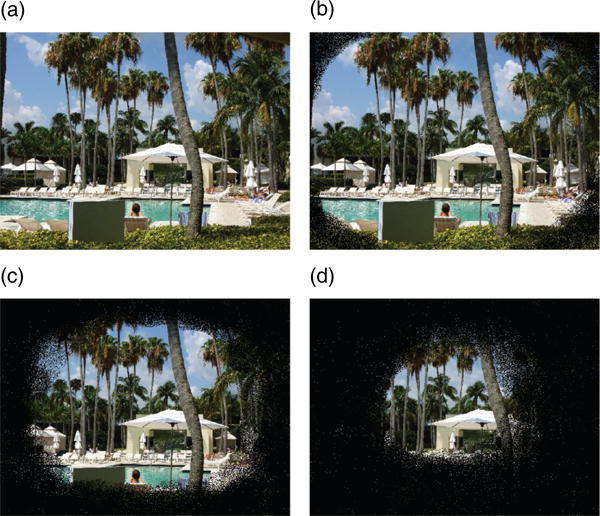
Progression of vision loss in open angle glaucoma. (a) Normal vision, (b) Early glaucoma, (c) Advanced glaucoma, (d) Extreme glaucoma.
Elevated intraocular pressure (IOP) has been the first OAG risk factor to be identified.(46) Elevated IOP may contribute to OAG pathophysiology by inducing mechanical damage on the optic nerve or altering the ocular circulation, thereby compromising the functionality of the retinal ganglion cells and their axons.(12, 13, 22) To date, elevated IOP is the only treatable OAG risk factor, as it can be reduced via medications and/or surgery. However, a high percentage of individuals with elevated IOP never develops glaucoma,(56, 58) and many OAG patients continue to experience disease progression despite meeting target IOP levels.(14, 15, 25, 33, 72, 73, 90)
The observed progression of OAG despite IOP treatment suggests that OAG is a multifactorial disease with inadequate methods of treatment.(126) Over the last few decades, a variety of OAG risk factors have been identified, including structural properties of the eye such as cupping of the optic disc,(78, 130) myopia,(39, 70) and central corneal thickness;(31, 78, 130)ocular blood flow properties such as ocular perfusion pressure,(20, 79) vascular dysregulation(40, 70, 81, 122) and hemorrhages in the optic disc;(11,30) and systemic conditions such as systemic blood pressure(55, 69, 70, 79) and diabetes.(70) The mechanisms by which these factors may contribute to OAG pathophysiology are still largely unknown, and this hinders the development of more successful therapeutic approaches for OAG. In particular, it remains unclear which of these factors are causes or consequences of the disease and whether combinations of different factors yield similar risk for OAG.
Ethnicity is a known modifier of the OAG risk.(70) Several studies have indicated increased incidence and prevalence of OAG in people of AD compared to those of European descent (ED) in the United States, the West Indies, and Africa.(71, 76, 104, 127) The Ocular Hypertension Treatment Study described African-American race as a baseline factor associated with an increased risk of developing OAG.(45) People of AD also have an increased risk of developing OAG at an earlier age, and their disease progression is often more rapid than in people of ED (75, 94, 96, 123, 127, 133, 134) Racial differences have been associated with differences in ocular structures, ocular blood flow and systemic conditions. Understanding the role that ethnicity plays as an OAG risk modifier could help elucidating the contributions of various risk factors to the OAG pathophysiology.
Several non-invasive techniques have been developed to measure quantities related to ocular morphology and hemodynamics in humans in vivo, allowing a large amount of data on ocular structures and macro- and microcirculation to be obtained in a clinical setting during a patient's visit. However, the interpretation of these data remains a very challenging task. For example, it is not clear whether the alteration of ocular hemodynamics observed in OAG patients is a cause or a consequence of the disease. It has been hypothesized that decreased ocular blood flow can cause the death of retinal ganglion cells via ischemia, but it has also been suggested that the observed decrease in blood flow could be a response to the decrease in metabolic demand for oxygen and nutrients consequent to retinal ganglion cell death.(15) Structural, vascular and metabolic factors are strongly interconnected, and therefore their individual contributions to OAG are difficult to isolate in vivo.(81)
The interpretation of clinical data could be aided by mathematical models that describe the mechanics and hemodynamics of the eye and the relationship of these factors with systemic conditions. Mathematical models could be used as a virtual lab, in which the contributions of structural, vascular and systemic factors can be isolated and assessed independently. The results of such modeling work could then be used to design clinical studies in which the theoretical model predictions can be tested and the role of individual OAG risk factors can be unraveled. As a first significant step, mathematical models could be used to investigate how and to what extent the structural, vascular and systemic differences observed among people of AD and ED may influence the perfusion and oxygenation of ocular tissues and, consequently, the development and progression of OAG.
The main goals of this paper are to:
summarize the clinical evidence of ocular structural differences, ocular vascular differences and systemic differences among people of AD and ED (Section 4);
review the mathematical modeling approaches currently available to study ocular mechanics, hemodynamics and oxygenation, while discussing the potential use of such models to predict the contribution of the differences in (i) to the pathophysiology of OAG (Section 5); and
suggest future developments of mathematical models, identifying main desirable features and potential mathematical challenges (Section 6).
The non-invasive techniques currently available to measure ocular morphology and hemodynamics in humans in vivo are summarized in Section 3, since they provide the data for model input and validation. For completeness and ease of reference, a brief overview of the main ocular structural and vascular components is provided in Section 2.
2. Brief Overview of the Eye
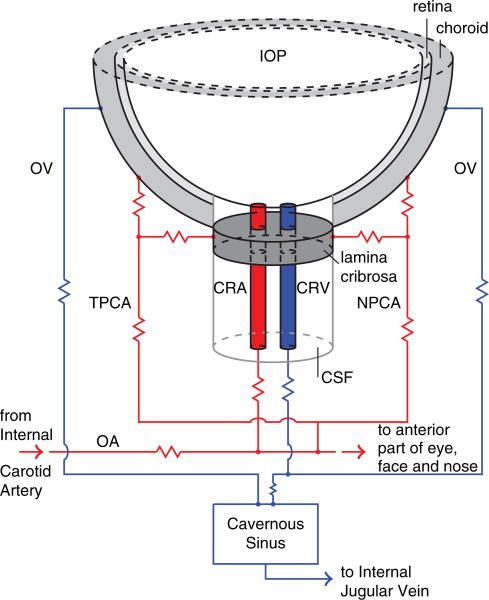
The ocular components most relevant to this study are described in Section 2.1 and are depicted in Figure 2. The architecture of the ocular blood supply is described in Section 2.2 and is depicted in Figure 3.
Fig. 2.
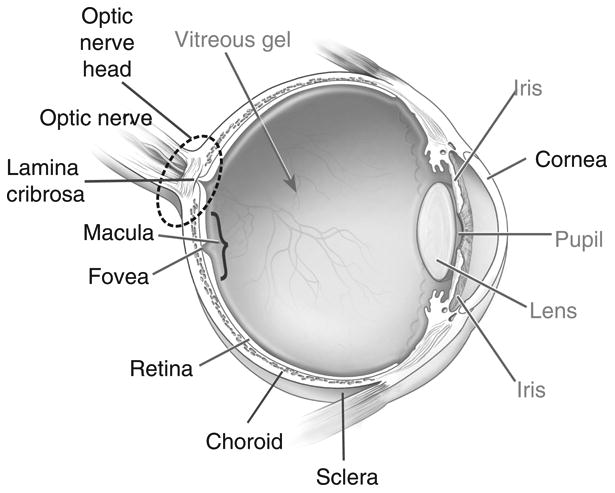
Schematic representation of the eye and its components.(1) The ocular components most relevant to this paper are identified with black labels and described in the glossary in Section 2.1.
Fig. 3.
Schematic representation of the ocular blood supply. The abbreviations are listed and explained in Table I.
2.1. Glossary of Ocular Components
Choroid: thin, vascular layer between the sclera and the retina that supplies blood to the retina.
Cornea: clear covering over the front of the eye that transmits and focuses light entering the eye.
Fovea: central depression in the macula where light falls directly upon cone photoreceptor cells, providing the sharpest vision.
Lamina Cribrosa: mesh-like structure located in the optic nerve head and composed of layers of collagen fibers that insert into the scleral canal wall. The axons of the retinal ganglion cells and the central retinal artery and vein run through the lamina.
Macula: central area of the retina, responsible for acute central vision.
Optic Nerve: second cranial nerve that carries impulses from the retina to the brain.
Optic Nerve Head (also called optic disc): location where the axons of the retinal ganglion cells exit the eye to form the optic nerve.
Retina: layer of nerves lining the back of the eye that sends impulses to the optic nerve.
Retinal Ganglion Cells: neurons located near the inner surface of the retina that transmit visual information from the retina to the brain via long axons.
Retinal Nerve Fiber Layer: the innermost retinal layer that contains nerve axons and retinal ganglion cells that connect to the optic nerve.
Sclera: fibrous outer layer of the eye.
2.2. Ocular Blood Supply
The architecture of the blood supply to the retina, lamina cribrosa and choroid is depicted in Figure 3.
The arterial supply to the eye arises primarily from the ophthalmic artery (OA), which is the first branch of the internal carotid artery. The OA branches into several arteries including the central retinal artery (CRA) and the nasal and temporal posterior ciliary arteries (NPCA and TPCA). The CRA penetrates the optic nerve approximately 15 mm behind the eye globe, courses adjacent to the central retinal vein (CRV), passes through the lamina cribrosa and branches into four major arterioles supplying the inner retinal layers. The NPCA and TPCA branch into arteries supplying the outer retina, choroid and retrobulbar tissues.
The venous drainage of the retina, choroid and optic nerve is mainly through the CRV and the ophthalmic veins (OV). The CRV and OV are major tributaries to the cavernous sinus, which ultimately drains into the internal jugular veins at the base of the skull. More information on the ocular blood supply can be found in Ref. [53].
Retinal tissue exhibits blood flow autoregulation, which is the intrinsic ability to maintaining relatively constant blood flow despite changes in pressure while meeting the metabolic demands of the tissue.(8, 32, 50, 100, 101) Blood flow autoregulation has also been observed in the lamina cribrosa.(52, 92, 107) Less is known about the choroid, as some studies indicate that the choroid is strictly passive,(2, 3) while others suggest that it may be regulated via neural control.(26, 107) Impaired blood flow autoregulation has been shown to contribute to the development and progression of OAG.(70, 81)
3. Techniques for Non-Invasive Ocular Measurements
Clinical assessment of OAG is usually performed through standard assessments of visual acuity, visual field, IOP, optic nerve head morphology, central corneal thickness and axial length. Visual acuity can be measured via the early treatment diabetic retinopathy study vision chart. Visual field can be measured using standard automated perimetry (SAP).(61, 113) The average value of IOP over a cardiac cycle can be measured via Goldmann applanation tonometry, while IOP oscillations over a cardiac cycle can be measured via PASCAL Dynamic Contour Tonometer.(97)
The morphology of the optic nerve head is usually estimated by analyzing images obtained with a Fundus Camera. Central corneal thickness can be measured with an ultrasonic corneal pachymeter, and the axial length can be measured via optical biometry.
In addition to these basic assessments, specific ocular structural and vascular parameters can be clinically measured via advanced imaging technologies, including color doppler imaging, Fourier-domain optical coherence tomography, Heidelberg retinal tomography, Retinal oxymetry, Laser doppler flowmetry, Digital scanning laser ophthalmoscope angiography, Laser speckle flowgraphy, and Retinal vessel analyzer.
In the following, the information that these techniques can provide are described in detail in order to highlight some of the data available for model input or model validation.
Color Doppler Imaging (CDI)
This technique is used to measure the blood velocity in the main arteries supplying the eye. It utilizes 2D ultrasound images in conjunction with velocity measurements derived from the Doppler shift of sound waves reflected from erythrocytes, as they travel through blood vessels. A typical CDI protocol involves evaluation of the OA, CRA, NPCA and TPCA via the analysis of CDI images similar to the one reported in Figure 4. Parameters of clinical interest include the peak systolic velocity (PSV), end diastolic velocity (EDV), and the Pourcelot's index of resistivity (RI) calculated as RI = (PSV–EDV)/PSV. In Section 5.2, the implementation of CDI measurements in mathematical models is described; in particular, the blood velocity in the central retinal vessels measured via CDI is used to validate the model describing the effect of IOP elevation on the CRA hemodynamics(16) and to calibrate the input/output pressures in the lumped network model describing the retinal circulation.(18)
Fig. 4.
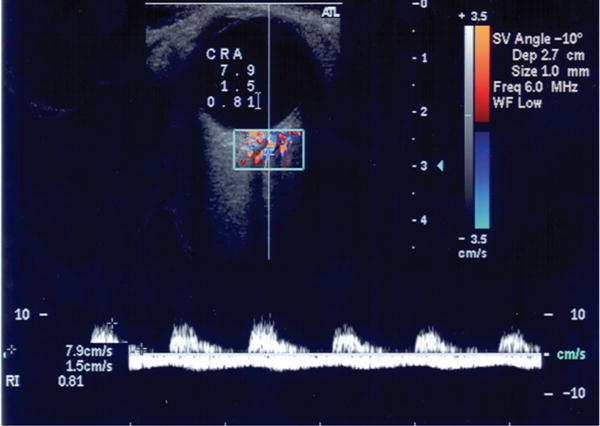
Color doppler imaging measures velocity in the central retinal artery (CRA). Outcome parameters include peak systolic velocity, PSV = 7.9 cm/s, end diastolic velocity, EDV = 1.5 cm/s, and Pourcelot's index of resistivity, RI = (PSV–EDV)/PSV = 0.81.
Fourier-Domain Optical Coherence Tomography (FD-OCT)
FD-OCT combines the structural measurements of optical coherence tomography with the retinal blood flow measurements of laser Doppler in a single device, as shown in Figure 5. These high-resolution images could be used to build patient-specific finite elements representations of the ocular geometry. FD-OCT captures high-resolution
Fig. 5.
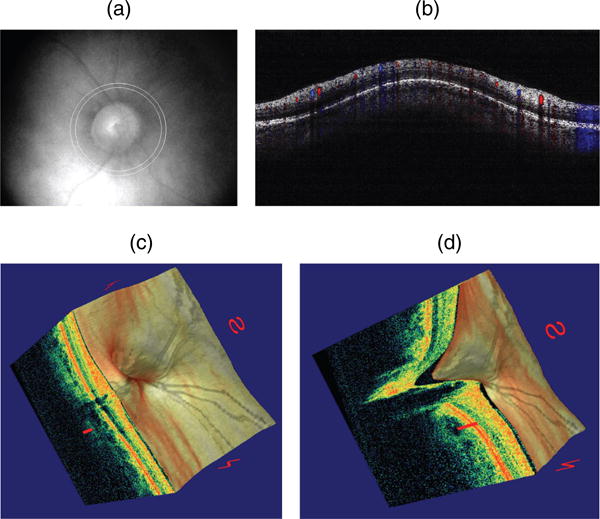
Doppler optical coherence tomography. (a) Fundus photograph showing the double circular pattern of the optical coherence tomography (OCT) beam scanning across retinal blood vessels emerging from the optic disc. (b) Color doppler OCT image showing the unfolded cross-section from a circular scan. Arteries and veins could be distinguished by the direction of flow as determined by the signs (blue or red color) of the Doppler shift. (c) Three-dimensional reconstruction of the optic nerve head showing the retinal layers. (d) Section of the three-dimensional reconstruction of the optic nerve head showing cupping.
Doppler information from retinal vessels in three dimensions within a fraction of the cardiac cycle.(74, 131) Retinal blood flow scans transect all retinal branch arteries and veins that emerge from the optic nerve head, providing the basis for total retinal blood flow measurement in absolute value (μ l/min). Measurements of total retinal blood flow are very useful to calibrate and validate mathematical models for the retinal circulation, as mentioned in Section 5.2.
Confocal Scanning Laser Doppler Flowmetry (CSLDF)
CSLDF is a technique that measures the capillary blood flow of the retina and optic nerve head and provides a two-dimensional map of ocular perfusion in these areas, as shown in Figure 6. The main limitation of this technique is that velocity and volume are measured in arbitrary units, making the comparison between CSLDF measurements and other technologies quite difficult.(54, 109) Nevertheless, CSLDF measurements could be used to compare relative changes in the ocular microcirculation occurring in patients at different stages of OAG progression with the predictions of mathematical models describing ocular hemodynamics; this comparison would help identify which structural, vascular and systemic factors would cause those changes.
Fig. 6.

Two-dimensional perfusion map of the retina and the optic nerve head obtained via confocal scanning laser doppler flowmetry.
Retinal Oximetry
Retinal oximetry uses a modified fundus camera or similar device and developed algorithms to measure oxygen saturation in the arteries and veins. The arteriovenous oxygen difference provides important information about tissue oxygenation and metabolism. A typical color map of retinal oximetry is reported in Figure 7. The oxygen saturation levels in arteries and veins and the diameters of these vessels can be obtained from the oximetry color maps and compared with model predictions of oxygen saturation throughout the retinal vascular network. Mathematical modeling has predicted that the same level of venous oxygen saturation can result from a combination of many different factors, including different levels of arterial blood pressure, IOP, and oxygen demand, as discussed in Section 5.2. A comparison of theoretical scenarios with data from retinal oximetry maps and other basic retinal measurements should be designed to help identify which factors contribute to alterations in blood saturation and tissue oxygenation.
Fig. 7.
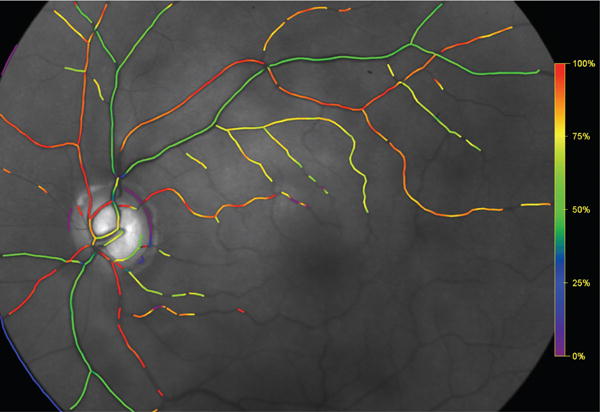
Colormap of oxygen saturation in retinal vessels.
All of the techniques described in this section can be used to assess the ocular structural, ocular vascular, and systemic differences that have been observed among patients of different racial descents. These differences are summarized below.
4. Clinical Evidence of Racial Differences
Several structural, vascular and systemic differences have been observed among people of AD and ED. In this section we summarize the main findings, with the goal of identifying factors that could be potentially investigated via mathematical modeling.
4.1. Ocular Structural Differences
People of AD and ED exhibit differences in their ocular structures. Racette et al., noted that people of AD tend to have thinner corneas,(95) a known risk factor for OAG.(45) The study also found that people of AD have larger optic discs and a thicker retinal nerve fiber layer.(95) Other studies have demonstrated increased macular thickness and mean foveal thickness in people of ED compared to those of AD.(6, 65) People of ED also tend to have a greater amount of mature elastin in the tissue of the optic nerve head.(129) People of AD have a greater percentage of meridionally-aligned fibers composing their sclera.(138) These fibers are fixed to the straight ocular muscles, while the equatorial fibers are fused with the obliques, which may affect scleral tensile forces. Recently, Girkin et al., observed that the sclera and lamina cribrosa are thinner in people of AD compared to those of ED,(44) and Grytz et al., observed that the posterior sclera of people of AD is stiffer compared to people of ED.(48) Moreover, Fazio et al., observed that AD eyes experience a more rapid stiffening with age than ED eyes.(34) These factors may have the greatest influence on the mechanical response of the optic nerve head to changes in IOP.(102, 119–121)
4.2. Ocular Vascular Differences
In addition to structural variations, investigators have also found differences in the vasculature and intraocular oxygen levels between people of AD and ED. For example, Nagasubramanian et al., showed that Caucasians have a greater number of capillaries crossing the disc rim than people of African and Afro-Caribbean descent.(82) Wong et al., showed that subjects of African and Hispanic origin had increased retinal arteriole and retinal venular caliber compared to those of European and Chinese descent.(135) Interestingly, the Blue Mountains Eye Study recently released data indicating that retinal arteriolar narrowing is associated with long-term risk of OAG.(64)
Recent findings within the Indianapolis Glaucoma Progression Study (IGPS) also suggest that vascular contributions to OAG might be more significant in patients of AD when compared to patients of ED. For example, Schroeder et al., observed that changes in retrobulbar blood flow velocities and vascular resistivity indices are correlated to retinal nerve fiber layer thickness in patients of AD but not in those of ED.(108) Similarly, Tobe et al., observed that changes in retinal blood flow are strongly correlated with glaucomatous morphological changes to the optic nerve head in patients of AD, while in patients of ED, these correlations are weak, leading to a statistically significant difference between the two races.(128)
Vascular disparities are also accompanied by differences in tissue oxygen levels. Higher oxygen levels were observed in the ocular tissues of people of AD when compared to those of ED.(58, 114) Moreover, when comparing patients with similar IOP, blood pressure, and visual field defects, patients of AD had a significantly lower arteriovenous difference in retinal oxygen saturation compared to those of ED.(116) These findings suggest that vascular autoregulation and oxygen metabolism might differ among people of AD and ED, and mathematical modeling could be used to investigate the relative importance of these differences.
4.3. Systemic Differences
Many studies suggest a correlation between OAG and systemic diseases, such as hypertension, diabetes,(106) stroke,(105) and cardiovascular disease.(35) The ocular hypertension treatment study cited the presence of heart disease at baseline as a predictor for the development of OAG.(45)
A number of studies suggest that people of AD have significantly higher rates of systemic hypertension than those of ED.(57, 94, 106) Siesky et al., reported AD patients with OAG also had a significantly higher systolic and diastolic blood pressure than ED patients.(115) Additionally, recent data from the Reasons for Geographic and Racial Differences in Stroke (REGARDS) study suggests that changes in blood pressure may have different implications for those of different races, noting that a 10-mm Hg increase in systolic blood pressure increased the stroke risk in white subjects by 8%; in black participants, the same increase in systolic blood pressure led to a 24% increase in stroke risk.(59)
There is conflicting evidence of IOP differences between those of AD and those of ED. While many studies have found that people of AD have, on average, higher IOP measurements,(43, 95, 111) others state that there is no significant difference in IOP between the two races.(106) Mathematical modeling could help understanding the mechanisms relating IOP, blood pressure and ocular hemodynamics, thus potentially providing an opportunity to determine additional modifiable OAG risk factors.
5. Mathematical Modeling
The use of mathematical modeling to study the structural and vascular functions of the eye has emerged only recently. In this section, we review the currently available modeling approaches and we discuss how they could be used to investigate AD/ED disparities.
5.1. Ocular Structures
The mathematical modeling of the biomechanics of ocular structures has attracted considerable attention in the last decades. Understanding how AD/ED differences in ocular structures affect the biomechanics of ocular tissues represents a first important step towards the understanding of how these differences might affect OAG development and progression.
Various mathematical modeling approaches have been successfully implemented to understand and quantify the relationship between the deformations of optic nerve head tissues and mechanical forces due to IOP and scleral tension.
Several studies have modeled the lamina cribrosa using idealized geometries. In Ref. [28], Dongqi and Zeqin used the elastic theory of bending for thin circular plates under axisymmetric loads to describe the displacement W(r) of a point on the middle plane of the lamina cribrosa via the von Kaŕmań Equations:(63)
| (1) |
where r is the distance from the lamina center, Nr is the radial tension in the middle plane, D = Eh3/12(1 – ν2) is the flexural rigidity, E is the Young's modulus increasing with IOP,(136) h is the lamina thickness, ν is the Poisson's ratio, and q is the load given by the difference between IOP and retrolaminar tissue pressure. Exploiting simplifying assumptions that lead to amenable analytical solutions, this study showed that the thickness, radius, and mechanical properties of the lamina cribrosa are the major factors influencing the IOP-induced laminar deformation. The idealization of the lamina as a homogeneous elastic circular plate has also allowed for quantitative estimates of the effect of the different degrees of fixity offered by the connection with the sclera, the pretension caused by scleral expansion, and the ratio between flexural and in-plane stiffness on the mechanical response of the lamina cribrosa to IOP.(83)
More realistic geometries of the lamina cribrosa and the scleral canal have been considered using elasticity models based on finite elements. These models showed that peripapillary scleral thickness,(85) scleral stiffness, ocular axial length, and stiffness of the lamina cribrosa(119–121) have the largest influence on the mechanical response of the optic nerve head to variations in IOP. Interestingly, the mechanical and geometrical properties of the sclera and optic nerve head tissues vary significantly among people of AD and ED, as reviewed in Section 4.1, and consequently it would be reasonable to expect significant differences in their IOP response.
However, this is not a simple matter. Different combinations of geometrical and mechanical ocular properties may lead to similar overall stress and strain distributions in the ocular tissues. This can be easily seen using the applet recently developed by Sigal.(117) This applet combines the ease of use of analytical models with the power of finite elements models to provide rapid estimates of the IOP-related biomechanic response of the optic nerve head. The applet allows to compare strains and stresses in the lamina cribrosa and neural tissue for different levels of IOP, modulus of the lamina cribrosa, sclera and neural tissue, compressibility of the pre laminar neural tissue, radius of the sclera and lamina cribrosa. Comparison of the stress and strain distributions corresponding to different combinations of the above listed factors could provide valuable insights on potential AD/ED differences in susceptibility to OAG damage.
Racial differences have also been detected in the geometrical properties of the cornea, which could be taken into account in the biomechanical models for the optic nerve head described above. Alterations in corneal properties might induce alterations in the dynamics of ocular humors which could alter the local level of IOP transmitted to the optic nerve tissues. Experimental and theoretical approaches have been used to study the mechanical properties of the cornea and the dynamics of ocular humors,(9, 87–89, 98, 99, 103, 124) but they have not yet been coupled to the biomechanical models for the optic nerve head.
Alterations in ocular biomechanics might play an important role in OAG pathophysiology.(12, 13) The presence of IOP-induced deformations in ocular tissues is physiologic, but abnormal changes in such deformations may be pathologic. Pathologic alterations in tissue deformations could induce abnormal alterations in the diameters of blood vessels supplying the tissue, and thereby lead to hemodynamic alterations that could increase the tissue susceptibility to ischemic damage(13, 29, 118) and explain the observed differences in the thickness of the retinal nerve fiber layer, macula and fovea.
The current modeling approaches do not allow for the investigation of the relationship between biomechanical alterations and susceptibility to ischemic damage, since they do not couple the elasticity system for the biomechanics of ocular tissues with the equations describing ocular blood flow and oxygen metabolism. Some contributions in this direction are discussed in the next section.
5.2. Ocular Vasculature
Several AD/ED differences have been observed in the ocular vasculature and blood flow, as discussed in Section 4.2. However, the mathematical modeling of ocular hemodynamics is still somewhat preliminary.
A mathematical model consisting of dichotomous symmetric branching was used to quantify the arterovenous distribution of hemodynamic parameters in the microvasculature of the human retina.(125) In this model, the configuration of the dichotomous vascular tree at a branching point is given by
| (2) |
where r1 is the radius of the mother branch, and r2, 1 and r2, 2 are the radii of daughter branches at the same bifurcation. The blood flow in each vessel is described using the Haigen-Poiseuille law, where the fluid viscosity μ is assumed to vary with the vessel radius r according to
| (3) |
where μ∞ = 1.09 exp(0.024 Hct) is the asymptotic viscosity which depends on the hematocrit Hct of the systemic blood(21) and δ is a constant.(62) The number of retinal capillaries and the caliber of retinal arterioles and venules are included in the model as parameters and therefore this model could be used to investigate how and to what extent the observed AD/ED differences in these parameters affect the average retinal blood flow.
A more realistic image-based network model of a murine retinal vasculature was used to show that the distribution of the blood hematocrit in the retinal network is extremely nonuniform, with lower values at the pre-equator region (near the optic disc) and higher values in the equator region of the retina.(41, 42) Models in Refs. [41, 42, 125] did not account for mechanical forces acting on the retinal vasculature even though retinal arterioles, capillaries and venules are directly exposed to changes in IOP. Moreover, retinal blood flow is indirectly affected by IOP variations through the influence that IOP-induced deformation of the lamina cribrosa has on the central retinal vessels that run through the lamina and supply and drain the retina.
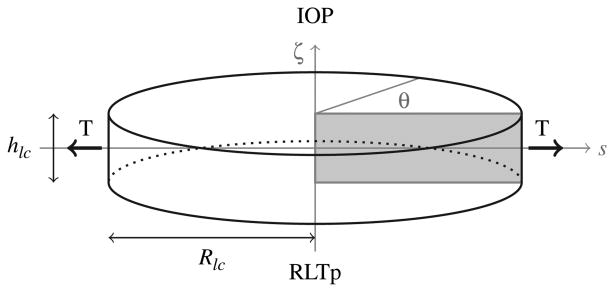
The first mathematical model that couples the IOP-induced deformation of the lamina cribrosa with the CRA hemodynamics has been developed by Carichino et al.(16) The lamina cribrosa is modeled as a homogeneous nonlinear elastic circular plate of finite thickness of radius Rlc and finite thickness hlc, satisfying the equilibrium equations:
| (4) |
where
| (5) |
is the stress tensor, λlc and μlc are the Lame's elastic parameters which vary with the effective stress σe as in Ref. [83],
| (6) |
is the Green-Saint Venant strain tensor, and u is the displacement vector. The domain Ω is depicted in Figure 8. The upper circular surface is subject to the IOP, while the lower surface is subject to the retrolaminar tissue pressure (RTLp), leading to the following boundary conditions:
Fig. 8.
Schematic representation of geometry and boundary conditions of the elasticity problem for the lamina cribrosa. The upper surface (i.e., ζ = hlc/2) faces the interior of the eye globe and is subject to the intraocular pressure (IOP). The lower surface (i.e., ζ = − hlc/2) faces the optic nerve canal and is subject to the retrolaminar tissue pressure (RLTp). The lateral surface (i.e., s = Rlc) is connected to the sclera and experiences the scleral tension T.
| (7) |
where ni and no denote the outward normal vectors to the upper and lower surfaces, respectively. On its lateral surface, the lamina cribrosa is connected to the sclera and it experiences the scleral tension T, which results from the inflation due to the intraocular pressure. Following,(28, 83) the boundary conditions on the lateral surface are
| (8) |
where nl is the outward normal vector to later surface, uζ is the displacement along the ζ axis, and T is computed using the Laplace's law T = (IOPRs/2hs), where Rs and hs are the scleral radius and thickness, respectively.
The CRA is described as a fluid-structure interaction system, where blood flow is modeled as the stationary Stokes flow of a Newtonian viscous fluid, while the arterial wall is modeled as a linear elastic cylindrical thick shell, in the same spirit as Ref. [80]. Under the assumptions that:
the deformation of the arterial wall obeys the linear theory of elasticity;
the axial displacement is negligible with respect to the radial displacement;
-
geometry, loading and solutions are axially symmetric; The equilibrium equation for the arterial wall reduces to
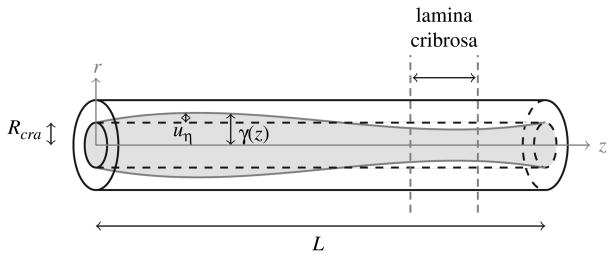
(9) for (η, z) ∈ (Rcra, Rcra + hcra) × (0, L), where uη = uη(η, z) denotes the radial displacement. Eq. (9) necessitates boundary conditions for the external and internal cylindrical surfaces located at η = Rcra + hcra and η = Rcra, respectively. On the external surface located at η = Rcra + hcra, we prescribe the normal stress through the condition
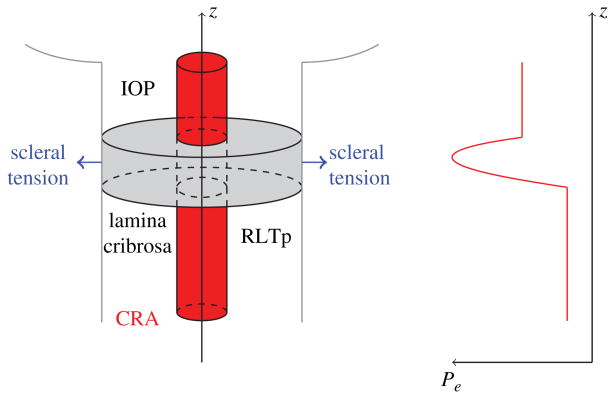
(10) where λcra and μcra are the Lame's constants of the CRA wall. The external pressure Pe(z) varies along the length of the CRA, accounting for the action of the retrolaminar tissue pressure, the presence of the lamina cribrosa, and the intraocular pressure, as sketched in Figure 9.
Fig. 9.
Left: Schematic representation of the mathematical model describing the coupling between the IOP-induced deformation of the lamina cribrosa and the CRA hemodynamics.(16) Right: Schematic representation of the external pressure acting on the CRA walls varies along the vessel length to account for the retrolaminar tissue pressure (RTLp), IOP and the compression induced by the deformation of the lamina cribrosa.
On the internal surface located at η = Rcra representing the interface between arterial wall and blood, we impose the balance of stress
| (11) |
where ψ(z) is the function describing the action of blood flow on the arterial wall. Specifically, ψ(z) is defined as
| (12) |
where p denotes the fluid pressure and γ describes the wall/blood interface in eulerian coordinates and it is related to the radial displacement of the wall by
| (13) |
Under the assumptions that:
the blood can be described as a Newtonian incompressible viscous fluid;
the pressure depends only on z;
the radial velocity is negligible in the balance of axial momentum;
-
geometry, loading and solutions are axially symmetric; The equations of conservation of mass and balance of axial momentum describing blood flow in the central retinal artery reduce to
(14) for (r,z) ∈ [0, γ(z)] × (0, L), where υr and υz denote the radial and axial components of the blood velocity, p denotes the pressure, μb denotes the blood (effective) viscosity. Pressure is prescribed at the inlet and outlet sections of the vessel, namely p = P0 for z = 0 and p = PL for z = L. At the blood/arterial wall interface, the no-slip condition is imposed leading to υr = 0 and υz = 0 for r = γ(z), and the balance of stress condition (11).
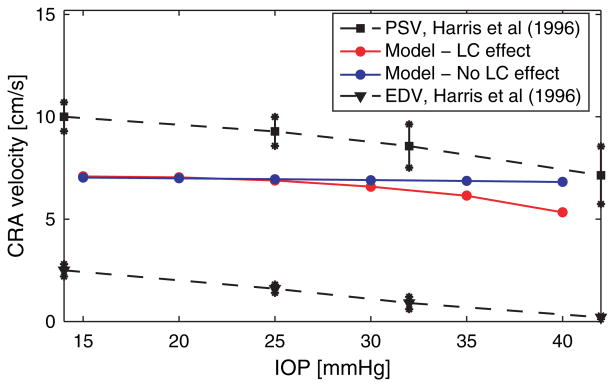
This coupled model predicts a strong interaction between biomechanical and hemodynamic factors in the CRA. More precisely, the model shows that acute IOP elevations induce a decrease in the blood velocity in the CRA, and this is in agreement with clinical studies.(36, 51) Figure 11 reports the clinical data obtained by Harris et al., who artificially induced IOP elevation on eleven healthy individuals using suction opthalmodynamometry. IOP was elevated from a baseline near 14 mmHg to approximately 45 mmHg in 3–4 increments. At each IOP level, peak systolic and end diastolic velocities (PSV and EDV) were measured in the central retinal artery using Color Doppler Imaging (CDI). The measurements were performed at an intermediate location between the lamina cribrosa and the eye globe, corresponding to z = L in the CRA model depicted in Figure 10.
Fig. 11.
Effect of IOP elevation on CRA centerline velocity. Comparison between the predictions of the mathematical model in the case when the effect of the lamina cribrosa is included (red line) or not included (blue line) and the in vivo measurements for peak systolic velocity (PSV) and end diastolic velocity (EDV) (dashed lines) obtained via Color Doppler Imaging by Harris et al.(51)
Fig. 10.
Schematic of the model for the central retinal artery (CRA). The function γ(z) describes the wall/blood interface in eulerian coordinates, Rcra is the reference radius of the CRA, and uη is the radial displacement of the arterial wall. The vertical dashed lines indicate the location of the lamina cribrosa with respect to the CRA axis.
The model was also used to identify the mechanisms responsible for the clinically-observed blood velocity reduction. The model indicates that IOP elevation induces a larger posterior displacement of the lamina cribrosa and, consequently, a small compressive region arises in the lamina near its central axis towards the eye globe. Figure 11 reports the blood velocity at the CRA centerline computed via the mathematical model for increasing IOP values in the case where the compressive action of the lamina cribrosa on the CRA walls is included (red curve) or not included (blue). The good agreement between the red curve and the clinical data indicates that the compressive action of the lamina cribrosa is necessary to explain the IOP induced velocity reduction of the blood flow in the CRA. The model also shows that the compressive effect exerted by the lamina cribrosa on the CRA walls for a given IOP value might vary significantly among individuals depending on the geometrical and mechanical properties of their lamina cribrosa and sclera, as well as their arterial blood pressure. Interestingly, these factors have been observed to differ among people of AD and ED.
These findings have important clinical implications. Due to individual variations of geometrical and mechanical properties of ocular tissues, different individuals might be more susceptible to vascular alterations than others. The model could be used to investigate how the observed AD/ED differences in the geometry of the optic disc and the lamina cribrosa influence the IOP/CRA relationship and therefore the blood supply to the retina.
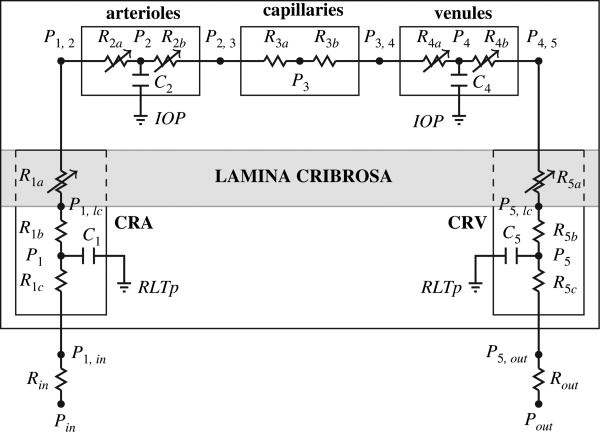
A more comprehensive, even though less detailed, description of retinal blood flow has been achieved by the lumped network model depicted in Figure 12. The model includes two retrobulbar vascular compartments, i.e. the central retinal artery (CRA) and the central retinal vein (CRV), and three intraocular vascular compartments, i.e. retinal arterioles, capillaries and venules.(18) The blood flow in the retinal vascular network is time-dependent, driven by the systemic pressures Pin(t) and Pout(t) and regulated by variable resistances which account for the nonlinear effects due to (i) IOP-induced compression of the lamina cribrosa on the retinal vessels (obtained via multi-scale coupling with the model developed in Ref. [16]), and (ii) blood flow autoregulation. Compartmental compliances are introduced to account for arterial and venous distensibilities. The blood flow in the network is computed as the solution of a system of five nonlinear ordinary differential equations, obtained by imposing conservation of mass in the network. Using Kirchoff's law at every node of the network, the dynamics of the circulation through the retinal network can be described by the following system of four ordinary differential equations:
Fig. 12.
Schematic representation of the lumped compartment model describing retinal blood flow. The model includes two retrobulbar vascular compartments, i.e. the central retinal artery (CRA) and the central retinal vein (CRV), and three intraocular vascular compartments, i.e. retinal arterioles, capillaries and venules. Retrobulbar and intraocular compartments are separated by the lamina cribrosa, a mesh-like collagen structure that helps maintaing the pressure difference between the IOP in the interior of the eye and the retrolaminar tissue pressure (RTLp).
where Ck, with k = 1, 2, 4, 5, denote the capacitance of the compartment k, while the conductances Gi,j are given by Gin, 1 = (Rin + R1c)−1, G1, 2 = (R1b + R1a + R2a)−1, G2, 4 = (R2b + R3a + R3b + R4a)–1, G4, 5 = (R4b + R5a + R5b)−1, G5,out = (R5c + Rout)–1. The unknowns of the system are the four nodal pressures P1, P2, P4 and P5, shown in Figure 12. Then, the pressures at the other nodes of the network as well as the flow rate between nodes can be computed a posteriori Omh's law.
The inlet and outlet pressures Pin(t) and Pout(t) cannot be measured directly, and therefore they are obtained as the solution of an inverse problem aimed at determining the time-dependent functions that would give reasonable velocity profiles in the CRA and CRV, similar to the one shown in Figure 4 obtained with Color Doppler Imaging. The variable resistances R1a and R5a describe the effect of the lamina cribrosa deformation on the central retinal vessels and their value changes as a function of the levels of IOP, retrolaminar tissue pressure, scleral tension and intraluminal pressure according to the three-dimensional model developed by Carichino et al.,(16) described above. The variable resistances R2a and R2b describe the blood flow regulation in a phenomenological way as in Ref. [67]. The other parameters in the model are estimated using data reported in the literature.(67, 12)
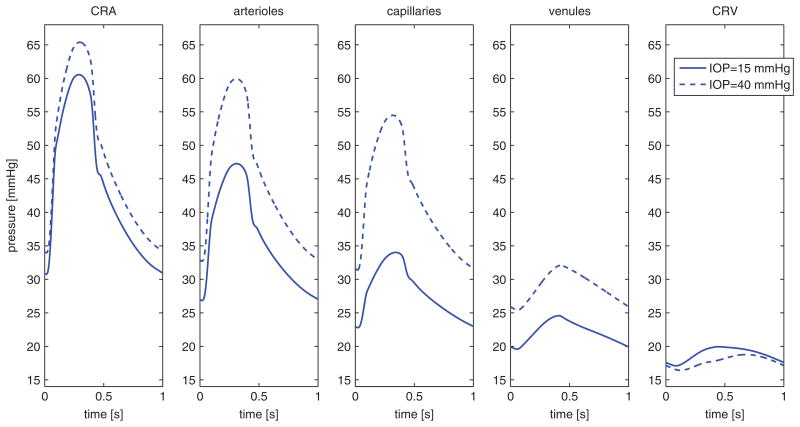
Figure 13 reports the pressure waveforms in the five vascular compartments computed for IOP = 15 mmHg and 40 mmHg using the lumped model. The intraluminal pressure in the CRA, upstream of the lamina cribrosa, increases with IOP, while the pressure in the CRV, downstream of the lamina cribrosa, decreases with IOP. These results suggest that the IOP-induced deformation of the lamina cribrosa acts as a “double-faucet” on the retinal network, as it compresses simultaneously both CRA and CRV. The model also suggests that the IOP-induced compression on the CRV is more significant than on the CRA, leading to an overall increase of blood pressure in the three intraocular compartments (arterioles, capillaries and venules) as IOP increases. These results suggest the existence of a built-in compensatory mechanism to help intraocular vessels better sustaining IOP elevations. Clinical confirmation of such a compensatory mechanism would represent a major step forward in the understanding of ocular hemodynamics and its related pathologies.
Fig. 13.
Pressure waveforms in the five network compartments computed for IOP = 15 mmHg and 40 mmH. These results suggest that the IOP-induced compression on the CRV is more significant than on the CRA, leading to an overall increase of blood pressure in the intraocular compartments (arterioles, capillaries and venules) as IOP increases.
The model also predicts that the effectiveness of this compensatory mechanism depends on the geometrical and mechanical properties of the sclera and lamina cribrosa, which have been found to differ among people of AD and ED. Therefore, the coupling between this lumped compartment model for the retinal vasculature and the biomechanics models for ocular tissue described in Section 5.1 might be extremely useful in investigating how and to what extent the combined effect of AD/ED differences in ocular structures and hemodynamics might influence tissue perfusion.
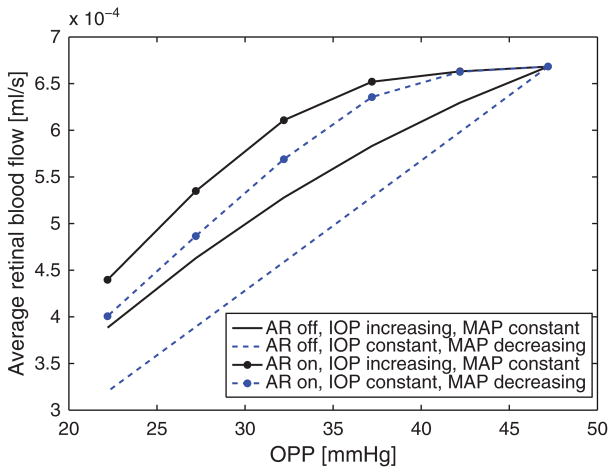
This modeling approach can also be used to investigate the specific role of various OAG risk factors. For example, several studies have suggested low ocular pressure as a risk factor for OAG.(14, 15) Ocular perfusion pressure (OPP) is calculated as OPP = 2/3 MAP – IOP, where MAP is the mean arterial pressure, and it remains unclear whether or not MAP and IOP should be considered as independent OAG risk factors.(15) The lumped network model was used to address this controversial question by simulating changes in retinal blood flow induced by changes in OPP attained by varying either MAP or IOP while holding the other constant. The model results are shown in Figure 14 for the cases where autoregulation (AR) is functioning normally (AR on) and when autoregulation is impaired (AR off). The model predicted values of retinal blood flow vary by only 2% when changes in OPP are obtained by altering MAP (IOP constant) versus altering IOP (MAP constant), given that autoregulation is functioning normally. If autoregulation is impaired, model predicted values of retinal blood flow vary up to 11% depending on whether alterations in OPP are obtained by decreasing MAP or increasing IOP. The reduction rate of retinal blood flow is linear when MAP is reduced and nonlinear when IOP is increased. These results suggest that low MAP and high IOP should be considered as independent risk factors when autoregulation is impaired. Similarly, the model could be used to investigate how AD/ED structural and vascular disparities influence the relative importance of low MAP, elevated IOP and other OAG risk factors.
Fig. 14.
Model predictions of changes in average retinal blood flow with changes in ocular perfusion pressure (OPP) attained by varying independently mean arterial pressure (MAP) or IOP, in the case of functional or impaired auto regulation (AR on/AR off). The results suggest that low MAP and elevated IOP should be considered as independent OAG risk factors in the case of impaired autoregulation.
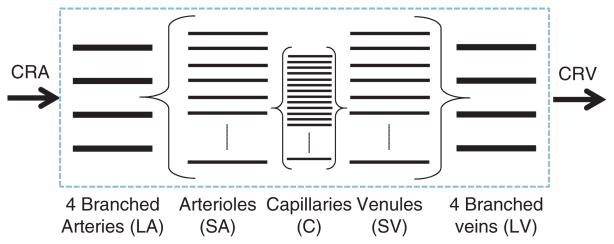
Mathematical models have also been developed to describe blood flow autoregulation in the retina and the oxygen saturation levels in retinal vessels and tissue. Arciero et al., introduced a theoretical model that assesses the relative contributions of pressure, shear stress, metabolic, and carbon dioxide response mechanisms to the autoregulation of blood flow in the retina.(4) The intraocular retinal vasculature is modeled via the representative segment model depicted in Figure 15 which includes large arterioles (LA; the four vessels that branch from the CRA), small arterioles (SA), capillaries (C), small venules (SV), and large venules (LV; the four vessels that drain into the central retinal vein). The pathway is assumed to be symmetric with respect to vessel length (L) and number (n) in corresponding arteriolar and venous compartments; flow resistance (R) is calculated according to Poiseuille Law R = (128Lμ/πnD4), where μ is the blood viscosity and D is the vessel diameter.
Fig. 15.
Representative segment model developed in Ref. [4] for the retinal vasculature. The model includes five intraocular compartments downstream of the central retinal artery (CRA) and upstream of the central retinal vein (CRV). The large arterioles (LA) and small arterioles (SA) are assumed to be vasoactive, and the remaining compartments are fixed resistances.
The large and small arterioles are assumed to be vasoactive and the remaining compartments are considered to be fixed resistances. Resistance vessels are assumed to respond to local changes in pressure, shear stress, and carbon dioxide and to the downstream metabolic state communicated via conducted responses. This is achieved via a mechanical model of resistance vessel walls where the total circumferential tension in the vessels wall Ttotal is generated by a passive and active component
| (15) |
where Tpassive represents the wall tension generated by the structural components of the vessel wall, is the maximum degree of active wall tension that can be generated in response to maximal constriction of the vascular smooth muscle cells, and A is the vascular smooth muscle tone (activation) written as A = 1/(1 +exp(−Stone)), with Stone being a stimulus function which dictates changes in smooth muscle tone according to a linear combination of regulatory mechanisms as in Refs. [5, 17].
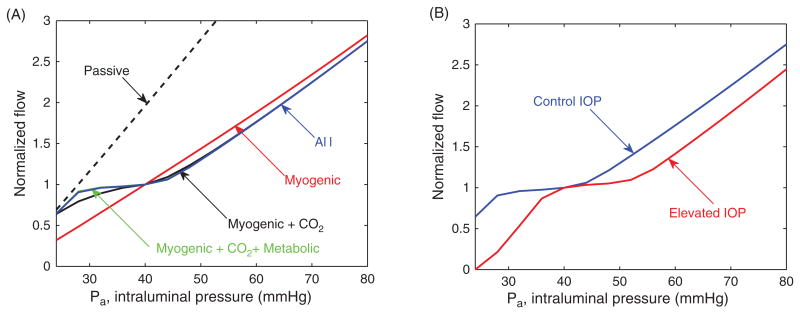
The model is used to predict the autoregulation pressure range for both control and elevated levels of intraocular pressure (IOP). Figure 16 (A) reports the retinal blood flow calculated with the model for different values of the input arterial pressure Pa. The flow is normalized with respect to Pa = 40 mmHg. A nearly flat portion of a curve indicates strong autoregulation. The dashed line represents a passive vessel response when no regulatory mechanisms are active. Individual and combined roles of myogenic, shear, metabolic, and carbon dioxide mechanisms on autoregulation are evaluated at a control level of IOP= 15 mmHg. Model predictions suggest that the metabolic and carbon dioxide responses are critical for autoregulation.
Fig. 16.
(A) Normalized retinal blood flow calculated using the representative segment model for different values of the input arterial pressure Pa. (B) Effect of increasing IOP from 15 mmHg (control IOP) to 25 mmHg (elevated IOP) on the range of pressures for which autoregulation is obtained.
Figure 16 (B) shows the effect of increasing IOP from 15 mmHg (control IOP) to 25 mmHg (elevated IOP) on the range of arterial pressures for which autoregulation is obtained. The length of the autoregulation range is conserved despite increases in IOP. However, autoregulation fails to operate over its expected pressure range when IOP is elevated, indicating that autoregulation is impaired at low perfusion pressure; this result provides a potential explanation for why impaired autoregulation is hypothesized to be a contributing factor to OAG progression.
The model is also capable of computing the levels of blood oxygen saturation in the retinal vessels. Oxygen is assumed to be delivered to surrounding tissue by the large arterioles, small arterioles, and capillaries using a Krogh cylinder model.(5, 77) Oxygen exchange by venules and veins is neglected. Saturation profiles calculated with IOP = 15 mmHg and 25 mmHg are reported in Figure 17 (B) and (C) for Pa = 28 mmHg (low), Pa = 40 mmHg (med) and Pa = 80 mmHg (high) values of input arterial pressure. The model predictions show critical differences in physiological levels of oxygen saturation in the venous segment of the retinal vasculature for the same tissue metabolic demand, depending on whether Pa or IOP is altered, and therefore the model could be used to provide a more accurate clinical interpretation of retinal oxymetry maps, such as the one shown in Figure 17(A).
Fig. 17.

(A) Oximetry map from a white female patient currently enrolled in the Indianapolis Glaucoma Progression Study (IGPS). Color bar indicates 90–100% oxygen saturation (red) in arteries and arterioles and 50–75% oxygen saturation (green/yellow) in venules and veins for IOP = 16 mmHg. (B) Model predicted values of blood oxygen saturation is shown as a function of distance along a preliminary model vascular network for control IOP = 15 mmHg. (C) Blood oxygen saturation levels as in (B) for an elevated level of IOP = 25 mmHg.
This model could be extended to evaluate different conditions that are typical of patients from different racial groups. For example, since increased oxygen saturation is typical of people of AD, the model can be used to test whether blood flow autoregulation is compromised as blood oxygen saturation is increased. In the model simulations, the increase in saturation is obtained by reducing tissue oxygen demand; venous saturation is initially 0.68 and is increased incrementally up to 0.9. The degree of autoregulation is defined as the ratio of blood flow levels at two different pressure values; in the case of perfect autoregulation, the degree of autoregulation should be 1 because flow should not change. If all mechanisms of autoregulation are assumed to be functioning properly, a 12% relative increase in the degree of autoregulation was predicted as oxygen saturation was increased from 0.68 to 0.9. If the metabolic mechanism was assumed to be impaired, the relative increase in the degree of autoregulation was predicted to be 24%. These model simulations suggest that in the case of increased blood saturation or impaired vascular response mechanisms, the ability for the retinal vascular bed to autoregulate sufficiently is compromised. Additional exploration of these predictions will help to elucidate how racial disparities in ocular vascular factors may contribute to the progression and development of OAG.
5.3. Systemic Conditions
The mechanisms underlying the relationship between alterations in systemic blood pressure, intraocular pressure and OAG pathophysiology are not yet completely understood, even though blood pressure definitely influences ocular hemodynamics. Xu et al., noted that both systolic and diastolic blood pressures have a positive correlation with IOP.(137) Deokule and Weinreb observed a strong positive correlation between systolic blood pressure and IOP and a weaker positive relationship between diastolic blood pressure and IOP. They concluded that blood pressure might have a stronger correlation with ocular hypertension than with OAG, noting that an increase in systolic blood pressure was associated with an increase in IOP but a decreased long-term risk to develop OAG.(27) Others have found systemic blood pressure to be positively related to both IOP and the diagnosis of OAG.(10) Blood arterial pressure has also been shown variations related to ethnicity, and this contributes to further complicate the picture. Mathematical models combining systemic and ocular components could help investigating some of these controversial issues, but such models have not been developed yet.
Many whole body models have been proposed to describe the principles regulating systemic blood pressure. For example, mathematical models have been used to investigate the variations in blood pressure and blood flow during postural change from sitting to standing,(86) the physiology of heart mechanics,(110) and the dynamics of intracranial pressure.(68) It would be extremely interesting to extend these models to include the coupling between the systemic pressure dynamics and the dynamics of ocular humors cited in Section 5.1. The dynamics of ocular humors determines the level of IOP, and therefore such coupled models could help elucidating the complex IOP-blood pressure relationship, which is a fundamental open question in ocular physiology. On the same line, these systemic models could be extended to include the coupling between systemic pressure dynamics, biomechanics of ocular tissues and ocular hemodynamics, as they would help elucidating how structural, vascular and systemic factors combine to determine ocular tissue perfusion. Possible coupling strategies could rely on multi-scale coupling,(37) such as the 3D–1D coupling developed by Passerini et al, to study the cerebral vasculature.(91)
6. Mathematical Challenges and Future Directions
Biomechanical, hemodynamic and systemic factors play an important role in OAG development and progression, and their relative contributions to the disease might differ among people of AD and ED. The relationship between these factors is extremely complex and still poorly understood. In this review we provided some examples of how mathematical modeling has been used in combination with real data to address clinically relevant questions. Despite the promising future of integrated approaches combining mathematical and clinical/experimental methods, there is still a long way to go.
In order to study the relationship between OAG and biomechanical, hemodynamic and systemic factors, it is necessary to include in the models a description of metabolic factors and cellular functions. More precisely, the functionality and life cycle of retinal ganglion cells, as well as other cells involved in OAG pathophysiology such as astrocytes, should be modeled in relation to the availability of oxygen and other nutrients delivered to the tissue under conditions of functional or impaired blood flow regulation and under the action of physiologic or pathologic mechanical forces. Even though some metabolic models have been recently proposed to examine angiogenesis in the retina(7, 132) and choroid,(112) the coupling of such models with mechanical, vascular and systemic factors constitutes a novel, extremely interesting and challenging direction of research.
The development of coupled models describing the interaction between
the distribution of stresses and strains in ocular tissues due to the action of mechanical forces, including IOP and retrolaminar tissue pressure;
the blood flow through these deformable tissues;
the auto regulation of blood flow in the tissues;
the transport and delivery of oxygen and other nutrients to the tissues; and
the functionality and life cycle of retinal ganglion cells presents many challenges.
Several different time scales are embedded in this complex system, as the characteristic time of wall oscillations in the large arteries is a tenth of a second, the cardiac cycle lasts approximately 1 second, the circadian rhythm modulating IOP and blood pressure spans over 24 hours, and the progression of OAG occurs over several years. The system also involves multiple length scales, as the typical dimension of an eye is approximately 2.4 cm, the dimension of the lamina cribrosa is around 2.5 mm, the lumen of the central retinal artery is approximately 160 μm, and the size of the soma of a retinal ganglion cell is approximately 20 μm. Multi-scale approaches will have to be developed to properly account for this variety of time and length scales that indeed influence each other, and this is a very challenging task.
The system also includes fluid-structure interactions, where the flow of a fluid and the deformation of an elastic structure interact and influence each other. This is the case for the blood flow in the ocular compliant vessels and the dynamics of the ocular humors within the deformable ocular structures. The numerical solution of fluid-structure interaction problems is not trivial, as numerical instabilities may arise depending on the geometrical and mechanical properties of the fluid and solid involved (see e.g., Refs. [19, 49, 84, 93]). Fluid-structure interactions are usually described by partial differential equations (PDEs) of mixed type, combining hyperbolic, parabolic and, possibly, elliptic effects, whose relative importance might vary depending on the flow regime. The numerical solution of PDEs of mixed type is complex and should be approached differently depending on whether or not there is a dominant effect. As a consequence, a theoretical investigation of the main mathematical features of these complex coupled system should be performed in order to devise an appropriate numerical strategy for their solution.
7. Conclusions
Many fundamental questions regarding OAG pathophysiology remain open, including the reasons why OAG affects individual of different ethnicities in a different way. OAG is a multi-factorial disease, and the synergistic combination between mathematical models and clinical, population or animal studies could help unraveling the individual contributions of single factors and aid the development of novel therapies.
Many mathematical models have been developed to study specific problems related to ocular biomechanics, ocular hemodynamics and systemic conditions. However, the need of understanding OAG pathophysiology and identifying other modifiable risk factors, in addition to IOP, calls for the development of a new generation of models that are capable of describing the multi-scale coupling between different systems, e.g., biomechanics of ocular tissues, hemodynamics of ocular blood flow, functionality of retinal ganglion cells. The development of such models constitutes a very challenging and intriguing task from the mathematical viewpoint.
In conclusion, the use of mathematical modeling in conjunction with clinical and laboratory research may hold a great potential in the exploration of the pathophysiology of OAG, while leading to advances in the mathematical understanding of multi-scale coupled systems.
Table 1.
Summary of abbreviations.
| Acronym | Description |
|---|---|
| OAG | Open Angle Glaucoma |
| IOP | Intraocular Pressure |
| AD | African Descent |
| ED | European Descent |
| OA | Ophthalmic Artery |
| OV | Ophthalmic Vein |
| CRA | Central Retinal Artery |
| CRV | Central Retinal Vein |
| NPCA | Nasal Posterior Ciliary Artery |
| TPCA | Temporal Posterior Ciliary Artery |
| CDI | Color Doppler Imaging |
| FD-OCT | Fourier-Domain Optical Coherence Tomography |
| CSLDF | Confocal Scanning Laser Doppler Flowmetry |
| PSV | Peak Systolic Velocity |
| EDV | End Diastolic Velocity |
| RI | Pourcelot's index of resistivity |
| OPP | Ocular Perfusion Pressure |
| MAP | Mean Arterial Pressure |
Acknowledgments
This work was partially supported by the NSF/DMS grant 1224195, the NIH grant R21EY022101-01A1, and the Indiana University Collaborative Research Grant fund of the Office of the Vice President for Research. The authors sincerely thank the reviewers for their thoughtful suggestions.
Biographies

Giovanna Guidoboni, Ph.D. is an Associate Professor in the Department of Mathematical Sciences at IUPUI, and an Adjunct Professor in the Department of Ophthalmology of the Indiana University School of Medicine. Dr. Guidoboni is a former Fulbright scholar who received her B.S. and M.S. in Engineering of Materials and her Ph.D. in Mathematics from the University of Ferrara (Italy). Dr. Guidoboni's research in applied mathematics focuses on the mathematical and computational modeling of complex fluid flows arising in engineering and biomedical applications. After joining IUPUI in 2010 and meeting Dr. Harris, Dr. Guidoboni became interested in the modeling of ocular blood flow, and, specifically, the modeling of the relationship between bio-mechanical and vascular function of the retina and optic nerve head.

Alon Harris, Ph.D., is a Professor of Ophthalmology and is the Director of Clinical Research and Director of the Glaucoma Research and Diagnostic Center at the Eugene and Marilyn Glick Eye Institute at the Indiana University School of Medicine. Professor Harris' research seeks to determine mechanisms involved in the etiology and pathophysiology of diseases of the eye, including glaucoma, age-related macular degeneration, and diabetic retinopathy, with an emphasis towards determining the role of ischemia in the development and pathogenesis of these diseases by applying appropriate technology. Professor Harris is the author of more than 290 peer-reviewed journal articles, 24 books and 39 book chapters. Professor Harris performed his undergraduate work at Wingate Institute in Israel and received his masters and doctorate at Indiana University, Bloomington, IN.

Julia C. Arciero, Ph.D., is an Assistant Professor in the Department of Mathematical Sciences at IUPUI. She received her B.S. in Mathematics from the University of Michigan and her M.S. and Ph.D. in Applied Mathematics from the University of Arizona. She completed a postdoc at the University of Pittsburgh before accepting her position at IUPUI in 2011. Dr. Arciero's research in applied mathematics involves the development and analysis of ordinary and partial differential equation models of physiological phenomena including blood flow regulation, the immune response, inflammation, and cell migration. She is dedicated to using interdisciplinary approaches in her research and has established multiple collaborations with experimentalists and clinicians at the Indiana University School of Medicine and Johns Hopkins University.

Brent A. Siesky, Ph.D., is the Assistant Director of the Glaucoma Research and Diagnostic Center at the Eugene and Marilyn Glick Eye Institute at Indiana University's School of Medicine. Dr. Siesky is the author of more than 70 peer-reviewed manuscripts and book chapters and specializes in clinical methodologies to assess ocular blood flow and metabolism. Dr. Siesky received his bachelor's degree from the University of Evansville, Evansville, IN and his doctorate from Indiana University, Bloomington, IN.

Annahita Amireskandari, MD, is a clinical research fellow at the Eugene and Marilyn Glick Eye Institute at Indiana University. She received a BA in Japanese from the University of Michigan and her MD from Ross University School of Medicine. She is interested in glaucomatous optic neuropathy and ocular hemodynamics. She is also studying the racial disparities of the disease as well as the relationship between diabetes and glaucoma.

Austin L. Gerber, MD, graduated summa cum laude with a B.S. in biology from Indiana Wesleyan University and received his medical degree from Indiana University School of Medicine. He was the 2012 recipient of the Abrams Ophthalmology Summer Research Fellowship award. Following his intern year in transitional medicine, he will train as an ophthalmology resident at the University of Alabama Birmingham.

Andrew H. Huck is a first year medical student at Indiana University School of Medicine. He began his research efforts while obtaining his masters degree in physiology at IUPUI. As an undergraduate at Butler University, Indianapolis, IN, Andrew served as the quarterback of the schools division one football team where he was named PFL offensive player of the week among many other honors. Andrew continues to be involved with clinical research as he pursues his medical education at Indiana University School of Medicine.

Nathaniel J. Kim is a first-year medical student at the Indiana School of Medicine. Previously, he received his B.A. in Chemistry with a focus in nanotechnology from Northwestern University.

Simone Cassani is a graduate student in the Department of Mathematical Sciences at IUPUI. Previously, he received his B.S. and M.S. in Mathematical Engineering at the Politecnico di Milano (Italy).

Lucia Carichino is a graduate student in the Department of Mathematical Sciences at IUPUI. Previously, she received his B.S. and M.S. in Mathematical Engineering at the Politecnico di Milano (Italy).
Footnotes
Section: Life, Climate & Environmental Sciences
References and Notes
- 1.National Eye Institute, National Institute of Health. http://www.nei.nih.gov/health/eyediagram/eyeimages3.asp.
- 2.Alm A, Bill A. Oxygen supply to retina 2. Effects of high intraocular-pressure and of increased arterial carbondioxide tension on uveal and retinal blood-flow in cats—Study with radioactively labeled microspheres including flow determinations in brain and some other tissues. Acta Physiol Scand. 1972;84:306. doi: 10.1111/j.1748-1716.1972.tb05182.x. [DOI] [PubMed] [Google Scholar]
- 3.Alm A, Bill A. Ocular and optic-nerve blood-flow at normal and increased intraocular pressures in monkeys (macaca-irus)— Study with radioactively labeled microspheres including flow determinations in brain and some some other tissues. Exp Eye Res. 1973;15:15. doi: 10.1016/0014-4835(73)90185-1. [DOI] [PubMed] [Google Scholar]
- 4.Arciero JC, Harris A, Siesky B, Amireskandari A, Gershuny V, Pickrell A, Guidoboni G. Theoretical analysis of vascular regulatory mechanisms contributing to retinal blood flow autoregulation. Invest Ophthalmol Vis Sci. 2013 doi: 10.1167/iovs.12-11543. [DOI] [PMC free article] [PubMed] [Google Scholar]
- 5.Arciero JC, Carlson BE, Secomb TW. Theoretical model of metabolic blood flow regulation: Roles of ATP release by red blood cells and conducted responses. Am J Physiol Heart Circ Physiol. 2008;295:1562. doi: 10.1152/ajpheart.00261.2008. [DOI] [PMC free article] [PubMed] [Google Scholar]
- 6.Asefzadeh B, Cavallerano AA, Fisch BM. Racial differences in macular thickness in healthy eyes. Optom Vis Sci. 2007 Oct;84:941. doi: 10.1097/OPX.0b013e318157a6a0. [DOI] [PubMed] [Google Scholar]
- 7.Aubert M, Chaplain MA, McDougall SR, Devlin A, Mitchell CA. A continuum mathematical model of the developing murine retinal vasculature. Bull Math Biol. 2011;73:2430. doi: 10.1007/s11538-011-9631-y. [DOI] [PubMed] [Google Scholar]
- 8.Blum M, Bachmann K, Wintzer D, Riemer T, Vilser W, Strobel J. Noninvasive measurement of the Bayliss effect in retinal autoregulation. Graefe's archive for clinical and experimental ophthalmology = Albrecht von Graefes Archiv fur klinische und experimentelle Ophthalmologie. 1999;237:296. doi: 10.1007/s004170050236. [DOI] [PubMed] [Google Scholar]
- 9.Bonfiglio A, Repetto R, Siggers JH, Stocchino A. Investigation of the motion of a viscous fluid in the vitreous cavity induced by eye rotations and implications for drug delivery. Phys Med Biol. 2013;58:1969. doi: 10.1088/0031-9155/58/6/1969. [DOI] [PubMed] [Google Scholar]
- 10.Bonomi L, Marchini G, Marraffa M, Bernardi P, Morbio R, Varotto A. Vascular risk factors for primary open angle glaucoma: The egna-neumarkt study. Ophthalmology. 2000;107:1287. doi: 10.1016/s0161-6420(00)00138-x. [DOI] [PubMed] [Google Scholar]
- 11.Budenz DL, Anderson DR, Feuer WJ, Beiser JA, Schiffman J, Parrish RK, 2nd, Piltz-Seymour JR, Gordon MO, Kass MA, Ocular Hypertension Treatment Study Group Detection and prognostic significance of optic disc hemorrhages during the ocular hypertension treatment study. Ophthalmology. 2006;113:2137. doi: 10.1016/j.ophtha.2006.06.022. [DOI] [PMC free article] [PubMed] [Google Scholar]
- 12.Burgoyne CF. A biomechanical paradigm for axonal insult within the optic nerve head in aging and glaucoma. Exp Eye Res. 2011;93:120. doi: 10.1016/j.exer.2010.09.005. [DOI] [PMC free article] [PubMed] [Google Scholar]
- 13.Burgoyne CF, Downs JC, Bellezza AJ, Suh JKF, Hart RT. The optic nerve head as a biomechanical structure: A new paradigm for understanding the role of ioprelated stress and strain in the pathophysiology of glaucomatous optic nerve head damage. Prog Retin Eye Res. 2005;24:39. doi: 10.1016/j.preteyeres.2004.06.001. [DOI] [PubMed] [Google Scholar]
- 14.Caprioli J, Coleman AL. Intraocular pressure fluctuation a risk factor for visual field progression at low intraocular pressures in the advanced glaucoma intervention study. Ophthalmology. 2008;115:1123. doi: 10.1016/j.ophtha.2007.10.031. [DOI] [PubMed] [Google Scholar]
- 15.Caprioli J, Coleman AL. Blood Flow in Glaucoma Discussion; Blood pressure, perfusion pressure, and glaucoma. Am J Ophthalmol. 2010;149:704. doi: 10.1016/j.ajo.2010.01.018. [DOI] [PubMed] [Google Scholar]
- 16.Carichino L, Guidoboni G, Arieli Y, Siesky BA, Harris A. Effect of lamina cribrosa deformation on hemodynamics of the central retinal artery: A mathematical model. Annual Meeting of the Association for Research in Vision and Ophthalmology; 2012. Program 2836, Abstract A165. [Google Scholar]
- 17.Carlson BE, Arciero JC, Secomb TW. Theoretical model of blood flow autoregulation: Roles of myogenic, shear-dependent, and metabolic responses. Am J Physiol Heart Circ Physiol. 2008;295:H1572. doi: 10.1152/ajpheart.00262.2008. [DOI] [PMC free article] [PubMed] [Google Scholar]
- 18.Cassani S, Guidoboni G, Pickrell A, Siesky BA, Harris A. Quantitative estimate of retinal blood flow alterations due to changes in ocular perfusion pressure and autoregulatory function: A mathematical model. Annual Meeting of the Association for Research in Vision and Ophthalmology; 2012. Program 2838, Abstract A167. [Google Scholar]
- 19.Causin P, Gerbeau JF, Nobile F. Added-mass effect in the design of partitioned algorithms for fluid-structure problems. Comput Methods Appl Mech Engrg. 2005;194:4506. [Google Scholar]
- 20.Cherecheanu AP, Garhofer G, Schmidl D, Werkmeister R, Schmetterer L. Ocular perfusion pressure and ocular blood flow in glaucoma. Curr Opin Pharmacol. 2013;13:36. doi: 10.1016/j.coph.2012.09.003. [DOI] [PMC free article] [PubMed] [Google Scholar]
- 21.Chien S, Usami S, Skalak R. The Cardiovascular System, Microcirculation. Bethesda: American Physiological Society; 1984. Blood flow in small tubes. Handbook of Physiology. [Google Scholar]
- 22.Coleman AL, Caprioli J. The logic behind target intraocular pressure. Am J Ophthalmol. 2009;147:379. doi: 10.1016/j.ajo.2008.10.027. [DOI] [PubMed] [Google Scholar]
- 23.Congdon N, O'Colmain B, Klaver CCW, Klein R, Muñoz B, David SF, Kempen J, Taylor HR, Mitchell P, Eye Diseases Prevalence Research Group Causes and prevalence of visual impairment among adults in the united states. Arch Ophthalmol. 2004;122:477. doi: 10.1001/archopht.122.4.477. [DOI] [PubMed] [Google Scholar]
- 24.Cook C, Foster P. Epidemiology of glaucoma: What's new? Can J Ophthalmol. 2012;47:223. doi: 10.1016/j.jcjo.2012.02.003. [DOI] [PubMed] [Google Scholar]
- 25.Danias J, Podos SM. Comparison of glaucomatous progression between untreated patients with normal-tension glaucoma and patients with therapeutically reduced intraocular pressures. The effectiveness of intraocular pressure reduction in the treatment of normal-tension glaucoma. Am J Ophthalmol. 1999;127:623. doi: 10.1016/s0002-9394(99)00088-4. [DOI] [PubMed] [Google Scholar]
- 26.Delaey C, Van De Voorde J. Regulatory mechanisms in the retinal and choroidal circulation. Ophthalmic Res. 2000;32:249. doi: 10.1159/000055622. [DOI] [PubMed] [Google Scholar]
- 27.Deokule S, Weinreb RN. Relationships among systemic blood pressure, intraocular pressure, and open-angle glaucoma. Can J Ophthalmol. 2008;43:302. doi: 10.3129/i08-061. [DOI] [PubMed] [Google Scholar]
- 28.Dongqi H, Zeqin R. A biomathematical model for pressure-dependent lamina cribrosa behavior. J Biomech. 1999;32:579. doi: 10.1016/s0021-9290(99)00025-1. [DOI] [PubMed] [Google Scholar]
- 29.Downs JC, Roberts MD, Burgoyne CF. Mechanical environment of the optic nerve head in glaucoma. Optom Vis Sci. 2008;85:425. doi: 10.1097/OPX.0b013e31817841cb. [DOI] [PMC free article] [PubMed] [Google Scholar]
- 30.Drance S, Anderson DR, Schulzer M, Collaborative Normal-Tension Glaucoma Study Group Risk factors for progression of visual field abnormalities in normal-tension glaucoma. Am J Ophthalmol. 2001;131:699. doi: 10.1016/s0002-9394(01)00964-3. [DOI] [PubMed] [Google Scholar]
- 31.Dueker DK, Singh K, Lin SC, Fechtner RD, Minckler DS, Samples JR, Schuman JS. Corneal thickness measurement in the management of primary openangle glaucoma: A report by the american academy of ophthalmology. Ophthalmology. 2007;114:1779. doi: 10.1016/j.ophtha.2007.04.068. [DOI] [PubMed] [Google Scholar]
- 32.Dumskyj MJ, Eriksen JE, Dore CJ, Kohner EM. Autoregulation in the human retinal circulation: Assessment using isometric exercise, laser Doppler velocimetry, and computer-assisted image analysis. Microvasc Res. 1996;51:378. doi: 10.1006/mvre.1996.0034. [DOI] [PubMed] [Google Scholar]
- 33.Ehrnrooth P, Puska P, Lehto I, Laatikainen L. Progression of visual field defects and visual loss in trabeculectomized eyes. Graefes Arch Clin Exp Ophthalmol. 2005;243:741. doi: 10.1007/s00417-004-1088-3. [DOI] [PubMed] [Google Scholar]
- 34.Fazio MA, Grytz R, Bruno L, Morris JS, Girkin CA, Downs JCC. Racial differences in mechanical strain in the posterior human sclera. Annual Meeting of the Association for Research in Vision and Ophthalmology; 2013. Paper 3156, Section 326. [Google Scholar]
- 35.Ferdinand KC. Cardiovascular disease in blacks: Can we stop the clock? J Clin Hypertens (Greenwich) 2008;10:382. doi: 10.1111/j.1751-7176.2008.07918.x. [DOI] [PMC free article] [PubMed] [Google Scholar]
- 36.Findl O, Strenn K, Wolzt M, Menapace R, Vass C, Eichler HG, Schmetterer L. Effects of changes in intraocular pressure on human ocular haemodynamics. Curr Eye Res. 1997;16:1024. doi: 10.1076/ceyr.16.10.1024.9024. [DOI] [PubMed] [Google Scholar]
- 37.Formaggia L, Gerbeau JF, Nobile F, Quarteroni A. On the coupling 3D and 1D Navier-Stokes equations for flow problems in compliant vessels. Comput Methods Appl Mech Engrg. 2001;191:561. [Google Scholar]
- 38.Friedman DS, Wolfs RCW, O'Colmain BJ, Klein BE, Taylor HR, West S, Leske MC, Mitchell P, Congdon N, Kempen J, Eye Diseases Prevalence Research Group Prevalence of open-angle glaucoma among adults in the united states. Arch Ophthalmol. 2004;122:532. doi: 10.1001/archopht.122.4.532. [DOI] [PMC free article] [PubMed] [Google Scholar]
- 39.Galassi F, Sodi A, Ucci F, Harris A, Chung HS. Ocular haemodynamics in glaucoma associated with high myopia. Int Ophthalmol. 1998;22:299. doi: 10.1023/a:1006347509491. [DOI] [PubMed] [Google Scholar]
- 40.Galassi F, Giambene B, Varriale R. Systemic vascular dysregulation and retrobulbar hemodynamics in normaltension glaucoma. Invest Ophthalmol Vis Sci. 2011;52:4467. doi: 10.1167/iovs.10-6710. [DOI] [PubMed] [Google Scholar]
- 41.Ganesan P, He S, Xu H. Development of an imagebased network model of retinal vasculature. Ann Biomed Eng. 2010;38:1566. doi: 10.1007/s10439-010-9942-4. [DOI] [PubMed] [Google Scholar]
- 42.Ganesan P, He S, Xu H. Development of an imagebased model for capillary vasculature of retina. Comput Methods Programs Biomed. 2011;102:35. doi: 10.1016/j.cmpb.2010.12.009. [DOI] [PubMed] [Google Scholar]
- 43.Girkin CA, McGwin G, Jr, Xie A, Deleon-Ortega J. Differences in optic disc topography between black and white normal subjects. Ophthalmology. 2005;112:33. doi: 10.1016/j.ophtha.2004.07.029. [DOI] [PubMed] [Google Scholar]
- 44.Girkin CA, Fazio MA, Yang H, Wang L, Smith B, Cheetham CC, Burgoyne CF, Downs JCC. Racial variation in the structure of the lamina cribrosa and sclera within 3-D fluorescent reconstructed optic nerve heads (ONH) from normal human donor tissue. Annual Meeting of the Association for Research in Vision and Ophthalmology; 2013. Paper 3155, Section 326. [Google Scholar]
- 45.Gordon MO, Beiser JA, Brandt JD, Heuer DK, Higginbotham EJ, Johnson CA, Keltner JL, Miller JP, Parrish RK, 2nd, Roy Wilson M, Kass MA. The ocular hypertension treatment study: Baseline factors that predict the onset of primary open-angle glaucoma. Arch Ophthalmol. 2002;120:829–30. doi: 10.1001/archopht.120.6.714. 714 discussion. [DOI] [PubMed] [Google Scholar]
- 46.Grewe R. Klin Monbl Augenheilkd. 1986;188:167. doi: 10.1055/s-2008-1050606. the history of glaucoma. [DOI] [PubMed] [Google Scholar]
- 47.Collaborative Normal-Tension Glaucoma Study Group. Comparison of glaucomatous progression between untreated patients with normal-tension glaucoma and patients with therapeutically reduced intraocular pressures. Am J Ophthalmol. 1998;126:487. doi: 10.1016/s0002-9394(98)00223-2. [DOI] [PubMed] [Google Scholar]
- 48.Grytz R, Fazio M, Libertiaux V, Bruno L, Gardiner S, Girkin CA, Downs JCC. Racial differences in human scleral material properties. Annual Meeting of the Association for Research in Vision and Ophthalmology; 2013. Program A0066. [Google Scholar]
- 49.Guidoboni G, Glowinski R, Cavallini N, Canic S. Stable loosely-coupled-type algorithm for fluid-structure interaction in blood flow. J Comput Phys. 2009;228:6916. [Google Scholar]
- 50.Harris A, Anderson DR, Pillunat L, Joos K, Knighton RW, Kagemann L, Martin BJ. Laser doppler flowmetry measurement of changes in human optic nerve head blood flow in response to blood gas perturbations. J Glaucoma. 1996;5:258. [PubMed] [Google Scholar]
- 51.Harris A, Joos K, Kay M, Evans D, Shetty R, Sponsel WE, Martin B. Acute iop elevation with scleral suction: Effects on retrobulbar haemodynamics. Br J Ophthalmol. 1996;80:1055. doi: 10.1136/bjo.80.12.1055. [DOI] [PMC free article] [PubMed] [Google Scholar]
- 52.Harris A, Ciulla TA, Chung HS, Martin B. Regulation of retinal and optic nerve blood flow. Arch Ophthalmol. 1998;116:1491. doi: 10.1001/archopht.116.11.1491. [DOI] [PubMed] [Google Scholar]
- 53.Harris A, Jonescu-Cuypers CP, Kagemann L, Ciulla TA, Krieglstein GK. Atlas of ocular blood flow Vascular Anatomy, Pathophysiology, and Metabolism. Elsevier; 2003. [Google Scholar]
- 54.Harris A, Kagemann L, Ehrlich R, Rospigliosi C, Moore D, Siesky BA. Measuring and interpreting ocular blood flow and metabolism in glaucoma. Can J Ophthalmol. 2008;43:328. doi: 10.3129/i08-051. [DOI] [PubMed] [Google Scholar]
- 55.Hayreh SS, Zimmerman MB, Podhajsky P, Alward WL. Nocturnal arterial hypotension and its role in optic nerve head and ocular ischemic disorders. Am J Ophthalmol. 1994;117:603. doi: 10.1016/s0002-9394(14)70067-4. [DOI] [PubMed] [Google Scholar]
- 56.Heijl A, Leske MC, Bengtsson B, Hyman L, Bengtsson B, Hussein M, Early Manifest Glaucoma Trial Group Reduction of intraocular pressure and glaucoma progression: Results from the early manifest glaucoma trial. Arch Ophthalmol. 2002;120:1268. doi: 10.1001/archopht.120.10.1268. [DOI] [PubMed] [Google Scholar]
- 57.Hennis A, Wu SY, Nemesure B, Leske MC, Barbados Eye Studies Group Hypertension, diabetes, and longitudinal changes in intraocular pressure. Ophthalmology. 2003;110:908. doi: 10.1016/S0161-6420(03)00075-7. [DOI] [PubMed] [Google Scholar]
- 58.Hollows FC, Graham PA. Intra-ocular pressure, glaucoma, and glaucoma suspects in a defined population. Br J Ophthalmol. 1966;50:570. doi: 10.1136/bjo.50.10.570. [DOI] [PMC free article] [PubMed] [Google Scholar]
- 59.Howard G, Lackland DT, Kleindorfer DO, Kissela BM, Moy CS, Judd SE, Safford MM, Cushman M, Glasser SP, Howard VJ. Racial differences in the impact of elevated systolic blood pressure on stroke risk. JAMA Intern Med. 2013;173:46. doi: 10.1001/2013.jamainternmed.857. [DOI] [PMC free article] [PubMed] [Google Scholar]
- 60.Hyman L, Wu SY, Connell AM, Schachat A, Nemesure B, Hennis A, Leske MC. Prevalence and causes of visual impairment in the barbados eye study. Ophthalmology. 2001;108:1751. doi: 10.1016/s0161-6420(01)00590-5. [DOI] [PubMed] [Google Scholar]
- 61.Johnson CA. Selective versus nonselective losses in glaucoma. J Glaucoma. 1994;3:S32. [PubMed] [Google Scholar]
- 62.Kamiya A, Takahashi T. Quantitative assessment of morphological and functional properties of biological trees based on their fractal nature. J Appl Physiol. 2007;102:2315. doi: 10.1152/japplphysiol.00856.2006. [DOI] [PubMed] [Google Scholar]
- 63.Karman T. Festigkeits problem in maschinenbau enzyklopadie der mathematischen wissenschaften. 1910 Bd. IV art. 27. [Google Scholar]
- 64.Kawasaki R, Wang JJ, Rochtchina E, Lee AJ, Wong TY, Mitchell P. Retinal vessel caliber is associated with the 10-year incidence of glaucoma: The blue mountains eye study. Ophthalmology. 2013;120:84. doi: 10.1016/j.ophtha.2012.07.007. [DOI] [PubMed] [Google Scholar]
- 65.Kelty PJ, Payne JF, Trivedi RH, Kelty J, Bowie EM, Burger BM. Macular thickness assessment in healthy eyes based on ethnicity using stratus oct optical coherence tomography. Invest Ophthalmol Vis Sci. 2008;49:2668. doi: 10.1167/iovs.07-1000. [DOI] [PubMed] [Google Scholar]
- 66.Kingman S. Glaucoma is second leading cause of blindness globally. Bull World Health Organ. 2004;82:887. [PMC free article] [PubMed] [Google Scholar]
- 67.Lakin W, Stevens S, Tranmer B, Penar P. A whole-body mathematical model for intracranial pressure dynamics. J Math Biol. 2003;46:347. doi: 10.1007/s00285-002-0177-3. [DOI] [PubMed] [Google Scholar]
- 68.Lakin WD, Stevens SA, Tranmer BI, Penar PL. A whole-body mathematical model for intracranial pressure dynamics. Journal of Mathematical Biology. 2003;46:347. doi: 10.1007/s00285-002-0177-3. [DOI] [PubMed] [Google Scholar]
- 69.Leighton DA, Phillips CI. Systemic blood pressure in openangle glaucoma, low tension glaucoma, and the normal eye. Br J Ophthalmol. 1972;56:447. doi: 10.1136/bjo.56.6.447. [DOI] [PMC free article] [PubMed] [Google Scholar]
- 70.Leske MC. Open-angle glaucoma–an epidemiologic overview. Ophthalmic Epidemiol. 2007;14:166. doi: 10.1080/09286580701501931. [DOI] [PubMed] [Google Scholar]
- 71.Leske MC, Connell AM, Schachat AP, Hyman L. The barbados eye study, prevalence of open angle glaucoma. Arch Ophthalmol. 1994;112:821. doi: 10.1001/archopht.1994.01090180121046. [DOI] [PubMed] [Google Scholar]
- 72.Leske MC, Hyman L, Hussein M, Heijl A, Bengtsson B. Comparison of glaucomatous progression between untreated patients with normal-tension glaucoma and patients with therapeutically reduced intraocular pressures; The effectiveness of intraocular pressure reduction in the treatment of normal-tension glaucoma. Am J Ophthalmol. 1999;127:625. [PubMed] [Google Scholar]
- 73.Leske MC, Heijl A, Hyman L, Bengtsson B, Dong LM, Yang Z, EMGT Group Predictors of long-term progression in the early manifest glaucoma trial. Ophthalmology. 2007;114:1965. doi: 10.1016/j.ophtha.2007.03.016. [DOI] [PubMed] [Google Scholar]
- 74.Makita S, Fabritius T, Yasuno Y. Quantitative retinalblood flow measurement with three-dimensional vessel geometry determination using ultrahigh-resolution doppler optical coherence angiography. Opt Lett. 2008;33:836. doi: 10.1364/ol.33.000836. [DOI] [PubMed] [Google Scholar]
- 75.Martin MJ, Sommer A, Gold EB, Diamond EL. Race and primary open-angle glaucoma. Am J Ophthalmol. 1985;99:383. doi: 10.1016/0002-9394(85)90001-7. [DOI] [PubMed] [Google Scholar]
- 76.Mason RP, Kosoko O, Wilson MR, Martone JF, Cowan CL, Jr, Gear JC, Ross-Degnan D. National survey of the prevalence and risk factors of glaucoma in st. lucia, west indies. part i. prevalence findings. Ophthalmology. 1989;96:1363. doi: 10.1016/s0161-6420(89)32708-4. [DOI] [PubMed] [Google Scholar]
- 77.McGuire BJ, Secomb TW. A theoretical model for oxygen transport in skeletal muscle under conditions of high oxygen demand. J Appl Physiol. 2001;90:2255. doi: 10.1152/jappl.2001.91.5.2255. [DOI] [PubMed] [Google Scholar]
- 78.Medeiros FA, Weinreb RN. Risk assessment in glaucoma and ocular hypertension. Int Ophthalmol Clin. 2008;48:1. doi: 10.1097/IIO.0b013e318187e93d. [DOI] [PubMed] [Google Scholar]
- 79.Memarzadeh F, Ying-Lai M, Chung J, Azen SP, Varma R, Los Angeles Latino Eye Study Group Blood pressure, perfusion pressure, and open-angle glaucoma: The los angeles latino eye study. Invest Ophthalmol Vis Sci. 2010;51:2872. doi: 10.1167/iovs.08-2956. [DOI] [PMC free article] [PubMed] [Google Scholar]
- 80.Mikelic A, Guidoboni G, Canic S. Fluid-structure interaction in a pre-stressed tube with thick elastic walls i: The stationary Stokes problem. Netw Heterog Media. 2007;2:397. [Google Scholar]
- 81.Moore D, Harris A, Wudunn D, Kheradiya N, Siesky BA. Dysfunctional regulation of ocular blood flow: A risk factor for glaucoma? Clin Ophthalmol. 2008;2:849. doi: 10.2147/opth.s2774. [DOI] [PMC free article] [PubMed] [Google Scholar]
- 82.Nagasubramanian S, Weale RA. Ethnic variability of the vasculature of the optic disc in normal and in glaucomatous eyes. Eur J Ophthalmol. 2004;14:501. doi: 10.5301/EJO.2008.703. [DOI] [PubMed] [Google Scholar]
- 83.Newson T, El-Sheikh A. Mathematical modeling of the biomechanics of the lamina cribrosa under elevated intraocular pressures. J Biomech Eng. 2006;128:496. doi: 10.1115/1.2205372. [DOI] [PubMed] [Google Scholar]
- 84.Nobile F. PhD thesis. EPFL; Switzerland: 2001. Numerical approximation of fluid-structure interaction problems with application to haemodynamics. [Google Scholar]
- 85.Norman RE, Flanagan JG, Sigal IA, Rausch SMK, Tertinegg I, Ethier CR. Finite element modeling of the human sclera: Influence on optic nerve head biomechanics and connections with glaucoma. Exp Eye Res. 2011;93:4. doi: 10.1016/j.exer.2010.09.014. [DOI] [PubMed] [Google Scholar]
- 86.Olufsen MS, Ottesen JT, Tran HT, Ellwein LM, Lipsitz LA, Novak V. Blood pressure and blood flow variation during postural change from sitting to standing: Model development and validation. Journal of Applied Physiology. 2005;99:1523. doi: 10.1152/japplphysiol.00177.2005. [DOI] [PMC free article] [PubMed] [Google Scholar]
- 87.Pandolfi A, Boschetti F. The influence of the geometry of the porcine cornea on the biomechanical response of inflation tests. Comput Methods Biomech Biomed Engin. 2013 doi: 10.1080/10255842.2013.778983. [DOI] [PubMed] [Google Scholar]
- 88.Pandolfi A, Holzapfel GA. Three-dimensional modeling and computational analysis of the human cornea considering distributed collagen fibril orientations. J Biomech Eng. 2008;130:061006. doi: 10.1115/1.2982251. [DOI] [PubMed] [Google Scholar]
- 89.Pandolfi A, Manganiello F. A model for the human cornea: Constitutive formulation and numerical analysis. Biomech Model Mechanobiol. 2006;5:237. doi: 10.1007/s10237-005-0014-x. [DOI] [PubMed] [Google Scholar]
- 90.Parc CE, Johnson DH, Oliver JE, Hattenhauer MG, Hodge DO. The long-term outcome of glaucoma filtration surgery. Am J Ophthalmol. 2001;132:27. doi: 10.1016/s0002-9394(01)00923-0. [DOI] [PubMed] [Google Scholar]
- 91.Passerini T, de Luca M, Formaggia L, Quarteroni A, Veneziani A. A 3D/1D geometrical multiscale model of cerebral vasculature. J Eng Math. 2009;64:319. [Google Scholar]
- 92.Pillunat LE, Anderson DR, Knighton RW, Joos KM, Feuer WJ. Autoregulation of human optic nerve head circulation in response to increased intraocular pressure. Exp Eye Res. 1997;64:737. doi: 10.1006/exer.1996.0263. [DOI] [PubMed] [Google Scholar]
- 93.Quarteroni A, Tuveri M, Veneziani A. Computational vascular fluid dynamics: Problems, models and methods. Comput Visual Sci. 2000;2:163. [Google Scholar]
- 94.Racette L, Wilson MR, Zangwill LM, Weinreb RN, Sample PA. Primary open-angle glaucoma in blacks: A review. Surv Ophthalmol. 2003;48:295. doi: 10.1016/s0039-6257(03)00028-6. [DOI] [PubMed] [Google Scholar]
- 95.Racette L, Boden C, Kleinhandler SL, Girkin CA, Liebmann JM, Zangwill LM, Medeiros FA, Bowd C, Weinreb RN, Wilson MR, Sample PA. Differences in visual function and optic nerve structure between healthy eyes of blacks and whites. Arch Ophthalmol. 2005;123:1547. doi: 10.1001/archopht.123.11.1547. [DOI] [PubMed] [Google Scholar]
- 96.Racette L, Liebmann JM, Kleinhandler CA, Girkin LM, Jain S, Becerra LM, Medeiros FA, Bowd C, Weinreb RN, Boden C, Sample PA, ADAGES Group African descent and glaucoma evaluation study (adages): Iii. ancestry differences in visual function in healthy eyes. Arch Ophthalmol. 2010;128:551. doi: 10.1001/archophthalmol.2010.58. [DOI] [PMC free article] [PubMed] [Google Scholar]
- 97.Regev G, Harris A, Siesky BA, Shoshani Y, Egan P, Moss A, Zalish M, WuDunn D, Ehrlich R. Goldmann applanation tonometry and dynamic contour tonometry are not correlated with central corneal thickness in primary open angle glaucoma. J Glaucoma. 2011;20:282. doi: 10.1097/IJG.0b013e3181e66498. [DOI] [PubMed] [Google Scholar]
- 98.Repetto R, Stocchino A, Cafferata C. Experimental investigation of vitreous humour motion within a human eye model. Phys Med Biol. 2005;50:4729. doi: 10.1088/0031-9155/50/19/021. [DOI] [PubMed] [Google Scholar]
- 99.Repetto R, Siggers JH, Stocchino A. Mathematical model of flow in the vitreous humor induced by saccadic eye rotations: Effect of geometry. Biomech Model Mechanobiol. 2010;9:65. doi: 10.1007/s10237-009-0159-0. [DOI] [PubMed] [Google Scholar]
- 100.Riva CE, Sinclair SH, Grunwald JE. Autoregulation of retinal circulation in response to decrease of perfusion pressure. Invest Ophthalmol Vis Sci. 1981;21:34. [PubMed] [Google Scholar]
- 101.Robinson F, Riva CE, Grunwald JE, Petrig BL, Sinclair SH. Retinal blood flow autoregulation in response to an acute increase in blood pressure. Invest Ophthalmol Vis Sci. 1986;27:722. [PubMed] [Google Scholar]
- 102.Rojananuangnit K, Johnstone J, Fazio M, Clark M, Owsley C, Smith B, Girkin CA. Racial variation in deep optic nerve head structures visualized with SD-OCT. Annual Meeting of the Association for Research in Vision and Ophthalmology; 2013. Program A0038. [Google Scholar]
- 103.Rossi T, Querzoli G, Pasqualitto G, Iossa M, Placentino L, Repetto R, Stocchino A, Ripandelli G. Ultrasound imaging velocimetry of the human vitreous. Exp Eye Res. 2012;99:98. doi: 10.1016/j.exer.2012.03.014. [DOI] [PubMed] [Google Scholar]
- 104.Rotchford AP, Kirwan JF, Muller MA, Johnson GJ, Roux P. Temba glaucoma study: A population-based cross-sectional survey in urban South Africa. Ophthalmology. 2003;110:376. doi: 10.1016/S0161-6420(02)01568-3. [DOI] [PubMed] [Google Scholar]
- 105.Sacco RL, Boden-Albala B, Gan R, Chen X, Kargman DE, Shea S, Paik MC, Hauser WA. Stroke incidence among white, black, and hispanic residents of an urban community: The northern manhattan stroke study. Am J Epidemiol. 1998;147:259. doi: 10.1093/oxfordjournals.aje.a009445. [DOI] [PubMed] [Google Scholar]
- 106.Sample PA, Girkin CA, Zangwill LM, Jain S, Racette L, Becerra LM, Weinreb RN, Medeiros FA, Wilson MR, De León-Ortega J, Tello C, Bowd C, Liebmann JM, African Descent and Glaucoma Evaluation Study Group The african descent and glaucoma evaluation study (adages): Design and baseline data. Arch Ophthalmol. 2009;127:1136. doi: 10.1001/archophthalmol.2009.187. [DOI] [PMC free article] [PubMed] [Google Scholar]
- 107.Schmidl D, Garhofer G, Schmetterer L. The complex interaction between ocular perfusion pressure and ocular blood flow— relevance for glaucoma. Exp Eye Res. 2011;93:141. doi: 10.1016/j.exer.2010.09.002. [DOI] [PubMed] [Google Scholar]
- 108.Schroeder A, Harris A, Siesky BA, Tobe LA, Kim NJ, Amireskandari A, Marek MB, Racette L, Eckert GJ, Tyring A. Retinal nerve fiber layer thickness is correlated to retrobulbar blood flow in glaucoma patients of african descent. Annual Meeting of the Association for Research in Vision and Ophthalmology; 2013. Program 4442, Abstract D0182. [Google Scholar]
- 109.Sehi M. Basic technique and anatomically imposed limitations of confocal scanning laser doppler flowmetry at the optic nerve head level. Acta Ophthalmol. 2011;89 doi: 10.1111/j.1755-3768.2009.01728.x. e1. [DOI] [PubMed] [Google Scholar]
- 110.Shim EB, Jun HM, Leem CH, Matusuoka S, Noma A. A new integrated method for analyzing heart mechanics using a cell–hemodynamics–autonomic nerve control coupled model of the cardiovascular system. Progress in Biophysics and Molecular Biology. 2008;96:44. doi: 10.1016/j.pbiomolbio.2007.07.015. [DOI] [PubMed] [Google Scholar]
- 111.Shimmyo M, Ross AJ, Moy A, Mostafavi R. Intraocular pressure, goldmann applanation tension, corneal thickness, and corneal curvature in caucasians, asians, hispanics, and african americans. Am J Ophthalmol. 2003;136:603. doi: 10.1016/s0002-9394(03)00424-0. [DOI] [PubMed] [Google Scholar]
- 112.Shirinifard A, Glazier JA, Swat M, Gens JS, Family F, Jiang Y, Grossniklaus HE. Adhesion failures determine the pattern of choroidal neovascularization in the eye: A computer simulation study. PLoS Comput Biol. 2012;8:e1002440. doi: 10.1371/journal.pcbi.1002440. [DOI] [PMC free article] [PubMed] [Google Scholar]
- 113.Siatkowski RM, Lam BL, Anderson DR, Feuer WJ, Halikman AM. Automated suprathreshold static perimetry screening for detecting neuro-ophthalmologic disease. Ophthalmology. 1996;103:907. doi: 10.1016/s0161-6420(96)30588-5. [DOI] [PubMed] [Google Scholar]
- 114.Siegfried CJ, Shui YB, Holekamp NM, Bai F, Beebe DC. Racial differences in ocular oxidative metabolism: Implications for ocular disease. Arch Ophthalmol. 2011;129:849. doi: 10.1001/archophthalmol.2011.169. [DOI] [PMC free article] [PubMed] [Google Scholar]
- 115.Siesky BA, Harris A, Racette L, Abassi R, Chandrasekhar K, Tobe LA, Behzadi J, Eckert G, Amireskandari A, Muchnik M. Differences in ocular blood flow in glaucoma between patients of african and european descent. Submitted to Journal of Glaucoma. 2012 doi: 10.1097/IJG.0b013e31829d9bb0. [DOI] [PMC free article] [PubMed] [Google Scholar]
- 116.Siesky BA, Harris A, Racette L, Cantor LB, Tobe LA, Catoira-Boyle YP, Yung CWR, WuDunn D, Beach JM. Retinal oximetry in primary open-angle glaucoma: Differences in Patients of African and European Descent. Annual Meeting of the Association for Research in Vision and Ophthalmology; 2013. Program 4471, Abstract D0211. [Google Scholar]
- 117.Sigal IA. An applet to estimate the iop-induced stress and strain within the optic nerve head. Invest Ophthalmol Vis Sci. 2011;52:5497. doi: 10.1167/iovs.10-7141. [DOI] [PMC free article] [PubMed] [Google Scholar]
- 118.Sigal IA, Ethier CR. Biomechanics of the optic nerve head. Exp Eye Res. 2009;88:799. doi: 10.1016/j.exer.2009.02.003. [DOI] [PubMed] [Google Scholar]
- 119.Sigal IA, Flanagan JG, Ethier CR. Factors influencing optic nerve head biomechanics. Invest Ophthalmol Vis Sci. 2005;46:4189. doi: 10.1167/iovs.05-0541. [DOI] [PubMed] [Google Scholar]
- 120.Sigal IA, Yang H, Roberts MD, Burgoyne CF, Downs JC. Iop-induced lamina cribrosa displacement and scleral canal expansion: An analysis of factor interactions using parameterized eye-specific models. Invest Ophthalmol Vis Sci. 2011;52:1896. doi: 10.1167/iovs.10-5500. [DOI] [PMC free article] [PubMed] [Google Scholar]
- 121.Sigal IA, Yang H, Roberts MD, Grimm JL, Burgoyne CF, Demirel S, Downs JC. Iop-induced lamina cribrosa deformation and scleral canal expansion: Independent or related? Invest Ophthalmol Vis Sci. 2011;52:9023. doi: 10.1167/iovs.11-8183. [DOI] [PMC free article] [PubMed] [Google Scholar]
- 122.Sines D, Harris A, Siesky BA, Januleviciene I, Haine CL, Yung CW, Catoira Y, Garzozi HJ. The response of retrobulbar vasculature to hypercapnia in primary open-angle glaucoma and ocular hypertension. Ophthalmic Res. 2007;39:76. doi: 10.1159/000099241. [DOI] [PubMed] [Google Scholar]
- 123.Sommer A, Tielsch JM, Katz J, Quigley HA, Gottsch JD, Javitt JC, Martone JF, Royall RM, Witt KA, Ezrine S. Racial differences in the cause-specific prevalence of blindness in east baltimore. N Engl J Med. 1991;325:1412. doi: 10.1056/NEJM199111143252004. [DOI] [PubMed] [Google Scholar]
- 124.Stocchino A, Repetto R, Cafferata C. Eye rotation induced dynamics of a newtonian fluid within the vitreous cavity: The effect of the chamber shape. Phys Med Biol. 2007;52:2021. doi: 10.1088/0031-9155/52/7/016. [DOI] [PubMed] [Google Scholar]
- 125.Takahashi T, Nagaoka T, Yanagida H, Saitoh T, Kamiya A, Hein T, Kuo L, Yoshida A. A mathematical model for the distribution of hemodynamic parameters in the human retinal microvascular network. Journal of Biorheology. 2009;23:77. [Google Scholar]
- 126.Tielsch JM. The epidemiology and control of open angle glaucoma: A population-based perspective. Annu Rev Public Health. 1996;17:121. doi: 10.1146/annurev.pu.17.050196.001005. [DOI] [PubMed] [Google Scholar]
- 127.Tielsch JM, Sommer A, Katz J, Royall RM, Quigley HA, Javitt J. Racial variations in the prevalence of primary openangle glaucoma, the baltimore eye survey. JAMA. 1991;266:369. [PubMed] [Google Scholar]
- 128.Tobe LA, Harris A, Siesky BA, Racette L, WuDunn D, Amireskandari A, Kim NJ, Huck HA, Tyring A, Zalish M. Changes in retinal blood flow sre strongly correlated to changes in optic nerve head morpholofy in patients of African Descent. Annual Meeting of the Association for Research in Vision and Ophthalmology; 2013. Program 4443, Abstract D0183. [Google Scholar]
- 129.Urban Z, Agapova O, Hucthagowder V, Yang P, Starcher BC, Hernandez MR. Population differences in elastin maturation in optic nerve head tissue and astrocytes. Invest Ophthalmol Vis Sci. 2007;48:3209. doi: 10.1167/iovs.07-0107. [DOI] [PubMed] [Google Scholar]
- 130.Varma R, Lee PP, Goldberg I, Kotak S. An assessment of the health and economic burdens of glaucoma. Am J Ophthalmol. 2011;152:515. doi: 10.1016/j.ajo.2011.06.004. [DOI] [PMC free article] [PubMed] [Google Scholar]
- 131.Wang Y, Lu A, Gil-Flamer J, Tan O, Izatt JA, Huang D. Measurement of total blood flow in the normal human retina using doppler fourier-domain optical coherence tomography. Br J Ophthalmol. 2009;93:634. doi: 10.1136/bjo.2008.150276. [DOI] [PMC free article] [PubMed] [Google Scholar]
- 132.Watson MG, McDougall SR, Chaplain MA, Devlin AH, Mitchell CA. Dynamics of angiogenesis during murine retinal development: A coupled in vivo and in silico study. J R Soc Interface. 2012;9:2351. doi: 10.1098/rsif.2012.0067. [DOI] [PMC free article] [PubMed] [Google Scholar]
- 133.Wilensky JT, Gandhi N, Pan T. Racial influences in openangle glaucoma. Ann Ophthalmol. 1978;10:1398. [PubMed] [Google Scholar]
- 134.Wilson R, Richardson TM, Hertzmark E, Grant WM. Race as a risk factor for progressive glaucomatous damage. Ann Ophthalmol. 1985;17:653. [PubMed] [Google Scholar]
- 135.Wong TY, Islam FMA, Klein R, Klein BEK, Cotch MF, Castro C, Sharrett AR, Shahar E. Retinal vascular caliber, cardiovascular risk factors, and inflammation: The multiethnic study of atherosclerosis (mesa) Invest Ophthalmol Vis Sci. 2006;47:2341. doi: 10.1167/iovs.05-1539. [DOI] [PMC free article] [PubMed] [Google Scholar]
- 136.Woo S, Kobayashi AS, Schlegel WA, Lawrence C. Nonlinear material properties of intact cornea and sclera. Exp Eye Res. 1972;14:29. doi: 10.1016/0014-4835(72)90139-x. [DOI] [PubMed] [Google Scholar]
- 137.Xu L, Wang H, Wang Y, Jonas JB. Intraocular pressure correlated with arterial blood pressure: The beijing eye study. Am J Ophthalmol. 2007;144:461. doi: 10.1016/j.ajo.2007.05.013. [DOI] [PubMed] [Google Scholar]
- 138.Yan D, McPheeters S, Johnson G, Utzinger U, Vande Geest JP. Microstructural differences in the human posterior sclera as a function of age and race. Invest Ophthalmol Vis Sci. 2011;52:821. doi: 10.1167/iovs.09-4651. [DOI] [PMC free article] [PubMed] [Google Scholar]


