

Abstract
DNA damage and aging share expression changes involving alterations in many aspects of metabolism, suppression of growth and upregulation of defence and genome maintenance systems. “Omics” technologies have permitted large-scale parallel measurements covering global cellular constituents and aided the identification of specific response pathways that change during aging and after DNA damage. We have set out to identify genes with highly conserved response patterns through meta-analysis of mRNA expression datasets collected during natural aging and accelerated aging caused by a Transcription-Coupled Nucleotide Excision Repair (TC-NER) defect in a diverse set of organs and tissues in mice, and from in-vitro UV-induced DNA damage in a variety of murine cells. The identified set of genes that show similar expression patterns in response to organ aging (accelerated and normal), and endogenously and exogenously induced DNA damage, consists of genes involved in anti-oxidant systems and includes the transcription factor Bach2 as one of the most consistent markers. BACH2 was originally identified as a partner of the small Maf proteins and antagonist of the NRF2 anti-oxidant defence pathway and has been implicated in B-cell differentiation and immune system homeostasis. Although BACH2 has never before been associated with UV-induced damage or aging, it shows a strong downregulation in both conditions. We have characterized the dynamics of Bach2 expression in response to DNA damage and show that it is a highly sensitive responder to transcription-blocking DNA lesions. Gene expression profiling using Affymetrix microarray analysis after siRNA-mediated silencing of Bach2 identified cell cycle and transcription regulation as the most significantly altered processes consistent with a function as transcription factor affecting proliferation.
Keywords: Aging, DNA damage, Meta-analysis, BACH2, NRF2
1. INTRODUCTION
Aging is a complex process associated with physiological alterations in the function of cells and organs over time, leading to reduced regenerative capacity and exhaustion of cellular reserves as well as increased vulnerability to disease and mortality. Over the past few decades, many reports have provided evidence supporting the hypothesis that accumulation of stochastic damage contributes to the process of aging, while damage avoidance, maintenance and repair promote longevity [1]; [2]. More recently, “omics”-based technologies in combination with genetics have advanced our understanding of the aging process and led to identification of key genes and conserved pathways that may influence the rate of aging, lifespan, and onset of aging-related diseases. Transcriptomics have uncovered highly conserved expression-pattern changes during aging across species [3, 4] and tissues [5–7], indicating the presence of a systemic transcriptional program elicited during aging.
The importance of genome maintenance and DNA repair is underscored by the consequences of DNA repair deficiencies. While failure to accurately repair certain types of DNA lesions may lead to increased mutation rates, chromosomal instability and cancer predisposition, other types of damage may directly interfere with the vital cellular processes of transcription and replication, triggering transient or permanent cell cycle arrest and cell death causing segmental progeria (accelerated aging in a subset of organs and tissues). Defects in the Nucleotide Excision Repair (NER) pathway clearly exemplify both consequences of DNA repair deficiencies. NER is a multi-step repair pathway that utilizes more than 30 proteins to remove a wide variety of bulky, helix-distorting DNA lesions and consists of two sub-pathways that differ in their mode of damage recognition, but converge into a shared core repair reaction. Deficiencies in the global genome (GG-)NER sub-pathway, which repairs lesions throughout the genome independent of transcriptional status, result in UV hypersensitivity, increased mutagenesis and cancer predisposition. In contrast, mutations in the transcription-coupled (TC-)NER sub-pathway, which identifies lesions in the transcribed strand of active genes through recognition of stalled RNA polymerase progression, result in accelerated development of aging features (segmental progeria). Transcriptomics utilizing mouse models of NER-mediated segmental progeria have revealed global expression changes resembling those of natural aging [6].
In addition to accelerated aging, a number of mouse models displaying delayed aging are available [8]; most of these models originate from mutations in the somatotroph axis. Impaired function of the somatotropic genes is thought to extend lifespan by suppressing growth and thereby decreasing accumulation of endogenous damage. Dietary restriction, the most robust transient lifespan-extending intervention, shares many features with genetic somatotropic-based longevity [6, 9–11]. Comparison of expression profiles of numerous progeroid mouse models with those of normal and/or delayed aging (both genetically as well as induced by dietary restriction) have led to the identification of commonly regulated protein networks including pathways responsible for down-regulation of growth (specifically: somato-, lacto- and thyrotrophic hormonal axes), metabolic changes and upregulation of antioxidant defences. Altered regulation of these pathways under unfavourable conditions can be considered an evolutionary conserved “survival response”, which prioritizes maintenance above growth to promote survival [6, 12–16].
The overlapping changes in gene expression during normal aging and segmental progeria may result, at least in part, from accumulated DNA damage, since induction of transcription-blocking lesions in-vitro triggers similar expression changes [17]. It has been suggested that accumulation of DNA damage in transcribed genes contributes to the aging-associated shift from growth to somatic maintenance, which in turn may reduce generation and thus accumulation of endogenous damage and thereby influence the rate of functional decline associated with aging [18]. Identification of key genes within this response may aid our understanding of aging and potentially provide clues as to how healthy lifespan can be extended.
Here, we present a meta-analysis of genome-wide mRNA expression datasets derived from naturally aged, progeroid NER-deficient mouse models as well as UV-irradiated cells, in search of genes with similar expression patterns. In addition to a number of genes that have been previously reported within the context of DNA damage and/or aging, we have identified several genes that have not been implicated in neither of these processes. Of those, we focussed on the pro-apoptotic transcription regulator protein BACH2 and present a detailed investigation of its response to DNA damage.
2. MATERIALS AND METHODS
2.1. Meta-analysis data sets
For Meta-analysis we used the following arrays available through the public repository ArrayExpress with accession codes E-MEXP-1968 (0.6J/m2 and 4 J/m2 treated MDFs), E-MEXP-1504 (13- and 130-week old wild-type mouse liver, spleen, kidney and lung), E-MEXP-835 (mouse liver wild type, Xpa−/−, Csbm/m and Xpa−/−Csbm/m), E-MEXP-1503 (mouse liver wild type and Ercc1d/−).
2.2. Cell culture and treatments
NIH3T3 and HEK293T cells were cultured in DMEM medium supplemented with 10% fetal bovine serum (FBS) and antibiotics. ES cells were maintained as previously described [43]. Primary mouse cells lines (chondrocytes, Mourine Dermal Fibroblasts (MDFs) and Murine Embryonic Fibroblasts (MEFs)) were cultured under 3% oxygen in DMEM / Ham’s F10 medium, 20% FBS and antibiotics. For UV treatments a 254nm UV-C source was used. Photoreactivation was performed as described [44]. For oxidative stress experiments, t-butyl hydroperoxide (Sigma) was used, DEM treatments were performed with DiEthylMaleate (Sigma) and Cisplatin treatments with Platosin®-solution (Pharmachemie BV). Iilludin S treatments were as previously described [30].
For cell survival assays, cells were seeded in triplicates at equal densities and treated 24h after seeding as indicated. After 48h recovery, cell survival was determined by cell count on Beckman Coulter™, Z2 Coulter® particle count and size analyzer. In some experiments, changes in ATP content were used as a measure of cellular functionality and viability upon oxidative stress challenges. ATP was measured with the ATPLite Fluorometric assay (Stratagene), according to the manufactures’s instructions. For statistical analysis, significance was determined using two-way analysis of variance (ANOVA) with Bonferonni post-test.
For cell proliferation assays, infected cells were seeded at low densities (50–75 cells/mm2), in triplicates for each time-point. Cell numbers were counted before cells reached confluency. The number of cells that were in S phase 24 hours after seeding was calculated by the Click-iT® EdU Cell Proliferation Assay (Invitrogen), as per the manufacturer’s instructions. Clonogenic survival assay after UV irradiation was performed as previously described [12].
2.3. Infections/ Transfections
For retrovirus production, amphotropic packaging Phoenix A cells were transfected with the various retroviral expression vectors using FuGENE 6 (Roche Applied Science) according to the manufacturer’s instructions. Viral supernatants were harvested 48 h post transfection, filtered through 0.45-μm low protein-binding filters (Millipore Corp.) and used immediately to infect sub-confluent cultures of NIH 3T3 fibroblasts in the presence of 5 μg/ml polybrene. Infected cells were selected in culture media containing 75 μg/ml hygromycin.
For knock-down experiments, transfections were performed with Lullaby® transfection reagent (OZ Biosciences) according to the manufacturer’s instructions, using siRNA oligonucleotides targeting Bach2 mRNA (ON-TARGETplus SMARTpool L-042963-01-0005 Mouse BACH2) or non-targeting control siRNA (Thermo Scientific).
2.4. Cloning of Expression Plasmids
BACH2 specific primers containing an XhoI and a ClaI recognition sequence were used to PCR-amplify the open reading frame (minus the START codon) of human BACH2 from the IMAGE clone ID 100066339 (OPEN biosystems). To generate FLAG:BACH2 and eGFP:BACH2 PCR amplified BACH2 was subcloned in a pLHCX retroviral expression vector (Clontech Laboratories), which was modified to contain either a FLAG epitope or eGFP (minus the STOP codon). PCR amplifications were performed on a MJ Scientific, Inc., PTC-100 Thermocycler using Phusion polymerase (Bioke). Amplified DNAs were purified using the Promega Wizard PCR purification kit, and following restriction digestion of the inserts and vectors, shrimp alkaline phosphatase treatment of the vectors, and agarose gel electrophoresis; the gel-excised DNAs were purified using the Promega Wizard gel extraction kit. DNA concentrations were calculated by spectrophotometry, and inserts were ligated into vectors at a 3:1 molar ratio. Plasmid DNAs were analyzed by restriction digestion and/or sequencing and were transfected into HEK293T cells using FuGENE 6 (Roche Applied Science) to confirm construct expression by immunoblotting. All enzymes used, unless otherwise stated, were purchased from Roche Applied Science.
2.5. Determination of BACH2 protein half-life
Half-life of BACH2 protein was determined after transfection of NIH3T3 with vectors expressing FLAG or GFP tagged BACH2. Forty-eight hours after transfection cycloheximide was added to the culture media at [50ug/ml] and cells were harvested at various time-points after treatment. Total lysates were gel-fractionated and immunoblotted using anti-FLAG (Sigma) and anti-GFP (Abcam) antibodies.
2.6. RNA isolation and Real-time PCR
Cells were lysed in appropriate amounts of Trizol® reagent and RNA was isolated according to manufacturer’s instructions. For cDNA synthesis, 1μg of RNA was reverse transcribed using the iScript cDNA synthesis kit (BioRad). Real-time PCR was performed on Bio-Rad MyIQ using SYBR GreenI (Sigma) and Platinum Taq polymerase (Invitrogen). Generation of specific PCR products was confirmed by melting-curve analysis and gel electrophoresis. For data analysis, the relative expression of target mRNA was calculated by the method described in [45]. Statistical significance was determined using two-tailed t-test. The following primers were used for qPCR: Bach2 (mouse): (5′-cagttggagttcatccacga-3′ and 5′-ggatctgctctggactctgg-3′); BACH2 (human): 5′-tgatttggtggtcagcttgc-3′ and 5′-tcgcggatgttttctctgct-3′; TubG2: 5′-cagaccaaccactgctacat -3′ and 5′-agggaatgaagttggccagt -3′; B2M: 5′-ccctggtctttctggtgctt-3′ and 5′-atttcaatgtgaggcgggtg-3′; Gapdh: 5′-accacagtccatgccatcac-3′ and 5′-tccaccaccctgttgctgta-3′; p21: 5′-gagcaaagtgtgccgttgtc -3′ and 5′-ggtttggagactgggagagg -3′.
2.7. Microarray hybridizations and analysis
Total RNA was isolated using the RNeasy mini kit (Qiagen). Synthesis of double-stranded cDNA and biotin-labelled cRNA was performed in accordance with the instructions of the manufacturer (Affymetrix). 3′IVT labelled and fragmented dDNA preparations were hybridized to full mouse genome oligonucleotide arrays (Affymetrix® MG-430 PM Array Strip) and scanned using the GeneAtlas™ system. Initial data extraction and normalization within each array were performed in Partek Genomics Suite (Partek). For data analysis, two-way analysis of variance (ANOVA) was performed with software applications for Microarrays in Partek Genomics Suite (Partek) to extract the statistically significant data from each condition indicated in this study.
3. RESULTS
3.1. Meta-analysis of array data identifies genes with conserved response to aging & DNA damage
In order to identify genes with similar response during normal and accelerated aging in different organs and tissues and in cultured cells after DNA damage, we used a series of microarray datasets for meta-analysis: expression arrays of liver, kidney, lung and spleen of old mice [6], liver microarray datasets from DNA repair-deficient mouse models showing moderate (Ercc1d/−) or severe (Ercc1−/− and Xpa−/−Csbm/m) progeria [12, 13], and mRNA expression profiles of UV-irradiated primary mouse dermal fibroblasts (different doses, time points, repair defects) [17]. Genes with conserved responses were selected based on the following three criteria: 1) they were significantly differentially expressed in livers of 130 week old wild type mice, relative to young 13 week old control (p<0.05), with a gene expression difference larger than 2-fold and an expression change of at least 1.2 fold in the same direction, in at least two other organs analyzed (kidney, lung and spleen). 2) They were differentially expressed (p<0.05) with a fold change greater than 2, with a similar direction of change as observed in aged liver, in at least one out of the three analyzed progeroid mouse models (Ercc1d/−, Ercc1−/− and Xpa−/−Csbm/m). 3) They were differentially expressed (p<0.05) with a minimum fold change of 1.2 in at least one of the cell lines after UV irradiation (MDFs wild type, Xpa−/−, Csbm/m and Xpa−/−Csbm/m exposed to 0.6 and/or 4J/m2). In this manner, seven genes were identified that fulfilled all three criteria, showing a similar expression pattern across natural and accelerated aging as well as after UV-induced DNA damage: Chemokine (C-C motif) ligand 6 (Ccl6 (also known as C10), CD44 antigen, vascular cell adhesion molecule 1 (Vcam1), acyl-CoA synthetase long-chain family member 1 (Acsl1), transcription regulator BTB and CNC homology 2 (Bach2), leukemia inhibitory factor receptor (Lifr), and protein tyrosine phosphatase, receptor type, D (Ptprd). Three genes showed consistent upregulation across all conditions (Ccl6 (also known as C10), CD44 and Vcam1) and four genes were consistently downregulated (Acsl1, Bach2, Lifr and Ptprd) (figure 1A). The two main pathways associated with these genes are oxidative stress responses (Vcam1 [19], Lifr [20] and Bach2 [21]) and inflammation (Ccl6 [22] and Cd44 [23]). Acsl1 is member of the long-chain fatty-acid-coenzyme A ligase family and has also been implicated in inflammatory responses [24]. Ptprd is a tyrosine phosphatase for which only limited information is available.
Figure 1.

(A) Expression profiles of genes associated with aging, progeria and DNA damage. Depicted for each gene is the relative expression levels in organs of 130-wk old mice, livers of 3 progeria mouse models and UV-irradiated cultures of primary mouse dermal fibroblasts (MDFs) derived from repair-proficient and deficient mice. For each gene, the average expression values were compared with those of the corresponding control mice or untreated cells, respectively. (B) Mouse NIH3T3 cells were irradiated with the indicated UV dose. After 6h recovery, cells were lysed and relative RNA abundance was determined by real-time PCR for Bach2, B2M (internal control) and p21 (positive control). Values are corrected for γ-tubulin expression and normalized against mock-treatment. (C) NIH3T3 fibroblasts were irradiated with the indicated doses of UV. After 6h recovery cells were lysed and relative mRNA abundance was determined by real-time PCR. Values are corrected for γ-tubulin expression and normalized against mock-treatment. To evaluate the effect of irradiation on cell viability/proliferation cells were irradiated with the indicated doses of UV and cell numbers were counted after 48 hours recovery and compared to non-irradiated cells. (D) NIH3T3 cells were treated with 4 J/m2 UV or mock-treated. After the indicated recovery times, cells were lysed and relative mRNA abundance was determined by real-time PCR. Values are corrected for γ-tubulin expression and normalized against mock-treatment (n=4). (B–D) n=4, two-tailed t-test *=p<0.05, error bars indicate stdev.
We selected BACH2 for further investigation for the following reasons: 1) The Bach2 gene encodes a transcription factor with a presumed pro-apoptotic function in response to oxidative stress (through inhibition of the NRF2-mediated anti-oxidant response pathway) [21, 25, 26]. 2) As a transcription factor, BACH2 can potentially influence pathways involving multiple genes and consequently direct a coherent set of effects. 3) Even though BACH2 has never been described within the context of aging or non-oxidative types of damage, its expression pattern, as deduced from the microarray meta-analysis, suggests that it functions in a common, broader pathway linking DNA damage and aging. By preventing NRF2 inhibition, downregulation of BACH2 with advancing age and after DNA damage could potentially increase antioxidant defences, reduce apoptosis and thus contribute to the “survival response” [17]. We therefore decided to focus our investigations on Bach2, verified, and further characterised its dynamics during the DNA damage response.
3.2. Bach2 is downregulated after UV-irradiation in a time- and dose-dependent manner
The UV-induced down-regulation, as observed in the expression arrays, was verified by determining relative expression levels of Bach2 after UV-irradiation in the mouse fibroblast cell line NIH3T3. Quantitative assessment of mRNA levels by real-time PCR showed that six hours after UV-C irradiation, Bach2 mRNA levels were strongly downregulated in a dose-dependent manner. Activation of DNA damage responses was verified by upregulation of the cell cycle regulator p21. The housekeeping gene β2-microglobulin, conversely, remained stable over the course of the experiment, similarly to the housekeeping gene γ-tubulin, which was used for normalization (figure 1B). Sensitivity of the response was visualized by comparison of expression differences with relative survival levels. In figure 1C Bach2 mRNA levels after increasing doses of UV irradiation are plotted together with corresponding two-day survival percentages. Differential expression of Bach2 could already be detected at UV doses as low as 1 J/m2, which did not affect cellular survival and have been estimated to cause less than 0.01 damages per kb of DNA [27], therefore indicating that Bach2 expression is very sensitive to low damage loads. At a UV dose of 1 J/m2, the entire Bach2 genomic region (<9 kb) is expected to be subject to less than 0.1 lesions, which excludes a direct effect of transcription-blocking lesions on Bach2 transcript levels. The response kinetics showed an extremely rapid downregulation after UV-irradiation; within 30 minutes after the induction of UV-lesions expression levels of Bach2 were decreased (figure 1D), implying a rapid turn-over of the Bach2 mRNA pool. Next, we investigated whether Bach2 downregulation is conserved across several cell types and species. All tested cell types from different tissues and from stages of differentiation, which exhibited detectable Bach2 expression levels, showed prominent and consistent Bach2-attenuation after UV-induced damage. The investigated lines included mouse embryonic stem cells (figure 2A), mouse primary chondrocytes (figure 2B), mouse primary dermal fibroblasts (data not shown), and the human embryonic kidney HEK293T cell line (figure 2C). These results disclose a universal response mechanism indicating a strong functional conservation. To investigate if Bach2 suppression comprises a systemic response to damage in proliferating as well as in post-mitotic cells, we determined relative expression levels in UV-irradiated quiescent and cycling NIH3T3 cells. We observed a similar down-regulation under both conditions (figure 2D), thus indicating that Bach2 attenuation is independent of proliferation status.
Figure 2.

(A) Mouse WT E14 ES cells were UV-irradiated or mock-treated. After 6h recovery, cells were lysed and relative mRNA abundance was determined by real-time PCR. Values are corrected for γ-tubulin expression and normalized against mock-treatment (n=4). Error bars indicate stdev. *=p<0.05 (B) WT primary mouse chondrocytes were treated with the indicated doses of UV. After 6h recovery cells were lysed and relative mRNA abundance was determined by real-time PCR. Values are corrected for γ-tubulin expression and normalized against mock-treatment (n=4). Error bars indicate stdev. *=p<0.05 (C) Human HEK293T cells were treated with UV or mock-treated. After 6h recovery cells were lysed and relative RNA abundance was determined by real-time PCR. Values are corrected for γ-tubulin, Gapdh and β2-microglobulin and normalized against mock-treatment (n=4). Error bars indicate stdev. *=p<0.05 (D) Mouse NIH3T3 cells were grown at low serum conditions (1%FCS) for 3 days (starting day after seeding) to induce quiescence. Cells were treated with the indicated doses of UV and lysed after 6h recovery. Relative mRNA abundance was determined by real-time PCR. Values are corrected for γ-tubulin expression and normalized against mock-treatment (n=4). Error bars indicate stdev. *=p<0.05
3.3. Persistent transcription-blocking, rather than transient damage elicits a Bach2 response
The two primary types of DNA lesions caused by UV are pyrimidine 6-4 pyrimidone photoproducts (6-4PPs) and cyclobutane pyrimidine dimers (CPDs). CPDs contribute to ~70–80% of UV-C induced lesions [28, 29] and require TC-NER for detection and repair. The natural compound Illudin S also induces persistent DNA lesions that block transcription and depend on functional TC-NER for repair [30, 31]. Treatment of NIH3T3 cells with Illudin S elicited a similar Bach2 response as that observed after UV-irradiation, with a dose-dependent depletion of Bach2 mRNA levels starting at very low doses, which did not affect 2-day survival (figure 3A). Response kinetics were also extremely fast; within one hour after treatment the levels of Bach2 mRNA were reduced to less than 50% of baseline expression levels, reaching a minimum four hours after treatment (figure 3B). Next, we assessed the response to cisplatin, which induces intra- and interstrand crosslinks that require both interstrand crosslink (ICL) repair as well as NER for their removal [31]. Similar to both UV and Illudin S, cisplatin treatment also evokes a Bach2 suppression (figure 3C), an interesting effect in consideration of the established nexus between cisplatin survival and TC-NER [31]. Since, thus far, the only damage-related function of Bach2 has been described in response to oxidative stress, we assessed the effect of the pro-oxidant t-butyl hydroperoxide (tBH) on Bach2 expression levels. Even though the applied concentrations of tBH had a significant impact on two-day survival rates, they did not induce a transcriptional response of Bach2 (figure 3D). Similar results were observed after treatment with Diethyl Maleate (DEM), which mimics an oxidative insult by depleting reduced cellular glutathione (GSH) (data not shown).
Figure 3.

(A) NIH3T3 cells were treated with the indicated doses of Illudin S for 1h. After 4h recovery cells were lysed and relative mRNA abundance was determined by real-time PCR. Values are corrected for γ-tubulin expression and normalized against mock-treatment (n=4). Error bars indicate stdev. *=p<0.05. For the corresponding survival data, NIH3T3 cells were treated with the indicated doses of Illudin S for 1h. Cell numbers were counted after 2 days recovery (n=3). Error bars indicate stdev. *=p<0.05 (qPCR), #=p<0.05 (survival) compared to untreated. (B) NIH3T3 cells were treated with 25ng/mL Illudin S for 1h. Cells were lysed at the indicated time points and relative mRNA abundance was determined by real-time PCR. Values are corrected for γ-tubulin expression and normalized against mock-treatment (n=4). Error bars indicate stdev. *=p<0.05 compared to 0h. (C) NIH3T3 cells were treated with the indicated doses of Cisplatin for 6h. The cells were lysed immediately after treatment and relative mRNA abundance was determined by real-time PCR. Values are corrected for γ-tubulin expression and normalized against mock-treatment (n=4). Error bars indicate stdev. *=p<0.05 compared to untreated. (D) NIH3T3 cells were treated with H2O2 and Illudin S for 1h or irradiated with UV-C. After 6h recovery (UV: 7h) cells were lysed and relative mRNA abundance was determined by real-time PCR. Values are corrected for γ-tubulin expression and normalized against mock-treatment (n=4). For corresponding survivals, NIH3T3 cells were treated as described above and cell numbers were counted after 48 hours recovery. UV: n=4, H2O2 and Illudin S: n=3. Error bars indicate stdev. *=p<0.05 (qPCR), #=p<0.05 (survival) compared to untreated.
3.4. DNA lesions that block transcription are directly responsible for Bach2 attenuation
As opposed to the more abundant oxidative damages - such as single strand breaks and 8-oxodG lesions that are repaired with rather fast kinetics mostly by Base Excision Repair (BER) - UV irradiation, Illudin S and cisplatin induce persistent DNA lesions that can block elongating RNA polymerase II progression and require functional TC-NER for repair. To determine the contribution of persistent DNA lesions in Bach2 suppression, we assayed Bach2 mRNA levels in wild type and several NER-deficient primary mouse dermal fibroblasts (MDFs). Both Xpa−/− and Csbm/m cells, which are completely respectively deficient in NER and TC-NER, showed an exacerbated Bach2 response after treatment with Illudin S (figure 4A); although not statistically significant, the same trend was observed in response to UV irradiation (data not shown). Similar expression patterns have been previously observed for the key somatotropic genes GHR and IGF1R as part of the “survival response” [17]. CPDs are the most persistent UV-induced lesions, as they largely escape detection by the rodent GG-NER and are tolerated by the replication machinery due to specialised translesion DNA synthesis. Hence CPDs account for a large proportion of the total UV damage load. While recognition and repair of these lesions by TC-NER depends on the rate of transcription for any specific gene and for most genes is slow, CPDs can be instantaneously repaired by CPD-photolyases [32]. These enzymes, which are not present in placental mammals, use energy from visible light to directly revert the lesion back to its original nucleotide sequence, which is referred to as photoreactivation. To determine whether persistent DNA lesions were causal for Bach2 attenuation, we used CPD-photolyases to control DNA repair in our system. Mouse dermal fibroblasts carrying a transgene for CPD-photolyase were UV-irradiated and subsequently either immediately subjected to photoreactivation or mock treated (kept in the dark). Figure 4B shows that photoreactivation of CPD lesions leads to a partial alleviation of the Bach2 attenuation, indicating that DNA damage triggers downregulation of Bach2 mRNA levels directly and not through other non-DNA damage mediated mechanisms. The observation that the alleviation is not complete can be explained by CPD lesions already stalling elongating RNA polymerases, which are inaccessible to photolyase [33], and UV-induced 6-4PPs lesions, which have not yet been removed by GG-NER.
Figure 4.

(A) wild type, Xpa−/− and Csb−/− primary MDFs were treated with the indicated doses of Illudin S for 1h. After 6h recovery the cells were lysed and relative mRNA abundance was determined by real-time PCR. Values are corrected for γ-tubulin and normalized against mock-treatment. *=p<0.05 compared to corresponding wild type. (B) Primary CPD-photolyase transgenic mouse dermal fibroblasts were treated with 4J/m2 UV and either photoreactivated for 1h in HBSS (P.R.) under white light or mock treated in dark conditions (non P.R.). After photoreactivation, the cells were allowed to recovery for an additional 4h before lysis. Relative mRNA abundance was determined by real-time PCR. Values are corrected for γ-tubulin and normalized against mock-treatment. *=p<0.05 P.R. compared to non P.R. (C) Quiescent NIH3T3 were mock-treated or subjected to 4 J/m2 UV and incubated immediately with transcription-inhibitor Actinomycin D (1μg/mL) for the indicated times. After cell lysis, total RNA isolation, cDNA synthesis and Real-Time PCR amplification were performed as described in the text. Values are corrected for β2-microglobulin expression and normalized against mock-treatment (no significant differences). (D) NIH3T3 cells were transiently transfected with an expression vector containing full length human Bach2 cDNA under the control of a CMV promoter or a control mCherry expression vector. 48h after transfection, relative human (Hs) Bach2 mRNA levels were determined by real-time PCR. Values are corrected for γ-tubulin and normalized against mock-treatment (n=4); *=p<0.05 compared to control transfected samples. (E) NIH3T3 cells were transiently transfected with an expression vector containing full length human Bach2 cDNA under the control of a CMV promoter or a control mCherry expression construct. 48h after transfection, endogenous mouse (Mm) Bach2 levels were determined by real-time PCR. Values are corrected for γ-tubulin and normalized against mock-treatment (n=4); *=p<0.05 compared to control transfected samples. (F) NIH3T3 cells were transiently transfected with an siRNA pool targeting endogenous Bach2 or a non-targeting control siRNA pool. 48h after transfection, endogenous mouse (Mm) Bach2 mRNA levels were determined by real-time PCR. Values are corrected for γ-tubulin and normalized against mock-treatment (n=4); *=p<0.05 compared to control transfected samples.
To investigate the mechanism of downregulation of Bach2 mRNA levels in response to UV-irradiation, the stability of Bach2 mRNA in the presence and absence of UV-induced damage was determined using real-time PCR combined with Actinomycin D treatment to block de novo mRNA synthesis [34]. Under normal conditions, as well as after irradiation with 4 J/m2, Bach2 mRNA had a very rapid turnover, with a half-life of approximately 1 hour in both conditions (figure 4C). This observation suggests that downregulation of Bach2 mRNA is not caused by a decrease in mRNA stability. Taken together, our results show that Bach2 mRNA is a very sensitive responder to transcription-blocking lesions. The mRNA half-life of Bach2 is extremely short and its turnover-kinetics indicate that a direct complete suppression of transcription could be sufficient to result in such rapid downregulation. We cannot fully exclude, however, the possibility that PolII arrest caused by Actinomycin D not only blocks Bach2 transcription, but also signals its degradation by other, yet undetermined, mechanisms.
3.5. BACH2 protein dynamics
We next sought to determine how downregulation of Bach2 transcript impacts BACH2 protein levels. We therefore investigated Bach2 protein dynamics, by calculating its half-life after inhibition of de novo protein synthesis. Specifically, we measured decrease in the abundance of ectopically expressed, tagged (FLAG or GFP) BACH2 protein in NIH3T3 fibroblasts that were treated with the inhibitor of protein biosynthesis Cycloheximide (50μg/ml). Bach2 protein is short-lived with a half-life of 5.5 hours (figure 5). Experiments investigating the half-life of the endogenous protein are not amenable due to the lack of reliable antibodies. Is should be however noted that the high abundance of ectopically produced BACH2 could potentially saturate its degradation pathways. The half-life of the endogenous protein may be therefore shorter than that of the ectopic one and our findings from ectopic expression might even underestimate the biological significance of Bach2 downregulation after DNA damage.
Figure 5.

Determination of BACH2 protein half-life. NIH 3T3 fibroblasts were transiently transfected with FLAG-Bach2 and 48h after transfection protein synthesis was inhibited with cycloheximide (50μg/ml). Cells were harvested at the indicated times and protein lysates were analysed by immunoblotting using antibodies against the FLAG epitope and β-tubulin (top). The half-life of FLAG-Bach2 was estimated to be 5.5 hours and was calculated after regression analysis using the GraphPad Prism software (bottom).
3.6. Effects of BACH2 depletion and overexpression assessed by microarray analysis
Despite the extreme sensitivity of Bach2 to transcription-blocking lesions, the physiological significance of Bach2 downregulation in response to DNA damage remains to be identified. As a transcription regulator, conditions that influence Bach2 levels could consequently affect the expression of many target genes. While our analysis indicates that DNA damage has a role in regulation of Bach2 in a variety of cell-types and tissues, the transcriptional targets of Bach2 that have been described so far are few and only apply to the hematopoietic system [35–37]. The best described target gene of BACH2 is B lymphocyte-induced maturation protein 1 (Blimp-1); a key regulator of plasma cell differentiation [37, 38]. However, this gene is not expressed at detectable levels in NIH3T3 cells (data not shown) and as a B-cell specific factor it seems unlikely that BLIMP-1 is involved in mediating BACH2 responses beyond the hematopoietic system. The widespread and conserved Bach2 suppression, in response to UV irradiation and during aging, implies that there may be more general BACH2 targets. Therefore, we set out to identify targets of Bach2 in a wider context, using Bach2 silencing and overexpression in NIH3T3 fibroblasts. For this purpose, cells were transiently transfected with an expression vector containing full length human Bach2 cDNA under the control of a CMV promoter or a siRNA pool designed against mouse Bach2 and their respective controls (described in materials and methods). Samples were obtained 48h after transfection and knockdown and overexpression efficiencies were assessed by real-time PCR. Transient transfection with the expression construct resulted in substantial overexpression (figure 4D), without affecting the endogenous mRNA levels (figure 4E), while the siRNA pool targeted against Bach2 reduced endogenous mRNA levels to a residual 23% (figure 4F). These samples were subsequently used for genome-wide expression analysis and we have sought to identify overrepresented biological pathways and genes. As might be expected from transient (and incomplete) knockdown of a single protein, only minor shifts in expression profiles were observed. The Bach2 siRNA differential expression gene-list contained 110 genes (FDR 0.05; FC>1.1) (see supplementary table 1). However, the Bach2 overexpression dataset identified only Mycn to be differentially expressed when analysed in the same way (FDR 0.05, FC>1.1). The absence of differentially expressed genes in the Bach2 overexpression samples was unexpected because of earlier publications indicating detrimental effects of Bach2 overexpression on cell proliferation [26] and of our own observations that clearly showed a negative effect of Bach2 overexpression on cell survival as well as changes in cell morphology (see below). We therefore decided to focus first on the siRNA dataset. In accordance to our expectations, Bach2 was among the genes with the largest gene expression changes in the siRNA samples (46% and 37% of control levels for the two separate Bach2-probesets) thus confirming that the arrays successfully identified the positive controls, even though Bach2 levels were slightly higher than those expected based on the qPCR results. In addition, within the siRNA gene set, Bach2 was identified as a potential regulator of transcription for the upregulated, but not for the downregulated genes using the program ExPlain (Biobase). These results confirm that Bach2 most likely functions as a transcriptional repressor, as has been previously suggested [26, 39], and validate that microarray analysis can be used to identify minor expression changes. None of the previously identified BACH2 targets were found to be differentially expressed in our arrays. This observation is not surprising since most factors are B-cell specific and are not expressed at detectable levels in NIH3T3 cells. Because the expression changes were minor, we decided to use less stringent criteria to create a gene list for pathway analysis: 2-way ANOVA analysis (p<0.05, FC>1.1) identified 2089 differentially expressed genes (2623 probesets) (supplementary table 2), which were entered for DAVID Bioinformatics Resources 6.7 online Gene Ontology (GO) analysis [40]. Table 2 shows that cell cycle progression, regulation of transcription, phosphate metabolic processes, extracellular structure organization and cell death are the major affected GO terms. Even though the overexpression array samples did not yield a gene list that surpassed chance expectation, we hypothesized that minor gene changes might be hidden within the noise of the microarray. We therefore decided to check whether there was any overlap between the differentially expressed genes of the overexpression and siRNA gene list. We used the same criteria as before for the siRNA dataset (p<0.05, FC>1.1; 2623 probesets) and compared this to the overexpression condition (FC>1.1 independent of p-value; 3403 probesets). The overlap between both datasets was 260 probesets, while by chance an overlap of only 198 probesets was predicted. In summary, GO term analysis revealed that extracellular matrix organization, intracellular signalling, cell death and regulation of transcription were affected (supplementary table 3).
3.7. BACH2 overexpression is detrimental to cell survival while silencing promotes cell growth and confers protection from acute oxidative stress
We next explored the effects of BACH2 on cell growth and survival.
To determine the effects of Bach2 overexpression, NIH3T3 cells were infected with mCherry (control), mCherry-Bach2 or FLAG-Bach2 constructs. As previously reported [21], we observed a predominantly cytoplasmic localization of the tagged ABCH2 proteins. While available antibodies to BACH2 were not suitable for visualizing endogenous BACH2, overexpressed BACH2 was detectable and we confirmed that the tagged proteins showed similar localization pattern as the non-tagged BACH2, which was used for microarray analysis (data not shown). Cell proliferation assays by cell counting confirmed that ectopically expressed BACH2 conferred a growth-disadvantage compared to mCherry expressing control cultures (figure 6A). When the hygromycin-selectable marker that was present on the plasmids was used to apply selective pressure, the detrimental effect of Bach2 overexpression became evident. While most control cells adapted to the selective pressure and regained normal growth rates two to three days after the introduction of hygromycin, most Bach2-infected cells were lost within this timeframe. A limited number of surviving cells regain proliferative capacity only after four days (figure 6B, note the logarithmic scale). The surviving populations of Bach2-expressing cells had very low, often visually undetectable expression levels. Morphologically, these cells were very heterogeneous and many of them had lost their characteristic stretched fibroblast-like appearance (data not shown). Taken together, these results show that overexpression of Bach2 confers a severe growth disadvantage and has a detrimental effect on cell survival. We could not fully exclude that Bach2 itself influences the expression of the selectable marker and thus cell growth. We believe this would not be the case, also in consideration of the well-established resilience of the MoMuLV 5′LTR element, which controls hygromycin expression, to alterations in the intracellular environment. Further studies are required to rule out this possibility.
Figure 6.
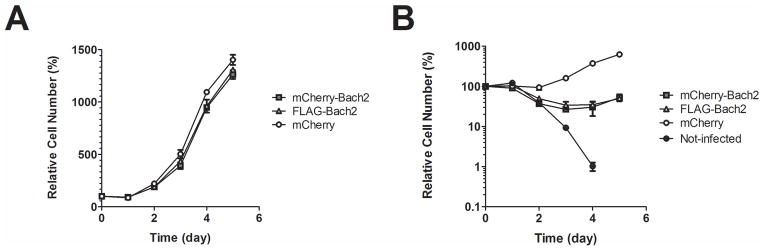
(A) NIH3T3 cells were infected with mCherry, mCherry-Bach2 or FLAG-Bach2 expression vectors. One day after infection, cells were re-plated in 24-well plates at 75 cells/mm2. Proliferation was assessed by counting cell numbers on consecutive days. Error bars represent stdev., n=3. Cell numbers at days 3, 4 and 5 differed significantly between Bach2 overexpressing lines and the mCherry control (p<0,001 two way ANOVA with Bonferroni post-test). (B) NIH3T3 cells were transduced with mCherry (control), mCherry-tagged BACH2 or FLAG-tagged BACH2 and allowed to grow to confluency. Non-transduced NIH3T3 cells were used as negative control for selection. Cells were re-seeded to 24-well format and placed under hygromycin selection 24h later. Cell numbers were assessed by cell counting every day for 6 consecutive days. Error bars represent stdev. (n=3). Cell numbers in all days after day 1 differed significantly between Bach2 overexpressing lines and mCherry control (p<0,001 two way ANOVA with Bonferroni post-test).
Silencing of Bach2 promoted cell growth and resistance to toxic levels of oxidative stress, in agreement with a negative effect of BACH2 in cell homeostasis. NIH3T3 cells were transfected with a pool of siRNA targeting Bach2 or non-targeting control siRNAs. Twenty hours later cells were re-plated and cell proliferation was assayed by counting cell numbers up to a week post plating; cells with silenced Bach2 expression had a clear growth advantage (figure 7B). This could be attributed (at least in part) on preventing negative cell cycle regulation by BACH2 since the number of cells in S phase 24 hours after plating was significantly higher in cells with silenced Bach2 (figure 7A). Silencing of Bach2 not only promoted cell growth, it also increased cell viability after exposure to toxic levels of oxidative stress, consistent with its proposed function as a competitor of the NRF2 antioxidant response pathway (figure 7C). As expected, Bach2 silencing did not protect cells from UV-genotoxic stress (figure 7D). UV irradiation itself supresses Bach2 so efficiently that silencing provides no additional benefits. Overall, our observation indicate that suppression of Bach2 by DNA damage (and during aging) is a component of a survival response aiming to promote cell homeostasis.
Figure 7.

Effect of Bach2 knock-down in proliferation and stress response of NIH3T3 fibroblasts. Cells were transiently transfected with siRNA pool targeting endogenous Bach2 or non-targeting control siRNA. 24 hours after transfection cells were re-plated at 75 cells/mm2. (A) 18 hours after plating cells were pulse-labelled for 2 hours with the thymidine analogue EdU and followed by Click-it reaction and DAPI staining. Cells in S phase were visualized by fluorescence microscopy. Error bars represent stdev., n=3; **=p<0.001. (B) Proliferation was assessed by counting cell numbers on the indicated days. Error bars represent stdev. (n=3). The 5 and 7 day time points differed significantly between the control and Bach2 siRNA (p<0,001 two way ANOVA with Bonferroni post-test) (C) Sensitivity of NIH 3T3 cells to oxidative stress. Cells expressing normal or reduced levels of Bach2 were plated at 20,000 cells per well in a 96-well plate and 24 hours later were exposed for 2h hours to the indicated amount of tBH. Following a 24h period cells were lysed and ATP concentration was determined as a measure of cell viability. LD50 (0.116 mM in control and 0.163 mM in Bach2 knockdown NIH3T3 cells) was determined after Sigmoidal data fitting using the GraphPad Prism 4 software. (D) Clonogenic survival of UV irradiated NIH3T3 cells. Cells plated at clonal densities were UV irradiated with the indicated doses. Colonies were stained and counted 2 weeks after irradiation. Error bars represent stdev. (n=3).
4. DISCUSSION AND CONCLUSION
Recent genome-wide mRNA expression array comparisons have uncovered striking similarities between accelerated, natural and decelerated aging as well as after in-vitro induction of persistent DNA damage [6]. However, while individual or paired analyses have been used to identify common pathways, we have combined these expression datasets to identify key genes with common responses across NER-deficient progeroid mouse models, natural aging and UV-induced DNA damage. Using this approach, we have identified several genes, and here we present a detailed analysis of the DNA damage response characteristics of one of them, namely the transcription factor BACH2, which we show to be a highly sensitive DNA damage-responder.
Meta-analysis of microarray datasets in search of genes with parallel expression pattern across natural and accelerated aging, and after direct induction of UV-damage, has yielded seven genes. Ccl6, CD44 and Vcam1 were consistently upregulated through all studied conditions. Ccl6 as well as CD44 were previously identified by Swindell [5] within the top 300 genes that are most strongly upregulated by age across tissues (p-values of 4.21e-12 and 1.8e-10 respectively). Acsl1, Bach2, Lifr and Ptprd were the four downregulated genes that matched our selection criteria. A common biological theme represented by these genes is oxidative stress response, in which Vcam1 [41], Bach2 [21, 26, 42] and Lifr [20] have been reported to be involved in some way. Of the seven selected genes, we decided to continue our investigations with transcription factor BACH2, which had never been studied within the context of aging or non-oxidative damage, such as that caused by UV irradiation. The observed expression pattern of Bach2 across accelerated and natural aging, as well as in response to UV, combined with its regulatory potential as a transcription factor [25] and its described pro-apoptotic role in oxidative stress responses [26], prompted us to continue our investigations on this specific gene.
Verification of the UV-response of Bach2 showed a very rapid and pronounced downregulation of its mRNA levels, with high sensitivity to minute doses of DNA damage. Further investigations showed that UV irradiation and Illudin S treatment, which cause persistent DNA lesions that interfere with ongoing transcription, elicit the strongest Bach2 response. More transient lesions, such as those induced by tBH and DEM treatment did not induce Bach2 expression changes.
Downregulation of Bach2 mRNA levels in response to UV irradiation was independent of proliferation and could be alleviated by immediate removal of CPDs, the main type of transcription-blocking lesions induced by UV. The theoretical possibility that UV-lesions themselves interfere with Bach2 transcription could be practically ruled out by taking under consideration the low dose, average UV lesion frequency, the magnitude of the suppression, and the small size of the Bach2 genomic region. Regulatory mechanisms could comprise changes in mRNA stability or direct promoter regulation. However, mRNA half-life experiments did not show any significant difference in message stability before or after UV-irradiation, and showed that the Bach2 mRNA has constitutively a very high turnover rate. Our data demonstrate that an immediate shutdown of Bach2 transcription after damage is sufficient to elicit rapid disappearance of Bach2 mRNA due to its high turnover rate.
Microarray analysis of Bach2 knockdown and over-expressing cells identified a limited set of differentially expressed genes. In the knockdown samples, BACH2 was identified as a potential transcriptional regulator of the upregulated gene set. In addition, GO term analysis identified cell cycle control, transcription and the extracellular matrix as the most prominent affected pathways, suggesting that BACH2, as a transcription factor, affects cell cycle progression and possibly cell shape. However, unexpectedly, the antioxidant system was absent and no NRF2-targets were identified among the differentially expressed genes. It is likely however, that in the absence of pro-oxidant challenges, BACH2-mediated transcriptional suppression is not apparent.
Overexpression of Bach2 has previously been reported to have a negative effect on cell growth and survival, which was dependent on its bZip domain, which mediates dimerization and DNA binding [26]. We also have observed that overexpression of a Bach2 is detrimental to cell growth and survival. However, our microarray experiments with transient Bach2 overexpression resulted in the detection of only one differentially expressed gene, despite clear morphological and cellular changes in long-term experiments. We foresee three possible explanations for this result. First, Since BACH2 has been reported to exert its repressor function in a complex with small MAFs [25], overexpression of a single protein from this complex may not be sufficient to significantly alter its function. Second, gene downregulation by a repressor is measurable only if expression of its targets is initially high. Thus, in the absence of a promoter-activating signal, changes in the expression of BACH2 targets might be below detection limits. Third, it is conceivable that BACH2 overexpression is required for longer time-periods than those used in this study to considerably influence gene expression.
BACH2 overexpression induces biological effects, which were clearly demonstrated by functional assays and visual inspection, despite the absence of significant transcriptional in microarray experiments. Importantly, BACH2 silencing had opposite consequences than those of observed in overexpression; it stimulated proliferation and survival after acute oxidative stress. These observations substantiate the concept that suppression of Bach2 during aging is part of a response counteracting detrimental effects of damage accumulation and promoting survival. Nonetheless, the balance between growth and somatic preservation in aging is complex and further and more focused studies will be required to elucidate the exact role of BACH2 in natural aging.
In summary, we have identified Bach2 as a highly sensitive DNA damage responder that is downregulated after persistent DNA damage as well as during aging. Our findings strengthen and emphasize the common mechanism between these distinct biological processes. Microarray studies after Bach2 silencing revealed that functional consequences include alterations in cell cycle parameters and regulation of transcription, changes in extracellular matrix pathways, and cell death. When combined with the high turnover rate of the endogenous mRNA and the conservation of the Bach2 response, this evidence indicates that precise and tight Bach2 regulation is critical for cellular physiology and survival. This is also confirmed by the growth inhibitory and pro-apoptotic effect of forced BACH2 overexpression and conversely, the clear growth stimulatory and protective effect of Bach2 silencing.
Supplementary Material
HIGHLIGHTS.
Meta-analysis identifies genes with conserved response to aging and DNA damage
Transcriptional regulator BACH2 is suppressed during aging and in response to DNA damage
Bach2 expression is a rapid and highly sensitive reporter of DNA damage
Transcription blocking DNA lesions are directly responsible for Bach2 attenuation
Bach2 overexpression is detrimental to cell survival
Acknowledgments
We acknowledge financial support from the European commission FP7 Markage (FP7-Health-2008-200880), DNA Repair (LSHG-CT-2005-512113) and LifeSpan (LSHG-CT-2007-036894), National Institute of Health (NIH)/National Institute of Ageing (NIA) (1PO1 AG-17242-02), NIEHS (1UO1 ES011044), and the Royal Academy of Arts and Sciences of the Netherlands (academia professorship to JHJH) and a European Research Council Advanced Grant to JHJH. The research leading to these results has received funding from the European Community’s Seventh Framework Programme (FP7/2007-2013) under grant agreement No. HEALTH-F2-2010-259893.
Appendix A. Supplementary data
The following are Supplementary data to this article: PDF
Footnotes
CONFLICT OF INTEREST STATEMENT
The authors declare no conflict of interest.
Publisher's Disclaimer: This is a PDF file of an unedited manuscript that has been accepted for publication. As a service to our customers we are providing this early version of the manuscript. The manuscript will undergo copyediting, typesetting, and review of the resulting proof before it is published in its final citable form. Please note that during the production process errors may be discovered which could affect the content, and all legal disclaimers that apply to the journal pertain.
Contributor Information
L.M. Uittenboogaard, MGC Department of Cell Biology and Genetics, Center for Biomedical Genetics, Erasmus Medical Center, PO Box 1738, 3000 DR Rotterdam, The Netherlands
C. Payan-Gomez, Joint affiliation EMC & Facultad de Ciencias Naturales y Matemáticas, Universidad del Rosario, Bogotá, Colombia
J. Pothof, MGC Department of Cell Biology and Genetics, Center for Biomedical Genetics, Erasmus Medical Center, PO Box 1738, 3000 DR Rotterdam, The Netherlands
W. van IJcken, Erasmus Center for Biomics, Erasmus Medical Center, 3000DR Rotterdam, The Netherlands
PG Mastroberardino, MGC Department of Cell Biology and Genetics, Center for Biomedical Genetics, Erasmus Medical Center, PO Box 1738, 3000 DR Rotterdam, The Netherlands.
van der Pluijm, I., MGC Department of Cell Biology and Genetics, Center for Biomedical Genetics, Erasmus Medical Center, PO Box 1738, 3000 DR Rotterdam, The Netherlands
J.H.J. Hoeijmakers, MGC Department of Cell Biology and Genetics, Center for Biomedical Genetics, Erasmus Medical Center, PO Box 1738, 3000 DR Rotterdam, The Netherlands.
M. Tresini, MGC Department of Cell Biology and Genetics, Center for Biomedical Genetics, Erasmus Medical Center, PO Box 1738, 3000 DR Rotterdam, The Netherlands.
References
- 1.Kirkwood TB, Austad SN. Why do we age? Nature. 2000;408:233–238. doi: 10.1038/35041682. [DOI] [PubMed] [Google Scholar]
- 2.Lorenzini A, Stamato T, Sell C. The disposable soma theory revisited: Time as a resource in the theories of aging. Cell Cycle. 2011;10:3853–3856. doi: 10.4161/cc.10.22.18302. [DOI] [PubMed] [Google Scholar]
- 3.Curran SP, Ruvkun G. Lifespan regulation by evolutionarily conserved genes essential for viability. PLoS Genet. 2007;3:e56. doi: 10.1371/journal.pgen.0030056. [DOI] [PMC free article] [PubMed] [Google Scholar]
- 4.Pletcher SD, Macdonald SJ, Marguerie R, Certa U, Stearns SC, Goldstein DB, Partridge L. Genome-wide transcript profiles in aging and calorically restricted Drosophila melanogaster. Current biology: CB. 2002;12:712–723. doi: 10.1016/s0960-9822(02)00808-4. [DOI] [PubMed] [Google Scholar]
- 5.Swindell WR. Genes and gene expression modules associated with caloric restriction and aging in the laboratory mouse. BMC genomics. 2009;10:585. doi: 10.1186/1471-2164-10-585. [DOI] [PMC free article] [PubMed] [Google Scholar]
- 6.Schumacher B, van der Pluijm I, Moorhouse MJ, Kosteas T, Robinson AR, Suh Y, Breit TM, van Steeg H, Niedernhofer LJ, van Ijcken W, Bartke A, Spindler SR, Hoeijmakers JH, van der Horst GT, Garinis GA. Delayed and accelerated aging share common longevity assurance mechanisms. PLoS Genet. 2008;4:e1000161. doi: 10.1371/journal.pgen.1000161. [DOI] [PMC free article] [PubMed] [Google Scholar]
- 7.Girardot F, Lasbleiz C, Monnier V, Tricoire H. Specific age-related signatures in Drosophila body parts transcriptome. BMC genomics. 2006;7:69. doi: 10.1186/1471-2164-7-69. [DOI] [PMC free article] [PubMed] [Google Scholar]
- 8.Chen YF, Wu CY, Kao CH, Tsai TF. Longevity and lifespan control in mammals: lessons from the mouse. Ageing research reviews. 2010;9(Suppl 1):S28–35. doi: 10.1016/j.arr.2010.07.003. [DOI] [PubMed] [Google Scholar]
- 9.Anderson RM, Shanmuganayagam D, Weindruch R. Caloric restriction and aging: studies in mice and monkeys. Toxicologic pathology. 2009;37:47–51. doi: 10.1177/0192623308329476. [DOI] [PMC free article] [PubMed] [Google Scholar]
- 10.Masoro EJ. Overview of caloric restriction and ageing. Mechanisms of ageing and development. 2005;126:913–922. doi: 10.1016/j.mad.2005.03.012. [DOI] [PubMed] [Google Scholar]
- 11.McKee Alderman J, DePetrillo MA, Gluesenkamp AM, Hartley AC, Verhoff SV, Zavodni KL, Combs TP. Calorie restriction and dwarf mice in gerontological research. Gerontology. 2010;56:404–409. doi: 10.1159/000235720. [DOI] [PubMed] [Google Scholar]
- 12.Niedernhofer LJ, Garinis GA, Raams A, Lalai AS, Robinson AR, Appeldoorn E, Odijk H, Oostendorp R, Ahmad A, van Leeuwen W, Theil AF, Vermeulen W, van der Horst GT, Meinecke P, Kleijer WJ, Vijg J, Jaspers NG, Hoeijmakers JH. A new progeroid syndrome reveals that genotoxic stress suppresses the somatotroph axis. Nature. 2006;444:1038–1043. doi: 10.1038/nature05456. [DOI] [PubMed] [Google Scholar]
- 13.van der Pluijm I, Garinis GA, Brandt RM, Gorgels TG, Wijnhoven SW, Diderich KE, de Wit J, Mitchell JR, van Oostrom C, Beems R, Niedernhofer LJ, Velasco S, Friedberg EC, Tanaka K, van Steeg H, Hoeijmakers JH, van der Horst GT. Impaired genome maintenance suppresses the growth hormone--insulin-like growth factor 1 axis in mice with Cockayne syndrome. PLoS biology. 2007;5:e2. doi: 10.1371/journal.pbio.0050002. [DOI] [PMC free article] [PubMed] [Google Scholar]
- 14.Park JY, Cho MO, Leonard S, Calder B, Mian IS, Kim WH, Wijnhoven S, van Steeg H, Mitchell J, van der Horst GT, Hoeijmakers J, Cohen P, Vijg J, Suh Y. Homeostatic imbalance between apoptosis and cell renewal in the liver of premature aging Xpd mice. PloS one. 2008;3:e2346. doi: 10.1371/journal.pone.0002346. [DOI] [PMC free article] [PubMed] [Google Scholar]
- 15.Garinis GA. Nucleotide excision repair deficiencies and the somatotropic axis in aging. Hormones (Athens) 2008;7:9–16. doi: 10.14310/horm.2002.1111032. [DOI] [PubMed] [Google Scholar]
- 16.van de Ven M, Andressoo JO, Holcomb VB, von Lindern M, Jong WM, De Zeeuw CI, Suh Y, Hasty P, Hoeijmakers JH, van der Horst GT, Mitchell JR. Adaptive stress response in segmental progeria resembles long-lived dwarfism and calorie restriction in mice. PLoS Genet. 2006;2:e192. doi: 10.1371/journal.pgen.0020192. [DOI] [PMC free article] [PubMed] [Google Scholar]
- 17.Garinis GA, Uittenboogaard LM, Stachelscheid H, Fousteri M, van Ijcken W, Breit TM, van Steeg H, Mullenders LH, van der Horst GT, Bruning JC, Niessen CM, Hoeijmakers JH, Schumacher B. Persistent transcription-blocking DNA lesions trigger somatic growth attenuation associated with longevity. Nature cell biology. 2009;11:604–615. doi: 10.1038/ncb1866. [DOI] [PMC free article] [PubMed] [Google Scholar]
- 18.Garinis GA, Schumacher B. Transcription-blocking DNA damage in aging and longevity. Cell Cycle. 2009;8:2134–2135. [PubMed] [Google Scholar]
- 19.Dong A, Shen J, Zeng M, Campochiaro PA. Vascular cell-adhesion molecule-1 plays a central role in the proangiogenic effects of oxidative stress. Proceedings of the National Academy of Sciences of the United States of America. 2011;108:14614–14619. doi: 10.1073/pnas.1012859108. [DOI] [PMC free article] [PubMed] [Google Scholar]
- 20.Chollangi S, Wang J, Martin A, Quinn J, Ash JD. Preconditioning-induced protection from oxidative injury is mediated by leukemia inhibitory factor receptor (LIFR) and its ligands in the retina. Neurobiology of disease. 2009;34:535–544. doi: 10.1016/j.nbd.2009.03.012. [DOI] [PMC free article] [PubMed] [Google Scholar]
- 21.Hoshino H, Kobayashi A, Yoshida M, Kudo N, Oyake T, Motohashi H, Hayashi N, Yamamoto M, Igarashi K. Oxidative stress abolishes leptomycin B-sensitive nuclear export of transcription repressor Bach2 that counteracts activation of Maf recognition element. The Journal of biological chemistry. 2000;275:15370–15376. doi: 10.1074/jbc.275.20.15370. [DOI] [PubMed] [Google Scholar]
- 22.Wu Y, Prystowsky MB, Orlofsky A. Sustained high-level production of murine chemokine C10 during chronic inflammation. Cytokine. 1999;11:523–530. doi: 10.1006/cyto.1998.0436. [DOI] [PubMed] [Google Scholar]
- 23.Johnson P, Ruffell B. CD44 and its role in inflammation and inflammatory diseases. Inflammation & allergy drug targets. 2009;8:208–220. doi: 10.2174/187152809788680994. [DOI] [PubMed] [Google Scholar]
- 24.Kanter JE, Kramer F, Barnhart S, Averill MM, Vivekanandan-Giri A, Vickery T, Li LO, Becker L, Yuan W, Chait A, Braun KR, Potter-Perigo S, Sanda S, Wight TN, Pennathur S, Serhan CN, Heinecke JW, Coleman RA, Bornfeldt KE. Diabetes promotes an inflammatory macrophage phenotype and atherosclerosis through acyl-CoA synthetase 1. Proceedings of the National Academy of Sciences of the United States of America. 2012;109:E715–724. doi: 10.1073/pnas.1111600109. [DOI] [PMC free article] [PubMed] [Google Scholar]
- 25.Muto A, Hoshino H, Madisen L, Yanai N, Obinata M, Karasuyama H, Hayashi N, Nakauchi H, Yamamoto M, Groudine M, Igarashi K. Identification of Bach2 as a B-cell-specific partner for small maf proteins that negatively regulate the immunoglobulin heavy chain gene 3′ enhancer. The EMBO journal. 1998;17:5734–5743. doi: 10.1093/emboj/17.19.5734. [DOI] [PMC free article] [PubMed] [Google Scholar]
- 26.Muto A, Tashiro S, Tsuchiya H, Kume A, Kanno M, Ito E, Yamamoto M, Igarashi K. Activation of Maf/AP-1 repressor Bach2 by oxidative stress promotes apoptosis and its interaction with promyelocytic leukemia nuclear bodies. The Journal of biological chemistry. 2002;277:20724–20733. doi: 10.1074/jbc.M112003200. [DOI] [PubMed] [Google Scholar]
- 27.van Hoffen A, Venema J, Meschini R, van Zeeland AA, Mullenders LH. Transcription-coupled repair removes both cyclobutane pyrimidine dimers and 6-4 photoproducts with equal efficiency and in a sequential way from transcribed DNA in xeroderma pigmentosum group C fibroblasts. The EMBO journal. 1995;14:360–367. doi: 10.1002/j.1460-2075.1995.tb07010.x. [DOI] [PMC free article] [PubMed] [Google Scholar]
- 28.Vreeswijk MP, van Hoffen A, Westland BE, Vrieling H, van Zeeland AA, Mullenders LH. Analysis of repair of cyclobutane pyrimidine dimers and pyrimidine 6-4 pyrimidone photoproducts in transcriptionally active and inactive genes in Chinese hamster cells. The Journal of biological chemistry. 1994;269:31858–31863. [PubMed] [Google Scholar]
- 29.Perdiz D, Grof P, Mezzina M, Nikaido O, Moustacchi E, Sage E. Distribution and repair of bipyrimidine photoproducts in solar UV-irradiated mammalian cells. Possible role of Dewar photoproducts in solar mutagenesis. The Journal of biological chemistry. 2000;275:26732–26742. doi: 10.1074/jbc.M001450200. [DOI] [PubMed] [Google Scholar]
- 30.Jaspers NG, Raams A, Kelner MJ, Ng JM, Yamashita YM, Takeda S, McMorris TC, Hoeijmakers JH. Anti-tumour compounds illudin S and Irofulven induce DNA lesions ignored by global repair and exclusively processed by transcription- and replication-coupled repair pathways. DNA repair. 2002;1:1027–1038. doi: 10.1016/s1568-7864(02)00166-0. [DOI] [PubMed] [Google Scholar]
- 31.Furuta T, Ueda T, Aune G, Sarasin A, Kraemer KH, Pommier Y. Transcription-coupled nucleotide excision repair as a determinant of cisplatin sensitivity of human cells. Cancer research. 2002;62:4899–4902. [PubMed] [Google Scholar]
- 32.Eker AP, Quayle C, Chaves I, van der Horst GT. DNA repair in mammalian cells: Direct DNA damage reversal: elegant solutions for nasty problems. Cellular and molecular life sciences: CMLS. 2009;66:968–980. doi: 10.1007/s00018-009-8735-0. [DOI] [PMC free article] [PubMed] [Google Scholar]
- 33.Tornaletti S, Reines D, Hanawalt PC. Structural characterization of RNA polymerase II complexes arrested by a cyclobutane pyrimidine dimer in the transcribed strand of template DNA. The Journal of biological chemistry. 1999;274:24124–24130. doi: 10.1074/jbc.274.34.24124. [DOI] [PMC free article] [PubMed] [Google Scholar]
- 34.Leclerc GJ, Leclerc GM, Barredo JC. Real-time RT-PCR analysis of mRNA decay: half-life of Beta-actin mRNA in human leukemia CCRF-CEM and Nalm-6 cell lines. Cancer cell international. 2002;2:1. doi: 10.1186/1475-2867-2-1. [DOI] [PMC free article] [PubMed] [Google Scholar]
- 35.Hong SW, Kim S, Lee DK. The role of Bach2 in nucleic acid-triggered antiviral innate immune responses. Biochemical and biophysical research communications. 2008;365:426–432. doi: 10.1016/j.bbrc.2007.10.183. [DOI] [PubMed] [Google Scholar]
- 36.Lesniewski ML, Haviernik P, Weitzel RP, Kadereit S, Kozik MM, Fanning LR, Yang YC, Hegerfeldt Y, Finney MR, Ratajczak MZ, Greco N, Paul P, Maciejewski J, Laughlin MJ. Leukemia: official journal of the Leukemia Society of America. Vol. 22. Leukemia Research Fund; U.K: 2008. Regulation of IL-2 expression by transcription factor BACH2 in umbilical cord blood CD4+ T cells; pp. 2201–2207. [DOI] [PubMed] [Google Scholar]
- 37.Ochiai K, Muto A, Tanaka H, Takahashi S, Igarashi K. Regulation of the plasma cell transcription factor Blimp-1 gene by Bach2 and Bcl6. International immunology. 2008;20:453–460. doi: 10.1093/intimm/dxn005. [DOI] [PubMed] [Google Scholar]
- 38.Muto A, Ochiai K, Kimura Y, Itoh-Nakadai A, Calame KL, Ikebe D, Tashiro S, Igarashi K. Bach2 represses plasma cell gene regulatory network in B cells to promote antibody class switch. The EMBO journal. 2010;29:4048–4061. doi: 10.1038/emboj.2010.257. [DOI] [PMC free article] [PubMed] [Google Scholar]
- 39.Oyake T, Itoh K, Motohashi H, Hayashi N, Hoshino H, Nishizawa M, Yamamoto M, Igarashi K. Bach proteins belong to a novel family of BTB-basic leucine zipper transcription factors that interact with MafK and regulate transcription through the NF-E2 site. Molecular and cellular biology. 1996;16:6083–6095. doi: 10.1128/mcb.16.11.6083. [DOI] [PMC free article] [PubMed] [Google Scholar]
- 40.Huang da W, Sherman BT, Lempicki RA. Systematic and integrative analysis of large gene lists using DAVID bioinformatics resources. Nature protocols. 2009;4:44–57. doi: 10.1038/nprot.2008.211. [DOI] [PubMed] [Google Scholar]
- 41.Lee YW, Kuhn H, Hennig B, Neish AS, Toborek M. IL-4-induced oxidative stress upregulates VCAM-1 gene expression in human endothelial cells. Journal of molecular and cellular cardiology. 2001;33:83–94. doi: 10.1006/jmcc.2000.1278. [DOI] [PubMed] [Google Scholar]
- 42.Tashiro S, Muto A, Tanimoto K, Tsuchiya H, Suzuki H, Hoshino H, Yoshida M, Walter J, Igarashi K. Repression of PML Nuclear Body-Associated Transcription by Oxidative Stress-Activated Bach2. Molecular and cellular biology. 2004;24:3473–3484. doi: 10.1128/MCB.24.8.3473-3484.2004. [DOI] [PMC free article] [PubMed] [Google Scholar]
- 43.Nuez B, Michalovich D, Bygrave A, Ploemacher R, Grosveld F. Defective haematopoiesis in fetal liver resulting from inactivation of the EKLF gene. Nature. 1995;375:316–318. doi: 10.1038/375316a0. [DOI] [PubMed] [Google Scholar]
- 44.Garinis GA, Mitchell JR, Moorhouse MJ, Hanada K, de Waard H, Vandeputte D, Jans J, Brand K, Smid M, van der Spek PJ, Hoeijmakers JH, Kanaar R, van der Horst GT. Transcriptome analysis reveals cyclobutane pyrimidine dimers as a major source of UV-induced DNA breaks. The EMBO journal. 2005;24:3952–3962. doi: 10.1038/sj.emboj.7600849. [DOI] [PMC free article] [PubMed] [Google Scholar]
- 45.Pfaffl MW. A new mathematical model for relative quantification in real-time RT-PCR. Nucleic acids research. 2001;29:e45. doi: 10.1093/nar/29.9.e45. [DOI] [PMC free article] [PubMed] [Google Scholar]
Associated Data
This section collects any data citations, data availability statements, or supplementary materials included in this article.