

Abstract
Chronic lymphocytic leukemia (CLL) has heterogeneous clinical and biological behavior. Whole-genome and -exome sequencing has contributed to the characterization of the mutational spectrum of the disease, but the underlying transcriptional profile is still poorly understood. We have performed deep RNA sequencing in different subpopulations of normal B-lymphocytes and CLL cells from a cohort of 98 patients, and characterized the CLL transcriptional landscape with unprecedented resolution. We detected thousands of transcriptional elements differentially expressed between the CLL and normal B cells, including protein-coding genes, noncoding RNAs, and pseudogenes. Transposable elements are globally derepressed in CLL cells. In addition, two thousand genes—most of which are not differentially expressed—exhibit CLL-specific splicing patterns. Genes involved in metabolic pathways showed higher expression in CLL, while genes related to spliceosome, proteasome, and ribosome were among the most down-regulated in CLL. Clustering of the CLL samples according to RNA-seq derived gene expression levels unveiled two robust molecular subgroups, C1 and C2. C1/C2 subgroups and the mutational status of the immunoglobulin heavy variable (IGHV) region were the only independent variables in predicting time to treatment in a multivariate analysis with main clinico-biological features. This subdivision was validated in an independent cohort of patients monitored through DNA microarrays. Further analysis shows that B-cell receptor (BCR) activation in the microenvironment of the lymph node may be at the origin of the C1/C2 differences.
Chronic lymphocytic leukemia (CLL) is one of the most common leukemias among adults in the Western world (Zenz et al. 2009). The clinical evolution of the disease is very heterogeneous with a group of patients following an indolent course with no need for treatment during a long period, whilst others have a rapid aggressive evolution and short survival. These clinical differences have been mainly associated with two major molecular subtypes of the disease characterized respectively by high and low numbers of somatic mutations in the variable region of the immunoglobulin genes. Disease progression has been also associated with a number of genetic alterations that include cytogenetic abnormalities and specific gene mutations (TP53, NOTCH1, SF3B1) (Fabbri et al. 2011; Puente et al. 2011; Quesada et al. 2011; Wang et al. 2011; Oscier et al. 2012; Ramsay et al. 2013). However, the heterogeneity in the evolution of the patients is largely unexplained by these simple genetic events.
Genome-wide transcriptome analysis in cancer provides a global view of the expressed elements and networks that reshapes the biology of the normal cells in their transformation and progression to aggressive cancer cells. Microarray gene expression profiling studies have characterized gene signatures related to the different molecular subtypes of CLL and have identified individual genes or pathways related to the clinical and biological evolution of the disease (Klein et al. 2001; Rosenwald et al. 2001; Dühren-von Minden et al. 2012). However, the molecular mechanisms underlying the origin and progression of the disease remain mainly unknown. Here, we have characterized the CLL transcriptional landscape at high resolution by performing RNA-seq on a large cohort of CLL samples, for the majority of which whole-exome sequencing (Quesada et al. 2011) and high-density DNA methylation microarrays (Kulis et al. 2012) have been previously produced. The transcriptomic architecture of CLL that we uncover refines the molecular characterization of the disease and opens new avenues for the clinical management of patients.
Results
The gene expression landscape of CLL
Total poly(A)+ RNA was extracted from the CLL samples and sequenced using the Illumina HiSeq 2000 instrument. RNA was also extracted from three subtypes of normal B cells (naïve, memory IgM/IgD, and memory IgG/IgA), from three different healthy individuals, and sequenced in triplicates. In total, close to 6 billion 2 × 76-bp paired-end reads were obtained (see Methods sections “Patients and Samples” and “RNA Preparation, Sequencing, and Microarrays”; Supplemental Figs. S1, S2; Supplemental File 1), with a median number of 45M reads per sample. The reads were processed with the Grape pipeline (Knowles et al. 2013), being mapped to the human genome (hg19) with GEM (Marco-Sola et al. 2012), and used to quantify genes and transcripts annotated in the GENCODE gene set (Harrow et al. 2006) with the Flux Capacitor (Montgomery et al. 2010; http://flux.sammeth.net/index.html) (see Methods sections “Read Mapping and Processing” and “Gene, Transcript, and Exon Quantifications”). The transcriptome of 219 CLL patients, including 95 of the RNA-seq samples, was also analyzed using DNA microarrays. We found very high correlation between RNA-seq and microarray-based quantification of gene expression (CC ranged from 0.81 to 0.88), and between RNA and protein levels for ZAP70 and CD38 (known CLL markers), as previously determined for these samples (Quesada et al. 2011) (CC: 0.52 and 0.77, respectively) (Supplemental Fig. S3).
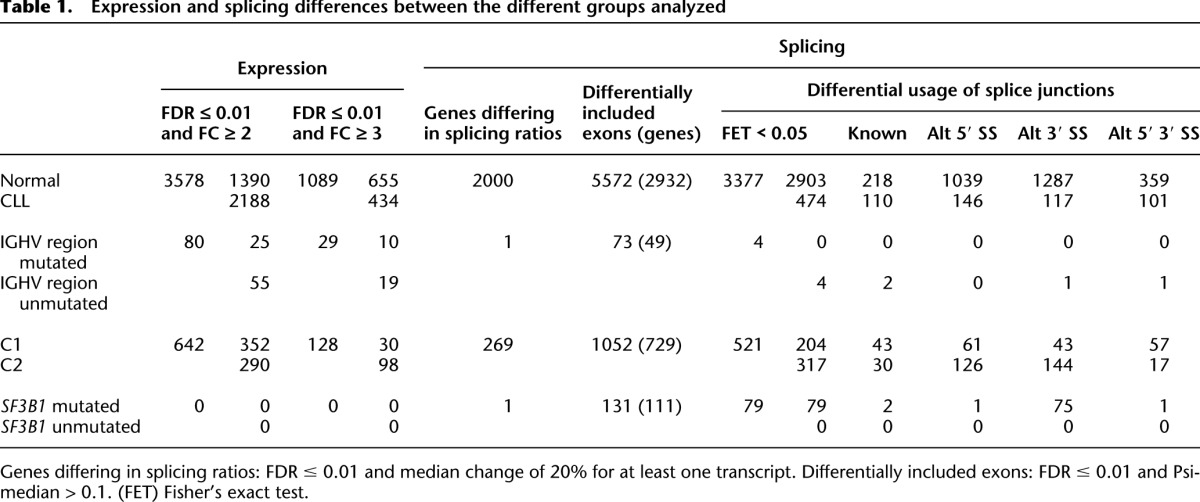
Across the whole genome, we found large transcriptional differences between normal lymphocytes and CLL cells. On average, we found 13.6% of the human genome covered by RNA-seq reads in CLL samples, while for normal cells the average was 10.5% (t-test mean coverage P = 1.8 × 10⁻⁸) (Supplemental Fig. S4). For comparison, this average is 12.7% across the cell lines investigated within the ENCODE Project (Djebali et al. 2012)—among which there are numerous cancer cell lines. At gene level, and under very stringent criteria (false discovery rate [FDR] <0.01 and median fold change >3; Methods, section “Expression Analysis”), we identified 1089 genes differentially expressed between normal and tumoral samples (Table 1; Supplemental File 2). The top differentially expressed genes are dominated by immunoglobulins, as expected due to the clonality of the CLL cells (Supplemental Fig. S5a). Pathway analyses showed that genes involved in metabolic pathways had higher expression in CLL, while genes related to spliceosome, proteasome, and ribosome were among the most down-regulated in CLL when compared with normal lymphocytes (Supplemental Fig. S5b). Among the pathways particularly enriched in CLL cells, we found the B-cell receptor (BCR), JAK-STAT signaling, and the cytosolic DNA-sensing pathways (Supplemental Fig. S6a). The BCR signaling pathway is a major regulator of the development, survival, and activation of B cells with direct implications for CLL pathogenesis (Dühren-von Minden et al. 2012). Among the genes in this pathway, the receptor FCGR2B, the signal initiation gene SYK and the signal propagation genes BTK and BLNK have a threefold up-regulation in CLL, whereas six genes from the NFKB family are highly down-regulated (Supplemental Fig. S6b).
Table 1.
Expression and splicing differences between the different groups analyzed
In addition to protein-coding genes, we identified 127 long noncoding RNAs (lncRNAs), including 47 lincRNAs, and 61 pseudogenes as differentially expressed between normal and CLL cells (Fig. 1A; Supplemental File 2). We specifically identified several pseudogenes with cognates involved in cancer control (Supplemental Table S1). For instance, CD24P4 has a corresponding protein-coding gene involved in the modulation of B-cell activation responses, and PSMD10P1 has a cognate proto-oncoprotein involved in the regulation of tumor suppressor genes. The two genes show high expression and have a fivefold overexpression in CLL. These results suggest a possible role for pseudogene expression in CLL pathogenesis, in line with recent findings for other malignancies (Poliseno et al. 2010).
Figure 1.

CLL transcriptional landscape. (A) Distribution of differentially expressed genes between tumor and normal samples according to their coding potential. (B) Normalized expression of transposable elements (TEs). Blue indicates low expression and red high expression, with some of the TEs differentially expressed highlighted. (C) Genes with condition-specific splicing ratios. Two of the genes with the most significant differences in the relative abundance of alternatively spliced isoforms between tumor and normal samples are shown. The boxplots correspond to the distribution of the relative abundances for each transcript (represented with a specific color) in the normal (left, N) and tumor (right, T) populations. The exonic structure of each transcript is represented using the same color scheme. (D) Allele-specific expression of somatic mutations. The relative expression of the reference allele, as derived from RNA-seq reads, was binned, and the number of cases in each bin plotted. The color gradient reflects the relative expression of the two alleles (the value that labels the bin in the x-axis).
Analysis of RNA-seq reads mapping to known transposable elements (TEs) revealed a general trend of derepression of TE transcription in CLL compared with normal cells (P = 0.0084) (Fig. 1B; Supplemental Fig. S19a; Methods, section “Transposable Elements”). Among TE classes, Human Endogenous Retroviruses show the most derepression in CLL compared with normal cells. This observation is consistent with the enhanced transcriptional activity of CLL samples.
Exome sequencing has been previously performed in 76 of the 98 cases analyzed here (Quesada et al. 2011). We used RNA-seq data to determine if any of the somatic mutations showed evidence for allelic imbalance favoring the expression of a given allele. Out of the 899 genomic positions with somatic mutations having potential functional impact, we detected expression in 342, of which 177 had enough sequence depth to carry out analysis of allele-specific expression (Methods, section “Allelic Imbalance”). We found an equal number of 19 genes with a significant bias toward the expression of the reference or the mutated allele (Fig. 1D). The genes with bias toward the expression of the mutated allele, among which we found ATM, TP53, TOPBP1, FANCD2, and PTPN1, are enriched in processes related to “response to ionizing radiation” (P = 0.0075) and “response to DNA damage stimulus” (P = 0.025).
The CLL samples analyzed included a similar number of IGHV region-mutated (n = 54) and IGHV region-unmutated (n = 41) cases. The number of genes differentially expressed between these two subtypes was similar to that observed in previous microarray expression studies (Klein et al. 2001; Rosenwald et al. 2001). Thus, at a very stringent threshold (FDR <0.01 and median fold change >3), we identified 29 such genes (80 genes at fold change >2), including lncRNAs and protein coding, 11 of which were also detected in these previous studies (Table 1; Supplemental Fig. S11; Supplemental File 2; Klein et al. 2001; Rosenwald et al. 2001). These results confirm that these two subtypes exhibit little differences in global expression patterns.
The splicing landscape of CLL
Cancer-specific splice forms are of major importance as they can be involved in the cause or development of the disease, and they can then be used as surrogate biomarkers (Pajares et al. 2007). We compared splicing patterns between CLL and normal samples at three different levels (Methods, sections “Gene, Transcript, and Exon Quantifications” and “Differential Splicing”; Table 1): (1) usage of splice junctions, (2) exon inclusion levels, and (3) relative abundances of transcript isoforms. For the latter, we used a method that we recently developed (Gonzalez-Porta et al. 2011), and identified 2000 genes with significant differences in the relative ratios of alternative splice isoforms between CLL and normal cells (Supplemental Fig. S7; Table 1; Supplemental File 3). Among these, we found several genes with well-known alternative isoforms as cancer biomarkers, including RAC1, CD44, and BCL2L1 (Pajares et al. 2007). The gene with the largest difference in splicing ratios, segregating almost perfectly CLL from normal B cells, is BCL2 (Fig. 1C). BCL2 has three known isoforms, two of which differ in the 5′ UTR while the third one lacks the terminal exon. This shorter form was almost exclusively expressed in normal cells, while CLL cells mostly expressed the longer isoforms. Many splicing regulators themselves, including SRSF1, an oncoprotein that is up-regulated in breast cancer and modulates apoptosis and proliferation (Anczukow et al. 2012), exhibited differential splicing between normal and CLL cells (Fig. 1C). Alterations in the BCR pathway were observed not only at expression but also at the splicing level. Splicing changes were identified in the signal modulator SYK, in signal propagation genes GAB1, PIK3AP1 (also known as BCAP), PIK3R1, AKT3, and in regulatory genes BCL2L1 and GSK3B, including both kinases and binding genes (Fig. 2A,B). In the particular case of SYK—a therapeutic target in CLL (Buchner et al. 2009; Quiroga et al. 2009) and for which alternative splicing has been shown to promote oncogenesis in other cancers (Prinos et al. 2011)—we observed that the transcript isoform that captures the largest fraction of overall gene expression in tumors (60%) (Supplemental Fig. S8) has an alternative downstream transcription start site and therefore an alternative promoter and 5′ UTR. The usage of this alternative transcript does not lead to change in the protein sequence, but it may have an effect in the transcript stability and transcription efficiency. This may contribute to understanding the biological mechanisms underlying the therapeutic behavior of SYK targets.
Figure 2.

Splicing changes in the BCR pathway between normal (N) and tumor (T) samples. (A) Partial view of the BCR signaling pathway with representation of genes with significant changes in alternative splicing. (B) Distribution of alternative splicing ratios between tumor and normal samples for three example genes in the BCR pathway highlighted in A. (C) ATM splicing in SF3B1-mutated samples. (Top left) Location of CLL-specific novel splice junction in the ATM gene. The novel 3′ splice site extends 20 bp upstream into the intron. Red dashed line indicates the truncation of the C-terminal end of ATM caused by the frame shift introduced by the novel splice site. (Bottom right) Expression levels of the putative and annotated junctions analyzed by qPCR. The log2 scale of the relative gene expression is represented for cases with SF3B1 mutation (dark gray), cases with ATM mutation and/or 11q deletion (dark gray), and cases without these genetic alterations. Light gray indicates unknown status.
Among the genes most recurrently mutated in CLL, we find the splicing factor SF3B1 (Quesada et al. 2011; Wang et al. 2011), which is also mutated in myelodysplasia (Papaemmanuil et al. 2011; Yoshida et al. 2011). In CLL, SF3B1 mutations are associated with faster disease progression and poor overall survival (Quesada et al. 2011). SF3B1 encodes a protein involved in the binding of the spliceosomal U2 snRNP to the branch point of 3′ splicing sites (Corrionero et al. 2011). The 98 CLL samples investigated here included nine in which SF3B1 was mutated. We detected 131 exons with significant differences in inclusion ratios between samples with and without mutations in SF3B1 (Table 1; Supplemental File 3). Most notably, we identified 79 splice junctions that were specific to tumors with SF3B1 mutations (Supplemental File 3). The vast majority of these (95%) corresponded to novel 3′ splice sites, consistent with the known molecular function of SF3B1. This is highly significant compared with a random control (see Methods section “Differential Splicing”), and in striking contrast with the proportion of novel 3′ splice sites among the junctions that are specific to other CLL partitions (Table 1). We then selected five potentially biologically relevant cases for independent validation, and in all of them quantitative PCR, followed by Sanger sequencing, confirmed the differential splicing inferred from RNA-seq (Supplemental Fig. S12). Gene-annotation enrichment analysis shows that genes with an alternative 3′ splice site specific to SF3B1-mutated cells are enriched for the “protein binding” function (P = 0.02). Among these, we found ATM, a master regulator of the DNA damage response pathways, which is frequently altered in CLL. The use of the alternative 3′ splice site generates a truncated protein lacking the 720 C-terminal amino acids, where the phosphatidylinositol-3 kinase domains are located. PCR analysis validated the enhanced expression of the putative splice junctions that lead to the truncated form of ATM in the SF3B1-mutated cells (Fig. 2C). We observed that SF3B1 mutations tend to be mutually exclusive with ATM mutations and 11q deletions (Fig. 2C), supporting the recently proposed connection between mutations in SF3B1 and ATM dysfunction (Wang et al. 2011; Raa et al. 2012). Other genes with altered splicing in SF3B1-mutated cells include the following: FCER2, a B-cell specific antigen that has an essential role in B-cell growth and differentiation; TEAD2, a transcription factor which plays a key role in the Hippo signaling pathway involved in organ size control and tumor suppression; TCIRG1, an immune regulator involved in normal T-cell activation; or TNIP1, a gene that plays a role in autoimmunity and tissue homeostasis through the regulation of nuclear factor kappa-B activation. In these four cases, the novel isoform introduces a premature stop codon leading to considerable truncation of the coding sequence (Supplemental Fig. S13). Truncation of the encoded protein by the introduction of premature stop codons is actually the most common outcome of splicing aberrations induced by SF3B1 mutations, affecting 90% of the cases. The estimated median size of the truncated product is 41% that of the wild-type protein. These results suggest that aberrant splicing in SF3B1 mutations is in most cases unlikely to lead to functional protein products.
In order to further understand the interplay between the splicing machinery and alternative splicing in CLL, we derived a composite cassette exon (CE)/RNA–binding protein (RBP) network. The final model aims to capture both, clusters of co-regulated exons in CLL as well as their putative regulators. Here, network reconstruction is based on the covariance of the expression of RBPs and alternative exon inclusion (see Methods). Community detection analysis is then used to identify distinct modules within the network topology (see Methods section “Splicing Networks”). Our analysis reveals a network comprised of four modules each with a distinct profile of exon inclusion across the CLL samples (Supplemental Fig. S9a,b). Enrichment analysis on the exons of modules 2, 3, and 4 shows that they are predominantly contained in genes coding for products targeted by phosphorylation in different cellular contexts and particularly during mitosis. These results suggest that aberrant splicing in CLL may impact phosphorylation dynamics that modulate signaling networks and control cell cycle progression. The network, in addition, highlights two cassette exon events in CCNL2 and CSDE1 as “hub” nodes in modules m1 and m2, respectively (Supplemental Fig. S9a,b). CCNL2 encodes a cyclin that induces cell cycle arrest, promotes apoptosis, and its overexpression has been shown to inhibit growth in several types of cancer (Zhuo et al. 2009). The affected cassette exon (chr1:1326677–1326955) resides in an untranslated gene portion and therefore does not affect the protein product but can potentially influence the transcriptional efficiency, stability, or translatability of the gene. CSDE1 (synonym upstream of NRAS, UNR) is an RBP that regulates translation and/or stability of different genes including those involved in tumorigenesis such as FOS, APAF1, MYC, and CDK11A (Mihailovich et al. 2010). Notably the CSDE1 exon that appears to be affected (chr1:115272879–115273043) is annotated as constitutive and codes for portions of the protein's cold shock domains (CSD) that affect CSDE1 affinity toward its targets (Triqueneaux et al. 1999). Interestingly, a known interactor of the CSDE1 target MYC, MYCBP2, also contains an exon in the same module as CSDE1.
Transcriptional chimeras in CLL
Gene fusions leading to chimeric proteins constitute an important mechanism that contributes to carcinogenesis (Mitelman et al. 2007). We used our RNA-seq data to identify potential CLL-specific RNA chimeras. Using a very stringent criterion based on read support (see Methods section “Chimeric Junctions”; Supplemental File 5), we identified 122 chimeric junctions present in CLL cells, but not in normal B cells. At this stringent filtering, 65% of the junctions appear only in one tumor sample, but can also be detected in other samples with lower read support. Twenty-six junctions are found between two immunoglobulin genes and 48 junctions connect two protein-coding genes (42 unique pairs of genes). Of these, only six junctions were inter-chromosomal and the remaining had a median distance between the two ends of the junctions of 21 kb (average 63 kb, maximum distance of 1.2 Mb). Given the genomic proximity of the genes connected in the chimera and the fact that the majority (98%) is transcribed in the same direction, many of them are likely to correspond to read-through transcriptional events. This type of event has already been linked to other cancers (Maher et al. 2009; Berger et al. 2010). Given its read support and specificity in CLL samples, we found of particular interest two chimeras, which we selected for further experimental validation by PCR and Sanger sequencing. The FCRL2–FCRL3 chimeric junction is present in 11 CLL samples and joins the exon 7 of FCRL2 to the second exon of the 5′ UTR of FCRL3 (Fig. 3). These are two genes from the immunoglobulin receptor superfamily, which have predictive value for determining clinical progression in CLL (Li et al. 2008). The chimeric sequence introduces a premature stop codon, which leads to the loss of several of the FCRL3 immunoglobulin domains. The second chimera joins GAB1 and SMARCA5 (Fig. 3). GAB1 (also called GRB2) is an adaptor protein involved in intracellular signaling pathways including the BCR pathway. Its functions are involved in cellular growth, transformation, and apoptosis. SMARCA5 belongs to the SWI/SNF family of proteins involved in chromatin remodeling and has an important role in the repair of double-strand breaks (Smeenk et al. 2013). The chimera joins the terminal protein-coding exon of GAB1 with the first coding exon of SMARCA5, generating an ORF that conserves almost the entire protein sequences of the two genes (Fig. 3). We detected this chimera in six CLL samples. In both chimeras, we tested five CLL samples containing the predicted chimera, and five CLL samples in which the chimera has not been predicted. In both cases, four out of the five RNA-seq positive cases were strongly validated by Sanger sequencing (Fig. 3A), and only one of the negative FCRL2–FCRL3 cases and two of the negative GAB1–SMARCA5 produced a very weak signal (Supplemental Fig. S10a,b). Recently, Velusamy and colleagues have reported a recurrent and reciprocal chimera between YPEL5 and PPP1CB genes (Velusamy et al. 2013). This recurrence was reported to be as high as 95% of the CLL samples but negative in normal samples using qPCR. We have detected this chimera both in normal and cancer samples, but it did not reach our required minimal read support (see Supplemental File 5). We also analyzed other cancer studies where chimeric genes have been reported. In our full set of chimeric junctions (see Methods section “Chimeric junctions”) we found five chimeric read-through events previously identified, LAMTOR1–ANAPC15 and PTPRG–C3orf14 in melanoma (Berger et al. 2010), TATDN1–MTSS1 and MAP2K7–SNAPC2 in CLL (Velusamy et al. 2013), and TTTY15–USP9Y found in prostate cancer and experimentally validated (Ren et al. 2012). Only the latter showed CLL specificity (see Fig. 3). The detection of transcriptional chimeras in normal samples could simply reflect that a basal level of inconsequential transcriptional read-through naturally exists in normal cells. The increased expression of the underlying genes in altered conditions may result in an even larger increase in the expression of the chimeric isoforms, which may then reach physiologically relevant levels. Indeed, FCRL2, FCRL3, GAB1 are highly up-regulated in CLL (fold change of 4.89, 6.7, and 19.4, respectively). The passenger nature of such transcriptional read-through events in normal cells may then become functionally relevant in the altered cells.
Figure 3.

Chimeric junctions between FCRL2–FCRL3 and GAB1–SMARCA5. (A) Schematic representation of the chimeric genes, associated ORFs, and junction sequences. (Top) Black boxes represent exons skipped by the chimeric junction. ORFs in the three possible frames are indicated in yellow. (Bottom) Sanger sequencing for the junction part of each chimera. The number in the square corresponds to the CLL sequenced sample. (B) Number of split-mapped (single reads split and mapped independently) and paired-end (two single reads from both ends of the same fragment) reads supporting the two chimeras and six previously described cases. TTTY15–USP9Y is reported twice because of the presence of two distinct fusion points. We should note that, although split-mapped and paired-end reads are shown separately, each chimera is supported by a combination of both.
Identification of two major transcriptional CLL subgroups
Hierarchical clustering of the RNA-seq samples according to gene expression of protein-coding and long noncoding genes clearly separated normal lymphocytes from tumor samples (Fig. 4A). The expression profile of the different subtypes of normal lymphocytes was relatively homogeneous. However, within the CLL samples the clustering revealed two large, strongly defined subgroups, which were independent of the IGHV gene region's mutational status (Fig. 4A). Consensus clustering, multidimensional scaling, and principal component analysis supported the partition of the CLL samples in these two groups, to which we refer as C1 and C2 (Fig. 4B,C; see Methods section “Cluster Robustness”). Based on the hierarchical clustering, we assigned each CLL sample to one of these subgroups (Supplemental Table S3). The hierarchical clustering of 95 of these cases based on microarray expression data reproduced the RNA-seq-derived classification (95% agreement) (Supplemental Fig. S14). To further corroborate this basic molecular subdivision of CLL, we performed consensus clustering and Gene Set Enrichment analyses (GSEA) using C1- and C2-specific signatures (Supplemental File 4; see Methods section “Cluster Robustness”) in microarray gene expression data from an independent series of 124 CLL patients, as well as from three previously published data sets (including 60 CLL patients from Italy, 68 from the United States, and 107 from Germany) (Fabris et al. 2008; Friedman et al. 2009; Herold et al. 2011). In all these cases, we found strong support for the previously unreported CLL C1/C2 subdivision (Fig. 4D,E; Supplemental Figs. S15, S16).
Figure 4.
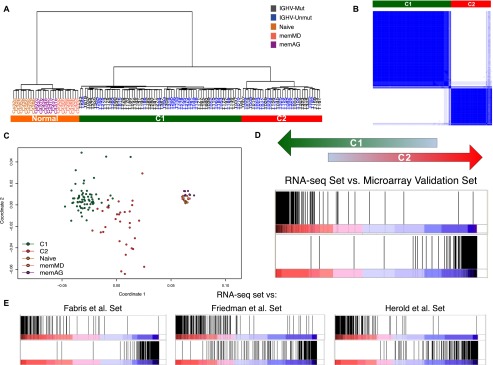
Major transcriptional CLL subgroups. (A) Clustering of CLL and normal samples. Dendrogram obtained by hierarchical clustering of CLL and normal samples. (B) Consensus cluster. The matrix shows a clear and robust separation between CLL samples in C1 and C2. Dark blue regions indicate cluster partitions for samples that always cluster together (high consensus) and white indicate partitions with low consensus. (C) Multidimensional scaling of CLL and normal samples according to gene expression. (D) Enrichment score plot by GSEA comparing the RNA-seq based clustering with the clustering of an independent set of 124 samples, profiled with expression arrays. The plot compares the ranking correlation of the list of genes from the two clustering solutions. The vertical dark lines indicate where the genes in one list appear in the other ranked list of genes. An accumulation at the extremes indicates an agreement between the two lists. (E) Enrichment score plot by GSEA comparing the clustering in the RNA-seq and the previously published data sets. The three previously published data sets (Fabris et al. 2008; Friedman et al. 2009; Herold et al. 2011) contained 60, 40, and 106 samples, respectively.
We performed bioinformatics analyses to investigate the molecular signatures and pathways underlying the C1/C2 groups (see Methods section “Functional and Gene-Set Enrichment Analysis”). We found that these molecular signatures were independent of, and stronger than, those underlying the IGHV region's mutational subtypes. Indeed, 5% of the variability in gene expression observed across all samples can be attributed to the C1/C2 status, compared with only 1.5% to IGHV region mutational status. At FDR <0.01 and a median fold change >3, we identified 128 genes differentially expressed between C2 and C1 (642 genes at fold change >2), of which 16 are lncRNAs, 98 at higher levels in C2 and 30 in C1 (Table 1; Supplemental Fig. S17; Supplemental File 2). C1 samples also exhibit higher expression of some transposable elements (Supplemental Fig. S19). Differentially expressed genes between C1 and C2 are related preferentially to a few pathways and cell processes (Supplemental Fig. S20). Genes involved in RNA splicing and mRNA transport are overexpressed in C2 (Supplemental Fig. S21; Table 1). A significant proportion of differentially expressed genes (16 out of 128, 12%, FDR = 5.5 × 10⁻⁷) belong to the MAPK/ERK signaling pathway, all of which are up-regulated in the C2 samples (Supplemental Fig. S22). C2 samples also show high expression of many members of the AP1 transcription factor family, including FOS and JUN, with the targets of these two genes having clear differential expression patterns between C1 and C2 (Supplemental Fig. S23).
We find also more differences in splicing patterns between the C1 and C2 subgroups than between the IGHV region-mutated and -unmutated subgroups, with C2 samples exhibiting a larger number of splicing alterations than C1 (Table 1; Supplemental Fig. S18). Notably, we found 204 splice junctions specific to C1 samples and 317 to C2 samples. SF3B1 mutations are more frequent in C2 (six samples, 20%) than in C1 samples (three samples, 4.7%, Fisher's exact test P = 0.027). Although only one of the differentially included junctions between SF3B1-mutated and -unmutated samples is also differentially included between C1 and C2 samples, 38 exons (corresponding to 33 genes) are differentially included both between SF3B1-mutated and -unmutated samples and between C1 and C2 samples. As with gene expression, protein kinases are also enriched among the genes with differential splice site usage, including MAPK1 and JAK1 (which were confirmed by qPCR) (Supplemental Fig. S12).
Among the modules that arise from the splicing networks previously described (section “The Splicing Landscape of CLL”), module 1 is the one showing the sharpest differences between C1 and C2 samples. This module contains four of the top 20 RNA processing genes identified as differentially expressed between C1 and C2 (Supplemental Fig. S9c). These include three genes overexpressed in C2 (WBP11, BCAS2, and RBM16) and one overexpressed in C1 (RNPC3).
Using microarray methylation data (Kulis et al. 2012) that match 85 of our CLL RNA-seq samples, we analyzed the methylation patterns among the genes differentially expressed between C1 and C2 (see Methods section “Methylation Analysis”). We did not find a general pattern of differential methylation in C1 and C2 cells, neither in the promoters or the gene bodies. We found, however, that the promoters of genes differentially expressed between C1 and C2 are significantly hypomethylated (P < 2.2 × 10⁻¹⁶) compared with non-differentially expressed genes (Supplemental Fig. S24). The promoters of these genes are always hypomethylated, irrespective of the C1/C2 subgroup to which they belong.
We found, after analyzing the expression data of the samples collected by Herishanu et al. (2011), that many genes that are differentially expressed between C1 and C2 are also differentially expressed between peripheral blood and the lymph node of CLL patients. GSEA yielded a very significant enrichment between the two sets of differentially expressed genes (Supplemental Fig. S25a). Indeed, we found 194 differentially expressed genes between peripheral blood and lymph node (a number and a set of genes similar to those previously reported by the authors; see Methods section “Expression Analysis”). Forty of these genes are also differentially expressed between C1 and C2. Strikingly, all of them are simultaneously up-regulated in C2 and in the lymph node. Among genes with similar up-regulation in these two groups we find genes with transcription regulation activity (FOS, FOSB, JUN, JUNB, EGR1/2, KLF4/6/10, NR4A2, SIK1), genes involved in cell–cell signaling (CCL3/4/5, TNFAIP3, NAMPT, CXCR5, IL8/1B/4R), and genes that promote a response to an organic substance (CD83, DNAJB1, CCL5, DUSP1/4, EGR1/2, JUN, JUNB, FOS, NR4A2, PPP1R15A, HSPA1B). This seems to indicate that the differences between C1 and C2 originate from a series of molecular signals that occur at the cell surface and that lead to a downstream change in regulation of transcription. We also found that genes differentially expressed in cells with and without BCR stimulation, which occurs in the lymph node, are highly overrepresented among up-regulated genes in C2. This was confirmed with data from two studies (Guarini et al. 2008; Herishanu et al. 2011) through the analysis of gene overlap (Hypergeometric test P = 1.0 × 10⁻³⁰) and GSEA (Supplemental Fig. S25b,c). Additionally, we used an interaction network that captures transcriptional and post-translational molecular interactions in human B cells (Lefebvre et al. 2010; Methods, section “Interaction Network”). We selected the subnetwork that contains the C1/C2 differentially expressed genes and highlight it according to the direction and intensity of the gene expression. While maintaining the same subnetwork, this was repeated for the lymph node versus peripheral blood signatures (Herishanu et al. 2011). The two networks (Supplemental Fig. S26) show a very similar pattern in the direction of gene up-regulation, confirming the previous results. Due to their higher connectivity and centrality, JUN, JUNB, JUND, FOSB, NFE2L2, and NR4A2 are the most influential genes in the subnetworks. Of notice, there are changes in several genes of the DUSP family (DUPS1/2/4) involved in signal transduction and major regulators of the MAPK signaling pathway, which may explain the large differences in expression between C1 and C2 in this pathway. Taken together, these results suggest that the activation of the B-cell receptor of CLL cells in the lymph node microenvironment might induce significant downstream gene expression changes leading to the C2 gene expression phenotype.
Clinical relevance of C1 and C2 CLL groups
To assess the clinical impact of the C1/C2 classification, we analyzed clinical and biological variables in 91 patients with available data at the time of sampling (Supplemental Table S2). C2 patients had a higher frequency (27%, compared with 9% in C1) of mutations in genes related to adverse outcome (NOTCH1 and SF3B1), and were more likely to be in the advanced Binet stage (Fig. 5A; Supplemental Table S4). In addition, these patients had more frequently active disease with need for therapy, and showed a significantly shorter time to treatment (TTT) than C1 patients, both in the whole series (Supplemental Fig. S27A; Supplemental Table S4) and in the subset of patients in stages A and B (Fig. 5B). Other variables significantly associated with shorter TTT in this cohort were advanced stage at sampling, unmutated IGHV region (Supplemental Fig. S27B,C), high ZAP70 and high CD38 expression, and presence of mutations in either NOTCH1 or SF3B1. However, multivariate analysis, performed in patients in stages A and B including these variables, identified only C1/C2 clustering (Hazard ratio [HR]: 3.73; 95% interval of confidence [IC]: 1.8–7.7; P < 0.001) and IGHV region mutational status (HR: 2.7; 95% IC: 1.3–5.6; P = 0.006) as the relevant variables associated with TTT. No significant relationship was observed between C1/C2 clustering and response to therapy or overall survival (Supplemental Fig. S27D).
Figure 5.
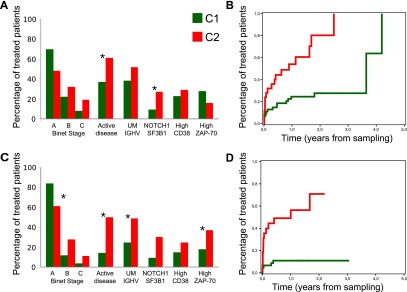
Clinical behavior of the C1 (green) and C2 (red) subgroups. (A) Distribution of clinico-biological features in the RNA-seq profiled patients. (B) Time to treatment in the RNA-seq profiled patients at Binet stages A and B. (C) Distribution of clinico-biological features in the microarray profiled patients from the independent validation series. (D) Time to treatment in the microarray-profiled patients from the independent validation series at Binet stages A and B.
We confirmed the clinical impact of the C1/C2 clustering in an independent cohort of 110 patients with available data at time of sampling using microarray expression profiling. The clinical impact of C1/C2 groups was virtually identical in this validation series and in the original RNA-seq series (Fig. 5C,D; Supplemental Fig. S27E–H; Supplemental Table S4). Concordantly, multivariate analysis confirmed that C1/C2 clustering and IGHV region mutational status were the only significant variables associated with TTT. The contribution of these two variables to TTT seems to be of similar importance (Supplemental Fig. S27A,B,E,F) and essentially orthogonal. The C1/C2 molecular subdivision adds, therefore, additional resolution to the CLL prognosis. Indeed, C1/IGHV region-mutated patients exhibit the most favorable outcome, while C2/IGHV region-unmutated ones have the poorest outcome (Supplemental Fig. S27C,G).
Discussion
The work here presented underscores the relevance of deep RNA sequencing in cancer research. Through RNA-seq it is possible to define global transcriptome signatures that are not restricted to gene expression patterns, and that lead therefore to a molecular characterization of the disease at higher resolution. Indeed, in addition to identifying hundreds of protein-coding genes differentially expressed between CLL and normal B cells, we have characterized the status of other transcriptional elements, such as transposable elements (TEs), lncRNAs, and pseudogenes—all of which are typically invisible to DNA microarrays. We have found a general trend of deregulation of TEs in CLL cells. Reactivation of repeat DNA has previously been observed in mouse pancreatic cancers (Ting et al. 2011), while LINE-1 reactivation has been observed in developing mammalian neural stem cells (Coufal et al. 2009). Also consistent with recent findings (Poliseno et al. 2010), we have identified several differentially expressed pseudogenes with cognates involved in cancer control (Supplemental Table S1), suggestive of a role for pseudogene expression in CLL pathogenesis. Due to the increased resolution of RNA-seq, we have also identified genes with significantly different splicing patterns—defined as the relative ratios of the gene's splice forms—between CLL and normal B cells. Notably, the splicing pattern of BCL2 segregates almost perfectly the populations of CLL and normal B cells, and it could thus be potentially used as a surrogate marker for the disease.
By using RNA-seq, we have also been able to explore in greater detail the splicing effects of mutations of SF3B1. As expected from the known biological role of this gene, the vast majority (95%) of splicing changes associated with SF3B1 mutations correspond to the activation of cryptic 3′ splice sites. Among the genes with alternative 3′ splice sites specific to SF3B1-mutated cells, we found ATM. The association between SF3B1 mutations and the 11q deletions observed in CLL (Wang et al. 2011; Raa et al. 2012) suggest that these two genetic events may cooperate to inactivate ATM in this disease by deletions of one allele and the generation of an anomalous truncating transcript induced by the SF3B1 mutation in the other.
Analysis at the level of individual transcript isoform reveals that many of the pathways that are altered in the disease are affected not only by changes in the expression of key genes in the pathway, but also changes in the relative proportion of the alternative splice isoforms produced by each gene. This is, for instance, the case of the BCR pathway where alterations of the relative expression of splicing isoforms can be detected in several important genes in the pathway. An example of such genes is for instance SYK, a mediator of BCR signaling pathway and a potential drug target in CLL (Buchner et al. 2009; Quiroga et al. 2009). By using RNA-seq, we have also been able to quantify the alternative usage of transcription initiation sites by this gene in CLL and normal cells—which could provide important information to understand the therapeutic role of this gene.
Based on RNA-seq quantifications of gene expression, we have uncovered two major transcriptional subgroups in CLL, which are independent of IGHV region mutational status, and to which we refer as C1 and C2. Strikingly, these two transcriptional groups have not been previously reported, which could be due to the fact that most CLL transcriptome surveys have focused on the analysis and comparison of well-known and established disease groups, such as those defined by the IGHV region's mutational status of the CLL tumors. Moreover, the increased size of the cohort used in our study, which includes 98 patients monitored by RNA-seq, and 124 additional patients monitored by microarrays, as well as the availability of rich and well-curated clinical annotations, has provided us with additional statistical power. In any case, the C1/C2 subgroups are very robust, and can be replicated in independent cohorts of patients—both previously published and monitored by us. The two subgroups have markedly different clinical outcome, with C2 patients having a more aggressive disease. The differential clinical outcome of C1/C2, which we validated in the independent cohort, is orthogonal to IGHV region mutational status, and adds therefore a new layer of resolution to CLL prognosis. C1/IGHV region-mutated patients exhibit the most favorable outcome, while C2/IGHV region-unmutated ones have the poorest one. This may suggest alternative therapeutic strategies depending on the C1/C2 status of patients.
The two groups have specific transcriptional signatures that are stronger than those from the classical IGHV region-mutated and -unmutated subtypes. C2 cells show overall higher transcriptional complexity than C1 cells. They overexpress a larger number of genes, and exhibit a larger number of splicing alterations with the up-regulation of genes involved in RNA splicing and mRNA transport. C2 shares many of the genes and pathways up-regulated in the CLL cells obtained from the lymph node (Herishanu et al. 2011), suggesting that the lymph node microenvironment may be influencing the differences in gene expression observed in C1 and C2 CLL subtypes. Among the pathways differentially expressed between C1 and C2, the MAPK/ERK signaling pathway appears to be the most affected one. Indeed, 12% of all genes differentially expressed between C1 and C2 belong to this pathway, all of which are up-regulated in the C2 cells. There is also a significant enrichment of genes that are up-regulated after BCR stimulation by IgM antigen (Guarini et al. 2008; Herishanu et al. 2011) among C2 up-regulated genes. These results suggest that C2 cells show a pattern in expression changes similar to those cells that are under direct BCR activation in the microenvironment of the lymph node. This pattern may explain the faster disease progression observed in C2, since as pointed out in Herishanu et al. (2011) antigen-dependent BCR activation has been shown to accelerate disease progression in a mouse lymphoma model (Refaeli et al. 2008). Figure 6 highlights some of the genes possibly involved in the complex cellular and molecular interactions of CLL cells and the lymphoid tissue microenvironment (Burger and Gandhi 2009). The enrichment in the MAPK signaling pathway is consistent with the recent work by Chuang et al. (2012). These authors identify gene co-expression subnetworks that are associated with disease progression. In one of these subnetworks, genes in the MAPK signaling pathway have higher expression levels in patients at early stages of the disease. We found no overlap, however, between the genes differentially expressed in C1/C2 in the MAPK signaling pathway and the genes found by Chuang and colleagues in their subnetwork, suggesting that different parts of this pathway are altered at different stages during the development of the disease.
Figure 6.

Interaction of CLL cells and the lymph node microenvironment. Stimulation of the BCR complex and other receptor and cell surface genes (CD79B, CD22, CD83, FCRG2B) leads to downstream changes in regulation. Affected genes such as those of the DUSP family, involved in the regulation of the MAPK pathway, may explain transcriptional differences observed for this pathway. Up-regulation of transcriptional regulators, like FOS and JUN, may trigger proliferation and inflammation processes that could be at the origin of C2 cells. Other genes involved in cell–cell signaling are also up-regulated in C2.
In summary, we have monitored here with unprecedented resolution the CLL transcriptome. Our work has revealed new insights into the molecular pathogenesis of CLL, and has led to the discovery of new molecular subtypes of this disease with potential clinical implications.
Methods
Patients and samples
Tumor CLL cells from 98 patients were separated from non-tumor cells by immunomagnetic depletion of T cells, NK cells, monocytes, and granulocytes (Supplemental Material). Tumor cell purity was ≥95%. Normal B-cell subsets were obtained from healthy donors and purified with immunomagnetic selection. The studies were approved by the institutional review board (IRB) of Hospital Clinic (Barcelona, Spain). All subjects included in the initial RNA-seq study gave informed consent for their participation according to the International Cancer Genome Consortium (ICGC) guidelines, and the subjects in the mutational screening and clinical validation analysis agreed to IRB-approved informed consent for genetic studies. Detailed information about the collection and processing of samples is provided in the Supplemental Material.
RNA preparation, sequencing, and microarrays
Total RNA was extracted with TRIzol reagent (Invitrogen) following the recommendations of the manufacturer. RNA integrity was examined with the Bioanalyzer 2100 (Agilent). High-quality RNA samples were sequenced and hybridized to microarrays. For sequencing, the RNA-seq libraries were prepared according to the standard Illumina protocol with the mRNA-seq Illumina TruSeq. cDNA libraries were checked for quality and quantified using the DNA-1000 kit (Agilent) on a 2100 Bioanalyzer. Each library was sequenced with the Illumina Sequencing Kit v4 on one lane of a HiSeq 2000 sequencer to obtain 76-bp paired-end reads. Affymetrix Human Genome Array U219 array plates were hybridized with high-quality RNA samples. Expression Console software (Affymetrix) was used to generate summarized expression values using the Robust Multiarray Average (RMA).
Read mapping and processing
RNA-seq data sets were processed with the Grape pipeline (Knowles et al. 2013; big.crg.cat/services/grape). The 76-bp paired-end reads were mapped to the genome version hg19 and to an exon-junction database derived from the annotation (GENCODE v7 [Harrow et al. 2006]), with a maximum of two mismatches using GEM (Marco-Sola et al. 2012). Unmapped reads were further split-mapped, to allow the discovery of novel splice junctions.
Gene, transcript, and exon quantifications
Uniquely genomic and split-mapped reads were used to quantify expression levels for genes, transcripts, and exons. These are provided as RPKM values (Mortazavi et al. 2008). Exon expression values are computed by considering all reads mapping to the exon. Gene expression values are computed by considering all reads mapping to the exons in the gene. Individual transcript abundances are computed using the Flux Capacitor program (Montgomery et al. 2010; http://flux.sammeth.net/index.html). Based on the density function of the reads along the transcripts, this method is able to de-convolute the contribution of each transcript to the overall gene expression and to estimate their original abundances. It does this by building—from the reference annotation—splicing graphs where reads are mapped to corresponding edges in these graphs according to the position at which they align in the genomic sequence. The resulting graph with edges labeled by the number of reads can be interpreted as a flow network, where each transcript represents a transportation path from its start to end. Consequently, each edge is possibly a shared segment of transportation, along which a certain number of reads per nucleotide—i.e., a flux—is observed.
Expression analysis
The statistical environment R was used to perform statistical analysis. For RNA-seq, RPKM values were converted to log2 scale. Hierarchical clustering was performed using the Ward method and the distance 1-r, where r is the Pearson correlation coefficient. Genes from the Y chromosome were not considered. Multidimensional scaling (MDS) analysis was performed using the isoMDS package and the same distance. Differential gene expression analysis was done using the non-parametric Wilcoxon rank sum test, with Benjamini-Hochberg (BH) adjustment, and a fold change difference between the medians, with added pseudo-counts, of the two groups. Genes with FDR <0.01 and a fold change of 2 or 3 were considered significantly expressed. RPKM values were compared with microarray expression levels, where the expression of each gene was derived as the average value of all the probes in the gene. The Spearman and Pearson correlation was obtained across the 95 samples from which RNA-seq and microarray data were available. Microarray differential expression analysis was done with the SAM algorithm using the BRB-tool application (Simon et al. 2007). Differences in gene expression were considered significant if they were in the 99th percentile FDR and had a fold change ≥2. All the data sets (Fabris et al. 2008; Friedman et al. 2009; Herishanu et al. 2011; Herold et al. 2011) were normalized independently, using fRMA (McCall and Irizarry 2011).
Transposable elements
We obtained all the known human TE sequences as provided in Repbase (Jurka et al. 2005) as of February 2012. Due to issues of multiple mapping, we manually filtered the two large families of TEs, Alu, and LINE-1 to remove all but one member of each family. Annotated poly(A) sequences at the 3′ end of Alu were trimmed, and any unknown nucleotides deleted. We then mapped all the reads by trimming them to the first 25 nucleotides and aligning with up to three mismatches. Reads with a single best mapping to one of the TE sequences were considered. The numbers of reads mapping to each TE were counted and the expression value of each TE class was normalized by the total number of mapped reads.
Allelic imbalance
A set of 899 point mutations, corresponding to substitutions, among the 1247 somatic mutations reported in Quesada et al. (2011) could be analyzed in the 76 samples common to the two studies. Allele frequencies were obtained by aligning the reads across the mutation and counting the number of reads that support either the reference or the mutation allele. To avoid mapping bias toward the reference allele, two mapping indices with the reference and the mutation alleles were created and reads mapped with up to two mismatches. Only reads where the nucleotide that matches the somatic mutation has a minimum quality of 20 and is found before the last 6 bp were considered. From the exome sequencing data we also obtained the number of reads that map to the mutation and how many of those reads support the reference allele. Only cases with ≥10 reads were considered for the allele frequency analysis. To test for a bias toward the expression of the reference or the mutation allele we applied a Fisher's exact test between the total read count and the number of reads supporting the reference allele in the exome and RNA-seq data. Cases with an FDR <0.05 were considered significant.
Differential splicing
Differential exon inclusion was obtained using the Percentage Splicing Index (PSI) as previously defined (Wang et al. 2008; Shapiro et al. 2011). This index reflects the inclusion level of the exon and is defined as PSI = #inclusion_reads/(#inclusion_reads + #exclusion_reads); Inclusion reads correspond to the reads that fall in the exon region (a), plus the reads that support the exon junctions (b). Exclusion reads are those split-reads that skip the exon (c). For each sample, we require a minimum of 10 reads, a minimum exon length of 150 bp, and the exon to have detectable expression in at least 50% of the samples of each group (final set of 120,596). Significant differences were considered for FDR < 0.01 (Wilcoxon test + BH adjustment) and absolute difference in PSI medians of the groups ≥0.1. A splice-junction event was considered to be present in a sample if it has a read density >3/msms, where msms is the median number of split-mapped reads in all tumor samples. To determine differential event usage, a contingency table with the number of samples from each group where the event is present was created and a Fisher's exact test with BH correction is applied, with events in differentially expressed genes excluded. As a control for the specificity of the junctions, a randomization procedure (n = 1000) on the samples where the junctions occur was performed. This procedure consists of the permutation of the samples by keeping fixed the number of occurrences of the junction. Exon annotation was then used to classify the events as annotated, alternative 5′ SS or 3′ SS or novel. Differences in the patterns of alternative splicing between two groups were identified using the previously described method (Gonzalez-Porta et al. 2011). Genes with two or more transcripts and RPKM of 1 in at least one sample in each group were selected. Genes with FDR < 0.01 and a maximum difference in the splicing ratios between the two groups of at least 20% were considered significant.
Splicing networks
The starting point for network reconstruction is the quantifications of gene expression for a collection of 689 RBPs and of the inclusion values of all internal exons according to annotation. After removal of sparse variables (fraction of NA values >0.5) missing values in each set were filled in using k-nearest-neighbor-based imputation (k = 10). Next, variables invariable in CLL samples or highly variable in B-cell samples are discarded in order to reduce noise and extraneous variables unrelated to CLL pathology. The variables are then scaled and a robust-estimate of sample covariance is obtained based on the FAST-Minimum Covariance Determinant (MCD) estimator (R package mvoutlier). In order to minimize redundancies in the final covariance matrix, only one representative event is retained from sets of highly correlated variables originating from the same transcription unit. Network reconstruction is based on the graphical Lasso (gLasso) algorithm for sparse graphical model selection (Friedman et al. 2008). gLasso estimates a sparse covariance matrix by optimizing the log-likelihood function:  , where Θ is an estimate for the inverse covariance matrix Σ−1, S is the empirical covariance matrix of the data,
  1 is the Θ L1 norm, and r is a regularization parameter. Here we set r = 0.7 and constrain all gene-to-gene entries of Θ to zero in order to focus on exon-to-exon or RBP-to-exons connections. Nonzero entries in Θ directly correspond to the edges of the network. Module detection on the reconstructed network is based on maximizing the network's modularity using the greedy community detection algorithm developed in Clauset et al. (2004).
Chimeric junctions
Single reads that do not map to the genome or the transcriptome were further split-mapped to the genome allowing inter-chromosomal mappings. Chimeric junctions (Supplemental File 5) were defined using two different filtering criteria: (1) junctions supported in each sample by at least three unique staggered single split-mapping reads where both tumor and normal samples are considered. This yielded a total of 2031 chimeric junctions; (2) junctions that, for each sample, are supported by at least three unique staggered single split-mapping reads and three unique paired-end reads in the same sample. Additionally, only junctions specific of tumor samples and that connect protein-coding genes were considered. The occurrence of a chimera in a sample is only considered if the minimum number of three supporting reads is achieved for that sample. To eliminate possible errors in gene structure annotation, all the cases were verified in the recent GENCODE v13.
Cluster robustness
The robustness of C1/C2 clustering was confirmed using three different approaches: (1) consensus clustering (Monti et al. 2003; Reich et al. 2006; Wilkerson and Hayes 2010), to assess the stability of the clusters. The method was applied to the gene expression matrices for the RNA-seq and microarray data sets in this study and three previously published data sets (Fabris et al. 2008; Friedman et al. 2009; Herold et al. 2011); (2) Centroid Validation, where the in-group proportion (IGP) (Kapp and Tibshirani 2007) measure implemented in the clusterRepro package was applied to the independent data set of 124 microarray samples using the RNA-seq data set to define the centroids; (3) gene signature correlation between data sets, where GSEA (Subramanian et al. 2005) was applied to quantify the enrichment of the genes differentially expressed in the published data sets (Fabris et al. 2008; Friedman et al. 2009; Herold et al. 2011) with the list of genes defined a priori by the RNA-seq data set.
Functional and gene-set enrichment analysis
Functional enrichment analysis was performed with the DAVID (Huang da et al. 2009) server, BioProfiling.de tools (Antonov 2011), with SLEA (Gundem and Lopez-Bigas 2012) using Gitools (Perez-Llamas and Lopez-Bigas 2011) and the GSEA (Subramanian et al. 2005) tool.
Methylation analysis
We used the methylation data set of Kulis et al. (2012) obtained by Infinium HumanMethylation450 BeadChip microarrays, available online at https://www.ebi.ac.uk/ega/datasets/EGAD00010000254, and included the samples of the data set for which we have both methylation and gene expression data in our analyses. We used all probes of the methylation microarrays that passed quality control in the study of Kulis et al. (2012) and are located in gene promoter regions. We calculated mean methylation values per probe using beta values for four different subsets of samples altogether: (1) M-CLL and C1, (2) U-CLL and C1, (3) M-CLL and C2, and (4) U-CLL and C2. To obtain methylation values per gene, we further calculated the mean beta value of all probes of a single gene promoter. Finally, we compared the distribution of mean methylation values of promoters of genes differentially expressed between C1 and C2 (for 474 of the 642 differentially expressed genes we had methylation measures available) with the distribution of mean methylation values of all remaining promoters of genes available on the methylation microarray.
Interaction network
Lefebvre et al. (2010) published a human B-cell interaction network where they assembled transcriptional and post-translational molecular interactions in human B cells. The interactome was constructed using a collection of 254 B-cell gene expression profiles representing 24 distinct phenotypes derived from normal and malignant B cells from primary tumor samples and cell lines. The network contains 5748 nodes (genes) and 64,600 unique edges (interactions). We downloaded this network and selected those genes of the network that are significantly differentially expressed between C1 and C2 and have a fold change >2. From these 266 differentially expressed genes contained in the interaction network, 198 genes have a degree >1, i.e., they interact with at least one other differentially expressed gene in the network. Thus, our subnetwork of interactions of differentially expressed genes consists of 198 nodes and 459 edges. We colored the nodes of the network corresponding to their gene expression status: Genes up-regulated in C2 are colored orange while genes down-regulated in C2 are blue. The intensity of the colors represent –log10(p) values: The darker represents a node, the smaller its original P-value. The colors of the edges are determined by the colors of the nodes they connect. The same figure was then drawn again, but using differential expression values from a comparison of lymph node versus blood signatures (Herishanu et al. 2011)
Reverse transcription, quantitative PCR, and chimeric junctions
cDNA was synthesized from 500 ng of total RNA using Moloney murine leukemia virus (MMLV) reverse transcriptase (Invitrogen) following the manufacturer's instructions and amplified by PCR. Amplification was performed using AmpliTaqGold DNA Polymerase (Applied Biosystems), and the reaction mix contained a 1× final concentration of 10× GeneAmp and 10× PCR Gold buffers (Applied Biosystems), 100 μM dNTP mix (Invitrogen), 100 nM forward and reverse primers, 1.5 mM MgCl2, and 1 U AmpliTaqGold DNA polymerase in a final reaction volume of 50 μL. Quantitative PCR experiments were done in triplicate in a ViiA7 Real-Time PCR System using Fast SYBR Green Master Mix (Applied Biosystems). The relative expression of each gene was quantified by the Log 2 RQ (relative quantity, RQ = 2 − ΔΔCT), using beta-glucuronidase as an endogenous control. Expression levels are given as arbitrary quantitative PCR units referenced to a calibrator sample. All the PCR products have been run in a capillary electrophoresis gel (Qiagen) with the QIAxcel DNA screening kit (Qiagen). Sequences for the primers used are listed in Supplemental Tables S5 and S6. For the chimeric junctions, cDNA was synthesized from 500 ng of total RNA using MMLV reverse transcriptase (Invitrogen) following the manufacturer's instructions and amplified by PCR. Amplification was performed using AmpliTaqGold DNA polymerase (Applied Biosystems), 1 µL of cDNA, and the reaction mix contained 1× PCR buffers (Applied Biosystems), 200 µM dNTP mix (Invitrogen), 100 nM forward and reverse primers, 1.5 mM MgCl2, and 1.25 U AmpliTaqGold DNA polymerase in a final reaction volume of 50 µL. Sequences for the primers used are listed in the Supplemental Material.
Statistical clinical analysis
The SPSS Statistics 20.0 (SPSS Inc) package was employed to correlate clinical and biological variables by means of Fisher's exact test or a nonparametric test when necessary. Time to treatment from sampling (TTT) was defined as the interval between sampling date and the date of treatment or last follow-up. Overall survival from sampling (OS) was calculated from sampling date to date of death or last follow-up. Survival curves were analyzed according to the Kaplan and Meier method and compared using the log-rank test (Peto and Pike 1973). Multivariate analysis was performed according to the Cox regression method (Cox 1972). All statistical tests were two-sided and the level of statistical significance was 0.05.
Data access
Sequencing and expression array data have been submitted to the European Genome-Phenome Archive (EGA; http://www.ebi.ac.uk/ega/), which is hosted by the European Bioinformatics Institute (EBI), under accession number EGAS00001000374.
Acknowledgments
This work was funded by the Spanish Ministry of Economy and Competitivity (MINECO) through the Instituto de Salud Carlos III (ISCIII), Red Temática de Investigación del Cáncer (RTICC) and Instituto Nacional de Bioinformática (INB) from ISCIII, and Consolider CSD2007-00050. C.L.-O. is an investigator of the Botín Foundation and E.C. of the ICREA-Academia program. N.L.-B., D.T., and A.G.-P. acknowledge funding from the Spanish Ministry of Science and Technology (grant number SAF2009-06954). S.E. is supported by a fellowship from La Caixa. We are grateful to all members of the CLL Spanish Consortium for their continuous support to this project, in particular to Sara Guijarro, Silvia Martín, Cristina Capdevila, Montse Sánchez, Laura Plá, Miriam Rubio-Camarillo, and Jose María Fernandez for excellent technical assistance, and Nathalie Villahoz and Carmen Muro for excellent work in the coordination of the CLL Spanish Consortium. We also thank Dmitry Pervoushine, Didac Santesmasses, Marco Mariotti, and André Corvelo for useful discussions. Finally, we are very grateful to all patients with CLL who have participated in this study.
Footnotes
[Supplemental material is available for this article.]
Article published online before print. Article, supplemental material, and publication date are at http://www.genome.org/cgi/doi/10.1101/gr.152132.112.
Freely available online through the Genome Research Open Access option.
References
- Anczukow O, Rosenberg AZ, Akerman M, Das S, Zhan L, Karni R, Muthuswamy SK, Krainer AR 2012. The splicing factor SRSF1 regulates apoptosis and proliferation to promote mammary epithelial cell transformation. Nat Struct Mol Biol 19: 220–228 [DOI] [PMC free article] [PubMed] [Google Scholar]
- Antonov AV 2011. BioProfiling.de: Analytical web portal for high-throughput cell biology. Nucleic Acids Res 39: W323–W327 [DOI] [PMC free article] [PubMed] [Google Scholar]
- Berger MF, Levin JZ, Vijayendran K, Sivachenko A, Adiconis X, Maguire J, Johnson LA, Robinson J, Verhaak RG, Sougnez C, et al. 2010. Integrative analysis of the melanoma transcriptome. Genome Res 20: 413–427 [DOI] [PMC free article] [PubMed] [Google Scholar]
- Buchner M, Fuchs S, Prinz G, Pfeifer D, Bartholome K, Burger M, Chevalier N, Vallat L, Timmer J, Gribben JG, et al. 2009. Spleen tyrosine kinase is overexpressed and represents a potential therapeutic target in chronic lymphocytic leukemia. Cancer Res 69: 5424–5432 [DOI] [PubMed] [Google Scholar]
- Burger JA, Gandhi V 2009. The lymphatic tissue microenvironments in chronic lymphocytic leukemia: In vitro models and the significance of CD40-CD154 interactions. Blood 114: 2560–2561, author reply 2561–2562 [DOI] [PMC free article] [PubMed] [Google Scholar]
- Chuang H, Rassenti L, Salcedo M, Licon K, Kohlmann A, Haferlach T, Foa R, Ideker T, Kipps T 2012. Subnetwork-based analysis of chronic lymphocytic leukemia identifies pathways that associate with disease progression. Blood 120: 2639–2649 [DOI] [PMC free article] [PubMed] [Google Scholar]
- Clauset A, Newman ME, Moore C 2004. Finding community structure in very large networks. Phys Rev E 70: 066111. [DOI] [PubMed] [Google Scholar]
- Corrionero A, Minana B, Valcarcel J 2011. Reduced fidelity of branch point recognition and alternative splicing induced by the anti-tumor drug spliceostatin A. Genes Dev 25: 445–459 [DOI] [PMC free article] [PubMed] [Google Scholar]
- Coufal NG, Garcia-Perez JL, Peng GE, Yeo GW, Mu Y, Lovci MT, Morell M, O'Shea KS, Moran JV, Gage FH 2009. L1 retrotransposition in human neural progenitor cells. Nature 460: 1127–1131 [DOI] [PMC free article] [PubMed] [Google Scholar]
- Cox D 1972. Regression models and life tables. J R Stat Soc Series B Stat Methodol 34: 187–220 [Google Scholar]
- Djebali S, Davis C, Merkel A, Dobin A, Lassmann T, Mortazavi A, Tanzer A, Lagarde J, Lin W, Schlesinger F, et al. 2012. Landscape of transcription in human cells. Nature 489: 101–108 [DOI] [PMC free article] [PubMed] [Google Scholar]
- Dühren-von Minden M, Übelhart R, Schneider D, Wossning T, Bach M, Buchner M, Hofmann D, Surova E, Follo M, Kohler F, et al. 2012. Chronic lymphocytic leukaemia is driven by antigen-independent cell-autonomous signalling. Nature 489: 309–312 [DOI] [PubMed] [Google Scholar]
- Fabbri G, Rasi S, Rossi D, Trifonov V, Khiabanian H, Ma J, Grunn A, Fangazio M, Capello D, Monti S, et al. 2011. Analysis of the chronic lymphocytic leukemia coding genome: Role of NOTCH1 mutational activation. J Exp Med 208: 1389–1401 [DOI] [PMC free article] [PubMed] [Google Scholar]
- Fabris S, Mosca L, Todoerti K, Cutrona G, Lionetti M, Intini D, Matis S, Colombo M, Agnelli L, Gentile M, et al. 2008. Molecular and transcriptional characterization of 17p loss in B-cell chronic lymphocytic leukemia. Genes Chromosomes Cancer 47: 781–793 [DOI] [PubMed] [Google Scholar]
- Friedman J, Hastie T, Tibshirani R 2008. Sparse inverse covariance estimation with the graphical lasso. Biostatistics 9: 432–441 [DOI] [PMC free article] [PubMed] [Google Scholar]
- Friedman DR, Weinberg JB, Barry WT, Goodman BK, Volkheimer AD, Bond KM, Chen Y, Jiang N, Moore JO, Gockerman JP, et al. 2009. A genomic approach to improve prognosis and predict therapeutic response in chronic lymphocytic leukemia. Clin Cancer Res 15: 6947–6955 [DOI] [PMC free article] [PubMed] [Google Scholar]
- Gonzalez-Porta M, Calvo M, Sammeth M, Guigo R 2011. Estimation of alternative splicing variability in human populations. Genome Res 22: 528–538 [DOI] [PMC free article] [PubMed] [Google Scholar]
- Guarini A, Chiaretti S, Tavolaro S, Maggio R, Peragine N, Citarella F, Ricciardi MR, Santangelo S, Marinelli M, De Propris MS, et al. 2008. BCR ligation induced by IgM stimulation results in gene expression and functional changes only in IgV H unmutated chronic lymphocytic leukemia (CLL) cells. Blood 112: 782–792 [DOI] [PubMed] [Google Scholar]
- Gundem G, Lopez-Bigas N 2012. Sample-level enrichment analysis unravels shared stress phenotypes among multiple cancer types. Genome Med 4: 28. [DOI] [PMC free article] [PubMed] [Google Scholar]
- Harrow J, Denoeud F, Frankish A, Reymond A, Chen CK, Chrast J, Lagarde J, Gilbert JG, Storey R, Swarbreck D et al. 2006. GENCODE: Producing a reference annotation for ENCODE. Genome Biol 7: S4.1–S4.9 [DOI] [PMC free article] [PubMed] [Google Scholar]
- Herishanu Y, Perez-Galan P, Liu D, Biancotto A, Pittaluga S, Vire B, Gibellini F, Njuguna N, Lee E, Stennett L, et al. 2011. The lymph node microenvironment promotes B-cell receptor signaling, NF-κB activation, and tumor proliferation in chronic lymphocytic leukemia. Blood 117: 563–574 [DOI] [PMC free article] [PubMed] [Google Scholar]
- Herold T, Jurinovic V, Mulaw M, Seiler T, Dufour A, Schneider S, Kakadia PM, Feuring-Buske M, Braess J, Spiekermann K, et al. 2011. Expression analysis of genes located in the minimally deleted regions of 13q14 and 11q22-23 in chronic lymphocytic leukemia-unexpected expression pattern of the RHO GTPase activator ARHGAP20. Genes Chromosomes Cancer 50: 546–558 [DOI] [PubMed] [Google Scholar]
- Huang da W, Sherman BT, Lempicki RA 2009. Systematic and integrative analysis of large gene lists using DAVID bioinformatics resources. Nat Protoc 4: 44–57 [DOI] [PubMed] [Google Scholar]
- Jurka J, Kapitonov VV, Pavlicek A, Klonowski P, Kohany O, Walichiewicz J 2005. Repbase Update, a database of eukaryotic repetitive elements. Cytogenet Genome Res 110: 462–467 [DOI] [PubMed] [Google Scholar]
- Kapp AV, Tibshirani R 2007. Are clusters found in one dataset present in another dataset? Biostatistics 8: 9–31 [DOI] [PubMed] [Google Scholar]
- Klein U, Tu Y, Stolovitzky GA, Mattioli M, Cattoretti G, Husson H, Freedman A, Inghirami G, Cro L, Baldini L, et al. 2001. Gene expression profiling of B cell chronic lymphocytic leukemia reveals a homogeneous phenotype related to memory B cells. J Exp Med 194: 1625–1638 [DOI] [PMC free article] [PubMed] [Google Scholar]
- Knowles DG, Roder M, Merkel A, Guigo R 2013. Grape RNA-Seq analysis pipeline environment. Bioinformatics 29: 614–621 [DOI] [PMC free article] [PubMed] [Google Scholar]
- Kulis M, Heath S, Bibikova M, Queiros AC, Navarro A, Clot G, Martinez-Trillos A, Castellano G, Brun-Heath I, Pinyol M, et al. 2012. Epigenomic analysis detects widespread gene-body DNA hypomethylation in chronic lymphocytic leukemia. Nat Genet 44: 1236–1242 [DOI] [PubMed] [Google Scholar]
- Lefebvre C, Rajbhandari P, Alvarez MJ, Bandaru P, Lim WK, Sato M, Wang K, Sumazin P, Kustagi M, Bisikirska BC, et al. 2010. A human B-cell interactome identifies MYB and FOXM1 as master regulators of proliferation in germinal centers. Mol Syst Biol 6: 377. [DOI] [PMC free article] [PubMed] [Google Scholar]
- Li FJ, Ding S, Pan J, Shakhmatov MA, Kashentseva E, Wu J, Li Y, Soong SJ, Chiorazzi N, Davis RS 2008. FCRL2 expression predicts IGHV mutation status and clinical progression in chronic lymphocytic leukemia. Blood 112: 179–187 [DOI] [PMC free article] [PubMed] [Google Scholar]
- Maher C, Palanisamy N, Brenner J, Cao X, Kalyana-Sundaram S, Luo S, Khrebtukova I, Barrette T, Grasso C, Yu J, et al. 2009. Chimeric transcript discovery by paired-end transcriptome sequencing. Proc Natl Acad Sci 106: 12353–12358 [DOI] [PMC free article] [PubMed] [Google Scholar]
- Marco-Sola S, Sammeth M, Guigó R, Ribeca P 2012. The GEM mapper: Fast, accurate and versatile alignment by filtration. Nat Methods 9: 1185–1188 [DOI] [PubMed] [Google Scholar]
- McCall MN, Irizarry RA 2011. Thawing frozen Robust Multi-array Analysis (fRMA). BMC Bioinformatics 12: 369. [DOI] [PMC free article] [PubMed] [Google Scholar]
- Mihailovich M, Militti C, Gabaldon T, Gebauer F 2010. Eukaryotic cold shock domain proteins: Highly versatile regulators of gene expression. Bioessays 32: 109–118 [DOI] [PubMed] [Google Scholar]
- Mitelman F, Johansson B, Mertens F 2007. The impact of translocations and gene fusions on cancer causation. Nat Rev Cancer 7: 233–245 [DOI] [PubMed] [Google Scholar]
- Montgomery SB, Sammeth M, Gutierrez-Arcelus M, Lach RP, Ingle C, Nisbett J, Guigo R, Dermitzakis ET 2010. Transcriptome genetics using second generation sequencing in a Caucasian population. Nature 464: 773–777 [DOI] [PMC free article] [PubMed] [Google Scholar]
- Monti S, Tamayo P, Mesirov J, Golub T 2003. Consensus clustering: A resampling-based method for class discovery and visualization of gene expression microarray data. Mach Learn 52: 91–118 [Google Scholar]
- Mortazavi A, Williams BA, McCue K, Schaeffer L, Wold B 2008. Mapping and quantifying mammalian transcriptomes by RNA-Seq. Nat Methods 5: 621–628 [DOI] [PubMed] [Google Scholar]
- Oscier D, Rose-Zerilli M, Winkelmann N, Gonzalez de Castro D, Gomez B, Forster J, Parker H, Parker A, Gardiner A, Collins A, et al. 2012. The clinical significance of NOTCH1 and SF3B1 mutations in the UK LRF CLL4 trial. Blood 121: 468–475 [DOI] [PubMed] [Google Scholar]
- Pajares M, Ezponda T, Catena R, Calvo A, Pio R, Montuenga L 2007. Alternative splicing: An emerging topic in molecular and clinical oncology. Lancet Oncol 8: 349–357 [DOI] [PubMed] [Google Scholar]
- Papaemmanuil E, Cazzola M, Boultwood J, Malcovati L, Vyas P, Bowen D, Pellagatti A, Wainscoat JS, Hellstrom-Lindberg E, Gambacorti-Passerini C, et al. 2011. Somatic SF3B1 mutation in myelodysplasia with ring sideroblasts. N Engl J Med 365: 1384–1395 [DOI] [PMC free article] [PubMed] [Google Scholar]
- Perez-Llamas C, Lopez-Bigas N 2011. Gitools: Analysis and visualisation of genomic data using interactive heat-maps. PLoS ONE 6: e19541. [DOI] [PMC free article] [PubMed] [Google Scholar]
- Peto R, Pike MC 1973. Conservatism of the approximation sigma (O-E)2-E in the logrank test for survival data or tumor incidence data. Biometrics 29: 579–584 [PubMed] [Google Scholar]
- Poliseno L, Salmena L, Zhang J, Carver B, Haveman WJ, Pandolfi PP 2010. A coding-independent function of gene and pseudogene mRNAs regulates tumour biology. Nature 465: 1033–1038 [DOI] [PMC free article] [PubMed] [Google Scholar]
- Prinos P, Garneau D, Lucier JF, Gendron D, Couture S, Boivin M, Brosseau JP, Lapointe E, Thibault P, Durand M, et al. 2011. Alternative splicing of SYK regulates mitosis and cell survival. Nat Struct Mol Biol 18: 673–679 [DOI] [PubMed] [Google Scholar]
- Puente XS, Pinyol M, Quesada V, Conde L, Ordonez GR, Villamor N, Escaramis G, Jares P, Bea S, Gonzalez-Diaz M, et al. 2011. Whole-genome sequencing identifies recurrent mutations in chronic lymphocytic leukaemia. Nature 475: 101–105 [DOI] [PMC free article] [PubMed] [Google Scholar]
- Quesada V, Conde L, Villamor N, Ordonez GR, Jares P, Bassaganyas L, Ramsay AJ, Bea S, Pinyol M, Martinez-Trillos A, et al. 2011. Exome sequencing identifies recurrent mutations of the splicing factor SF3B1 gene in chronic lymphocytic leukemia. Nat Genet 44: 47–52 [DOI] [PubMed] [Google Scholar]
- Quiroga MP, Balakrishnan K, Kurtova AV, Sivina M, Keating MJ, Wierda WG, Gandhi V, Burger JA 2009. B-cell antigen receptor signaling enhances chronic lymphocytic leukemia cell migration and survival: Specific targeting with a novel spleen tyrosine kinase inhibitor, R406. Blood 114: 1029–1037 [DOI] [PMC free article] [PubMed] [Google Scholar]
- Raa DT, Derks IAM, Luijks DM, van Laar J, Monsuur H, Oldreive C, Jethwa A, Hüllein J, Stankovic T, Zenz T, et al. 2012. SF3B1 mutations in CLL are equivalent to p53/ATM dysfunction and cause defective puma upregulation in response to chemotherapy. In 54th ASH Annual Meeting and Exposition, Abstract 711. American Society of Hematology, Atlanta, USA [Google Scholar]
- Ramsay AJ, Quesada V, Foronda M, Conde L, Martinez-Trillos A, Villamor N, Rodriguez D, Kwarciak A, Garabaya C, Gallardo M, et al. 2013. POT1 mutations cause telomere dysfunction in chronic lymphocytic leukemia. Nat Genet 45: 526–530 [DOI] [PubMed] [Google Scholar]
- Refaeli Y, Young RM, Turner BC, Duda J, Field KA, Bishop JM 2008. The B cell antigen receptor and overexpression of MYC can cooperate in the genesis of B cell lymphomas. PLoS Biol 6: e152. [DOI] [PMC free article] [PubMed] [Google Scholar]
- Reich M, Liefeld T, Gould J, Lerner J, Tamayo P, Mesirov JP 2006. GenePattern 2.0. Nat Genet 38: 500–501 [DOI] [PubMed] [Google Scholar]
- Ren S, Peng Z, Mao JH, Yu Y, Yin C, Gao X, Cui Z, Zhang J, Yi K, Xu W, et al. 2012. RNA-seq analysis of prostate cancer in the Chinese population identifies recurrent gene fusions, cancer-associated long noncoding RNAs and aberrant alternative splicings. Cell Res 22: 806–821 [DOI] [PMC free article] [PubMed] [Google Scholar]
- Rosenwald A, Alizadeh AA, Widhopf G, Simon R, Davis RE, Yu X, Yang L, Pickeral OK, Rassenti LZ, Powell J, et al. 2001. Relation of gene expression phenotype to immunoglobulin mutation genotype in B cell chronic lymphocytic leukemia. J Exp Med 194: 1639–1647 [DOI] [PMC free article] [PubMed] [Google Scholar]
- Shapiro IM, Cheng AW, Flytzanis NC, Balsamo M, Condeelis JS, Oktay MH, Burge CB, Gertler FB 2011. An EMT-driven alternative splicing program occurs in human breast cancer and modulates cellular phenotype. PLoS Genet 7: e1002218. [DOI] [PMC free article] [PubMed] [Google Scholar]
- Simon R, Lam A, Li MC, Ngan M, Menenzes S, Zhao Y 2007. Analysis of gene expression data using BRB-ArrayTools. Cancer Inform 3: 11–17 [PMC free article] [PubMed] [Google Scholar]
- Smeenk G, Wiegant WW, Marteijn JA, Luijsterburg MS, Sroczynski N, Costelloe T, Romeijn RJ, Pastink A, Mailand N, Vermeulen W, et al. 2013. Poly(ADP-ribosyl)ation links the chromatin remodeler SMARCA5/SNF2H to RNF168-dependent DNA damage signaling. J Cell Sci 126: 889–903 [DOI] [PubMed] [Google Scholar]
- Subramanian A, Tamayo P, Mootha VK, Mukherjee S, Ebert BL, Gillette MA, Paulovich A, Pomeroy SL, Golub TR, Lander ES, et al. 2005. Gene set enrichment analysis: A knowledge-based approach for interpreting genome-wide expression profiles. Proc Natl Acad Sci 102: 15545–15550 [DOI] [PMC free article] [PubMed] [Google Scholar]
- Ting DT, Lipson D, Paul S, Brannigan BW, Akhavanfard S, Coffman EJ, Contino G, Deshpande V, Iafrate AJ, Letovsky S, et al. 2011. Aberrant overexpression of satellite repeats in pancreatic and other epithelial cancers. Science 331: 593–596 [DOI] [PMC free article] [PubMed] [Google Scholar]
- Triqueneaux G, Velten M, Franzon P, Dautry F, Jacquemin-Sablon H 1999. RNA binding specificity of Unr, a protein with five cold shock domains. Nucleic Acids Res 27: 1926–1934 [DOI] [PMC free article] [PubMed] [Google Scholar]
- Velusamy T, Palanisamy N, Kalyana-Sundaram S, Sahasrabuddhe AA, Maher CA, Robinson DR, Bahler DW, Cornell TT, Wilson TE, Lim MS, et al. 2013. Recurrent reciprocal RNA chimera involving YPEL5 and PPP1CB in chronic lymphocytic leukemia. Proc Natl Acad Sci 110: 3035–3040 [DOI] [PMC free article] [PubMed] [Google Scholar]
- Wang ET, Sandberg R, Luo S, Khrebtukova I, Zhang L, Mayr C, Kingsmore SF, Schroth GP, Burge CB 2008. Alternative isoform regulation in human tissue transcriptomes. Nature 456: 470–476 [DOI] [PMC free article] [PubMed] [Google Scholar]
- Wang L, Lawrence MS, Wan Y, Stojanov P, Sougnez C, Stevenson K, Werner L, Sivachenko A, DeLuca DS, Zhang L, et al. 2011. SF3B1 and other novel cancer genes in chronic lymphocytic leukemia. N Engl J Med 365: 2497–2506 [DOI] [PMC free article] [PubMed] [Google Scholar]
- Wilkerson MD, Hayes DN 2010. ConsensusClusterPlus: A class discovery tool with confidence assessments and item tracking. Bioinformatics 26: 1572–1573 [DOI] [PMC free article] [PubMed] [Google Scholar]
- Yoshida K, Sanada M, Shiraishi Y, Nowak D, Nagata Y, Yamamoto R, Sato Y, Sato-Otsubo A, Kon A, Nagasaki M, et al. 2011. Frequent pathway mutations of splicing machinery in myelodysplasia. Nature 478: 64–69 [DOI] [PubMed] [Google Scholar]
- Zenz T, Mertens D, Kuppers R, Dohner H, Stilgenbauer S 2009. From pathogenesis to treatment of chronic lymphocytic leukaemia. Nat Rev Cancer 10: 37–50 [DOI] [PubMed] [Google Scholar]
- Zhuo L, Gong J, Yang R, Sheng Y, Zhou L, Kong X, Cao K 2009. Inhibition of proliferation and differentiation and promotion of apoptosis by cyclin L2 in mouse embryonic carcinoma P19 cells. Biochem Biophys Res Commun 390: 451–457 [DOI] [PubMed] [Google Scholar]