

Abstract
Metastasis is the result of stochastic genomic and epigenetic events leading to gene expression profiles that drive tumor dissemination. Here we exploit the principle that metastatic propensity is modified by the genetic background to generate prognostic gene expression signatures that illuminate regulators of metastasis. We also identify multiple microRNAs whose germline variation is causally linked to tumor progression and metastasis. We employ network analysis of global gene expression profiles in tumors derived from a panel of recombinant inbred mice to identify a network of co-expressed genes centered on Cnot2 that predicts metastasis-free survival. Modulating Cnot2 expression changes tumor cell metastatic potential in vivo, supporting a functional role for Cnot2 in metastasis. Small RNA sequencing of the same tumor set revealed a negative correlation between expression of the Mir216/217 cluster and tumor progression. Expression quantitative trait locus analysis (eQTL) identified cis-eQTLs at the Mir216/217 locus, indicating that differences in expression may be inherited. Ectopic expression of Mir216/217 in tumor cells suppressed metastasis in vivo. Finally, small RNA sequencing and mRNA expression profiling data were integrated to reveal that miR-3470a/b target a high proportion of network transcripts. In vivo analysis of Mir3470a/b demonstrated that both promote metastasis. Moreover, Mir3470b is a likely regulator of the Cnot2 network as its overexpression down-regulated expression of network hub genes and enhanced metastasis in vivo, phenocopying Cnot2 knockdown. The resulting data from this strategy identify Cnot2 as a novel regulator of metastasis and demonstrate the power of our systems-level approach in identifying modifiers of metastasis.
Metastasis is a systemic disease responsible for the majority of cancer-related mortality and is influenced by both tumor cell-autonomous and host-derived factors. Its complexity is deepened by involvement of not only stochastic genomic and epigenetic events but also by inherited predisposition (Lifsted et al. 1998; Crawford et al. 2006). As a result, despite identification and characterization of individual genes, cellular and developmental processes associated with metastasis, understanding of the metastatic cascade and the interconnectivity of individual factors remains limited. The elucidation of higher-order networks underlying metastasis will therefore likely improve prognostication and intervention strategies by identifying molecular nodes central to tumor cell dissemination and colonization.
Recent advances in global gene expression profiling and computational science have provided the basis for understanding cancer biology at a systems level (Quigley et al. 2009). Knowledge of both tumor subtypes (Perou et al. 2000) and patient prognosis (van 't Veer et al. 2002) has been enhanced by systems-based approaches. This knowledge may significantly change clinical practice by enabling the development of precision treatments based on molecular predictions of outcome and/or tumor response. However, these advances, while significant from the clinical standpoint, are correlative and therefore do not directly address questions about causality or the relationships between the individual genes within gene expression signatures. As such, these studies do not specifically interrogate the drivers of metastatic progression.
Our laboratory has demonstrated that breast cancer not only has an inherited predisposition for metastasis (Park et al. 2005; Hsieh et al. 2009), but the polymorphisms that dictate metastatic susceptibility may also contribute to prognostic signatures (Lukes et al. 2009). This suggests that characterization of metastasis susceptibility genes and the transcriptional networks affected by these inherited variants will be a valuable resource to visualize metastasis-associated networks, define critical nodes within the networks, and identify new candidate genes that underlie the metastatic cascade.
In this study we utilized a recombinant inbred (RI) genetic reference panel of mice (Mucenski et al. 1986) as the framework to globally interrogate transcriptional determinants of metastasis susceptibility. RI panels are specialized sets of inbred mice generated from two inbred strains produced by 20 or more generations of brother-sister inbreeding (Fig. 1A). Each of the resulting sublines is a distinct inbred composite of two previously established parental inbred mouse lines. RI panels are particularly useful for mapping inherited components for highly variable quantitative phenotypes, such as metastatic dissemination. Variation resulting from stochastic events can be reduced by phenotyping multiple isogenic individuals within each subline of the RI panel. This strategy results in a better estimation of genetic effects and increases power to detect genotype–phenotype associations compared with standard genetic mapping strategies, in which every individual animal is genetically unique.
Figure 1.
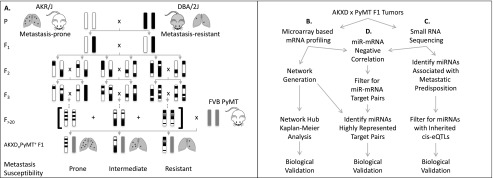
Genome-wide strategy to identify metastasis susceptibility co-expressed networks and their post-transcriptional regulators. (A) The pre-existing AKXD recombinant inbred (RI) panel was constructed by breeding metastasis-prone inbred mice from the AKR/J background to metastasis-resistant DBA/2J mice. F1 progeny from the AKR/J and DBA/2J cross were intercrossed; F2 progeny were bred to homozygosity, generating 24 isogenic AKXD sublines. Crossing each AKXD subline to the MMTV-PyMT model for highly metastatic breast cancer revealed phenotypic diversity in metastatic susceptibility within the AKXD RI panel. (B) RNA purified from AKXD subline primary tumors was subjected to global mRNA profiling by microarray followed by WGCNA and Kaplan-Meier Analysis to identify metastasis-associated co-expressed transcriptional modules. (C) AKXD subline tumor RNA was also subjected to small RNA sequencing followed by miRNA expression-phenotype correlations and eQTL analysis to identify metastasis susceptibility miRNAs. (D) Workflow illustrating analytic integration of global mRNA and miRNA profiling methods to uncover candidate post-transcriptional regulators of co-expressed networks.
The AKXD RI panel was derived from the AKR/J and DBA/2J inbred strains (Mucenski et al. 1986). Previous work in our laboratory has demonstrated that, when crossed to highly metastatic male MMTV-PyMT transgenic mice (Guy et al. 1992), the progeny of these two strains exhibit >20-fold difference in metastatic propensity (Lifsted et al. 1998). Crossing each AKXD subline to MMTV-PyMT transgenic mice (denoted henceforth as [AKXDn × PyMT]F1) resulted in progeny with a similar range of variability in metastatic susceptibility across the AKXD panel (Fig. 1A). Since the oncogenic driver (PyMT) and paternal genetic background (FVB/NJ) are identical among all progeny, the phenotypic diversity in metastatic susceptibility is most likely a result of germline polymorphism in the maternal genome. As such, we selected [AKXDn × PyMT]F1 progeny as a genetically defined vehicle for identification of heritable metastasis-associated transcriptional networks.
It has been demonstrated that microRNAs (miRNAs) play a key role in the initiation and progression of multiple tumor types (Tavazoie et al. 2008; Pencheva and Tavazoie 2013). Our group recently showed that heritable differences in miRNA expression underlie metastatic susceptibility (Goldberger et al. 2013). The concept that miRNAs are post-transcriptional regulators of gene expression led us to hypothesize that miRNAs regulate metastatic progression by targeting heritable metastasis-driving transcriptional networks. We thus devised an approach that combined mRNA and miRNA profiling to enable identification of co-expressed metastasis-driving transcriptional networks (Fig. 1B) and miRNAs that potentially regulate these networks.
This strategy identified Cnot2, a structural component of the CCR4–NOT transcriptional regulatory deadenylase complex, as a metastasis modifier gene, suggesting a role for RNA processing and degradation in tumor progression and malignancy. Furthermore, correlation analysis between metastasis susceptibility and microRNA expression data, eQTL analysis, and subsequent in vivo validation identified the Mir216a, Mir216b, Mir217 as inherited metastasis-suppressing loci (Fig. 1C). Finally, computational screening of the transcriptional network hubs for common miRNAs followed by experimental validation studies identified miR-3470a and miR-3470b as metastasis-enhancing miRNAs (Fig. 1D). These findings demonstrate the utility of our integrated approach for elucidating previously unidentified factors that both positively and negatively influence metastatic progression.
Results
Correlation of gene expression and metastatic efficiency
We have previously demonstrated that germline polymorphisms can modify gene expression patterns and result in differences in heritable metastatic susceptibility (Faraji et al. 2012; Hu et al. 2012; Winter et al. 2012). Based on this principle, we analyzed gene expression profile data from two to seven tumors from each of the [AKXDn × PyMT]F1 progeny on Affymetrix MOE430 microarrays (Yang et al. 2005). Permutation tests of the gene expression profiles revealed 20 probe sets representing 17 distinct genes passing the genome-wide significance threshold for metastatic progression (P < 0.05) (Supplemental Table 1). The gene most strongly correlated with the metastatic phenotype was the C1 protease cathepsin J (Ctsj), suggesting a possible role for protein degradation in metastatic progression. No obvious overrepresentation of any single functional pathway was observed among the 17 genes, nor were any of the previously identified metastasis susceptibility genes identified in this genetic reference panel. With the exception of Ms4a6d, none of the metastasis-associated genes were linked with regions of the genome previously shown to harbor metastasis susceptibility genes (Hunter et al. 2001; Lancaster et al. 2005; Crawford et al. 2008b; KW Hunter, unpubl.).
To test the relevance to human disease, the human homolog to each gene was queried using the Gene expression-based Outcome for Breast cancer Online (GOBO, http://co.bmc.lu.se/gobo/) (Ringner et al. 2011). Of the 17 murine genes, 12 were represented by probes to the human homologs. Of these 12 genes, expression of seven (58%) segregated high- and low-risk groups with respect to distant metastasis-free survival (DMFS) (Supplemental Fig. 1). These data indicate that Cstf1, Rngtt, Areg, Umod, Pcp4, Slc25A5, and Tob1 are mouse candidate metastasis-associated genes predictive of DMFS in humans. Intriguingly, Tob1 and Cstf1 are regulators of polyadenylyl tail length (Takagaki and Manley 2000; Ezzeddine et al. 2007) and Rngtt is an mRNA 5′-guanyltransferase capping enzyme (Pillutla et al. 1998). To our knowledge, this is the first report implicating modulation of mRNA processing and stability in metastasis.
Analysis of expression data reveals modulation of network expression by previously identified metastasis susceptibility genes
We next undertook gene expression network analyses to move beyond single gene correlations and reveal higher-order expression patterns driving metastatic susceptibility. To define our approach, we proposed that modules of co-expressed genes can indicate co-regulated gene networks comprising functionally coherent molecular pathways (Tavazoie et al. 1999). Network-level analysis of expression data was achieved by examining gene expression network modules using weighted gene co-expression network analysis (WGCNA) based on topological overlap measure (TOM) algorithms (Li and Horvath 2009). Assuming parsimonious network structure, the generated expression networks were visualized with minimum spanning tree algorithms. Thirteen modules containing between 41 and 1085 co-expressed genes were identified (Supplemental Figs. 2–14). For clarity, modules were named for the most highly connected gene within each network.
Encouragingly, we noted the membership of several previously identified and in vivo validated metastasis modifier genes in our networks. The Ndn module was found to contain Arap3 (previously known as Centd3), Pi16, Ndn, and Csf1r, two of which (Ndn and Arap3) occupied central, highly connected hub positions (Supplemental Fig. 2). These four genes were previously found to modulate metastatic efficiency in vivo (Crawford et al. 2008b). In addition, the Cnot2 module (Supplemental Fig. 3) was found to contain Arid4b and Luc7l while the Polr2g module (Supplemental Fig. 7) contained Brd4 (Crawford et al. 2008a; Winter et al. 2012). The membership of these bona fide metastasis modifier genes within our networks provided increased confidence for our systems-level approach to identifying metastasis-driving transcriptional networks.
Network modules predict outcome in human breast cancer data sets
We next turned to two human breast cancer gene expression data sets to determine if the individual transcription networks were also associated with human metastatic disease. GSE2034 (Wang et al. 2005) and GSE11121 (Schmidt et al. 2008) are gene expression data sets from node-negative breast cancer patients who did not receive adjuvant therapy and for which DMFS data are available. The individual mouse module gene sets were converted to human probe sets using the NetAffx Batch Query tool (Affymetrix.com). Probe sets representing “hub transcripts” (greater than or equal to five connections), which capture the majority of the module gene expression variability (Hu et al. 2012), were used to generate gene signature to assess the relative impact of each module on DMFS by Kaplan-Meier analysis (Table 1). The individual Cnot2, Klhl12, Katna1, Chac2, Polr2g and modules significantly discriminated DMFS in both data sets, and are therefore the highest confidence metastasis-associated modules. The Sephs1 and Naa35 modules were significant for GSE2034 and borderline for GSE11121, while the Rad51 and Traf7 modules were significant for GSE2034 but not GSE11121. Conversely, the Fabp4 and Eno3 modules were significant for GSE11121 but not GSE2034. The Ndn module was borderline significant for both, while the Gsk3b module was not significant for either data set (Table 1; Supplemental Figs. 3–28). The lack of concordance for these modules between the two data sets can be explained by statistical fluctuations, differences in the number of samples, or undefined differences in sample composition in the breast cancer data sets. Since human expression data sets are thought to be significantly underpowered to detect stable gene signatures associated with survival (Ein-Dor et al. 2006), we believe that at least some of these modules play a role in metastatic disease and, thus, were included in subsequent computational analyses.
Table 1.
Summary of co-expressed modules
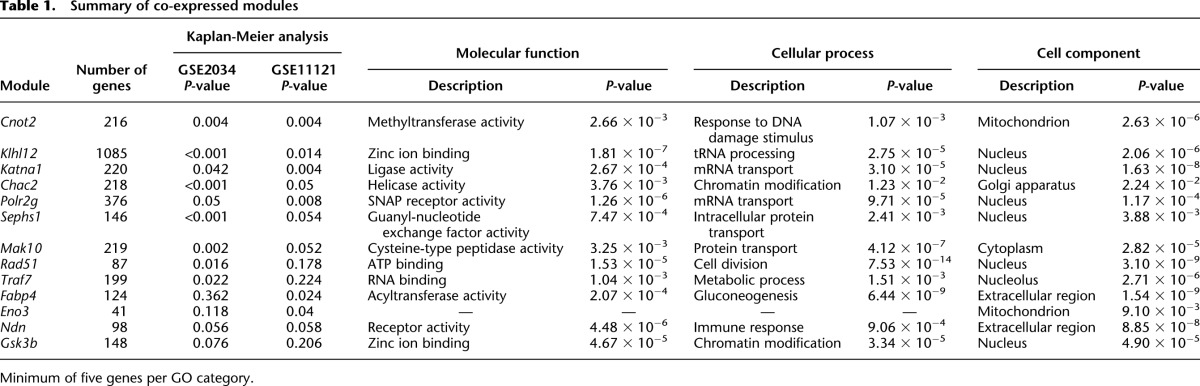
Since each of these statistically derived modules may represent a co-regulated transcription program, we next performed gene set enrichment analysis (GSEA) (Subramanian et al. 2005) to determine if any module acted to maintain specific cellular functions and to identify common underlying functional pathways that might be associated with metastatic progression. Six of the 13 modules were found to be most highly associated with the nucleus. mRNA transport, zinc ion binding, and chromatin modification were also represented by more than one module (Table 1). Together, these results suggest that nuclear biology plays a role in establishment of metastatic predisposition. This idea is supported by previous identification of the metastasis susceptibility genes Brd4, a transcriptional elongation factor and chromatin reader, Rrp1b, a facultative heterochromatin protein, Ndn, a transcription factor, and Arid4b, a member of the Sin3a histone deacetylase complex (Crawford et al. 2007; Crawford et al. 2008a,b; Winter et al. 2012).
Validation of the Cnot2 module co-regulation
The network showing the highest reproducible statistical correlation to DMFS, Cnot2 (Fig. 2A), was selected for biological validation. We hypothesized that the module could be a co-regulated expression unit potentially influenced by the expression of Cnot2, which might serve as a surrogate gene for the network. To test this idea, nine network hub genes (Atg12, Riok1, Krcc1, Angel2, Polrmt, Tmem101, Exoc1, Utp6, Ube2r2) (highlighted in gray in Fig. 2A) were selected to capture maximum network variance. The expression of these nine hub genes, representing 52% (114 of 217 genes) of the connectivity of the entire module, was assessed by quantitative real time PCR (qRT-PCR). Ectopic expression of Cnot2 in 6DT1 murine mammary tumor cells significantly up-regulated five of nine hub genes (Atg12, Riok1, Krcc1, Angel2, Polrmt) (Fig. 2B), indicating that overexpression of Cnot2 within physiological limits (∼2–3 fold) resulted in co-upregulation of greater than half of the tested genes within the Cnot2 module and suggesting that at least a subset of genes within the Cnot2 network is part of a regulatory module potentially controlled by Cnot2 expression.
Figure 2.

A transcriptional module centered on Cnot2 shows regulation by Cnot2 expression and predicts outcome in human breast cancer cohorts. (A) The Cnot2 module. Circles indicate individual genes. Connections between the genes were generated by minimizing the number of connections necessary to explain the gene expression correlations. (B) The effect of Cnot2 overexpression in 6DT1 cells on network hub transcripts. (*) P < 0.05, (**) P < 0.01. (C) A gene signature generated from homologous Cnot2 module hub transcripts predicts survival in human breast cancer cohorts. (D) Oncomine data set (Finak et al. 2008) shows CNOT2 is down-regulated in invasive breast carcinoma relative to normal breast tissue (normal breast tissue n = 6, invasive breast carcinoma n = 53; fold change = −16.3; P = −1.12 × 10⁻²⁴).
In vivo validation of Cnot2 in metastatic progression
The Cnot2 network signature stratified breast cancer patients into DMFS high- and low-risk groups (Fig. 2C). To further probe the functional role of variations in Cnot2 expression in tumor progression a search of publicly available human breast cancer microarray data sets using Oncomine (Compendia Bioscience) was performed, revealing that CNOT2 expression was 16-fold lower in 53 invasive breast carcinoma samples compared with six normal breast tissue samples (Fig. 2D; Finak et al. 2008). Also, comparison of 67NR and 4T1 cells, clones with distinct metastatic potential isolated from the same spontaneously formed murine mammary tumor (Aslakson and Miller 1992), showed that Cnot2 along with four module hub genes were down-regulated in highly metastatic 4T1 cells relative to nonmetastatic 67NR cells (Supplemental Fig. 29). Taken together, these data show a consistent negative correlation between Cnot2 expression and tumor progression in independent mouse breast tumor model systems and human patient data.
To test if variation in Cnot2 expression has a direct, causative role in tumor progression, 6DT1 cells overexpressing Cnot2 were orthotopically implanted into syngeneic immune competent FVB/NJ female mice. Assessment at 30 d post-implantation demonstrated a reduction in primary tumor mass and a pronounced suppression of pulmonary metastases (Fig. 3A). 6DT1 cells were also transduced to stably express short hairpin RNA constructs targeting Cnot2, achieving modest knockdown of Cnot2. Cnot2 knockdown resulted in a significant increase in pulmonary metastasis but had no effect on primary tumor burden in our model (Fig. 3B,C). To increase confidence in the generalizability of our results, the orthotopic implantation assay was repeated on an independent murine mammary tumor cell line, Mvt1. Knockdown of Cnot2 in Mvt1 cells enhanced both pulmonary metastasis and primary tumor mass (Supplemental Fig. 30), consistent with the activity of a progression gene in this cell line. These results validate the causative role of Cnot2 as a negative regulator of tumor progression.
Figure 3.
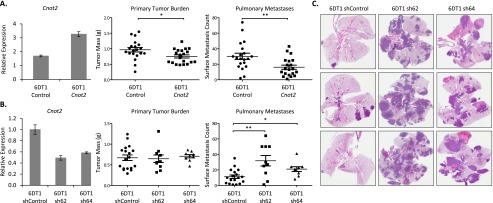
Cnot2 expression suppresses tumor progression. (A) Overexpression of Cnot2 in 6DT1 cells showed 22% reduction in primary tumor mass (P = 0.021) and 46% reduction in pulmonary metastases (P = 0.006, n = 20 per group). (B) Short hairpin-mediated knockdown Cnot2 by 51% (sh62) and 42% (sh64) in 6DT1 cells resulted in no significant change in primary tumor mass but enhanced metastatic potential respectively by 183% (P = 0.002) and 87% (P = 0.026, ncontrol = 18 mice, nsh62 = 10 mice, nsh64 = 9 mice). (C) Representative lungs from knockdown experiment sectioned and stained with hematoxylin and eosin (H&E). (*) P < 0.05, (**) P < 0.01.
Identification of inherited metastasis susceptibility microRNAs
By definition, heritable metastasis modifier miRNAs display allelic variations in expression that dictate differences in metastatic susceptibility (Goldberger et al. 2013). We proposed that the highest confidence heritable miRNAs would contain cis-expression quantitative trait loci (eQTL), as these are most likely to result from heritable variations that directly and locally influence transcript levels (Doss et al. 2005). In order to uncover such miRNAs we undertook high throughput sequence analysis of small RNAs derived from [AKXDn × PyMT]F1 tumors (Fig. 1C) followed by eQTL analysis (Schadt et al. 2003) in the AKXD RI panel.
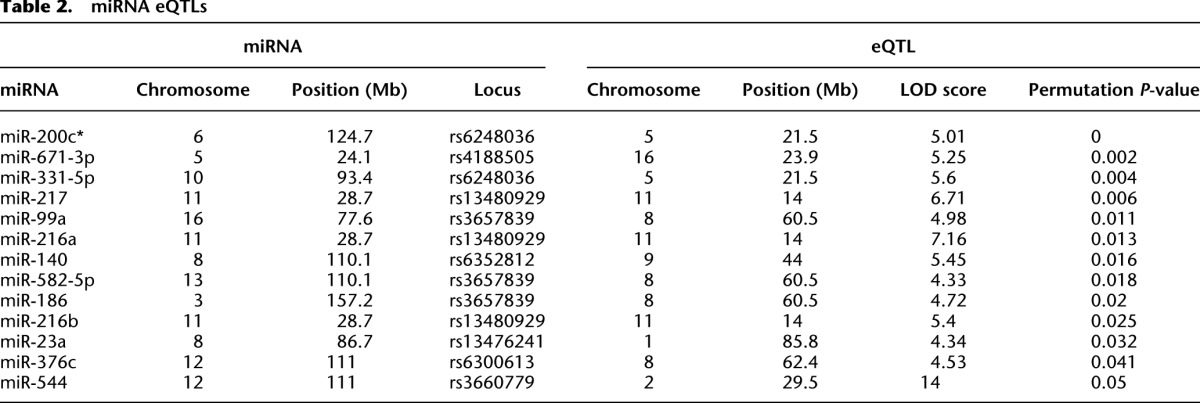
Comparison of expression levels of significantly expressed miRNAs to the genetic map resulted in the detection of seven distinct eQTLs for 13 miRNAs exceeding the genome-wide statistical threshold for metastatic progression (Table 2). Interestingly, the human homologs of eight of these 13 miRNAs (61%; miR-671, miR-99a, miR-140, miR-582, miR-186, miR-216b, miR-23a, and miR-544) have previously been implicated in metastatic dissemination (Deng et al. 2011; Haga and Phinney 2012; Jahid et al. 2012; Rutnam and Yang 2012; Kuo et al. 2013; Li et al. 2013a,d; Uchino et al. 2013; Yang et al. 2013a). Further, the highest confidence eQTL observed was for miR-200c*, a poorly characterized member of the Mir200c/141 cluster, which is thought to drive metastatic dissemination by inducing tumor cells to undergo epithelial-to-mesenchymal transition (Gregory et al. 2008).
Table 2.
miRNA eQTLs
The sequence data were then queried for miRNAs whose expression directly correlated with metastatic propensity across the AKXD RI panel. miR-216a, miR-216b, and miR-217 showed significant inverse correlations to metastasis (Fig. 4A), indicating that inherited variation in the expression of this set of miRNAs contributes to differences in metastatic susceptibility across the AKXD panel.
Figure 4.

Mir216/217 are inherited metastasis suppressors. (A) Expression-phenotype correlations for Mir216a, Mir216b, and Mir217 in [AKXDn × PyMT]F1 tumors. Blue, yellow, and red points indicate AKXD sublines with respective weak, intermediate, and high metastatic propensities. (B) miR-eQTL analysis demonstrated peaks reaching genome-wide significance (red line) for Mir216a and Mir217 and reaching the “suggestive” threshold (gray line) for Mir216b. Consistent with a cis-eQTL, these peaks co-localize to the Mir216/217 locus on chromosome 11. Please refer to Supplemental Figure 31 for a detailed, high-resolution format of eQTL plots. (C) Ectopic expression of Mir216a, Mir216b, and Mir217 in 6DT1 cells. (D) Orthotopic implantation of 6DT1 cells expressing control miRNA, Mir216a, Mir216b, or Mir217. Mir216b and Mir217 expression reduced pulmonary metastasis by 79% and 80%, respectively (pMir216b = 0.011, pMir217 = 0.022; n = 10 mice per group). (*) P < 0.05.
Comparison of human and mouse Mir216/217 sequences revealed a high degree of conservation of pre-miRNA and mature miRNAs, with 100% sequence identity for mature miR-216a and miR-217 and 96% identity for mature miR-216b (Supplemental Fig. 32). In addition, the target prediction tool TargetScan (Lewis et al. 2005) showed significant overlap in targets in mice and humans (Supplemental Fig. 33). At least one EST (DA732292 in humans) encompasses all three miRNAs, suggesting this miRNA cluster is expressed from the same primary transcript (Supplemental Fig. 34), which raised the possibility that repression of this transcript may cause a synergistic enhancement of tumor cell metastatic potential. To test this idea, the Broad Institute miRNA target prediction tool was applied to predict and combine all miR-216/217 putative targets. A gene signature was then developed from predicted targets that showed significant variance in two independent mouse tumor data sets (Diversity Outcross and MOLF [Hu et al. 2013], Supplemental Table 15). This miR-216/217 target gene signature demonstrated statistically significant stratification of metastatic risk in murine mammary tumors as well as in human breast cancer (Supplemental Figs. 35, 36). Interestingly, the human data demonstrated statistically significant stratification of metastatic risk specifically in estrogen receptor (ER) negative tumors.
To test the direct causative role of miR-216a, miR-216b, and miR-217 in breast cancer, 6DT1 cells were transduced to stably express pre-miRNA sequences (Fig. 4C). As shown in Figure 4D, orthotopic implantation of 6DT1 cells ectopically expressing each miRNA resulted in minimal effect on primary tumor mass although expression of Mir216b and Mir217 trended toward reduction of primary tumor growth. Despite insignificant effect on tumor growth, Mir216b and Mir217 expression in 6DT1 cells resulted in dramatic suppression of pulmonary metastasis (Fig. 4D).
The Mir216/217 cluster predicted target signature stratified metastatic risk in basal-like murine tumors (Hu et al. 2013) as well as ER-negative human tumors. We thus also tested the Mir216a, Mir216b, and Mir217 expression in the 4T1 cell line, an ER-negative murine tumor model (Kaur et al. 2012). Orthotopic implantation of 4T1 cells stably expressing Mir216a, Mir216b, or Mir217 showed statistically significant tumor suppression with a dramatic reduction in tumor mass for 4T1 cells expressing Mir216a and a more moderate tumor suppressive effect for cells expressing Mir216b (Supplemental Fig. 37). In 4T1 cells, all three miRNAs showed statistically significant inhibitory effects on metastasis. Despite observed differential effects on primary tumor growth between 6DT1 and 4T1 cells, expression of the Mir216/217 cluster showed similar suppressive effects on pulmonary metastasis. This directional concordance between genetic associations derived from sequence analysis in AKXD mice with in vivo metastasis assays in two independent mammary tumor cell lines indicates that the Mir216/217 cluster is a heritable suppressor of tumor progression.
Integrated analysis of gene expression profiling and miRNA expression data
To gain insight into post-transcriptional regulation of the co-expressed modules associated with metastasis susceptibility, we undertook an approach that integrated our mRNA and small RNA profiling data. We hypothesized that querying transcripts for the presence of common microRNA recognition elements (MREs) might yield metastasis master regulator miRNAs (Fig. 1D).
We searched within all networks generated from expression profiling of [AKXD × PyMT]F1 tumors, focusing on genes that capture the majority of the network variability by restricting analysis to hub transcripts. A gene signature was constructed from the 153 hub transcripts (Supplemental Table 16) and screened for the ability to discriminate patient outcome. This gene signature was found to discriminate patient outcome in both GSE2034 and GSE11121 data sets (Supplemental Fig. 38), suggesting that these 153 hub transcripts were significantly associated with DMFS.
Both mRNA and miRNA genome-wide screens were performed on RNA from the same tumors. The data captured by mRNA expression array and miRNA sequencing could thus be integrated for genome-wide query of potential miRNA–mRNA target pairs by identifying negatively correlated miRNA–gene pairs. Correlations with a P-value ≤ 0.01 after 10,000 permutations were considered significant, producing a total of 16,475 miRNA–gene pairs consisting of 369 miRNAs in negative correlation with 4153 genes (Supplemental Table 17). The resulting data were then subjected to three filters. First, to increase the probability of identifying metastasis-driver microRNAs, all subsequent analysis was restricted to the 153 metastasis-associated hub transcripts. Second, the results were filtered for genes with shared computationally predicted MREs. Third, those miRNAs targeting the filtered set of mRNAs more frequently than predicted by chance were selected as candidate metastasis-driving miRNAs.
The first two filters yielded 38 miRNAs putatively targeting 49 of the 153 highly connected hub genes (Supplemental Table 18). Of these 38 candidate miRNAs 25 have known human homologs, of which 11 have previously been identified to directly act in the metastatic cascade in various tumor types (let-7f, miR-30c, miR-31, miR-127, miR-134, miR-140, miR-148a, miR-196b, miR-210, miR-503, miR-582) (Valastyan et al. 2009; Li et al. 2010; Liang et al. 2011; Ying et al. 2011; Zhou and Wang 2011; Bockhorn et al. 2013; Li et al. 2013c; Liu et al. 2013; Uchino et al. 2013; Yang et al. 2013a,b) while several other miRNAs have been associated with distant metastatic disease (miR-152, miR-298, miR-326, miR-423) (Farazi et al. 2011; Bao et al. 2012; Hui et al. 2013; Valencia et al. 2013). Moreover, as shown above, miR-140 and miR-582 were also found to contain a trans-eQTL (Table 2) implicating them as candidate heritable metastasis susceptibility miRNAs, which is consistent with the notion that these miRNAs target heritable metastasis susceptibility transcriptional networks. In total, 15 (60%) of 25 human homologs of murine miRNAs identified by integrating transcriptional network analysis with small RNA sequencing data have previously been implicated in metastasis.
Unexpectedly, the third filter revealed that 32 (65%) of the 49 target genes were predicted targets of miR-3470a or miR-3470b, suggesting that this miRNA family plays an important role in the establishment of metastatic susceptibility. Fourteen genes were predicted targets for both miR-3470a and miR-3470b and each miRNA targeted two hubs in the Cnot2 network (Supplemental Fig. 39). miR-3470a and miR-3470b were therefore selected for validation as candidate metastasis-driver microRNAs.
In vivo validation of miR-3470a and miR-3470b as mouse-specific promoters of tumor progression
We initially turned to 67NR and 4T1 cells, two cell lines with distinct differences in metastatic potential, to verify the biological role of Mir3470a and Mir3470b in metastasis. Measurement of Mir3470a and Mir3470b expression by miR-Taqman qRT-PCR revealed that these miRNAs were more highly expressed in highly metastatic 4T1 cells than nonmetastatic 67NR cells (Supplemental Fig. 40), indicating that these miRNAs may be pro-metastatic.
As all previous in vivo analyses and Cnot2 network validation were conducted in 6DT1 cells, we next turned this cell line to test direct, causative effects of Mir3470a/b on network structure, gene expression, and tumor cell metastatic potential. We generated 6DT1 cells stably expressing Mir3470a and Mir3470b and confirmed Mir3470a/b expression by qRT-PCR, demonstrating sevenfold overexpression of Mir3470a and 88-fold overexpression of Mir3470b (Fig. 5A). Assessment of hub transcript expression levels upon Mir3470a overexpression demonstrated that three (Chac2, Dnpep, Arfrp1) of the nine tested hub transcripts predicted to be miR-3470a/b targets were down-regulated upon miR-3470a overexpression while seven (Ap2a2, Insig2, Chac2, Ddx46, Dnpep, Cnot8, Arfrp1) of the nine tested hub transcripts were down-regulated upon miR-3470b overexpression (Supplemental Fig. 41). Since miR-3470a and miR-3470b possess the same seed sequence—the 5′-end miRNA sequence thought to contribute most strongly to miRNA recognition of target transcripts—it is possible that the 10-fold difference in expression between Mir3470a- and Mir3470b-expressing cells explains the difference in predicted target down-regulation.
Figure 5.

Mir3470a and Mir3470b promote metastatic progression. (A) Stable transduction of Mir3470a and Mir3470b in 6DT1 cells. (B) Orthotopic implantation of 6DT1 cells overexpressing Mir3470a showed 40% increase in tumor mass (P = 0.014) and 230% increase in pulmonary metastasis (P = 0.0069). Overexpression of Mir3470b resulted in 213% increase in pulmonary metastasis (P = 0.088; ncontrol = 9 mice, nMir3470a = 10 mice, nMir-3470b = 10 mice). (C) Representative H&E stained lung sections from mice implanted with control or cells overexpressing Mir3470a/b. (*) P < 0.05, (**) P < 0.01.
In addition, Mir3470a and Mir3470b overexpression down-regulated multiple network hub genes within the Cnot2 module (Cnot2, Tmem101, Utp6, Exoc1, Polrmt, Ube2r2, and Angel2), only some of which are predicted to be miR-3470a/b targets (Supplemental Fig. 42). Intriguingly, Mir3470b overexpression appeared to have a unidirectional effect on previously identified metastasis susceptibility genes, up-regulating the pro-metastatic Brd4 short isoform (Brd4-SF) while down-regulating anti-metastatic genes: Brd4 long isoform (Brd4-LF), Rrp1b, and Cadm1 (Supplemental Fig. 43; Crawford et al. 2007, 2008a; Alsarraj et al. 2011; Faraji et al. 2012). Consistent with the correlative data in 67NR and 4T1 cells, the negative regulatory effect of Mir3470a/b on Cnot2 module transcripts and the changes in expression of previously identified metastasis susceptibility genes were suggestive of a pro-metastatic role for Mir3470a/b.
We next implanted Mir3470a or Mir3470b overexpressing 6DT1 cells into syngeneic mice to test the direct effect of miR-3470a/b on tumor progression and metastasis. Orthotopic implantation of Mir3470a overexpressing 6DT1 cells into mammary fat pads of immune competent FVB/NJ mice resulted in mild but statistically significant enhancement in tumor mass and a dramatic increase in pulmonary metastases while Mir3470b overexpressing 6DT1 cells showed specific promotion of metastatic colonization (Fig. 5B,C). Consistent with gene expression correlation studies in 67NR and 4T1 cells, as well as expression impact on the Cnot2 module, these in vivo results confirm Mir3470a as a promoter of tumor progression, and identify Mir3470b as a metasta-miR (Hurst et al. 2009).
Discussion
The systems genetics analysis performed here provides a view of the transcriptional networks and corresponding post-transcriptional regulatory mechanisms driving metastatic breast cancer. Rather than just attempting to identify single genes acting in metastasis, we undertook a higher-order approach to gain insight into the transcriptional profiles potentially driving metastatic susceptibility by emphasizing connectivity and transcript-level interactions (Fig. 6A). Networks of co-expressed genes derived from global expression profiling of [AKXDn × PyMT]F1 primary tumors were identified agnostic to the metastatic phenotypes observed in the parental strains or RI panel sublines. This approach allowed for unbiased, genome-wide isolation of all biologically relevant co-expressed transcriptional modules. Each module was then simultaneously tested for association with metastasis and human clinical significance by deriving module gene signatures and applying them to independent expression-level patient data sets of node-negative nonadjuvant treated breast cancer with associated clinical endpoints. Our strategy, based on mRNA and miRNA expression in primary tumors, identified both metastasis-driving genes and miRNAs, further supporting a paradigm in which transcription programs within the primary tumor are determinants of metastatic progression (van de Vijver et al. 2002; Ramaswamy et al. 2003). In addition to describing a novel approach to the identification of disease-specific heritable susceptibility transcription modules, the networks themselves provide a resource for selecting and prioritizing genes and miRNAs for analysis, based on position, connectivity, and number of potential target genes.
Figure 6.

Integration of systems genetics analysis. (A) Circos integration of global transcript and miRNA profiling analyses. From periphery inward: clockwise proximal to distal chromosomal positioning (blue), (1) mRNAs showing statistically significant eQTL peaks (red peaks), (2) mRNAs with expression significantly associated with metastatic propensity (blue peaks), (3) hub transcripts encompassed within eQTL intervals (black peaks), (4) miRNAs encompassed within miR-eQTL intervals (green peaks), (5) miRNAs with metastasis-associated expression (pink peaks), (7) miRNAs predicted to target highly connected network hubs (blue line links miRNA and its predicted target mRNA, red point indicates mRNA position). Genes labeled in purple indicate module central nodes. Genes labeled in green indicate hub transcripts with predicted miR-3470b MREs that are down-regulated upon Mir3470b overexpression. miRNAs shown to have a causal role in metastasis are indicated in blue. Peak lengths are in −log10 P-value. Please refer to Supplemental Figure 44 for a detailed high-resolution version. (B) Proposed model for murine metastatic progression. Global genome hypomethylation associated with neoplastic transformation results in the DNA demethylation and transcriptional activation of short interspersed elements (SINEs) including Mir3470b. Mir3470b expression down-regulates metastasis suppressive genes and the metastatic progression inhibitory Cnot2 network while concurrently up-regulating the metastasis promoting Brd4-SF, driving metastatic progression.
The Ndn module, for example, incorporated four previously identified metastasis susceptibility genes (Ndn, Pi16, Arap3, Csf1r). The Cnot2 module also contained at least four previously identified regulators of tumor progression: the metastasis susceptibility gene, Arid4b, its protein interaction partner, Sin3a, Luc7l, and the antiproliferative cell cycle component Btg2 (Crawford et al. 2008b; Takahashi et al. 2011; Winter et al. 2012; Das et al. 2013). Our laboratory validated the direct role of both Arid4b and Luc7l using genetic and in vivo modeling of metastasis (Crawford et al. 2008b; Winter et al. 2012). Since expression modules were identified by unsupervised clustering of array data, the incidental membership of bona fide metastasis modifier genes within these networks provide another measure of confidence in our method for identifying potential transcription networks that may drive metastatic susceptibility. Based on the reproducibility of the prognostic power of the Cnot2 module we chose to investigate Cnot2 as both a potential metastasis modifier gene and a factor contributing to the establishment of the transcriptional network module.
Cnot2 is a core component of the CCR4–NOT complex, a multifunctional protein complex that is highly conserved in Eukarya. It has been reported to have transcriptional regulatory, deadenylase, ubiquitin ligase, and chromatin modifying activities (Collart and Panasenko 2012). It is additionally thought to play an essential role in miRNA-mediated transcript repression by destabilizing miRNA-bound target transcripts (Behm-Ansmant et al. 2006). CCR4–NOT complex subunit 2, Cnot2, was originally identified as a negative regulator of transcription in yeast (Collart and Struhl 1994). Although Cnot2 has not been reported to have any enzymatic activity, it has been shown to be necessary for the CCR4–NOT deadenylase activity in mammalian cells (Ito et al. 2011). Moreover, studies indicate the contribution of Cnot2 to cellular viability (Ito et al. 2011) as well as differentiation state (Zheng et al. 2012), both thought to play critical cellular functions in the metastatic cascade (Luzzi et al. 1998; Kouros-Mehr et al. 2008). In yeast Cnot2 was observed to repress specific gene transcription in a histone deacetylase-dependent manner (Jayne et al. 2006) as well as to promote resumption of transcriptional elongation likely by binding directly to RNA polymerase II (Kruk et al. 2011). Intriguingly, Cnot2 has also been reported to physically interact with the metastasis-associated proteins BRD4 (which incidentally is a member of the Polr2g module) and TPX2 (Crawford et al. 2008a; Lau et al. 2009; Hu et al. 2012), raising the possibility that these proteins act in complex to modify tumor cell metastatic potential. All of these activities and associations are under current investigation as potential mechanisms that contribute to the regulation of the Cnot2 module and Cnot2-mediated metastatic suppression as observed in the present study. Nonetheless, the identification of Cnot2 as an inhibitor of tumor progression represents a significant finding as it links an entirely novel protein complex as a determinant of metastasis.
Further, we show by two distinct methods that miRNAs have functional regulatory roles in networks of heritable metastasis susceptibility: (1) Metastasis-suppressing miRNAs possess cis-eQTLs, indicative of heritable miRNA expression levels, and (2) miRNAs can target heritably derived metastasis-driving transcriptional networks. Two independent analyses identified several novel heritable metastatic susceptibility miRNA genes (Mir216a, Mir216b, Mir217, Mir3470a, Mir3470b). The discrepant effects on tumor progression of the Mir216/217 cluster between 6DT1 and 4T1 cells is under investigation but is likely attributable to differences in expressed genes between these cell lines. 6DT1 cells were derived from a MMTV–MYC transgenic tumor (Pei et al. 2004) with a gene expression profile resembling luminal-like human breast tumors (Lim et al. 2010) while 4T1 cells are derived from a spontaneous tumor in BALB/c mice with an expression profile resembling basal-like human breast tumors (Kaur et al. 2012). As such, 6DT1 and 4T1 cells contain major transcriptomic differences (JE Green, unpubl.) and therefore likely express different subsets of miR-216/217 target transcripts, which could account for differences observed in tumor progression phenotypes. Our results are consistent with the notion that these miRNAs regulate numerous genes that promote tumor progression and which may be expressed differentially in different metastatic tumors. Notably, miR-216b and miR-217 have previously been implicated as inhibitors of tumor growth and invasion in nasopharyngeal, renal clear cell, and pancreatic ductal carcinoma (Deng et al. 2011; Ali et al. 2012; Li et al. 2013b). Further, each member of the Mir216/217 cluster was demonstrated to possess a significant cis-acting eQTL, indicating that differences in Mir216/217 expression across the AKXD RI panel are inherited and not acquired somatically during neoplastic transformation or tumor progression.
In contrast miR-3470a/b were selected to validate our combined small RNA sequencing and mRNA profiling approach. We surmised that the relative overrepresentation of miR-3470a/b targets in our transcription networks would render these miRNAs the most powerful in testing the validity of our miRNA–mRNA integrated network approach. Although miR-3470a/b were identified by target prediction analysis by combining all metastasis-associated network transcripts, their role in metastasis may be in part mediated by direct or indirect targeting of previously identified metastasis susceptibility genes (Brd4, Rrp1b, Cadm1), genes within the Cnot2 network, genes within all networks constructed here, or a combination of the above. Despite no conserved human homolog to these murine miRNAs, their effect on transcriptional networks conserved among mice and humans validates our approach of integrating network analysis and miR-seq data and provides another line of evidence for the potential functional role of our statistical correlation-based expression networks in tumor progression.
A closer look at the genomic context of Mir3470a/b reveals that both are degenerated B1-type short interspersed nuclear elements (SINEs), which are thought to be predominantly silenced in adult cell types largely by DNA methylation (Su et al. 2012). This is consistent with the initial report identifying miR-3470a and miR-3470b showing that its expression is restricted to the gonads (Ahn et al. 2010). There is also accumulating evidence supporting observations of global DNA hypomethylation in cancer (Feinberg and Vogelstein 1983), with the most comprehensive genome-wide, nucleotide-level data available for breast cancer (Hon et al. 2012), and that the resulting hypomethylation leads to expression of repetitive elements (Florl et al. 1999). Given these observations, we propose that murine tumorigenesis leads to hypomethylation and expression of repetitive elements including Mir3470a/b, which drive tumor progression and metastasis (Fig. 6B). It remains unclear whether hypomethylation is a somatic or heritable event, but the strength of the effect by which Mir3470a/b can drive tumor progression may depend on heritable expression levels of metastasis susceptibility networks described in the current study and/or previously described susceptibility genes.
The networks described here represent statistically associated sets of expressed genes and therefore are likely partial representations of the true transcriptional structure underlying metastatic disease. Like the prognostic gene signatures, the exact structure and membership of the metastasis-associated transcriptional network will likely change somewhat as additional samples and analyses are performed (Ein-Dor et al. 2006). Encouragingly, significant overlap of seven of the AKXD modules has been observed in TOM analysis of an independent mapping cross (P-values 0.001–6 × 10⁻¹²) (K Hunter, Y Hu, J Zhang, unpubl.), indicating that at least some portion of the network will be stable. These results also suggest that a similar analysis performed on a much larger sample set, derived for example from the use of the new Collaborative Cross mouse genetic mapping resource (Churchill et al. 2004), will improve this higher-order analysis of the susceptibility mechanisms associated with metastatic breast cancer and identify novel and more robust targets for clinical intervention. Although significant work remains to understand the details uncovered in this study, the observations presented here not only support our strategy of identifying higher-order transcriptional structure but also highlight that such approaches are essential for acquiring a broad-scale understanding of tumor progression.
Methods
Gene expression and small RNA sequencing
Affymetrix MOE430 gene expression analysis was performed as previously described (Yang et al. 2005). Total RNA was isolated from two to four tumors from each of the [AKXD × PyMT]F1 outcrosses; due to availability constraints of AKXD RI panel animals, only 18 of the 24 sublines were crossed to MMTV-PyMT mice. Where possible the same tumors used for the MOE430 expression analysis were selected for small RNA sequencing. Total RNA was extracted from the mammary tissues using the mirVana miRNA Isolation Kit (Ambion). Each RNA sample was applied to the Nanodrop 1000 Spectrophotometer (Thermo Scientific) to calculate sample concentration and purity. All samples displayed a 260/280 ratio >2.0 with a small portion having a 260/230 ratio <2.0. Samples were further analyzed for integrity using the Agilent 2100 Bioanalyzer. Equal amounts of total RNA were pooled for each of the genotypes within the AKXD RI × PyMT panel then size selected for small RNA species before sequencing. The NCI Next Generation Sequencing Core performed enrichment of small RNA and sequencing on Illumina GA IIx.
Network analysis
We used an R package “weighted correlation network analysis (WGCNA)” (Langfelder and Horvath 2008) to find clusters (modules) of highly correlated genes on AKXD mRNA expression array data sets: GSE30864, GSE30865, GSE30866, GSE31223. The network for each module was generated with the minimum spanning tree with a dissimilarity matrix from WGCNA. Hub transcripts were determined by links (degree of freedom) ≥5. This study utilized the high-performance computational capabilities of the Biowulf Linux cluster at the National Institutes of Health, Bethesda, MD (http://biowulf.nih.gov).
eQTL analysis
eQTL analysis was performed with R package qtl. Expression levels of all significantly expressed miRNAs were compared with the genetic map using an R/QTL package (Broman et al. 2003) and genome-wide significance levels determined by a bootstrap permutation test (1000 permutations) using both the permutation tail probability test and the one-sided P-value test. The permutation tests were based on resampling with samples drawn without replacement from the pooled sample set. The observed value T(obs) of the test statistic was calculated and the observations/samples were pooled. Next the set of the statistic values were calculated by resampling each sample. For example, for 10,000 permutations, 9999 statistic values were calculated. Finally, the one-sided P-value of the test was then calculated as the proportion of sampled permutations where the difference in means was greater than or equal to T(obs). The genome-wide statistical threshold was set at 0.05.
MiRNA–phenotype correlation analysis was conducted using the R package glm.
Correlation of microRNA abundance with gene expression
Correlation analysis between the expression of microRNA and targeted genes was performed for all pairs of genes and micoRNAs, then filtered by the genes predicted as the putative targets of a particular microRNA. Targets were predicted from three of four databases: PITA (Witkos et al. 2011), miRBase (Griffiths-Jones et al. 2006), TargetScan, and miRanda (Miranda et al. 2006). The association of the expression between miRNAs and their target genes was analyzed with R packge glm. The significant associations were determined by a bootstrap permutation test (10,000 times and P-value < 0.01). For genes whose expression significantly correlated with microRNA expression, a gene set enrichment analysis (GSEA) was performed by a hypergeometric test in R.
Animal studies
Female FVB/NJ or Balb/cJ mice from Jackson Laboratories were injected at 6-8 wk of age. Two days prior to orthotopic injections, cells were placed in nonselective media. On the day of injection, 1 × 10⁵ cells were injected orthotopically into the fourth mammary fat pad of age-matched, syngeneic, immune competent virgin females. After 30 d the mice were euthanized by intraperitoneal injection of 1 mL Tribromoethanol with subsequent cervical dislocation. Primary tumors were resected, weighed, and snap-frozen in liquid nitrogen. Lungs were resected, surface metastases were counted; lungs were inflated with 10% nitrate-buffered formalin and sent for sectioning and staining. All procedures were performed under the Animal Safety Proposal (LCBG-004) and approved by the NCI-Bethesda Animal Care and Use Committee.
Data access
The AKXD small RNA sequencing data from this study have been submitted to the NCBI Gene Expression Omnibus (GEO; http://www.ncbi.nlm.nih.gov/geo/) under accession number GSE50179.
Acknowledgments
We thank Jude Alsarraj, Thomas R. Geiger, Jeffrey E. Green, Ngoc-Han Ha, and James J. Morrow for critical review of this manuscript and stimulating discussion. We thank Dominic Esposito of the Protein Expression Laboratory, SAIC-Frederick, for constructing the myc-Cnot2 expression vector. This research was supported by the Intramural Research Program of the NIH, National Cancer Institute, Center for Cancer Research and the Howard Hughes Medical Institute Research Scholars Program.
Author contributions: All experiments were conceived by F.F. and K.W.H. Experiments were conducted by F.F. and N.E.G. with technical assistance from R.C.W. Computational analysis was performed by Y.H., G.W., and J.Z. The manuscript was written by F.F. and K.W.H.
Footnotes
[Supplemental material is available for this article.]
Article published online before print. Article, supplemental material, and publication date are at http://www.genome.org/cgi/doi/10.1101/gr.166223.113.
References
- Ahn HW, Morin RD, Zhao H, Harris RA, Coarfa C, Chen ZJ, Milosavljevic A, Marra MA, Rajkovic A 2010. MicroRNA transcriptome in the newborn mouse ovaries determined by massive parallel sequencing. Mol Hum Reprod 16: 463–471 [DOI] [PMC free article] [PubMed] [Google Scholar]
- Ali S, Banerjee S, Logna F, Bao B, Philip PA, Korc M, Sarkar FH 2012. Inactivation of Ink4a/Arf leads to deregulated expression of miRNAs in K-Ras transgenic mouse model of pancreatic cancer. J Cell Physiol 227: 3373–3380 [DOI] [PMC free article] [PubMed] [Google Scholar] [Retracted]
- Alsarraj J, Walker RC, Webster JD, Geiger TR, Crawford NP, Simpson RM, Ozato K, Hunter KW 2011. Deletion of the proline-rich region of the murine metastasis susceptibility gene Brd4 promotes epithelial-to-mesenchymal transition- and stem cell-like conversion. Cancer Res 71: 3121–3131 [DOI] [PMC free article] [PubMed] [Google Scholar]
- Aslakson CJ, Miller FR 1992. Selective events in the metastatic process defined by analysis of the sequential dissemination of subpopulations of a mouse mammary tumor. Cancer Res 52: 1399–1405 [PubMed] [Google Scholar]
- Bao L, Hazari S, Mehra S, Kaushal D, Moroz K, Dash S 2012. Increased expression of P-glycoprotein and doxorubicin chemoresistance of metastatic breast cancer is regulated by miR-298. Am J Pathol 180: 2490–2503 [DOI] [PMC free article] [PubMed] [Google Scholar]
- Behm-Ansmant I, Rehwinkel J, Doerks T, Stark A, Bork P, Izaurralde E 2006. mRNA degradation by miRNAs and GW182 requires both CCR4:NOT deadenylase and DCP1:DCP2 decapping complexes. Genes Dev 20: 1885–1898 [DOI] [PMC free article] [PubMed] [Google Scholar]
- Bockhorn J, Yee K, Chang YF, Prat A, Huo D, Nwachukwu C, Dalton R, Huang S, Swanson KE, Perou CM, et al. 2013. MicroRNA-30c targets cytoskeleton genes involved in breast cancer cell invasion. Breast Cancer Res Treat 137: 373–382 [DOI] [PMC free article] [PubMed] [Google Scholar]
- Broman KW, Wu H, Sen S, Churchill GA 2003. R/qtl: QTL mapping in experimental crosses. Bioinformatics 19: 889–890 [DOI] [PubMed] [Google Scholar]
- Churchill GA, Airey DC, Allayee H, Angel JM, Attie AD, Beatty J, Beavis WD, Belknap JK, Bennett B, Berrettini W, et al. 2004. The Collaborative Cross, a community resource for the genetic analysis of complex traits. Nat Genet 36: 1133–1137 [DOI] [PubMed] [Google Scholar]
- Collart MA, Panasenko OO 2012. The Ccr4–Not complex. Gene 492: 42–53 [DOI] [PubMed] [Google Scholar]
- Collart MA, Struhl K 1994. NOT1(CDC39), NOT2(CDC36), NOT3, and NOT4 encode a global-negative regulator of transcription that differentially affects TATA-element utilization. Genes Dev 8: 525–537 [DOI] [PubMed] [Google Scholar]
- Crawford NP, Ziogas A, Peel DJ, Hess J, Anton-Culver H, Hunter KW 2006. Germline polymorphisms in SIPA1 are associated with metastasis and other indicators of poor prognosis in breast cancer. Breast Cancer Res 8: R16. [DOI] [PMC free article] [PubMed] [Google Scholar]
- Crawford NP, Qian X, Ziogas A, Papageorge AG, Boersma BJ, Walker RC, Lukes L, Rowe WL, Zhang J, Ambs S, et al. 2007. Rrp1b, a new candidate susceptibility gene for breast cancer progression and metastasis. PLoS Genet 3: e214. [DOI] [PMC free article] [PubMed] [Google Scholar]
- Crawford NP, Alsarraj J, Lukes L, Walker RC, Officewala JS, Yang HH, Lee MP, Ozato K, Hunter KW 2008a. Bromodomain 4 activation predicts breast cancer survival. Proc Natl Acad Sci 105: 6380–6385 [DOI] [PMC free article] [PubMed] [Google Scholar]
- Crawford NP, Walker RC, Lukes L, Officewala JS, Williams RW, Hunter KW 2008b. The Diasporin Pathway: A tumor progression-related transcriptional network that predicts breast cancer survival. Clin Exp Metastasis 25: 357–369 [DOI] [PMC free article] [PubMed] [Google Scholar]
- Das TK, Sangodkar J, Negre N, Narla G, Cagan RL 2013. Sin3a acts through a multi-gene module to regulate invasion in Drosophila and human tumors. Oncogene 32: 3184–3197 [DOI] [PMC free article] [PubMed] [Google Scholar]
- Deng M, Tang H, Zhou Y, Zhou M, Xiong W, Zheng Y, Ye Q, Zeng X, Liao Q, Guo X, et al. 2011. miR-216b suppresses tumor growth and invasion by targeting KRAS in nasopharyngeal carcinoma. J Cell Sci 124: 2997–3005 [DOI] [PubMed] [Google Scholar]
- Doss S, Schadt EE, Drake TA, Lusis AJ 2005. Cis-acting expression quantitative trait loci in mice. Genome Res 15: 681–691 [DOI] [PMC free article] [PubMed] [Google Scholar]
- Ein-Dor L, Zuk O, Domany E 2006. Thousands of samples are needed to generate a robust gene list for predicting outcome in cancer. Proc Natl Acad Sci 103: 5923–5928 [DOI] [PMC free article] [PubMed] [Google Scholar]
- Ezzeddine N, Chang TC, Zhu W, Yamashita A, Chen CY, Zhong Z, Yamashita Y, Zheng D, Shyu AB 2007. Human TOB, an antiproliferative transcription factor, is a poly(A)-binding protein-dependent positive regulator of cytoplasmic mRNA deadenylation. Mol Cell Biol 27: 7791–7801 [DOI] [PMC free article] [PubMed] [Google Scholar]
- Faraji F, Pang Y, Walker RC, Nieves Borges R, Yang L, Hunter KW 2012. Cadm1 is a metastasis susceptibility gene that suppresses metastasis by modifying tumor interaction with the cell-mediated immunity. PLoS Genet 8: e1002926. [DOI] [PMC free article] [PubMed] [Google Scholar]
- Farazi TA, Horlings HM, Ten Hoeve JJ, Mihailovic A, Halfwerk H, Morozov P, Brown M, Hafner M, Reyal F, van Kouwenhove M, et al. 2011. MicroRNA sequence and expression analysis in breast tumors by deep sequencing. Cancer Res 71: 4443–4453 [DOI] [PMC free article] [PubMed] [Google Scholar]
- Feinberg AP, Vogelstein B 1983. Hypomethylation distinguishes genes of some human cancers from their normal counterparts. Nature 301: 89–92 [DOI] [PubMed] [Google Scholar]
- Finak G, Bertos N, Pepin F, Sadekova S, Souleimanova M, Zhao H, Chen H, Omeroglu G, Meterissian S, Omeroglu A, et al. 2008. Stromal gene expression predicts clinical outcome in breast cancer. Nat Med 14: 518–527 [DOI] [PubMed] [Google Scholar]
- Florl AR, Lower R, Schmitz-Drager BJ, Schulz WA 1999. DNA methylation and expression of LINE-1 and HERV-K provirus sequences in urothelial and renal cell carcinomas. Br J Cancer 80: 1312–1321 [DOI] [PMC free article] [PubMed] [Google Scholar]
- Goldberger N, Walker RC, Kim CH, Winter S, Hunter KW 2013. Inherited variation in miR-290 expression suppresses breast cancer progression by targeting the metastasis susceptibility gene Arid4b. Cancer Res 73: 2671–2681 [DOI] [PMC free article] [PubMed] [Google Scholar]
- Gregory PA, Bert AG, Paterson EL, Barry SC, Tsykin A, Farshid G, Vadas MA, Khew-Goodall Y, Goodall GJ 2008. The miR-200 family and miR-205 regulate epithelial to mesenchymal transition by targeting ZEB1 and SIP1. Nat Cell Biol 10: 593–601 [DOI] [PubMed] [Google Scholar]
- Griffiths-Jones S, Grocock RJ, van Dongen S, Bateman A, Enright AJ 2006. miRBase: microRNA sequences, targets and gene nomenclature. Nucleic Acids Res 34: D140–D144 [DOI] [PMC free article] [PubMed] [Google Scholar]
- Guy CT, Cardiff RD, Muller WJ 1992. Induction of mammary tumors by expression of polyomavirus middle T oncogene: A transgenic mouse model for metastatic disease. Mol Cell Biol 12: 954–961 [DOI] [PMC free article] [PubMed] [Google Scholar]
- Haga CL, Phinney DG 2012. MicroRNAs in the imprinted DLK1-DIO3 region repress the epithelial-to-mesenchymal transition by targeting the TWIST1 protein signaling network. J Biol Chem 287: 42695–42707 [DOI] [PMC free article] [PubMed] [Google Scholar]
- Hon GC, Hawkins RD, Caballero OL, Lo C, Lister R, Pelizzola M, Valsesia A, Ye Z, Kuan S, Edsall LE, et al. 2012. Global DNA hypomethylation coupled to repressive chromatin domain formation and gene silencing in breast cancer. Genome Res 22: 246–258 [DOI] [PMC free article] [PubMed] [Google Scholar]
- Hsieh SM, Look MP, Sieuwerts AM, Foekens JA, Hunter KW 2009. Distinct inherited metastasis susceptibility exists for different breast cancer subtypes: A prognosis study. Breast Cancer Res 11: R75. [DOI] [PMC free article] [PubMed] [Google Scholar]
- Hu Y, Wu G, Rusch M, Lukes L, Buetow KH, Zhang J, Hunter KW 2012. Integrated cross-species transcriptional network analysis of metastatic susceptibility. Proc Natl Acad Sci 109: 3184–3189 [DOI] [PMC free article] [PubMed] [Google Scholar]
- Hu Y, Bai L, Geiger T, Goldberger N, Walker RC, Green JE, Wakefield LM, Hunter KW 2013. Genetic background may contribute to PAM50 gene expression breast cancer subtype assignments. PLoS ONE 8: e72287. [DOI] [PMC free article] [PubMed] [Google Scholar]
- Hui AB, Lin A, Xu W, Waldron L, Perez-Ordonez B, Weinreb I, Shi W, Bruce J, Huang SH, O'Sullivan B, et al. 2013. Potentially prognostic miRNAs in HPV-associated oropharyngeal carcinoma. Clin Cancer Res 19: 2154–2162 [DOI] [PubMed] [Google Scholar]
- Hunter KW, Broman KW, Voyer TL, Lukes L, Cozma D, Debies MT, Rouse J, Welch DR 2001. Predisposition to efficient mammary tumor metastatic progression is linked to the breast cancer metastasis suppressor gene Brms1. Cancer Res 61: 8866–8872 [PubMed] [Google Scholar]
- Hurst DR, Edmonds MD, Welch DR 2009. Metastamir: The field of metastasis-regulatory microRNA is spreading. Cancer Res 69: 7495–7498 [DOI] [PMC free article] [PubMed] [Google Scholar]
- Ito K, Inoue T, Yokoyama K, Morita M, Suzuki T, Yamamoto T 2011. CNOT2 depletion disrupts and inhibits the CCR4-NOT deadenylase complex and induces apoptotic cell death. Genes Cells 16: 368–379 [DOI] [PubMed] [Google Scholar]
- Jahid S, Sun J, Edwards RA, Dizon D, Panarelli NC, Milsom JW, Sikandar SS, Gumus ZH, Lipkin SM 2012. miR-23a promotes the transition from indolent to invasive colorectal cancer. Cancer Discov 2: 540–553 [DOI] [PMC free article] [PubMed] [Google Scholar]
- Jayne S, Zwartjes CG, van Schaik FM, Timmers HT 2006. Involvement of the SMRT/NCoR-HDAC3 complex in transcriptional repression by the CNOT2 subunit of the human Ccr4-Not complex. Biochem J 398: 461–467 [DOI] [PMC free article] [PubMed] [Google Scholar]
- Kaur P, Nagaraja GM, Zheng H, Gizachew D, Galukande M, Krishnan S, Asea A 2012. A mouse model for triple-negative breast cancer tumor-initiating cells (TNBC-TICs) exhibits similar aggressive phenotype to the human disease. BMC Cancer 12: 120. [DOI] [PMC free article] [PubMed] [Google Scholar]
- Kouros-Mehr H, Bechis SK, Slorach EM, Littlepage LE, Egeblad M, Ewald AJ, Pai SY, Ho IC, Werb Z 2008. GATA-3 links tumor differentiation and dissemination in a luminal breast cancer model. Cancer Cell 13: 141–152 [DOI] [PMC free article] [PubMed] [Google Scholar]
- Kruk JA, Dutta A, Fu J, Gilmour DS, Reese JC 2011. The multifunctional Ccr4-Not complex directly promotes transcription elongation. Genes Dev 25: 581–593 [DOI] [PMC free article] [PubMed] [Google Scholar]
- Kuo YZ, Tai YH, Lo HI, Chen YL, Cheng HC, Fang WY, Lin SH, Yang CL, Tsai ST, Wu LW 2013. MiR-99a exerts anti-metastasis through inhibiting myotubularin-related protein 3 expression in oral cancer. Oral Dis. doi: 10.1111/odi.12133 [DOI] [PubMed] [Google Scholar]
- Lancaster M, Rouse J, Hunter KW 2005. Modifiers of mammary tumor progression and metastasis on mouse chromosomes 7, 9, and 17. Mamm Genome 16: 120–126 [DOI] [PubMed] [Google Scholar]
- Langfelder P, Horvath S 2008. WGCNA: An R package for weighted correlation network analysis. BMC Bioinformatics 9: 559. [DOI] [PMC free article] [PubMed] [Google Scholar]
- Lau NC, Kolkman A, van Schaik FM, Mulder KW, Pijnappel WW, Heck AJ, Timmers HT 2009. Human Ccr4-Not complexes contain variable deadenylase subunits. Biochem J 422: 443–453 [DOI] [PubMed] [Google Scholar]
- Lewis BP, Burge CB, Bartel DP 2005. Conserved seed pairing, often flanked by adenosines, indicates that thousands of human genes are microRNA targets. Cell 120: 15–20 [DOI] [PubMed] [Google Scholar]
- Li A, Horvath S 2009. Network module detection: Affinity search technique with the multi-node topological overlap measure. BMC Res Notes 2: 142. [DOI] [PMC free article] [PubMed] [Google Scholar]
- Li Y, Zhang M, Chen H, Dong Z, Ganapathy V, Thangaraju M, Huang S 2010. Ratio of miR-196s to HOXC8 messenger RNA correlates with breast cancer cell migration and metastasis. Cancer Res 70: 7894–7904 [DOI] [PMC free article] [PubMed] [Google Scholar]
- Li H, Yin C, Zhang B, Sun Y, Shi L, Liu N, Liang S, Lu S, Liu Y, Zhang J, et al. 2013a. PTTG1 promotes migration and invasion of human non-small cell lung cancer cells and is modulated by miR-186. Carcinogenesis 34: 2145–2155 [DOI] [PubMed] [Google Scholar]
- Li H, Zhao J, Zhang JW, Huang QY, Huang JZ, Chi LS, Tang HJ, Liu GQ, Zhu DJ, Ma WM 2013b. MicroRNA-217, down-regulated in clear cell renal cell carcinoma and associated with lower survival, suppresses cell proliferation and migration. Neoplasma 60: 511–515 [DOI] [PubMed] [Google Scholar]
- Li J, Song Y, Wang Y, Luo J, Yu W 2013c. MicroRNA-148a suppresses epithelial-to-mesenchymal transition by targeting ROCK1 in non-small cell lung cancer cells. Mol Cell Biochem 380: 277–282 [DOI] [PubMed] [Google Scholar]
- Li X, Liu X, Xu W, Zhou P, Gao P, Jiang S, Lobie PE, Zhu T 2013d. c-MYC-regulated miR-23a/24-2/27a cluster promotes mammary carcinoma cell invasion and hepatic metastasis by targeting Sprouty2. J Biol Chem 288: 18121–18133 [DOI] [PMC free article] [PubMed] [Google Scholar]
- Liang S, He L, Zhao X, Miao Y, Gu Y, Guo C, Xue Z, Dou W, Hu F, Wu K, et al. 2011. MicroRNA let-7f inhibits tumor invasion and metastasis by targeting MYH9 in human gastric cancer. PLoS ONE 6: e18409. [DOI] [PMC free article] [PubMed] [Google Scholar]
- Lifsted T, Le Voyer T, Williams M, Muller W, Klein-Szanto A, Buetow KH, Hunter KW 1998. Identification of inbred mouse strains harboring genetic modifiers of mammary tumor age of onset and metastatic progression. Int J Cancer 77: 640–644 [DOI] [PubMed] [Google Scholar]
- Lim E, Wu D, Pal B, Bouras T, Asselin-Labat ML, Vaillant F, Yagita H, Lindeman GJ, Smyth GK, Visvader JE 2010. Transcriptome analyses of mouse and human mammary cell subpopulations reveal multiple conserved genes and pathways. Breast Cancer Res 12: R21. [DOI] [PMC free article] [PubMed] [Google Scholar]
- Liu CJ, Shen WG, Peng SY, Cheng HW, Kao SY, Lin SC, Chang KW 2013. miR-134 induces oncogenicity and metastasis in head and neck carcinoma through targeting WWOX gene. Int J Cancer 134: 811–821 [DOI] [PubMed] [Google Scholar]
- Lukes L, Crawford NP, Walker R, Hunter KW 2009. The origins of breast cancer prognostic gene expression profiles. Cancer Res 69: 310–318 [DOI] [PMC free article] [PubMed] [Google Scholar]
- Luzzi KJ, MacDonald IC, Schmidt EE, Kerkvliet N, Morris VL, Chambers AF, Groom AC 1998. Multistep nature of metastatic inefficiency: Dormancy of solitary cells after successful extravasation and limited survival of early micrometastases. Am J Pathol 153: 865–873 [DOI] [PMC free article] [PubMed] [Google Scholar]
- Miranda KC, Huynh T, Tay Y, Ang YS, Tam WL, Thomson AM, Lim B, Rigoutsos I 2006. A pattern-based method for the identification of microRNA binding sites and their corresponding heteroduplexes. Cell 126: 1203–1217 [DOI] [PubMed] [Google Scholar]
- Mucenski ML, Taylor BA, Jenkins NA, Copeland NG 1986. AKXD recombinant inbred strains: Models for studying the molecular genetic basis of murine lymphomas. Mol Cell Biol 6: 4236–4243 [DOI] [PMC free article] [PubMed] [Google Scholar]
- Park YG, Zhao X, Lesueur F, Lowy DR, Lancaster M, Pharoah P, Qian X, Hunter KW 2005. Sipa1 is a candidate for underlying the metastasis efficiency modifier locus Mtes1. Nat Genet 37: 1055–1062 [DOI] [PMC free article] [PubMed] [Google Scholar]
- Pei XF, Noble MS, Davoli MA, Rosfjord E, Tilli MT, Furth PA, Russell R, Johnson MD, Dickson RB 2004. Explant-cell culture of primary mammary tumors from MMTV-c-Myc transgenic mice. In Vitro Cell Dev Biol Anim 40: 14–21 [DOI] [PubMed] [Google Scholar]
- Pencheva N, Tavazoie SF 2013. Control of metastatic progression by microRNA regulatory networks. Nat Cell Biol 15: 546–554 [DOI] [PMC free article] [PubMed] [Google Scholar]
- Perou CM, Sorlie T, Eisen MB, van de Rijn M, Jeffrey SS, Rees CA, Pollack JR, Ross DT, Johnsen H, Akslen LA, et al. 2000. Molecular portraits of human breast tumours. Nature 406: 747–752 [DOI] [PubMed] [Google Scholar]
- Pillutla RC, Yue Z, Maldonado E, Shatkin AJ 1998. Recombinant human mRNA cap methyltransferase binds capping enzyme/RNA polymerase IIo complexes. J Biol Chem 273: 21443–21446 [DOI] [PubMed] [Google Scholar]
- Quigley DA, To MD, Perez-Losada J, Pelorosso FG, Mao JH, Nagase H, Ginzinger DG, Balmain A 2009. Genetic architecture of mouse skin inflammation and tumour susceptibility. Nature 458: 505–508 [DOI] [PMC free article] [PubMed] [Google Scholar]
- Ramaswamy S, Ross KN, Lander ES, Golub TR 2003. A molecular signature of metastasis in primary solid tumors. Nat Genet 33: 49–54 [DOI] [PubMed] [Google Scholar]
- Ringner M, Fredlund E, Hakkinen J, Borg A, Staaf J 2011. GOBO: Gene expression-based outcome for breast cancer online. PLoS ONE 6: e17911. [DOI] [PMC free article] [PubMed] [Google Scholar]
- Rutnam ZJ, Yang BB 2012. The non-coding 3′UTR of CD44 induces metastasis by regulating extracellular matrix functions. J Cell Sci 125: 2075–2085 [DOI] [PubMed] [Google Scholar]
- Schadt EE, Monks SA, Drake TA, Lusis AJ, Che N, Colinayo V, Ruff TG, Milligan SB, Lamb JR, Cavet G, et al. 2003. Genetics of gene expression surveyed in maize, mouse and man. Nature 422: 297–302 [DOI] [PubMed] [Google Scholar]
- Schmidt M, Bohm D, von Torne C, Steiner E, Puhl A, Pilch H, Lehr HA, Hengstler JG, Kolbl H, Gehrmann M 2008. The humoral immune system has a key prognostic impact in node-negative breast cancer. Cancer Res 68: 5405–5413 [DOI] [PubMed] [Google Scholar]
- Su J, Shao X, Liu H, Liu S, Wu Q, Zhang Y 2012. Genome-wide dynamic changes of DNA methylation of repetitive elements in human embryonic stem cells and fetal fibroblasts. Genomics 99: 10–17 [DOI] [PubMed] [Google Scholar]
- Subramanian A, Tamayo P, Mootha VK, Mukherjee S, Ebert BL, Gillette MA, Paulovich A, Pomeroy SL, Golub TR, Lander ES, et al. 2005. Gene set enrichment analysis: A knowledge-based approach for interpreting genome-wide expression profiles. Proc Natl Acad Sci 102: 15545–15550 [DOI] [PMC free article] [PubMed] [Google Scholar]
- Takagaki Y, Manley JL 2000. Complex protein interactions within the human polyadenylation machinery identify a novel component. Mol Cell Biol 20: 1515–1525 [DOI] [PMC free article] [PubMed] [Google Scholar]
- Takahashi F, Chiba N, Tajima K, Hayashida T, Shimada T, Takahashi M, Moriyama H, Brachtel E, Edelman EJ, Ramaswamy S, et al. 2011. Breast tumor progression induced by loss of BTG2 expression is inhibited by targeted therapy with the ErbB/HER inhibitor lapatinib. Oncogene 30: 3084–3095 [DOI] [PubMed] [Google Scholar]
- Tavazoie S, Hughes JD, Campbell MJ, Cho RJ, Church GM 1999. Systematic determination of genetic network architecture. Nat Genet 22: 281–285 [DOI] [PubMed] [Google Scholar]
- Tavazoie SF, Alarcon C, Oskarsson T, Padua D, Wang Q, Bos PD, Gerald WL, Massague J 2008. Endogenous human microRNAs that suppress breast cancer metastasis. Nature 451: 147–152 [DOI] [PMC free article] [PubMed] [Google Scholar]
- Uchino K, Takeshita F, Takahashi RU, Kosaka N, Fujiwara K, Naruoka H, Sonoke S, Yano J, Sasaki H, Nozawa S et al. 2013. Therapeutic effects of microRNA-582-5p and -3p on the inhibition of bladder cancer progression. Mol Ther 21: 610–619 [DOI] [PMC free article] [PubMed] [Google Scholar]
- Valastyan S, Reinhardt F, Benaich N, Calogrias D, Szasz AM, Wang ZC, Brock JE, Richardson AL, Weinberg RA 2009. A pleiotropically acting microRNA, miR-31, inhibits breast cancer metastasis. Cell 137: 1032–1046 [DOI] [PMC free article] [PubMed] [Google Scholar] [Retracted]
- Valencia K, Martin-Fernandez M, Zandueta C, Ormazabal C, Martinez-Canarias S, Bandres E, de la Piedra C, Lecanda F 2013. miR-326 associates with biochemical markers of bone turnover in lung cancer bone metastasis. Bone 52: 532–539 [DOI] [PubMed] [Google Scholar]
- van de Vijver MJ, He YD, van 't Veer LJ, Dai H, Hart AA, Voskuil DW, Schreiber GJ, Peterse JL, Roberts C, Marton MJ, et al. 2002. A gene-expression signature as a predictor of survival in breast cancer. N Engl J Med 347: 1999–2009 [DOI] [PubMed] [Google Scholar]
- van 't Veer LJ, Dai H, van de Vijver MJ, He YD, Hart AA, Mao M, Peterse HL, van der Kooy K, Marton MJ, Witteveen AT, et al. 2002. Gene expression profiling predicts clinical outcome of breast cancer. Nature 415: 530–536 [DOI] [PubMed] [Google Scholar]
- Wang Y, Klijn JG, Zhang Y, Sieuwerts AM, Look MP, Yang F, Talantov D, Timmermans M, Meijer-van Gelder ME, Yu J, et al. 2005. Gene-expression profiles to predict distant metastasis of lymph-node-negative primary breast cancer. Lancet 365: 671–679 [DOI] [PubMed] [Google Scholar]
- Winter SF, Lukes L, Walker RC, Welch DR, Hunter KW 2012. Allelic variation and differential expression of the mSIN3A histone deacetylase complex gene Arid4b promote mammary tumor growth and metastasis. PLoS Genet 8: e1002735. [DOI] [PMC free article] [PubMed] [Google Scholar]
- Witkos TM, Koscianska E, Krzyzosiak WJ 2011. Practical aspects of microRNA target prediction. Curr Mol Med 11: 93–109 [DOI] [PMC free article] [PubMed] [Google Scholar]
- Yang H, Crawford N, Lukes L, Finney R, Lancaster M, Hunter KW 2005. Metastasis predictive signature profiles pre-exist in normal tissues. Clin Exp Metastasis 22: 593–603 [DOI] [PMC free article] [PubMed] [Google Scholar]
- Yang H, Fang F, Chang R, Yang L 2013a. MicroRNA-140-5p suppresses tumor growth and metastasis by targeting transforming growth factor β receptor 1 and fibroblast growth factor 9 in hepatocellular carcinoma. Hepatology 58: 205–217 [DOI] [PubMed] [Google Scholar]
- Yang Z, Zhang Y, Wang L 2013b. A feedback inhibition between miRNA-127 and TGFβ/c-Jun cascade in HCC cell migration via MMP13. PLoS ONE 8: e65256. [DOI] [PMC free article] [PubMed] [Google Scholar]
- Ying Q, Liang L, Guo W, Zha R, Tian Q, Huang S, Yao J, Ding J, Bao M, Ge C, et al. 2011. Hypoxia-inducible microRNA-210 augments the metastatic potential of tumor cells by targeting vacuole membrane protein 1 in hepatocellular carcinoma. Hepatology 54: 2064–2075 [DOI] [PubMed] [Google Scholar]
- Zheng X, Dumitru R, Lackford BL, Freudenberg JM, Singh AP, Archer TK, Jothi R, Hu G 2012. Cnot1, Cnot2, and Cnot3 maintain mouse and human ESC identity and inhibit extraembryonic differentiation. Stem Cells 30: 910–922 [DOI] [PMC free article] [PubMed] [Google Scholar]
- Zhou J, Wang W 2011. Analysis of microRNA expression profiling identifies microRNA-503 regulates metastatic function in hepatocellular cancer cell. J Surg Oncol 104: 278–283 [DOI] [PubMed] [Google Scholar]