

Abstract
Comprehensive sequencing of human cancers has identified recurrent mutations in genes encoding chromatin regulatory proteins. For clear cell renal cell carcinoma (ccRCC), three of the five commonly mutated genes encode the chromatin regulators PBRM1, SETD2, and BAP1. How these mutations alter the chromatin landscape and transcriptional program in ccRCC or other cancers is not understood. Here, we identified alterations in chromatin organization and transcript profiles associated with mutations in chromatin regulators in a large cohort of primary human kidney tumors. By associating variation in chromatin organization with mutations in SETD2, which encodes the enzyme responsible for H3K36 trimethylation, we found that changes in chromatin accessibility occurred primarily within actively transcribed genes. This increase in chromatin accessibility was linked with widespread alterations in RNA processing, including intron retention and aberrant splicing, affecting ∼25% of all expressed genes. Furthermore, decreased nucleosome occupancy proximal to misspliced exons was observed in tumors lacking H3K36me3. These results directly link mutations in SETD2 to chromatin accessibility changes and RNA processing defects in cancer. Detecting the functional consequences of specific mutations in chromatin regulatory proteins in primary human samples could ultimately inform the therapeutic application of an emerging class of chromatin-targeted compounds.
Large-scale cancer sequencing studies continue to identify mutations in genes encoding chromatin regulatory proteins in a wide variety of human cancers. The downstream molecular consequences of these mutations, however, remain unknown. Clear cell renal cell carcinoma (ccRCC) is a particularly relevant model for the study of chromatin regulation in cancer for several reasons. First, relative to mutations in other classes of genes, ccRCCs are marked by frequent mutation of chromatin regulators (Dalgliesh et al. 2010; Varela et al. 2011; Pena-Llopis et al. 2012; Ryan and Bernstein 2012). Three of the more commonly mutated genes in ccRCC include chromatin modifiers SETD2, PBRM1, and BAP1 (Dalgliesh et al. 2010; Varela et al. 2011; Pena-Llopis et al. 2012; Kapur et al. 2013), suggesting that alterations at the level of chromatin may play a prominent role in the development of ccRCC (Dalgliesh et al. 2010; Varela et al. 2011). Mutation-associated changes in chromatin organization may promote oncogenesis in novel ways, and it has been suggested that specific chromatin regulator mutations may confer differences in patient survival or associate with more advanced disease (Hakimi et al. 2012). However, the downstream effect of these mutations on tumor chromatin biology remains unknown. Second, this cancer is tightly associated with a distinct transcriptional program resulting from the inactivation of the von Hippel–Lindau (VHL) tumor suppressor gene (Kim and Kaelin 2004; Bratslavsky et al. 2007; Nickerson et al. 2008; Jonasch et al. 2012). The loss of VHL results in the stabilization of hypoxia inducible factors (HIFs), transcription factors that activate a complex program of downstream targets, including vascular endothelial growth factor (VEGF) and other genes (Gordan et al. 2008; Gore and Larkin 2011; Jonasch et al. 2012). Third, besides VHL and chromatin regulators, mutations in other cancer-associated pathways are generally absent from ccRCC tumors.
Elucidating the functional consequences of mutations in genes encoding chromatin regulatory proteins on chromatin organization and transcription in human tumor specimens requires the application of techniques developed for cultured cells to primary human tissues. Formaldehyde-assisted isolation of regulatory elements (FAIRE) interrogates chromatin accessibility by isolating nucleosome-depleted regions of DNA (Nagy et al. 2003; Hogan et al. 2006; Giresi et al. 2007; Giresi and Lieb 2009; Simon et al. 2012). These regions harbor regulatory elements such as active transcriptional start sites, transcriptional enhancers, insulators, silencers, and locus control regions (Hogan et al. 2006; Giresi et al. 2007; Giresi and Lieb 2009; Gaulton et al. 2010; Song et al. 2011; Simon et al. 2012). As a component of the ENCODE Project, FAIRE has been used to identify regulatory elements across a wide range of cell lines (Song et al. 2011; Thurman et al. 2012). However, the application of FAIRE to primary human tissue or to explore the association between chromatin and genetic alterations in cancer has yet to be evaluated.
We modified FAIRE for use on primary human clinical samples to define the chromatin landscape in a large cohort of ccRCC tumors and matched normal tissues. We identified tumor- and normal-kidney-specific classes of chromatin accessibility changes, as well as those associated with chromatin modifier mutations. We focused our study on SETD2, which trimethylates lysine-36 on histone H3 (H3K36me3) (Rayasam et al. 2003; Sun et al. 2005; Brown et al. 2006; Edmunds et al. 2008; Yoh et al. 2008; Duns et al. 2010). Associated with the RNA polymerase II complex, SETD2-dependent methylation tends to occur toward the 3′ ends of genes and over nucleosomes located at exons (Edmunds et al. 2008; Kolasinska-Zwierz et al. 2009; Schwartz et al. 2009). SETD2 and H3K36me3 seem to play a role in cotranscriptional RNA processing. In cell-culture-based studies, silencing of SETD2 or readers of H3K36me3 has been associated with differential exon inclusion for individual genes (Luco et al. 2010; Pradeepa et al. 2012) and alternative transcription start site utilization (Carvalho et al. 2013). However, the consequence of SETD2 deficiency on chromatin organization and RNA processing remains to be explored on a genome-wide scale and in a disease-relevant model. SETD2 is mutated in ∼12% of primary human ccRCC tumors and results in H3K36me3 deficiency (Gerlinger et al. 2012). A similar rate of SETD2 mutation has also been observed in high-grade gliomas (Fontebasso et al. 2013). A recent study of intratumor heterogeneity in ccRCC identified distinct SETD2 mutations in all subsections of the same tumor suggesting the importance of disrupting SETD2 function for a subset of tumors (Gerlinger et al. 2012).
We found that SETD2 mutation was associated with chromatin accessibility differences preferentially in gene bodies, and these genes frequently exhibited RNA processing defects. Nearly 25% of all expressed genes demonstrated aberrancies in splicing, including exon skipping, intron retention, and alternative transcription start and termination sites. We observed that misspliced exons were marked by a striking increase in chromatin accessibility immediately upstream of the aberrant splice and a loss of nucleosome occupancy directly over the exon. This study represents the first investigation of chromatin organization in human tumors to identify the impact of chromatin modifier mutations on the genomic landscape. Understanding chromatin dysregulation in cancer may ultimately inform the application of emerging classes of chromatin-targeted small molecules in renal cancer.
Results
Differences in chromatin accessibility between tumors and normal kidney tissue corroborate the underlying role of HIF in ccRCC
We performed FAIRE-seq on 42 primary ccRCC tumor samples as well as uninvolved matched normal kidney from seven of these patients (Supplemental Fig. S1A,B). We identified about 11,000 500-bp genomic intervals with differences in chromatin accessibility that discriminated tumors from normal kidney (two-sided t-test, P < 0.01) (Fig. 1A,B). For ∼70% of these regions, FAIRE signal was increased in the tumor samples, indicative of nucleosome depletion. Using hierarchical clustering, three clusters of genomic loci emerged: Two were marked by tumor-specific nucleosome depletion (Clusters 1 and 2), and another was characterized by nucleosome depletion in normal kidney tissue but not in tumors (Cluster 3). Virtually all tumors exhibited nucleosome depletion at the sites in Cluster 1, whereas ∼50% of tumors demonstrated FAIRE enrichment at regions in Cluster 2.
Figure 1.

Regions of tumor-specific nucleosome eviction identify the underlying role of HIF in ccRCC. (A) Hierarchical clustering of median-centered FAIRE signal in windows with significant differences between tumors and normal kidney (two-sided t-test, P < 0.01). (B) FAIRE-seq tracks for ccRCC (black) and uninvolved kidney (red) at two loci. (Blue) ChIP-seq signals (Schodel et al. 2011) from HIF1A, HIF2A, and ARNT. (C) The top five Gene Ontology associations (q < 1 × 10⁻⁵) with sites in Cluster 1 are shown. (D) Transcription factor binding motifs enriched in Cluster 1 compared with local background 500-bp flanking windows (>2.5-fold over background and present in at least 10% of the Cluster 1 windows). P-values relative to local background are shown. (E) Fraction of HIF1A and HIF2A binding sites (Schodel et al. 2011) that overlap the loci in Clusters 1, 2, and 3 compared with permuted controls. Errors bars represent standard deviation (SD).
We then examined each cluster for shared biological associations among the loci and adjacent genes. Regions in each cluster were associated with genes (GREAT) (McLean et al. 2010)). For sites in Cluster 1, 2274 genes were identified, many of which were members of several cancer-associated gene sets. Particularly interesting in the setting of ccRCC, where HIF transcription factor family stabilization and activation of hypoxia response genes is a central feature of this tumor type, we found that the most significantly associated genes in this cluster were involved in HIF activation and hypoxia regulation (Fig. 1C; full list of associations for each cluster in Supplemental Fig. S2). This association was not observed for regions in Cluster 2 or 3 (Supplemental Fig. S2). Analysis of the sequences in Cluster 1 identified several highly enriched transcription factor (TF) motifs (Heinz et al. 2010), including the hypoxia response element consensus binding sequence (Fig. 1D). We additionally found that previously identified HIF1A and HIF2A (EPAS1) binding sites (Schodel et al. 2011) only significantly overlapped loci in Cluster 1 (P < 0.001) (Fig. 1B,E). The detection of features associated with the hypoxia response through variation in chromatin accessibility is consistent with the unique link between HIF activity and ccRCC, and these results demonstrate the ability of FAIRE to detect central biological pathways through the identification variations in chromatin organization in an unbiased fashion.
SETD2 mutations link H3K36me3 loss with changes in chromatin accessibility
To identify mutations in chromatin modifiers within tumor samples, we genotyped 33 unique ccRCC tumors (from our cohort of 42 above) and the same seven matched normal kidney specimens (Supplemental Fig. S1A,B). We classified sequence variants based on predicted ability to confer severe protein structural changes, including frameshift, nonsense, and mutations altering an annotated splice site (“high severity”), as well as missense mutations (“moderate severity”) (Fig. 2A). Approximately half of the SETD2 mutations in these classes were predicted to disrupt the catalytic SET domain. High- and moderate-severity mutations were also observed in other domains in SETD2 including the SRI domain, which mediates the interaction with RNA polymerase II. A prediction of copy number using the genotyping data also revealed that with the exception of one tumor (which displayed one high- and one moderate-severity mutation) loss of heterozygosity coincided with mutations in SETD2 (Supplemental Fig. S4C).
Figure 2.

SETD2 mutations link H3K36me3 loss with changes in chromatin accessibility. (A) Schematic representation of SETD2 mutations predicted to have high or moderate severity on protein structure. (B) Hierarchical clustering of median-centered FAIRE signal in windows with significant differences between SETD2 mutant tumors (red) and tumors without SETD2 mutation (gray) (2-sided t-test, P < 0.01). (White) Samples not genotyped. (C) Proportions of nucleosome-depleted loci overlapping H3K36me3-marked regions compared with loci with permuted genomic coordinates. Error bars represent SD. (D) Representative immunostaining of two ccRCC tumor-normal pairs on the tissue microarray. (E) Quantification of H3-normalized H3K36me3 intensity across 11 normal kidney and 69 renal tumors. Mutation severity (high, red; moderate, green; none, blue) is indicated. (White) Samples with unknown SETD2 mutation status. The threshold for H3K36me3 deficiency was set to the lowest observed intensity in normal tissue (dashed line).
We identified about 7000 500-bp windows exhibiting significant variation in FAIRE enrichment between SETD2-mutant and SETD2-normal tumors (two-sided t-test, P < 0.01) (Fig. 2B; Supplemental Fig. S1C). In the SETD2-mutant tumors, FAIRE signal at these regions was most commonly increased (80%), suggesting that SETD2 loss is preferentially associated with greater chromatin accessibility. SETD2 trimethylates H3K36 typically at gene bodies (Barski et al. 2007; Kolasinska-Zwierz et al. 2009). Regions with increased FAIRE signal in SETD2-mutated tumors (one-sided t-test, P < 0.01) also overlapped gene bodies (49% of sites), most of which (91%) were marked by H3K36me3 in normal kidney (P < 0.001 relative to permuted control). More specifically, regions of increased chromatin accessibility associated with SETD2 mutation were enriched directly over the same domains marked by H3K36me3 (24.5%, P < 0.001 relative to permuted control) (Fig. 2C). In contrast, the regions with decreased FAIRE signal showed no association with H3K36me3 and, in fact, showed a significant underrepresentation relative to permuted control (P < 0.001). As an additional control, we tested for this association at regions with increased FAIRE signal in PBRM1-mutant tumors, which we expected to yield a divergent set of loci. Indeed, areas of increased chromatin accessibility associated with this mutation were significantly underrepresented at H3K36me3-marked regions (P < 0.001 relative to permuted control). Together, these data indicate that regions of nucleosome depletion associated with SETD2 mutation preferentially occur at genic sites normally marked by H3K36me3.
Although SETD2 is responsible for trimethylation of H3K36, other mechanisms may influence H3K36 methylation status. Moreover, the effects of specific classes of SETD2 mutations in human tumors on H3K36 methylation in RCC are not known. We quantified H3K36me3 on a tissue microarray (69 tumors, 11 matched normal kidneys) (Fig. 2D; Supplemental Fig. S1B). Whereas normal kidney samples demonstrated consistent nuclear H3K36me3 signal (Fig. 2E), tumors displayed a range of staining intensity, with 53% of tumors exhibiting reduced H3K36me3 intensity. Hereafter, this group of tumors is referred to as “H3K36me3 deficient.” Each of the eight tumors that contained mutations predicted to affect SETD2 activity and screened by IHC demonstrated H3K36me3 deficiency (Fig. 2E). Tumors containing mutations before the SET domain (Q320fs, E978*, and Q1409*) displayed a complete loss of H3K36me3 signal. However, tumors with SETD2 mutations located within the SET domain (G1681fs) or in the SRI domain (R2510L) displayed reduced H3K36me3 signal, suggesting that some mutations may cause a partial loss of function. Several tumors (eight of 13) without identified SETD2 mutations also exhibited reduced H3K36me3 signal. SETD2 was undetectable by immunohistochemistry in two of these tumors, whereas others exhibited decreased SETD2 mRNA, suggesting alternate mechanisms for H3K36me3 loss (Supplemental Fig. S4). We also observed evidence for SETD2 gene hemizygosity in other H3K36me3-deficient SETD2-normal tumors, suggesting that loss of heterozygosity may contribute to deficiency in H3K36 methylating activity (Supplemental Fig. S4C). Interestingly, one tumor (Tumor 25 in Supplemental Fig. S4C) did not exhibit a copy number loss, carried two SETD2 mutations (E1846*, high severity; I2499S, moderate severity), and showed a moderate H3K36me3 deficiency (an intensity value of 0.36 in Fig. 2E). We would thus predict that at least one of these mutations is hypomorphic, thus explaining the intermediate magnitude of the H3K36me3 deficiency. Similarly, we detected two mutations in SETD2 in another tumor (Tumor 3 in Supplemental Fig. S4C), which exhibited a global loss in H3K36me3 staining along with copy number loss. These data suggest that either the tumor cell population was heterogeneous and the remaining allele was differentially mutated in each population (as was observed in Gerlinger et al. 2012) or that the one remaining allele was mutated in two locations. Together, these data illustrate that defective H3K36me3 is a common feature of ccRCC and that the SETD2 genotype alone underestimates H3K36me3 deficiency.
SETD2 mutation is associated with DNA hypomethylation proximal to sites of nucleosome depletion
In many higher eukaryotes, the H3K36me3 mark is recognized by several chromatin readers, one of which is the PWWP domain of the DNA methyltransferase DNMT3A, resulting in DNA methylation proximal to the marked histone (Dhayalan et al. 2010). Using ccRCC DNA methylation data from The Cancer Genome Atlas (TCGA), we observed localized changes (P < 0.05) in DNA methylation, primarily (>70% of probes) DNA hypomethylation, in SETD2-mutant tumors of the TCGA data set at nucleosome-depleted regions identified in our SETD2-mutant tumors (Supplemental Fig. S5). These data link changes in DNA methylation to sites of nucleosome eviction and/or loss of H3K36me3 through SETD2 mutation. This result underscores the importance of H3K36me3 and how its loss may confer a multifaceted alteration in the epigenome.
Intron retention and splicing defects affect a large fraction of genes with altered chromatin accessibility in SETD2 mutant tumors
H3K36me3 has been previously implicated in RNA processing (Luco et al. 2010; de Almeida et al. 2011; Pradeepa et al. 2012), an association not previously examined in primary tissues or in a disease-relevant model. We thus hypothesized that H3K36me3 deficiency would alter RNA processing and splicing in tumors specifically at genes with altered chromatin accessibility. To assess total RNA, including pre-mRNA and nonpolyadenylated transcripts, we performed RNA-seq on ribosome-depleted RNA from 33 tumors, all but one of which was annotated with mutational status (Fig. 2; Supplemental Fig. S1); six tumors without H3K36me3 status assessed by immunohistochemistry were omitted. We observed that H3K36me3-deficient tumors displayed a striking enrichment of intronic pre-mRNA signal compared with tumors with normal H3K36me3 levels. To quantify this effect, we calculated intron retention scores (IRS), which reflect the ratio of intronic to exonic RNA-seq reads on a gene-by-gene basis for each tumor. IRS values range from 0 to 1, where a score of 0 represents a completely spliced message and a score of 1 represents uniform genic coverage. Intron retention was dramatically increased in the H3K36me3-deficient tumors at 95% of the transcripts (6551 in total) marked by H3K36me3 in normal kidney and by nucleosome depletion (one-sided t-test, P < 0.01) in H3K36me3-deficient tumors (Fig. 3A,C; Supplemental Figs. S1B, S6A, S7). To confirm this result, we performed ChIP-seq from an independent normal kidney sample (Supplemental Fig. S6B). Of the 6551 transcripts initially identified (Fig. 3A; Supplemental Fig. S1), 6101 were identified using the second normal kidney sample, representing a 93% overlap. When the 6551 transcripts were instead stratified by PBRM1 mutation status, widespread intron retention was not observed (Fig. 3B), suggesting that this effect is specific to tumors with H3K36me3 deficiency. Many of the affected genes are part of recognized cancer-associated pathways, including known tumor suppressors (e.g., MET, PTEN, and TP53), genes in the DNA repair pathway (e.g., ATR, RAD50, POLN, and XRCC1), and cell cycle regulators (e.g., CCNB1 and CCND3), as well as numerous receptors and protein kinases (e.g., BRAF, EGFR, PIK3CA, and TGFBR3) (Supplemental Fig. S8).
Figure 3.

H3K36me3 deficiency is associated with intron retention. Intron retention scores for selected genes (Supplemental Fig. S1C) were compared between (A) H3K36me3-deficient tumors and H3K36me3-normal tumors, and (B) PBRM1-mutant and PBRM1-normal tumors. (C) Example genes exhibiting increased intron retention in H3K36me3-deficient tumors (top, PPP2CB; bottom, COX6C). Intron retention scores, genic coverage (calculated with both intron and exon reads), and exonic coverage (calculated only with exonic reads) are provided for two H3K36me3-deficient tumors (red) and two H3K36me3-normal tumors (black).
Widespread RNA processing defects linked with SETD2 mutations persist in the mature RNA pool and are marked by altered chromatin accessibility
To test whether observed changes in the pre-mRNA messages persist into mature polyadenylated RNA, we analyzed TCGA RNA-seq data derived from poly(A)+ mRNA isolated from a large cohort (n = 416) of ccRCC tumors. Applying a gene-model-independent algorithm for read mapping and transcript prediction (Singh et al. 2011), we observed that SETD2-mutant tumors exhibited significant alterations in transcript processing (3929 transcripts) (Fig. 4A,B). Alterations included intron retention (12% of altered transcripts) (Supplemental Figs. S1B, S9), variation in exon utilization (66% of altered transcripts) (Fig. 4B,C; Supplemental S10), and differences in transcriptional start and termination site usage (22% of altered transcripts). We also observed the generation of previously unannotated splice isoforms, which we validated by quantitative PCR in independent tumor samples (Fig. 4D). Aberrancies in RNA processing were detected more frequently in highly expressed genes (Supplemental Fig. S11A). Low-abundance messages may preclude the detection of differences in transcript processing. However, overall expression of genes exhibiting defects in RNA processing was comparable between SETD2-mutant and SETD2-normal tumors (Supplemental Fig. S11B).
Figure 4.

Widespread RNA processing defects linked with SETD2 mutations persist in the mature RNA pool and are marked by altered chromatin accessibility. (A) Splicing differences (see Methods) between SETD2-mutant and SETD2-normal tumors (red) compared with a permuted control (blue) are plotted as a cumulative distribution function. (B) Significance of the difference in ratios between SETD2-mutant and SETD2-normal tumors (x-axis) plotted against the scrambled control (y-axis). Points are colored by the class of RNA processing aberrancy. (Gray box) Significance (P = 0.01) in the SETD2-mutant–normal comparison, but not significant in the control comparison. The percentages of significant differences in transcript processing are also presented. (C) Schematic of AP2A1 splicing. Exon skipping was represented as the ratio of included exon coverage to the sum of the exon and the spliced form. The skipped exon ratio is provided for SETD2-mutant tumors (red) and SETD2-normal tumors (black). (D) Quantitative PCR across two USH1C alternative exon utilization sites identified by RNA-seq for three SETD2-normal tumors (black) and two SETD2-mutant tumors (red). Error bars represent standard error. (E) FAIRE signal plotted around the exon start (±3 kb) of misspliced exons (left), random internal exon starts (middle), and random genic positions (right) for H3K36me3-deficient tumors (red) and H3K36me3-normal tumors (black). (Gray) H3K36me3 ChIP-seq signal from normal kidney tissue.
Since H3K36me3 preferentially marks well-positioned exonic nucleosomes (Edmunds et al. 2008; Kolasinska-Zwierz et al. 2009; Schwartz et al. 2009), we analyzed chromatin accessibility around the intron–exon boundary of misspliced exons. H3K36me3-normal tumors demonstrated an expected reduction of FAIRE signal immediately downstream from intron/exon junctions as well as a concomitant enrichment in H3K36me3 (from ChIP-seq in normal kidney), indicative of a well-positioned exonic nucleosome (Fig. 4E, left), corroborating previous reports (Kolasinska-Zwierz et al. 2009). Strikingly, in H3K36me3-deficient tumors, evidence of the exonic nucleosome was lost, and a dramatic increase in chromatin accessibility was observed immediately upstream (50 bp) of the intron/exon junction (Fig. 4E, left, red line). This pattern was also evident, although less pronounced, at internal exon start sites of random genes (Fig. 4E, middle) but completely absent at random genic positions (Fig. 4E, right). Changes in chromatin accessibility even at internal exons chosen regardless of whether they exhibited a splicing defect may indicate a more widespread defect that may not always result in detectable variation in splicing. These data demonstrate the ability to detect subtle variations in chromatin organization in primary human tumors and link H3K36me3 loss with alterations in chromatin accessibility at exons.
Discussion
To identify the genomic consequences of mutated chromatin regulators, we modified and applied FAIRE-seq to a large cohort of primary kidney tumors. Using an unbiased approach, we identified variation in chromatin accessibility distinguishing tumors from normal kidney. Tumor-specific open chromatin corresponded to HIF-targeted sites and was linked to genes involved in the hypoxia response. This result reflects the well-studied association of ccRCC development with VHL inactivation and HIF stabilization. These data also serve to validate the use of FAIRE in primary tumors to detect biologically meaningful pathways.
We then associated variation in chromatin accessibility with mutations in chromatin regulators. Focusing on SETD2, we observed widespread increases in chromatin accessibility, especially in gene bodies typically harboring H3K36me3 in normal kidney tissue. A recent report suggested that SETD2 silencing in cultured cells results in alternative internal transcriptional start sites (Carvalho et al. 2013), akin to cryptic initiation observed in yeast (Carrozza et al. 2005; Lickwar et al. 2009). Our data using human tumor specimens support a more diverse model for transcriptional defects, including retention of introns, missplicing of exons, and usage of alternative transcriptional start or end sites. These defects were widespread, affecting nearly 25% of all expressed genes, and defects were more common in highly transcribed genes.
Moreover, we found a surprising increase in chromatin accessibility immediately upstream (50 bp) of misspliced exons in SETD2-mutated tumors. This result suggests a mechanism by which the altered inclusion of the downstream exon is related to nucleosome positioning over the exon itself as well as the adjacent upstream nucleosome. Nucleosome positioning and histone modifications (including H3K36me3) are known to regulate multiple processes involved with splicing, including changes in the speed or pausing of RNA polymerase (Kadener et al. 2001; Howe et al. 2003; Batsche et al. 2006; Kornblihtt 2007; Munoz et al. 2009), and the ability for splicing machinery to appropriately recognize the splice donor and acceptor. Our finding also suggests that the positioning of this upstream nucleosome may be related to trimethylation of H3K36 on the exonic nucleosome. In Saccharomyces cerevisiae, loss of Set2 leads to destabilization of nucleosomes through hyperacetylation of gene bodies and cryptic transcriptional initiation (Carrozza et al. 2005; Lickwar et al. 2009). Since hyperacetylation was not observed following SETD2 silencing (Edmunds et al. 2008), the increased chromatin accessibility we observed over gene bodies may therefore represent nucleosome destabilization in a hyperacetylation-independent manner. Although our results directly link SETD2 mutation and H3K36 trimethylation to chromatin accessibility, studies that specifically examine nucleosome positioning and histone modification will be necessary to fully investigate this potential mechanism.
Although our data associate SETD2 mutations/H3K36me3 deficiency with aberrant RNA processing, exactly how this dysregulation contributes to tumorigenesis remains unknown. A significant fraction of the deregulated transcripts include known tumor suppressors, DNA damage response proteins, and kinases. Strikingly, 58% of genes with altered splicing patterns (Fig. 4A,B) encode annotated phosphoproteins (P = 7.3 × 10−109), representing an enrichment exceeding that of genes annotated as having alternate splice isoforms (P = 2 × 10−60), a finding also observed in genes exhibiting retained introns (Supplemental Figs. S8, S12). Alterations in the abundance, stability, or splicing of RNA could induce changes in the phosphoproteome and disrupt normal cellular signaling and growth checkpoints, leading to tumorigenesis. Deregulated signaling as well as transcriptional defects provide numerous putative targets for therapeutic exploitation. Additionally, the application of FAIRE, or IHC for H3K36 trimethylation, could enable the classification of clinical specimens into functional tumor subtypes.
This study advances our understanding of the relationship between genetic alterations affecting chromatin organization and alterations in transcription. RNA processing defects in a large fraction of expressed genes, many of which are tumor suppressors critical for cellular function, may be a common phenotype of many cancers. Comprehensive mapping of the chromatin landscape in primary tumors offers a new tool for understanding the functional consequences of chromatin modifier mutations in human disease.
Methods
Formaldehyde-assisted isolation of regulatory elements (FAIRE) and hierarchical clustering of differentially open chromatin
FAIRE was performed as previously described (Simon et al. 2012). Sequencing was performed using 36- or 50-bp single-end reads (Illumina GA IIx or HiSeq 2000). Reads were filtered using TagDust (Lassmann et al. 2009) and aligned to the reference human genome (hg19) with Bowtie (Li and Durbin 2009) using default parameters. Reads were counted in 500-bp sliding windows across the genome, normalized for sequencing depth, and adjusted for batch effects using Principal Components Analysis (PCA). One outlier normal kidney sample was removed at this step, and all normal kidney samples were removed for subsequent tumor-only analyses. For clustering analyses, only windows with sufficient sequencing depth (row average > 0.25) were retained; groups were compared using one- or two-sided t-tests (P < 0.01), clustered and plotted (Saldanha 2004). Feature intersections were computed using BEDTools (Quinlan and Hall 2010).
Reprocessing of HIF1A, HIF2A, and ARNT ChIP-seq data
ChIP-seq reads for HIF1A, HIF2A, and ARNT (Schodel et al. 2011) were filtered using TagDust (Lassmann et al. 2009) and aligned to the reference human genome (hg19) using Bowtie (Li and Durbin 2009) requiring unique read placement. Binding sites for HIF1A and HIF2A were identified using MACS (Feng et al. 2012), with a shift-size of 250 bp and significant to q < 0.05.
Ontologies associated with differentially open chromatin
Regions from Clusters 1–3 were associated with Gene Ontologies using GREAT (McLean et al. 2010) using all possible 500-bp windows as background. The top five ontologies with q < 1 × 10⁻⁵ were presented; full Gene Ontology associations are supplied in Supplemental Figure S3.
Motif analysis
Significantly overenriched known transcription factor (TF) motifs were identified using HOMER (Heinz et al. 2010). The 500-bp flanking region was used as local background. Only those TF motifs whose enrichment over background exceeded 2.5-fold were present in at least 10% of the target sequence, and q < 0.0001 were presented in Figure 1D. Highly similar entries were merged.
SureSelect custom capture and mutation calling
Genotyping was performed using the SureSelect XT Custom Capture (Agilent). Multiplexing was achieved using TruSeq adapters (Illumina); samples were pooled prior to the capture and amplified post-capture using TruSeq PCR primers (Illumina). Blocking reagents were replaced with water to avoid cross-reactivity. Sequencing was performed using 50-bp paired-end reads (Illumina HiSeq 2000). Reads were aligned to the reference human genome (hg19) using BWA (Li and Durbin 2009). Genes were sequenced to an average coverage of 200× with 85% of the target sequenced to least at 50×. Genotypes were determined using the Genome Analysis Toolkit (GATK) (McKenna et al. 2010) “Better” protocol. Only high-confidence (quality score >100) variants predicted to have high or moderate severity and not reported in dbSNP (v129) were considered.
Histone methylation ChIP-seq and data processing
ChIP for H3K36me3 and input DNA from normal kidney was sequenced on the Illumina Genome Analyzer II. Reads were aligned to the reference genome (hg19) using Bowtie requiring unique alignment. H3K36me3 sites were called first using ZINBA (Rashid et al. 2011), then merged to call broader domains by merging nearby sites using Galaxy (Goecks et al. 2010); two or more sites within 5 kb were merged. The average H3K36me3 signal across gene bodies was plotted using CEAS (Shin et al. 2009).
Feature overlap permutations
Significance of overlap between sites of differentially open chromatin associated with SETD2 or PBRM1 mutations and H3K36me3 sites was determined by permutation. First, the overlap between the actual set of significant windows and histone methylation was computed. Then the same number of randomly selected windows from the full list (regardless of significance) was selected 1000 times, and an empirical P-value was determined by counting the number of times the overlap of the permuted set exceeded that of the actual set.
Tissue microarray construction and immunohistochemistry
Tissue microarrays (TMAs) were constructed from formalin-fixed, paraffin-embedded tumor blocks from 69 ccRCC tumors and 11 matched normal kidneys collected at the time of nephrectomy. Hematoxylin and eosin–stained slides were reviewed to identify a target area of ccRCC histology in each tissue block. TMAs were then constructed using 0.6-mm cores on the manual tissue microarrayer (Beecher Instruments). Tumor and normal samples were represented in triplicate. Sequential 4-µm slides were cut from each TMA.
Immunohistochemical (IHC) staining of H3K36me3, histone H3, and SETD2 was performed (Bond Autostainer, Leica Microsystems, Inc.) according to the manufacturer's protocol. Antigen retrieval for H3K36me3, SETD2, and histone H3 was performed for 30 min in citrate buffer (pH 6.0) (Bond #AR9961) and hydrated with Bond wash buffer (AR9590). Slides were incubated with H3K36me3 antibody (Abcam, ab9050, dilution 1:2000) or histone H3 (courtesy of the Strahl laboratory, dilution 1:5000) or SETD2 (Abcam, ab31358, 1:200) for 1 h at room temperature. Antibody detection was performed (Bond Polymer Refine Detection System, DS9800) followed by image acquisition (ScanScope CS, Aperio Technologies).
Quantification of H3K36me3, SETD2, and histone H3 was performed independently by two reviewers who were blinded to the tissue identity. The percentage of tumor cells with positive nuclei was determined by evaluating the entire core for each sample. The degree of H3K36me3 or SETD2 staining was averaged across triplicate samples and normalized to total H3 to correct for differences in cell number. Using the minimum value of normalized H3K36me3 in normal kidney as a cutoff, tumors were stratified as either “H3K36me3-normal” or “H3K36me3-deficient” for subsequent analyses. Five additional tumors (not represented on the tissue microarray) were similarly assessed by immunohistochemistry and classified as “H3K36me3-deficient” (three tumors) or “H3K36me3-normal” (two tumors).
Intron retention estimates by RNA-seq
Total RNA was isolated from tumors (miRNeasy, Qiagen) and validated to have a median RNA Integrity Numbers (RIN) of 8.6 (minimum 6.8) using a Bioanalyzer (Agilent). Ribosomal RNA was depleted (RiboMinus, Invitrogen) and RNA was fragmented (RNA Fragmentation Reagents, Ambion). cDNA was generated (SuperScript II, Invitrogen) by random priming followed by second strand synthesis (DNA polymerase I, Enzymatics) and purified (PCR purification kit, Qiagen). Libraries were prepared according to the manufacturer's specifications (Illumina). Sequencing was performed using 50-bp single-end reads (Illumina HiSeq 2000). Reads were aligned to the reference human genome (hg19) using TopHat (Trapnell et al. 2009), and gene expression was estimated by calculating RPKM, analyzing only exonic reads. Intron retention scores were calculated for each gene as follows:
 |
Quantitative RT-PCR
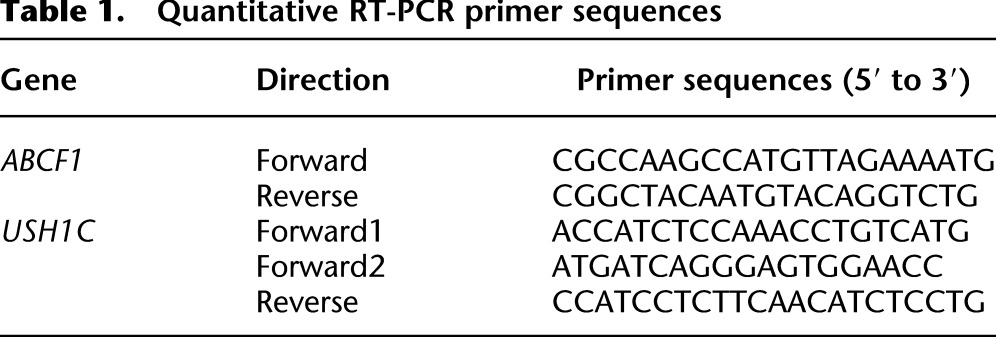
Total RNA extracted from patient tumors (Qiagen miRNeasy) was either rRNA-depleted (RiboMinus, Invitrogen) or poly(A)-selected (Oligotex mRNA Mini Kit, Qiagen). RNA was reverse-transcribed by random priming (SuperScript II Reverse Transcriptase, Invitrogen), and cDNA was quantified by PCR and normalized to ABCF1 (Maxima SYBR Green/ROX qPCR Master Mix, Thermo Fisher Scientific; 7900HT Fast Real-Time PCR System, Applied Biosystems) (see Table 1).
Table 1.
Quantitative RT-PCR primer sequences
Differential splicing analysis
RNA-seq reads were aligned to the human reference genome using MapSplice (Wang et al. 2010). For each gene, a splicing graph was created as previously described (Singh et al. 2011). Each exon and splicing event was represented as an edge, and splice junctions as nodes. We computed a “splicing fraction” of each edge as the fraction of RNA-seq coverage in that edge divided by the total coverage of all edges sharing one node of that edge. Only edges with coverage exceeding 5 reads and genes with multiple isoforms (13,879 genes) were considered. The node exhibiting the largest difference between SETD2 mutant and normal tumors was determined by comparing the median of each group. As a control, we created random groups of tumors of the same sizes. Splicing differences between SETD2-mutant and normal tumors were compared with that of the control group by a Kruskal–Wallis one-way analysis of variance test. The skipped exon ratio was computed as the ratio of coverage of the included exon, and the sum of coverages of the included exon and the skipping splice.
Data acquisition
TCGA data were accessed with authorization. Nephrectomy specimens were collected under institutional IRB-approved protocols.
Data access
Sequencing data and mutational analysis files have been submitted to EMBL-EBI ArrayExpress (http://www.ebi.ac.uk/arrayexpress/) under accession number E-MTAB-1936.
Acknowledgments
We acknowledge The Cancer Genome Atlas Consortium. We thank B. Strahl for advice and antibodies; W. Janzen, S. Pattenden, P. Dayton, and J. Streeter for assistance with DNA preparation; the UNC Tissue Procurement Facility for tissue acquisition; the UNC Translational Pathology Laboratory (TPL) for assistance with the tissue microarray fabrication and staining; and P. Mieczkowski and the High Throughput Sequencing Facility, J. Roach, and UNC Research Computing for sequencing data generation and initial processing. We gratefully acknowledge support from the National Cancer Institute (R01CA166447 to I.J.D. and R01CA121781 to W.K.R.), the National Human Genome Research Institute (R01HG006272 to J.F.P.), the National Institute of General Medical Sciences (T32GM067553 to J.M.S. and T32GM008719 and T32GM08093 to K.E.H.), the V Foundation for Cancer Research, and the University of North Carolina University Cancer Research Fund (UCRF) Cancer Genetics Keystone Program. The TPL is supported, in part, by grants from the National Cancer Institute (3P30CA016086), National Institute of Environmental Health Sciences (3P30ES010126), Department of Defense (W81XWH-09-2-0042), and the UCRF.
Author contributions: J.M.S. and K.E.H. prepared tumor samples and nucleic acids and analyzed protein, transcriptomic, and genomic data and contributed equally to the preparation of the manuscript. J.S.P., J.F.P., and D.S. analyzed data for genomic and transcriptomic phenotypes. A.R.B., M.W., and T.S.F. performed data analysis and study design. T.H.H. and E.J. provided samples and data. P.-F.K. performed statistical analysis. J.D.L., W.K.R., and I.J.D. designed the study, analyzed the data, and wrote the manuscript. All authors have reviewed the manuscript and are knowledgeable of the results.
Footnotes
[Supplemental material is available for this article.]
Article published online before print. Article, supplemental material, and publication date are at http://www.genome.org/cgi/doi/10.1101/gr.158253.113.
References
- Barski A, Cuddapah S, Cui K, Roh TY, Schones DE, Wang Z, Wei G, Chepelev I, Zhao K 2007. High-resolution profiling of histone methylations in the human genome. Cell 129: 823–837 [DOI] [PubMed] [Google Scholar]
- Batsche E, Yaniv M, Muchardt C 2006. The human SWI/SNF subunit Brm is a regulator of alternative splicing. Nat Struct Mol Biol 13: 22–29 [DOI] [PubMed] [Google Scholar]
- Bratslavsky G, Sudarshan S, Neckers L, Linehan WM 2007. Pseudohypoxic pathways in renal cell carcinoma. Clin Cancer Res 13: 4667–4671 [DOI] [PubMed] [Google Scholar]
- Brown MA, Sims RJ III, Gottlieb PD, Tucker PW 2006. Identification and characterization of Smyd2: A split SET/MYND domain-containing histone H3 lysine 36-specific methyltransferase that interacts with the Sin3 histone deacetylase complex. Mol Cancer 5: 26. [DOI] [PMC free article] [PubMed] [Google Scholar]
- Carrozza MJ, Li B, Florens L, Suganuma T, Swanson SK, Lee KK, Shia WJ, Anderson S, Yates J, Washburn MP, et al. 2005. Histone H3 methylation by Set2 directs deacetylation of coding regions by Rpd3S to suppress spurious intragenic transcription. Cell 123: 581–592 [DOI] [PubMed] [Google Scholar]
- Carvalho S, Raposo AC, Martins FB, Grosso AR, Sridhara SC, Rino J, Carmo-Fonseca M, de Almeida SF 2013. Histone methyltransferase SETD2 coordinates FACT recruitment with nucleosome dynamics during transcription. Nucleic Acids Res 41: 2881–2893 [DOI] [PMC free article] [PubMed] [Google Scholar]
- Dalgliesh GL, Furge K, Greenman C, Chen L, Bignell G, Butler A, Davies H, Edkins S, Hardy C, Latimer C, et al. 2010. Systematic sequencing of renal carcinoma reveals inactivation of histone modifying genes. Nature 463: 360–363 [DOI] [PMC free article] [PubMed] [Google Scholar]
- de Almeida SF, Grosso AR, Koch F, Fenouil R, Carvalho S, Andrade J, Levezinho H, Gut M, Eick D, Gut I, et al. 2011. Splicing enhances recruitment of methyltransferase HYPB/Setd2 and methylation of histone H3 Lys36. Nat Struct Mol Biol 18: 977–983 [DOI] [PubMed] [Google Scholar]
- Dhayalan A, Rajavelu A, Rathert P, Tamas R, Jurkowska RZ, Ragozin S, Jeltsch A 2010. The Dnmt3a PWWP domain reads histone 3 lysine 36 trimethylation and guides DNA methylation. J Biol Chem 285: 26114–26120 [DOI] [PMC free article] [PubMed] [Google Scholar]
- Duns G, van den Berg E, van Duivenbode I, Osinga J, Hollema H, Hofstra RM, Kok K 2010. Histone methyltransferase gene SETD2 is a novel tumor suppressor gene in clear cell renal cell carcinoma. Cancer Res 70: 4287–4291 [DOI] [PubMed] [Google Scholar]
- Edmunds JW, Mahadevan LC, Clayton AL 2008. Dynamic histone H3 methylation during gene induction: HYPB/Setd2 mediates all H3K36 trimethylation. EMBO J 27: 406–420 [DOI] [PMC free article] [PubMed] [Google Scholar]
- Feng J, Liu T, Qin B, Zhang Y, Liu XS 2012. Identifying ChIP-seq enrichment using MACS. Nat Protoc 7: 1728–1740 [DOI] [PMC free article] [PubMed] [Google Scholar]
- Fontebasso AM, Schwartzentruber J, Khuong-Quang DA, Liu XY, Sturm D, Korshunov A, Jones DT, Witt H, Kool M, Albrecht S, et al. 2013. Mutations in SETD2 and genes affecting histone H3K36 methylation target hemispheric high-grade gliomas. Acta Neuropathol 125: 659–669 [DOI] [PMC free article] [PubMed] [Google Scholar]
- Gaulton KJ, Nammo T, Pasquali L, Simon JM, Giresi PG, Fogarty MP, Panhuis TM, Mieczkowski P, Secchi A, Bosco D, et al. 2010. A map of open chromatin in human pancreatic islets. Nat Genet 42: 255–259 [DOI] [PMC free article] [PubMed] [Google Scholar]
- Gerlinger M, Rowan AJ, Horswell S, Larkin J, Endesfelder D, Gronroos E, Martinez P, Matthews N, Stewart A, Tarpey P, et al. 2012. Intratumor heterogeneity and branched evolution revealed by multiregion sequencing. N Engl J Med 366: 883–892 [DOI] [PMC free article] [PubMed] [Google Scholar]
- Giresi PG, Lieb JD 2009. Isolation of active regulatory elements from eukaryotic chromatin using FAIRE (Formaldehyde Assisted Isolation of Regulatory Elements). Methods 48: 233–239 [DOI] [PMC free article] [PubMed] [Google Scholar]
- Giresi PG, Kim J, McDaniell RM, Iyer VR, Lieb JD 2007. FAIRE (Formaldehyde-Assisted Isolation of Regulatory Elements) isolates active regulatory elements from human chromatin. Genome Res 17: 877–885 [DOI] [PMC free article] [PubMed] [Google Scholar]
- Goecks J, Nekrutenko A, Taylor J 2010. Galaxy: A comprehensive approach for supporting accessible, reproducible, and transparent computational research in the life sciences. Genome Biol 11: R86. [DOI] [PMC free article] [PubMed] [Google Scholar]
- Gordan JD, Lal P, Dondeti VR, Letrero R, Parekh KN, Oquendo CE, Greenberg RA, Flaherty KT, Rathmell WK, Keith B, et al. 2008. HIF-α effects on c-Myc distinguish two subtypes of sporadic VHL-deficient clear cell renal carcinoma. Cancer Cell 14: 435–446 [DOI] [PMC free article] [PubMed] [Google Scholar]
- Gore ME, Larkin JM 2011. Challenges and opportunities for converting renal cell carcinoma into a chronic disease with targeted therapies. Br J Cancer 104: 399–406 [DOI] [PMC free article] [PubMed] [Google Scholar]
- Hakimi AA, Chen YB, Wren J, Gonen M, Abdel-Wahab O, Heguy A, Liu H, Takeda S, Tickoo SK, Reuter VE, et al. 2012. Clinical and pathologic impact of select chromatin-modulating tumor suppressors in clear cell renal cell carcinoma. Eur Urol 63: 848–854 [DOI] [PMC free article] [PubMed] [Google Scholar]
- Heinz S, Benner C, Spann N, Bertolino E, Lin YC, Laslo P, Cheng JX, Murre C, Singh H, Glass CK 2010. Simple combinations of lineage-determining transcription factors prime cis-regulatory elements required for macrophage and B cell identities. Mol Cell 38: 576–589 [DOI] [PMC free article] [PubMed] [Google Scholar]
- Hogan GJ, Lee C-K, Lieb JD 2006. Cell cycle-specified fluctuation of nucleosome occupancy at gene promoters. PLoS Genet 2: e158. [DOI] [PMC free article] [PubMed] [Google Scholar]
- Howe KJ, Kane CM, Ares M Jr 2003. Perturbation of transcription elongation influences the fidelity of internal exon inclusion in Saccharomyces cerevisiae. RNA 9: 993–1006 [DOI] [PMC free article] [PubMed] [Google Scholar]
- Jonasch E, Futreal PA, Davis IJ, Bailey ST, Kim WY, Brugarolas J, Giaccia AJ, Kurban G, Pause A, Frydman J, et al. 2012. State of the science: An update on renal cell carcinoma. Mol Cancer Res 10: 859–880 [DOI] [PMC free article] [PubMed] [Google Scholar]
- Kadener S, Cramer P, Nogues G, Cazalla D, de la Mata M, Fededa JP, Werbajh SE, Srebrow A, Kornblihtt AR 2001. Antagonistic effects of T-Ag and VP16 reveal a role for RNA Pol II elongation on alternative splicing. EMBO J 20: 5759–5768 [DOI] [PMC free article] [PubMed] [Google Scholar]
- Kapur P, Pena-Llopis S, Christie A, Zhrebker L, Pavia-Jimenez A, Rathmell WK, Xie XJ, Brugarolas J 2013. Effects on survival of BAP1 and PBRM1 mutations in sporadic clear-cell renal-cell carcinoma: A retrospective analysis with independent validation. Lancet Oncol 14: 159–167 [DOI] [PMC free article] [PubMed] [Google Scholar]
- Kim WY, Kaelin WG 2004. Role of VHL gene mutation in human cancer. J Clin Oncol 22: 4991–5004 [DOI] [PubMed] [Google Scholar]
- Kolasinska-Zwierz P, Down T, Latorre I, Liu T, Liu XS, Ahringer J 2009. Differential chromatin marking of introns and expressed exons by H3K36me3. Nat Genet 41: 376–381 [DOI] [PMC free article] [PubMed] [Google Scholar]
- Kornblihtt AR 2007. Coupling transcription and alternative splicing. Adv Exp Med Biol 623: 175–189 [DOI] [PubMed] [Google Scholar]
- Lassmann T, Hayashizaki Y, Daub CO 2009. TagDust—a program to eliminate artifacts from next generation sequencing data. Bioinformatics 25: 2839–2840 [DOI] [PMC free article] [PubMed] [Google Scholar]
- Li H, Durbin R 2009. Fast and accurate short read alignment with Burrows–Wheeler transform. Bioinformatics 25: 1754–1760 [DOI] [PMC free article] [PubMed] [Google Scholar]
- Lickwar CR, Rao B, Shabalin AA, Nobel AB, Strahl BD, Lieb JD 2009. The Set2/Rpd3S pathway suppresses cryptic transcription without regard to gene length or transcription frequency. PLoS ONE 4: e4886. [DOI] [PMC free article] [PubMed] [Google Scholar]
- Luco RF, Pan Q, Tominaga K, Blencowe BJ, Pereira-Smith OM, Misteli T 2010. Regulation of alternative splicing by histone modifications. Science 327: 996–1000 [DOI] [PMC free article] [PubMed] [Google Scholar]
- McKenna A, Hanna M, Banks E, Sivachenko A, Cibulskis K, Kernytsky A, Garimella K, Altshuler D, Gabriel S, Daly M, et al. 2010. The Genome Analysis Toolkit: A MapReduce framework for analyzing next-generation DNA sequencing data. Genome Res 20: 1297–1303 [DOI] [PMC free article] [PubMed] [Google Scholar]
- McLean CY, Bristor D, Hiller M, Clarke SL, Schaar BT, Lowe CB, Wenger AM, Bejerano G 2010. GREAT improves functional interpretation of cis-regulatory regions. Nat Biotechnol 28: 495–501 [DOI] [PMC free article] [PubMed] [Google Scholar]
- Munoz MJ, Perez Santangelo MS, Paronetto MP, de la Mata M, Pelisch F, Boireau S, Glover-Cutter K, Ben-Dov C, Blaustein M, Lozano JJ, et al. 2009. DNA damage regulates alternative splicing through inhibition of RNA polymerase II elongation. Cell 137: 708–720 [DOI] [PubMed] [Google Scholar]
- Nagy PL, Cleary ML, Brown PO, Lieb JD 2003. Genomewide demarcation of RNA polymerase II transcription units revealed by physical fractionation of chromatin. Proc Natl Acad Sci 100: 6364–6369 [DOI] [PMC free article] [PubMed] [Google Scholar]
- Nickerson ML, Jaeger E, Shi Y, Durocher JA, Mahurkar S, Zaridze D, Matveev V, Janout V, Kollarova H, Bencko V, et al. 2008. Improved identification of von Hippel–Lindau gene alterations in clear cell renal tumors. Clin Cancer Res 14: 4726–4734 [DOI] [PMC free article] [PubMed] [Google Scholar]
- Pena-Llopis S, Vega-Rubin-de-Celis S, Liao A, Leng N, Pavia-Jimenez A, Wang S, Yamasaki T, Zhrebker L, Sivanand S, Spence P, et al. 2012. BAP1 loss defines a new class of renal cell carcinoma. Nat Genet 44: 751–759 [DOI] [PMC free article] [PubMed] [Google Scholar]
- Pradeepa MM, Sutherland HG, Ule J, Grimes GR, Bickmore WA 2012. Psip1/Ledgf p52 binds methylated histone H3K36 and splicing factors and contributes to the regulation of alternative splicing. PLoS Genet 8: e1002717. [DOI] [PMC free article] [PubMed] [Google Scholar]
- Quinlan AR, Hall IM 2010. BEDTools: A flexible suite of utilities for comparing genomic features. Bioinformatics 26: 841–842 [DOI] [PMC free article] [PubMed] [Google Scholar]
- Rashid NU, Giresi PG, Ibrahim JG, Sun W, Lieb JD 2011. ZINBA integrates local covariates with DNA-seq data to identify broad and narrow regions of enrichment, even within amplified genomic regions. Genome Biol 12: R67. [DOI] [PMC free article] [PubMed] [Google Scholar]
- Rayasam GV, Wendling O, Angrand PO, Mark M, Niederreither K, Song L, Lerouge T, Hager GL, Chambon P, Losson R 2003. NSD1 is essential for early post-implantation development and has a catalytically active SET domain. EMBO J 22: 3153–3163 [DOI] [PMC free article] [PubMed] [Google Scholar]
- Ryan RJ, Bernstein BE 2012. Molecular biology. Genetic events that shape the cancer epigenome. Science 336: 1513–1514 [DOI] [PubMed] [Google Scholar]
- Saldanha AJ 2004. Java Treeview—extensible visualization of microarray data. Bioinformatics 20: 3246–3248 [DOI] [PubMed] [Google Scholar]
- Schodel J, Oikonomopoulos S, Ragoussis J, Pugh CW, Ratcliffe PJ, Mole DR 2011. High-resolution genome-wide mapping of HIF-binding sites by ChIP-seq. Blood 117: e207–e217 [DOI] [PMC free article] [PubMed] [Google Scholar]
- Schwartz S, Meshorer E, Ast G 2009. Chromatin organization marks exon–intron structure. Nat Struct Mol Biol 16: 990–995 [DOI] [PubMed] [Google Scholar]
- Shin H, Liu T, Manrai AK, Liu XS 2009. CEAS: cis-regulatory element annotation system. Bioinformatics 25: 2605–2606 [DOI] [PubMed] [Google Scholar]
- Simon JM, Giresi PG, Davis IJ, Lieb JD 2012. Using formaldehyde-assisted isolation of regulatory elements (FAIRE) to isolate active regulatory DNA. Nat Protoc 7: 256–267 [DOI] [PMC free article] [PubMed] [Google Scholar]
- Singh D, Orellana CF, Hu Y, Jones CD, Liu Y, Chiang DY, Liu J, Prins JF 2011. FDM: A graph-based statistical method to detect differential transcription using RNA-seq data. Bioinformatics 27: 2633–2640 [DOI] [PMC free article] [PubMed] [Google Scholar]
- Song L, Zhang Z, Grasfeder LL, Boyle AP, Giresi PG, Lee BK, Sheffield NC, Graf S, Huss M, Keefe D, et al. 2011. Open chromatin defined by DNaseI and FAIRE identifies regulatory elements that shape cell-type identity. Genome Res 21: 1757–1767 [DOI] [PMC free article] [PubMed] [Google Scholar]
- Sun XJ, Wei J, Wu XY, Hu M, Wang L, Wang HH, Zhang QH, Chen SJ, Huang QH, Chen Z 2005. Identification and characterization of a novel human histone H3 lysine 36-specific methyltransferase. J Biol Chem 280: 35261–35271 [DOI] [PubMed] [Google Scholar]
- Thurman RE, Rynes E, Humbert R, Vierstra J, Maurano MT, Haugen E, Sheffield NC, Stergachis AB, Wang H, Vernot B, et al. 2012. The accessible chromatin landscape of the human genome. Nature 489: 75–82 [DOI] [PMC free article] [PubMed] [Google Scholar]
- Trapnell C, Pachter L, Salzberg SL 2009. TopHat: Discovering splice junctions with RNA-Seq. Bioinformatics 25: 1105–1111 [DOI] [PMC free article] [PubMed] [Google Scholar]
- Varela I, Tarpey P, Raine K, Huang D, Ong CK, Stephens P, Davies H, Jones D, Lin ML, Teague J, et al. 2011. Exome sequencing identifies frequent mutation of the SWI/SNF complex gene PBRM1 in renal carcinoma. Nature 469: 539–542 [DOI] [PMC free article] [PubMed] [Google Scholar]
- Wang K, Singh D, Zeng Z, Coleman SJ, Huang Y, Savich GL, He X, Mieczkowski P, Grimm SA, Perou CM, et al. 2010. MapSplice: Accurate mapping of RNA-seq reads for splice junction discovery. Nucleic Acids Res 38: e178. [DOI] [PMC free article] [PubMed] [Google Scholar]
- Yoh SM, Lucas JS, Jones KA 2008. The Iws1:Spt6:CTD complex controls cotranscriptional mRNA biosynthesis and HYPB/Setd2-mediated histone H3K36 methylation. Genes Dev 22: 3422–3434 [DOI] [PMC free article] [PubMed] [Google Scholar]