

Abstract
The organization of nucleosomes influences transcriptional activity by controlling accessibility of DNA binding proteins to the genome. Genome-wide nucleosome binding profiles have identified a canonical nucleosome organization at gene promoters, where arrays of well-positioned nucleosomes emanate from nucleosome-depleted regions. The mechanisms of formation and the function of canonical promoter nucleosome organization remain unclear. Here we analyze the genome-wide location of nucleosomes during zebrafish embryogenesis and show that well-positioned nucleosome arrays appear on thousands of promoters during the activation of the zygotic genome. The formation of canonical promoter nucleosome organization is independent of DNA sequence preference, transcriptional elongation, and robust RNA polymerase II (Pol II) binding. Instead, canonical promoter nucleosome organization correlates with the presence of histone H3 lysine 4 trimethylation (H3K4me3) and affects future transcriptional activation. These findings reveal that genome activation is central to the organization of nucleosome arrays during early embryogenesis.
Nucleosome organization affects transcriptional activity by influencing the access of DNA binding proteins to the genome (Jiang and Pugh 2009b). Recent studies in various model organisms have shown that nucleosome organization is not random in many functionally important regions of the genome (Yuan et al. 2005; Albert et al. 2007; Lee et al. 2007; Mavrich et al. 2008a,b; Schones et al. 2008; Shivaswamy et al. 2008; Valouev et al. 2008, 2011; Jiang and Pugh 2009b; Teif et al. 2012). In particular, nucleosome-depleted regions have been observed near the transcription start sites (TSSs) of many genes. Moreover, arrays of positioned nucleosomes often emanate from nucleosome-depleted regions (Albert et al. 2007; Valouev et al. 2008, 2011; Jiang and Pugh 2009b). Studies in yeast have indicated that nucleosome patterns are influenced (Segal et al. 2006; Kaplan et al. 2009), but not determined (Zhang et al. 2009; Stein et al. 2010; Weiner et al. 2010), by DNA sequence. ATP-dependent chromatin remodelers (Gkikopoulos et al. 2011; Zhang et al. 2011) and transcription initiation and elongation (Zhang et al. 2009; Weiner et al. 2010; Hughes et al. 2012) have also been implicated in the organization of nucleosomes in vivo.
Although nucleosome organization profiles have been generated for vertebrate organisms (Hu et al. 2011; Li et al. 2011; Valouev et al. 2011; Gaffney et al. 2012; Nekrasov et al. 2012; Teif et al. 2012), it remains unclear how and when canonical promoter nucleosome structures form (Bai and Morozov 2010). Here, we address these questions by analyzing changes in nucleosome organization during the maternal-zygotic transition in zebrafish embryos. In zebrafish, the bulk of zygotic transcription begins 3 h post fertilization (hpf), when a period of rapid synchronous cleavages ends and cell cycles lengthen (Kane and Kimmel 1993; Schier 2007; Tadros and Lipshitz 2009). Specific histone modifications appear during this transition (Vastenhouw et al. 2010; Lindeman et al. 2011), resulting in a chromatin signature characteristic of embryonic pluripotency (Vastenhouw et al. 2010). Therefore, the maternal-zygotic transition provides an ideal in vivo system to study the relationship among transcriptional activity, specific histone methylation marks, and nucleosome organization in vivo.
Results
Emergence of well-positioned nucleosome arrays during genome activation
To analyze nucleosome organization during genome activation, we combined micrococcal nuclease (MNase) digestion of chromatin with high-throughput sequencing (MNase-seq) (Supplemental Fig. S1A–C). MNase preferentially cuts within linker DNA, so the sequenced fragments indicate the positions of nucleosomes when they are mapped back to the genome. We generated two biological replicates for two developmental stages, resulting in a total of 487 and 519 million mapped reads for the 256-cell (2.5 hpf; before the maternal-zygotic transition) and dome/30% epiboly stages (4.5 hpf; after the maternal-zygotic transition) (Supplemental Fig. S1D,E), respectively. This represents over 50-fold genome coverage, one of the deepest nucleosome coverages of a vertebrate genome investigated to date.
We analyzed three major aspects of nucleosome organization: occupancy (nucleosome density), rotational positioning (orientation of the DNA helix on the nucleosome surface), and translational positioning (relative location of nucleosomes along the DNA). While few changes were detected for nucleosome occupancy or rotational positioning during the maternal-zygotic transition (for details, see Supplemental Fig. S2; Supplemental Text 1), changes in translational positioning of nucleosomes were widespread. By calculating the positioning degree as previously defined (Zhang et al. 2009), we found that during genome activation, arrays of well-positioned nucleosomes appear at many genomic loci (for example, see Fig. 1A). Indeed, the number of arrays with five or more well-positioned nucleosomes increased over 10-fold from the 256-cell stage (996 regions) to the dome stage (10,523 regions). By analyzing the relative locations of all nucleosomes at both developmental stages, we found that nucleosomes are on average more regularly positioned at the dome stage than at the 256-cell stage (Fig. 1B).
Figure 1.
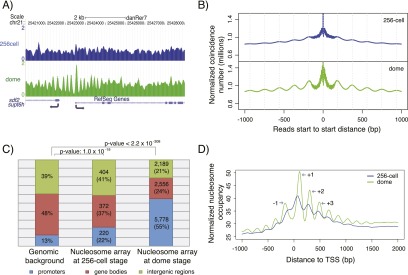
Well-positioned nucleosome arrays are established at promoters during genome activation. (A) Sample profile of nucleosome organization around the promoter of supt6h at the 256-cell (blue, before the maternal-zygotic transition) and dome (green, after the maternal-zygotic transition) stages. Gaussian smoothing of midpoints of nucleosomal DNA was used to create the nucleosome profile. (B) Relationship between the position of adjacent nucleosomes before (blue) and after (green) the maternal-zygotic transition. The total number of nucleosomal sequencing reads with a start-to-start distance equal to the value on the x-axis is shown. (C) Genomic distribution of well-positioned nucleosome arrays at the 256-cell and dome stages. Promoters: regions from 2 kb upstream of the TSS to 2 kb downstream from the TSS. Gene bodies: regions from 2 kb downstream from the TSS to the transcription termination sites (TTS). Intergenic regions: all other genomic regions. (D) Average promoter nucleosome organization across all genes before (blue) and after (green) the maternal-zygotic transition. All reads were extended to 147 bp; the middle 73 bp were taken, piled up, and normalized by sequencing coverage. The +1, +2, +3, and −1 nucleosomes around TSS at the dome stage are indicated.
Nucleosome organization in vivo is known to be affected by DNA sequence preference (Supplemental Text 1; Segal et al. 2006; Kaplan et al. 2009; Struhl and Segal 2013). To examine the role of sequence preference on the appearance of nucleosome arrays, we applied a computational model that predicts nucleosome organization from DNA sequence (Kaplan et al. 2009) to the regions with well-positioned nucleosome arrays at the dome stage (after genome activation). The observed and predicted nucleosome organization shows very weak correlation at the dome stage (Supplemental Fig. S3A,C), while for the same genomic regions, the sequence-based prediction performs slightly better at the 256-cell stage (before genome activation) (Supplemental Fig. S3B). This raises the possibility that the formation of nucleosome arrays during genome activation works against the DNA sequence preference of nucleosomes.
To investigate the potential functional relevance of well-positioned nucleosome arrays at the dome stage, we examined their genomic distribution. Well-positioned nucleosome arrays are highly enriched at promoters (Fig. 1C). Indeed, the average promoter nucleosome profile across all genes shows a clear nucleosome-depleted region and positioned nucleosome arrays emanating from the TSS (Fig. 1D). This type of canonical promoter nucleosome organization has been reported in other organisms (Jiang and Pugh 2009a; Radman-Livaja and Rando 2010). Gene Ontology (GO) analysis revealed that several GO categories related to basic cellular functions are significantly overrepresented in the genes with well-positioned nucleosome arrays at their promoters (Supplemental Fig. S4A). Furthermore, genes with these arrays at their promoters are more conserved across eukaryotic species (Supplemental Fig. S4B) and enriched for housekeeping genes (Supplemental Fig. S4C). Analysis of the nucleosome arrays observed at the 256-cell stage revealed a statistically significant but weaker enrichment at the promoters (Fig. 1C). The average promoter profile at the 256-cell stage also shows weaker canonical nucleosome organization (Fig. 1D), and no GO categories were significantly enriched. Taken together, our results reveal that well-positioned nucleosome arrays emerge at the promoters of housekeeping genes during genome activation.
Co-occurrence of well-positioned nucleosome arrays with H3K4me3 marks
Because well-positioned nucleosome arrays at the dome stage are highly enriched at promoters, we investigated the potential relationship between well-positioned nucleosome arrays and histone marks associated with transcription. We performed nucleosome-resolution ChIP-seq of H3K4me3, H3K27me3, and H3K36me3, and ChIP-seq of RNA polymerase II (Pol II) with two antibodies at the dome stage (Supplemental Table S1; Supplemental Fig. S5A,B), when these marks are well-established (Vastenhouw et al. 2010; Lindeman et al. 2011). Interestingly, 91% of nucleosome arrays at promoters were marked by H3K4me3 (Fig. 2A,B), and H3K4me3 enrichment was stronger in promoters with well-positioned nucleosome arrays than in those without (Supplemental Fig. S6A). These results suggest a potential quantitative relationship between H3K4me3 and nucleosome arrays at the promoters. Indeed, when we ranked genes by their promoter H3K4me3 signals, those with better rank had stronger canonical promoter nucleosome organization (Fig. 2C). To more accurately assess the quantitative relationship between the level of nucleosome arrays and different marks, we assigned a “nucleosome array value” to each promoter (for details, see Methods). Overall, nucleosome array values at promoters showed stronger correlation with H3K4me3 enrichment at the promoters (Fig. 2D) than with either H3K27me3 enrichment at the promoters (Supplemental Figs. S6B,E, S7A), Pol II signals at the promoters and gene bodies (Supplemental Figs. S6C,F,G, S7C,D), or H3K36me3 enrichment at the gene bodies (Supplemental Figs. S6D,H, S7B). To determine whether there is also a correlation of positioned nucleosome arrays with promoter H3K4me3 in mammalian pluripotent cells, we analyzed the quantitative relationship between the level of nucleosome arrays and different marks in mouse embryonic stem cells. While the differences between marks were moderate, we found similar relationships as in zebrafish (Supplemental Fig. S8).
Figure 2.

Well-positioned nucleosome arrays and H3K4me3 co-occur at promoters at the dome stage. (A) Sample profile of nucleosome organization (green) and H3K4me3 (red) around mrpl16 and mrpl39. Gaussian smoothing of the midpoints of nucleosomal DNA was used to represent the nucleosome profile. Identified well-positioned nucleosome arrays are indicated by black bars. (B) Venn diagram showing the overlap of well-positioned nucleosome arrays and H3K4me3 peaks at promoters. A 100-bp overlap was used as a minimal required cutoff. (C) Heatmaps of nucleosome organization; H3K4me3, H3K27me3, and RNA Pol II signals around TSSs; as well as the H3K36me3 signal in the last 2/3 regions of the concatenated exons. Genes are ranked by the H3K4me3 signal at their promoter. Each horizontal line represents the average signal for 100 genes. Color represents RPKM value. Genes were evenly grouped into 20 bins based on H3K4me3 density at their promoters, and the associated distribution of nucleosome array values at these promoters is given in the boxplot. In heatmaps, short genes (<1 kb) were excluded, and if one gene has multiple annotations, only the one with the strongest H3K4me3 signal was kept. A total of 18,890 genes was used. (D) The correlation between H3K4me3 density and nucleosome array value at the promoters. H3K4me3 density is calculated as the log2 transformed RPKM + 1 for each promoter.
Formation of canonical nucleosome organization in the absence of transcriptional elongation
Nucleosome arrays have been reported to result from transcriptional activity (Weiner et al. 2010; Hughes et al. 2012). We therefore analyzed whether well-positioned nucleosome arrays at promoters are specifically associated with genes that undergo transcriptional elongation. The early zebrafish embryo is loaded with maternal transcripts, precluding the identification of transcription status from standard RNA-seq or expression microarray data. We used three approaches to determine the transcription elongation status of genes. First, we used a combination of H3K36me3 ChIP-seq enrichment in exons and Pol II ChIP-seq enrichment in gene bodies to distinguish transcribed from nontranscribed genes at the dome stage (for details, see Supplemental Text 2; Supplemental Fig. S9). Surprisingly, although nucleosome occupancy is lower for nontranscribed genes, both transcribed and nontranscribed genes show similar canonical promoter nucleosome organization at the dome stage using this approach (Fig. 3A; Supplemental Fig. S11A,D,G). In a second approach, we used a combination of H3K36me3 ChIP-seq enrichment in exons and Pol II traveling ratio (Reppas et al. 2006; Rahl et al. 2010) to distinguish transcribed from nontranscribed genes (for details, see Supplemental Text 2). This approach also revealed clear canonical promoter nucleosome organization in nontranscribed genes at the dome stage (Supplemental Fig. S12A–D). In a third approach, we used the classification of a recent study that defined transcription status by distinguishing between parental alleles (Harvey et al. 2013). Using this approach, we also found clear canonical promoter nucleosome organization in nontranscribed genes at the dome stage (Supplemental Fig. S12E–H).
Figure 3.

Canonical nucleosome organization at promoters in the absence of transcriptional elongation. (A) Average promoter nucleosome organization for transcribed (red) and nontranscribed (blue) genes. Transcription status is inferred from H3K36me3 ChIP-seq enrichment in exons and RNA Pol II ChIP-seq enrichment in gene bodies. (B) Average promoter nucleosome organization for three types of nontranscribed genes: bivalent (marked by both H3K4me3 and H3K27me3 at promoters; red), monovalent (marked by H3K4me3, but not by H3K27me3 at promoters; blue) and nonmarked (marked neither by H3K4me3 nor by H3K27me3 at promoters; black) genes. (C) Average promoter nucleosome organization for three types of genes: with elongating Pol II (red), with nonelongating Pol II (blue), and with H3K4me3 at promoters but without Pol II (black). (A–C) All reads were extended to 147 bp; the middle 73 bp were taken, piled up, and normalized by sequencing coverage. Number of genes used to draw an average profile was indicated for each class. Short genes (<1 kb) were excluded. The accompanying nucleosome profiles for each class of genes in the normalized version and at the 256-cell stage are shown in Supplemental Figure S10.
In a previous study, we classified three types of nontranscribed genes at the dome stage based on histone marks in promoters: bivalent (H3K4me3/H3K27me3), monovalent (H3K4me3), and nonmarked genes (neither H3K4me3 nor H3K27me3) (Vastenhouw et al. 2010). We analyzed the nucleosome organization patterns for these classes of genes and found the canonical nucleosome organization to be present at the promoters of bivalent and monovalent genes, but absent from nonmarked genes (Fig. 3B). Together, these findings suggest that the relationship between the establishment of well-positioned nucleosome arrays and H3K4me3 during the maternal-zygotic transition is largely independent of transcriptional elongation.
Promoter nucleosome organization in the absence of robust Pol II binding
Pol II has been suggested to contribute to the formation of well-positioned nucleosome arrays in promoters (Hughes et al. 2012). To assess the effect of Pol II on nucleosome positioning, we classified Pol II at promoters into elongating and nonelongating based on the combination of promoter Pol II enrichment, gene body H3K36me3 enrichment, and Pol II traveling ratio (for details, see Supplemental Text 3; Supplemental Fig. S13A,B). Consistent with previous findings (Yin et al. 2011), the location of the +1 nucleosome is shifted downstream in promoters with elongating Pol II compared to nonelongating Pol II (Fig. 3C, red curve vs. blue curve). Moreover, genes with the strongest Pol II signal in their promoter have weaker nucleosome arrays (Supplemental Fig. S13C–F), which has been observed previously (Gilchrist et al. 2010) and is potentially a reflection of rapid nucleosome turnover.
Nucleosome array values at the promoters are better correlated with H3K4me3 than with Pol II (Fig. 2D; Supplemental Fig. S6F), and, consistent with our previous study (Vastenhouw et al. 2010), many promoters with high H3K4me3 have undetectable levels of Pol II (Supplemental Fig. S5C). This motivated us to examine nucleosome organization at promoters that are marked by H3K4me3 but lack Pol II signals. Interestingly, those promoters still formed well-positioned nucleosome arrays (Fig. 3C, black curve). We examined the possibility that some genes without Pol II are bound by Pol II very weakly. As the average Pol II signal shows a tiny hump at the TSS of genes in this group (Supplemental Fig. S11I), we selected a subset of promoters in this group for which the Pol II signal is below the genomic average and analyzed their nucleosome profile. This more stringently selected subgroup of promoters still has well-positioned nucleosome arrays (Supplemental Fig. S14). Importantly, we observed a similar pattern of well-positioned nucleosome arrays at promoters in mouse embryonic stem cells that are marked by H3K4me3 but lack detectable Pol II binding (Supplemental Fig. S15C). Although very low, transient, or undetectable Pol II binding might be involved in nucleosome positioning, our data reveal that robust binding by Pol II is not required for the establishment of well-positioned nucleosome arrays at promoters during the maternal-zygotic transition.
Correlation of early promoter nucleosome organization with later transcription
Nucleosome organization in promoters is proposed to facilitate recognition by the transcriptional machinery (Hughes et al. 2012; Yen et al. 2012). Since canonical nucleosome organization at the promoters consists of nucleosome-depleted regions and arrays of positioned nucleosomes, we investigated whether these features have any predictive value for gene activation. When classifying genes into five groups based on their level of promoter nucleosome depletion at the 256-cell stage (Supplemental Fig. S16A; for details, see Supplemental Methods), we did not observe a significant relationship between promoter nucleosome depletion and H3K4me3 at promoters or gene transcription at later stages (Supplemental Fig. S17). In contrast, when genes are classified based on nucleosome array value at the 256-cell stage (for details, see Methods; Supplemental Fig. S16B), those with higher promoter nucleosome array values at the 256-cell stage have higher levels of promoter H3K4me3 (Fig. 4A) and are more likely to be transcribed at the dome stage (Fig. 4B; Supplemental Fig. S18). To substantiate this finding, we analyzed an additional developmental stage by generating ChIP-seq data for H3K4me3 at an earlier developmental stage (oblong; 3.5 hpf) (Supplemental Table S1). Indeed, better nucleosome array values at the 256-cell stage were associated with higher H3K4me3 marks at the oblong stage (Fig. 4A). Thus, the presence of nucleosome arrays at promoters before genome activation correlates with subsequent H3K4me3 acquisition and gene expression. To exclude the possibility that these associations are caused by histone modifications rather than nucleosome arrays at the 256-cell stage, we also generated ChIP-seq profiles for H3K4me3 at the 256-cell stage (Supplemental Table S1). Consistent with our previous results (Vastenhouw et al. 2010) and corroborated by analyzing data from an independent study (Supplemental Fig. S19A; Lindeman et al. 2011), signals of H3K4me3 were largely absent in promoters at the 256-cell stage and less correlated with later gene activation (Supplemental Fig. S19B). Taken together, the early presence of nucleosome arrays is a better predictor of future gene activity than nucleosome depletion at promoters.
Figure 4.

Nucleosome organization predicts H3K4me3 and transcription. Genes are grouped evenly into five bins based on promoter nucleosome array value at the 256-cell stage. G1 represents the lowest nucleosome array value, G5 the highest. The sum of the fractions of five groups is 1. (A) The fraction of genes marked by H3K4me3 at promoters at the oblong (black) and dome (gray) stage for each group. (B) The fraction of genes transcribed at the dome stage in each group. Transcription status is inferred from H3K36me3 ChIP-seq enrichment in exons and RNA Pol II ChIP-seq enrichment in gene bodies. Likelihood ratio test of linear correlation is used to calculate P-value.
Discussion
We have exploited the transition from transcriptional silence to widespread gene expression during early zebrafish embryogenesis to determine how nucleosomes are organized at promoters. Our study provides three major insights. First, most well-positioned nucleosome arrays appear on promoters only during genome activation. The emergence of these well-positioned nucleosome arrays cannot be explained by DNA sequence preference. As nucleosome organization is likely to be determined by a combination of multiple factors, more studies will be needed to identify DNA binding proteins and chromatin remodelers that are involved in the formation of nucleosome arrays during genome activation.
Second, canonical nucleosome organization can form independently of robust Pol II binding and active transcription, but correlates well with the presence of H3K4me3 marks. We favor a model wherein ATP-dependent activities are driving nucleosome array formation at the 5′ ends of genes, as described in studies of in vitro nucleosome positioning in yeast (Zhang et al. 2011). Our results indicate that H3K4me3 is a better predictor of nucleosome array formation at the promoters than Pol II binding. Indeed, promoters marked by high H3K4me3 but no detectable Pol II binding can form well-positioned nucleosome arrays. Although it is impossible to exclude the possibility that very low, transient, and undetectable levels of Pol II binding contribute to nucleosome positioning, our analysis of data in mouse embryonic stem cells also suggests that H3K4me3 may be a better predictor of nucleosome array formation than Pol II binding. We suggest that genome activation, but not transcription, is central to the organization of nucleosome arrays during early embryogenesis.
Third, promoter nucleosome organization before genome activation has predictive value for future gene activation. This observation is reminiscent of the proposed roles of monovalent (H3K4me3) and bivalent (H3K4me3 and H3K27me3) domains in poising genes for activation (Bernstein et al. 2006; Vastenhouw and Schier 2012). It is tempting to speculate that pioneer factors, chromatin remodelers, and histone modifiers establish nucleosome arrays and H3K4me3 marks at promoters before and during genome activation and prepare genes for subsequent transcriptional activation.
Methods
Zebrafish
Zebrafish were maintained and raised under standard conditions. Wild-type embryos were collected at the one-cell stage, synchronized, and allowed to develop to the desired stage at 28°C.
MNase digestion
MNase digestion was performed essentially as previously described (He et al. 2010). Briefly, between 250 and 650 embryos were carefully staged, dechorionated, and fixed in 1% formaldehyde for 3 min at room temperature. Formaldehyde was quenched by adding glycine to a final concentration of 0.125 M. Embryos were rinsed three times in ice-cold PBS, immediately resuspended in cell lysis buffer (10 mM Tris-HCl at pH 7.5, 10 mM NaCl, 0.5% NP40), and lysed for 3–4 min on ice. Nuclei were collected by centrifugation, washed with ice-cold PBS, collected by centrifugation again, and resuspended in digestion buffer (50 mM Tris-HCl at pH7.5, 1 mM CaCl2, 0.2% Triton X-100). Samples were divided into 200 μL aliquots, prewarmed to 25°C, and incubated with MNase (stored in MNase storage buffer [10 mM Hepes at pH 7.5, 100 mM NaCl, 1 mM CaCl2, 50% glycerol] and diluted in MNase dilution buffer [50 mM Tris-HCl at pH 8, 10 mM NaCl , 126 mM CaCl2, 5% glycerol]). The concentration of MNase and time of incubation were optimized to obtain 80% mononucleosomes as determined by Bioanalyzer analysis (Supplemental Fig. S1B).
If nucleosomes were directly sequenced, reactions were stopped by adding the samples to 200 μL MNase STOP and de-crosslinking buffer (1% SDS, 100 mM NaHCO3, 25 mM EDTA) in a 15-mL tube. Samples were then sonicated and centrifuged for 10 min at 4°C, and the supernatant was incubated for 90 min at 65°C to reverse crosslinks. Upon precipitation, DNA was purified by a QIAquick PCR purification kit (Qiagen).
If nucleosomes were used for ChIP, reactions were stopped by adding samples to 200 μL MNase STOP buffer (10 mM Tris-HCl at pH 7.6, 20 mM EDTA) in a 15-mL tube. Samples were then sonicated and dialyzed against ChIP buffer (27.8 mM Tris-HCl at pH 7.7, 111 mM NaCl, 4.1 mM EDTA, 0.34% SDS, 0.8% Triton X-100) for 2 h at 4°C. After centrifugation, the supernatant (chromatin) was used in ChIPs as described below.
Antibodies
Antibodies used were H3K4me3 (Millipore 07-473), H3K27me3 (Millipore 07-449), H3K36me3 (Abcam ab9050), and RNA Pol II (8WG16/Covance MMS-126R and ab5408).
ChIP
RNA Pol II ChIPs were performed essentially as previously described (Vastenhouw et al. 2010) with some minor modifications. Briefly, between 400 and 800 embryos were staged, dechorionated, and fixed in 1.85% formaldehyde and 12.5% DMSO for 15 min at room temperature. Formaldehyde was quenched by adding glycine to a final concentration of 0.125 M. Embryos were rinsed three times in ice-cold PBS, immediately resuspended in cell lysis buffer (10 mM Tris-HCl at pH 7.5, 10 mM NaCl, 0.5% NP-40), and lysed for 15 min on ice. Nuclei were collected by centrifugation, resuspended in nuclear lysis buffer (50 mM Tris-HCl at pH 7.5, 10 mM EDTA/1% SDS), and lysed for 10 min on ice. Samples were diluted three times in IP dilution buffer (16.7 mM Tris-HCl at pH7.5, 167 mM NaCl, 1.2 mM EDTA, 0.01% SDS), and sonicated to obtain fragments of ∼400 bp. Triton X-100 was added to a final concentration of 0.75%. Lysate was incubated overnight, with rotating, at 4°C with 25 μL of protein G magnetic Dynabeads (Invitrogen) that had been prebound to an excess amount of antibody. Bound complexes were extensively washed with RIPA (50 mM HEPES at pH 7.6, 1 mM EDTA, 0.7% DOC/1% Igepal, 0.5 M LiCl) and TBS, then eluted from the beads with elution buffer (50 mM NaHCO3, 1% SDS). Cross-links were reversed overnight at 65°C, and DNA was purified by a QIAquick PCR purification kit (Qiagen). For MNase/ChIP, between 300 and 700 embryos were used per condition, and after dialysis, chromatin was added to the bead/antibody complex as described above.
Library preparation and sequencing
Libraries were prepared using the Illumina sequencing library preparation protocol and sequenced on an Illumina HiSeq 2000.
Read mapping and nucleosome profiles
All sequenced reads were mapped back to the zebrafish genome (zv9 assembly) using Bowtie. Uniquely mapped reads with a maximum of two mismatches were kept for further analysis. The formula used to calculate the genomic coverage of nucleosomal sequence reads is as follows: number of reads × 147 bp/genome size. To create nucleosome profiles, all mapped reads were extended to 147 bp in their 3′ direction, and the middle 73 bp were piled up, as previously described (Zhang et al. 2008).
Nucleosome array value and well-positioned nucleosome arrays
The 73rd base pair downstream from the 5′ end of a nucleosomal sequence read is termed the midpoint of nucleosomal DNA. To capture the features of well-positioned nucleosome arrays, we displayed the signal of nucleosome midpoints in a two-dimensional coordinate system with genomic positions on the x-axis and the number of nucleosome centers on the y-axis. Signal processing was performed as follows. First, Gaussian smoothing was applied on the signals with a 147-bp sliding window and 30 bp as the standard deviation. The difference of the signals on adjacent base pairs (i.e., the first-order derivative of the signal) was taken, then the absolute value of the difference on every base pair was calculated. If the value at a certain base pair was larger than any value within the [−73 bp, +73 bp] window, it was defined as a local maximum. All adjacent maxima were connected to create a curve spanning the whole genome. The height of the curve at each base pair is the nucleosome array value. The nucleosome array value for each promoter was then calculated by taking the average value of all base pairs in the promoter region.
Based on nucleosome array values, well-positioned nucleosome arrays were identified as follows. The average nucleosome array value of the whole genome was calculated and used as background, and the nucleosome array value at each base pair was transformed to a fold enrichment value over the background. This creates two types of segments: over background (fold enrichment larger than one) and under background (fold enrichment larger than one). Well-positioned nucleosome arrays are defined as over background segments with length >1000 bp and average fold enrichment larger than 1.75.
Histone modification and Pol II status of genes
For this analysis, we used a set of 48,373 previously annotated genes in the zebrafish genome (Pauli et al. 2012). To ensure unambiguous classification between high and low statuses, genes with moderate enrichment for histone modifications and Pol II were excluded from average profiles analyses. For H3K4me3, if a gene contained more than 10 ChIP-seq reads in its promoter region (defined as the region from 2 kb upstream of the TSS to 2 kb downstream from the TSS), and the average signal in its promoter was >4 RPKM (reads per kilobases per million reads), the H3K4me3 status of the gene was considered high. If the average signal in its promoter was <1 RPKM, the H3K4me3 status of the gene was considered low. The H3K4me3 status for all other genes was considered moderate. The H3K27me3 status was defined with the same criteria. For H3K36me3, if a gene contained more than 10 reads in the last 2/3 regions of concatenated exons, and the average signal in the same region was > 4 RPKM, the H3K36me3 status of the gene was defined as high. If the number of reads in the average signal was <1 RPKM, the H3K36me3 status of the gene was low. The H3K36me3 status for all other genes was defined as moderate. For Pol II in promoters, if a gene contained more than 10 ChIP-seq reads in its promoter region, and the average signal in its promoter was >2.5 RPKM, the Pol II promoter status of the gene was considered high. If the average signal in its promoter was <1 RPKM, the Pol II promoter status of the gene was considered low. The Pol II promoter status for all other genes was considered moderate. For Pol II in gene bodies, if the average signal in the gene body was >2 RPKM, the Pol II gene body status of the gene was considered high. If the average signal in the gene body was <1 RPKM, the Pol II gene body status of the gene was considered low. The Pol II gene body status for all other genes was considered moderate.
Data access
The DNA and RNA sequencing data of zebrafish from this study have been submitted to the NCBI Gene Expression Omnibus (GEO; http://www.ncbi.nlm.nih.gov/geo/) under accession number GSE44269. The DNA sequencing data of mouse from this study have been submitted to NCBI GEO under accession number GSE51766.
Acknowledgments
We thank Housheng H. He for technical help. This project was supported by the National Basic Research Program of China (973 Programs: 2010CB944904, 2011CB965104), the National Natural Science Foundation of China (31071114, 31322031, 31371288, 31329003), the Shanghai Rising-Star Program (13QH1402200), the US National Institutes of Health (HD071298, HD072733, GM056211, 5K99HD067220-02), the Human Frontiers Science Program, the Medical Foundation, and the Max Planck Society.
Footnotes
[Supplemental material is available for this article.]
Article published online before print. Article, supplemental material, and publication date are at http://www.genome.org/cgi/doi/10.1101/gr.157750.113.
Freely available online through the Genome Research Open Access option.
References
- Albert I, Mavrich T, Tomsho L, Qi J, Zanton S, Schuster S, Pugh BF 2007. Translational and rotational settings of H2A.Z nucleosomes across the Saccharomyces cerevisiae genome. Nature 446: 572–576 [DOI] [PubMed] [Google Scholar]
- Bai L, Morozov AV 2010. Gene regulation by nucleosome positioning. Trends Genet 26: 476–483 [DOI] [PubMed] [Google Scholar]
- Bernstein BE, Mikkelsen TS, Xie X, Kamal M, Huebert DJ, Cuff J, Fry B, Meissner A, Wernig M, Plath K, et al. 2006. A bivalent chromatin structure marks key developmental genes in embryonic stem cells. Cell 125: 315–326 [DOI] [PubMed] [Google Scholar]
- Gaffney D, McVicker G, Pai A, Fondufe-Mittendorf Y, Lewellen N, Michelini K, Widom J, Gilad Y, Pritchard J 2012. Controls of nucleosome positioning in the human genome. PLoS Genet 8: e1003036. [DOI] [PMC free article] [PubMed] [Google Scholar]
- Gilchrist DA, Dos Santos G, Fargo DC, Xie B, Gao Y, Li L, Adelman K 2010. Pausing of RNA polymerase II disrupts DNA-specified nucleosome organization to enable precise gene regulation. Cell 143: 540–551 [DOI] [PMC free article] [PubMed] [Google Scholar]
- Gkikopoulos T, Schofield P, Singh V, Pinskaya M, Mellor J, Smolle M, Workman JL, Barton GJ, Owen-Hughes T 2011. A role for Snf2-related nucleosome-spacing enzymes in genome-wide nucleosome organization. Science 333: 1758–1760 [DOI] [PMC free article] [PubMed] [Google Scholar]
- Harvey SA, Sealy I, Kettleborough R, Fenyes F, White R, Stemple D, Smith JC 2013. Identification of the zebrafish maternal and paternal transcriptomes. Development 140: 2703–2710 [DOI] [PMC free article] [PubMed] [Google Scholar]
- He HH, Meyer C, Shin H, Bailey ST, Wei G, Wang Q, Zhang Y, Xu K, Ni M, Lupien M, et al. 2010. Nucleosome dynamics define transcriptional enhancers. Nat Genet 42: 343–347 [DOI] [PMC free article] [PubMed] [Google Scholar]
- Hu G, Schones DE, Cui K, Ybarra R, Northrup D, Tang Q, Gattinoni L, Restifo NP, Huang S, Zhao K 2011. Regulation of nucleosome landscape and transcription factor targeting at tissue-specific enhancers by BRG1. Genome Res 21: 1650–1658 [DOI] [PMC free article] [PubMed] [Google Scholar]
- Hughes AL, Jin Y, Rando O, Struhl K 2012. A functional evolutionary approach to identify determinants of nucleosome positioning: A unifying model for establishing the genome-wide pattern. Mol Cell 48: 5–15 [DOI] [PMC free article] [PubMed] [Google Scholar]
- Jiang C, Pugh BF 2009a. A compiled and systematic reference map of nucleosome positions across the Saccharomyces cerevisiae genome. Genome Biol 10: R109. [DOI] [PMC free article] [PubMed] [Google Scholar]
- Jiang C, Pugh BF 2009b. Nucleosome positioning and gene regulation: Advances through genomics. Nat Rev Genet 10: 161–172 [DOI] [PMC free article] [PubMed] [Google Scholar]
- Kane DA, Kimmel CB 1993. The zebrafish midblastula transition. Development 119: 447–456 [DOI] [PubMed] [Google Scholar]
- Kaplan N, Moore I, Fondufe-Mittendorf Y, Gossett AJ, Tillo D, Field Y, Leproust E, Hughes T, Lieb J, Widom J, et al. 2009. The DNA-encoded nucleosome organization of a eukaryotic genome. Nature 458: 362–366 [DOI] [PMC free article] [PubMed] [Google Scholar]
- Lee W, Tillo D, Bray N, Morse R, Davis R, Hughes T, Nislow C 2007. A high-resolution atlas of nucleosome occupancy in yeast. Nat Genet 39: 1235–1244 [DOI] [PubMed] [Google Scholar]
- Li Z, Schug J, Tuteja G, White P, Kaestner KH 2011. The nucleosome map of the mammalian liver. Nat Struct Mol Biol 18: 742–746 [DOI] [PMC free article] [PubMed] [Google Scholar]
- Lindeman LC, Andersen IS, Reiner AH, Li N, Aanes H, Ostrup O, Winata C, Mathavan S, Muller F, Alestrom P, et al. 2011. Prepatterning of developmental gene expression by modified histones before zygotic genome activation. Dev Cell 21: 993–1004 [DOI] [PubMed] [Google Scholar]
- Mavrich T, Ioshikhes I, Venters B, Jiang C, Tomsho L, Qi J, Schuster S, Albert I, Pugh BF 2008a. A barrier nucleosome model for statistical positioning of nucleosomes throughout the yeast genome. Genome Res 18: 1073–1083 [DOI] [PMC free article] [PubMed] [Google Scholar]
- Mavrich T, Jiang C, Ioshikhes I, Li X, Venters B, Zanton S, Tomsho L, Qi J, Glaser R, Schuster S, et al. 2008b. Nucleosome organization in the Drosophila genome. Nature 453: 358–362 [DOI] [PMC free article] [PubMed] [Google Scholar]
- Nekrasov M, Amrichova J, Parker BJ, Soboleva TA, Jack C, Williams R, Huttley GA, Tremethick DJ 2012. Histone H2A.Z inheritance during the cell cycle and its impact on promoter organization and dynamics. Nat Struct Mol Biol 19: 1076–1083 [DOI] [PubMed] [Google Scholar]
- Pauli A, Valen E, Lin MF, Garber M, Vastenhouw NL, Levin JZ, Fan L, Sandelin A, Rinn JL, Regev A, et al. 2012. Systematic identification of long noncoding RNAs expressed during zebrafish embryogenesis. Genome Res 22: 577–591 [DOI] [PMC free article] [PubMed] [Google Scholar]
- Radman-Livaja M, Rando O 2010. Nucleosome positioning: How is it established, and why does it matter? Dev Biol 339: 258–266 [DOI] [PMC free article] [PubMed] [Google Scholar]
- Rahl PB, Lin CY, Seila AC, Flynn RA, McCuine S, Burge CB, Sharp PA, Young RA 2010. c-Myc regulates transcriptional pause release. Cell 141: 432–445 [DOI] [PMC free article] [PubMed] [Google Scholar]
- Reppas NB, Wade JT, Church GM, Struhl K 2006. The transition between transcriptional initiation and elongation in E. coli is highly variable and often rate limiting. Mol Cell 24: 747–757 [DOI] [PubMed] [Google Scholar]
- Schier AF 2007. The maternal-zygotic transition: Death and birth of RNAs. Science 316: 406–407 [DOI] [PubMed] [Google Scholar]
- Schones DE, Cui K, Cuddapah S, Roh TY, Barski A, Wang Z, Wei G, Zhao K 2008. Dynamic regulation of nucleosome positioning in the human genome. Cell 132: 887–898 [DOI] [PMC free article] [PubMed] [Google Scholar]
- Segal E, Fondufe-Mittendorf Y, Chen L, Thastrom A, Field Y, Moore I, Wang J, Widom J 2006. A genomic code for nucleosome positioning. Nature 442: 772–778 [DOI] [PMC free article] [PubMed] [Google Scholar]
- Shivaswamy S, Bhinge A, Zhao Y, Jones S, Hirst M, Iyer VR 2008. Dynamic remodeling of individual nucleosomes across a eukaryotic genome in response to transcriptional perturbation. PLoS Biol 6: e65. [DOI] [PMC free article] [PubMed] [Google Scholar]
- Stein A, Takasuka TE, Collings CK 2010. Are nucleosome positions in vivo primarily determined by histone-DNA sequence preferences? Nucleic Acids Res 38: 709–719 [DOI] [PMC free article] [PubMed] [Google Scholar]
- Struhl K, Segal E 2013. Determinants of nucleosome positioning. Nat Struct Mol Biol 20: 267–273 [DOI] [PMC free article] [PubMed] [Google Scholar]
- Tadros W, Lipshitz HD 2009. The maternal-to-zygotic transition: A play in two acts. Development 136: 3033–3042 [DOI] [PubMed] [Google Scholar]
- Teif VB, Vainshtein Y, Caudron-Herger M, Mallm J, Marth C, Hofer T, Rippe K 2012. Genome-wide nucleosome positioning during embryonic stem cell development. Nat Struct Mol Biol 19: 1185–1192 [DOI] [PubMed] [Google Scholar]
- Valouev A, Ichikawa J, Tonthat T, Stuart J, Ranade S, Peckham H, Zeng K, Malek JA, Costa G, McKernan K, et al. 2008. A high-resolution, nucleosome position map of C. elegans reveals a lack of universal sequence-dictated positioning. Genome Res 18: 1051–1063 [DOI] [PMC free article] [PubMed] [Google Scholar]
- Valouev A, Johnson SM, Boyd SD, Smith CL, Fire AZ, Sidow A 2011. Determinants of nucleosome organization in primary human cells. Nature 474: 516–520 [DOI] [PMC free article] [PubMed] [Google Scholar]
- Vastenhouw NL, Schier AF 2012. Bivalent histone modifications in early embryogenesis. Curr Opin Cell Biol 24: 374–386 [DOI] [PMC free article] [PubMed] [Google Scholar]
- Vastenhouw NL, Zhang Y, Woods IG, Imam F, Regev A, Liu X, Rinn J, Schier AF 2010. Chromatin signature of embryonic pluripotency is established during genome activation. Nature 464: 922–926 [DOI] [PMC free article] [PubMed] [Google Scholar]
- Weiner A, Hughes A, Yassour M, Rando O, Friedman N 2010. High-resolution nucleosome mapping reveals transcription-dependent promoter packaging. Genome Res 20: 90–100 [DOI] [PMC free article] [PubMed] [Google Scholar]
- Yen K, Vinayachandran V, Batta K, Koerber RT, Pugh BF 2012. Genome-wide nucleosome specificity and directionality of chromatin remodelers. Cell 149: 1461–1473 [DOI] [PMC free article] [PubMed] [Google Scholar]
- Yin H, Sweeney S, Raha D, Snyder M, Lin H 2011. A high-resolution whole-genome map of key chromatin modifications in the adult Drosophila melanogaster. PLoS Genet 7: e1002380. [DOI] [PMC free article] [PubMed] [Google Scholar]
- Yuan GC, Liu YJ, Dion MF, Slack MD, Wu LF, Altschuler SJ, Rando O 2005. Genome-scale identification of nucleosome positions in S. cerevisiae. Science 309: 626–630 [DOI] [PubMed] [Google Scholar]
- Zhang Y, Shin H, Song JS, Lei Y, Liu XS 2008. Identifying positioned nucleosomes with epigenetic marks in human from ChIP-Seq. BMC Genomics 9: 537. [DOI] [PMC free article] [PubMed] [Google Scholar]
- Zhang Y, Moqtaderi Z, Rattner B, Euskirchen G, Snyder M, Kadonaga J, Liu X, Struhl K 2009. Intrinsic histone-DNA interactions are not the major determinant of nucleosome positions in vivo. Nat Struct Mol Biol 16: 847–852 [DOI] [PMC free article] [PubMed] [Google Scholar]
- Zhang Z, Wippo CJ, Wal M, Ward E, Korber P, Pugh BF 2011. A packing mechanism for nucleosome organization reconstituted across a eukaryotic genome. Science 332: 977–980 [DOI] [PMC free article] [PubMed] [Google Scholar]