Abstract
The neural crest is an embryonic stem cell population that gives rise to a multitude of derivatives. In particular, the cranial neural crest (CNC) is unique in its ability to contribute to both facial skeleton and peripheral ganglia. To gain further insight into the molecular underpinnings that distinguish the CNC from other embryonic tissues, we have utilized a CNC-specific enhancer as a tool to isolate a pure, region-specific NC subpopulation for transcriptional profiling. The resulting data set reveals previously unknown transcription factors and signaling pathways that may influence the CNC's ability to migrate and/or differentiate into unique derivatives. To elaborate on the CNC gene regulatory network, we evaluated the effects of knocking down known neural plate border genes and early neural crest specifier genes on selected neural crest-enriched transcripts. The results suggest that ETS1 and SOX9 may act as pan-neural crest regulators of the migratory CNC. Taken together, our analysis provides unprecedented characterization of the migratory CNC transcriptome and identifies new links in the gene regulatory network responsible for development of this critical cell population.
The neural crest is a multipotent cell population that contributes to a wide variety of derivatives, including sensory and autonomic ganglia of the peripheral nervous system, cartilage and bone of the face, and pigmentation of the skin (Le Douarin and Kalcheim 1999). Acquisition of the neural crest played a critical role in vertebrate evolution, facilitating evolution of the jaw and active predation that fostered diversification of vertebrates (Gans and Northcutt 1983). Due to the extensive contributions of the neural crest to vertebrate embryos (Hall 2000), defects in its development contribute to a large percentage of congenital birth defects (Trainor 2010).
Neural crest cells are induced during gastrulation (Basch et al. 2006), but first become apparent as “premigratory” cells in the dorsal neural tube by expression of a suite of neural crest specifier genes like FOXD3, SNAI2, and SOX9 (Sauka-Spengler and Bronner-Fraser 2008). They subsequently undergo an epithelial to mesenchymal transition (EMT) to leave the neural tube, migrate long distances, and differentiate into diverse cell types. To understand the progression of their development, we have proposed a gene regulatory network (GRN) that underlies this complex process (Meulemans and Bronner-Fraser 2004), comprised of nested subnetworks, each controlling distinct events from specification to emigration, and ultimately to migration and differentiation (Betancur et al. 2010a). However, this network is far from complete: A relatively small number of transcriptional regulators have been identified/characterized, and little is known about effector genes present in migrating neural crest cells (Simões-Costa and Bronner 2013). Thus, elaboration of the neural crest GRN is crucial to clarify how distinct differentiation programs are activated in multipotential precursors to drive commitment toward specific fates.
Although all neural crest cells share common molecular and behavioral traits, they can be subdivided operationally according to their axial level of origin, as cranial, vagal, trunk, and sacral (Le Douarin and Kalcheim 1999). These subpopulations differ in migratory pathways and types of derivatives formed; e.g., cranial neural crest (CNC) has the ability to give rise to cartilage and bone, whereas trunk neural crest does not, even after transplantation in the head (Nakamura and Ayer-le Lievre 1982; Le Douarin et al. 2004). Recent evidence points to distinct regulatory programs controlling expression of neural crest specifier genes SOX10 and FOXD3 in these two subpopulations (Betancur et al. 2010b; Simões-Costa et al. 2012), raising the intriguing possibility that a molecular framework may underlie such differences.
Here, we take advantage of a cranial-specific neural crest enhancer as a tool to isolate pure populations of migrating CNC cells from an in vivo context, allowing us to obtain a genome-wide representation of the active transcriptome of this important cell population. Because migrating CNCs intermingle with other mesenchymal cell types, obtaining pure populations has been particularly difficult. Moreover, no available reagents distinguish CNCs from subpopulations at other axial levels. Recently, however, we have isolated NC enhancers that mediate gene expression at unique stages and axial levels (Betancur et al. 2010a), including Sox10E2, which mediates reporter expression selectively in all migrating CNC. This tool enables us to isolate these cells and obtain genome-wide information regarding their active transcriptome using RNA-seq. Here, we utilize this approach to characterize the suite of genes enriched in migratory CNCs. The results provide unprecedented characterization of their transcriptome and allow identification of new links in the GRN responsible for development of this critical cell population.
Results
Isolation of pure cranial neural crest population
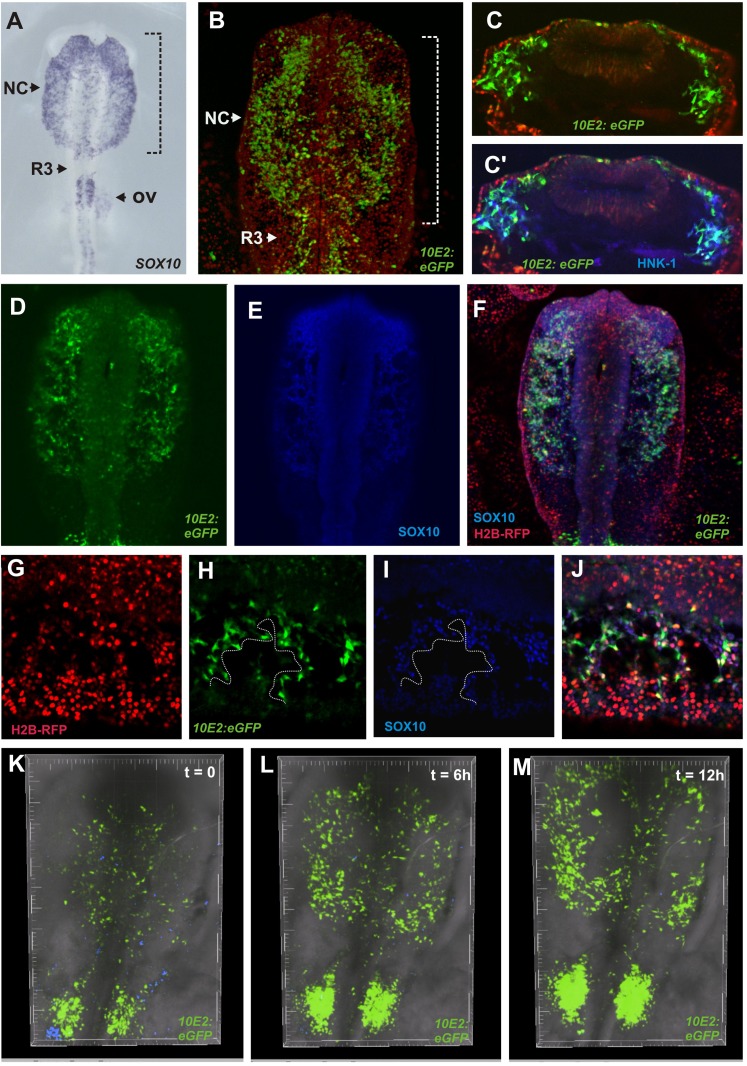
Expression of the specifier gene SOX10 initiates as NC cells commence emigration from the neural tube at all axial levels (Kim et al. 2003; McKeown et al. 2005). Previously, we identified avian NC enhancers that drive reporter expression in a manner that recapitulates endogenous SOX10 expression (Fig. 1A; Betancur et al. 2010b). In particular, Sox10E2 (Fig. 1B,C,C′) mediates expression in the CNC but not in the trunk subpopulations.
Figure 1.
SOX10 cis-regulatory element drives specific reporter expression in the migratory cranial neural crest. (A) Neural crest specifier gene, SOX10, is expressed by all migrating neural crest cells. (B) A chicken embryo electroporated with Sox10E2 enhancer has GFP expression in migratory CNC at HH10. (C,C′) Transverse sections of HH10 chicken embryo electroporated with Sox10E2:eGFP plasmid. GFP+ cells are also immunoreactive for the HNK-1 epitope. (D–F) Colocalization of GFP+ cells and endogenous SOX10 confirms specificity of Sox10E2 enhancer in the CNC. (G–J) Confocal imaging confirms that of all electroporated cells (red), only the ones with SOX10 positive nuclei (blue) express GFP. (K–M) Time-lapse imaging of a chicken embryo electroporated with Sox10E2:eGFP demonstrates the extensive movements of cranial neural crest in the embryonic head (see Supplemental Movie 1). (NC) Neural crest; (R3) rhombomere 3; (OV) otic vesicle.
To confirm specificity, we compared enhancer activity with endogenous SOX10 expression. Antibody staining in embryos electroporated with Sox10E2:eGFP shows that the enhancer is only active in SOX10+ neural crest (Fig. 1D–F). Although the majority of ectodermal cells are efficiently coelectroporated with Sox10E2 enhancer-driven (eGFP) and ubiquitous promoter-driven (mRFP) constructs, as highlighted by H2B-RFP expression (Fig. 1G), only SOX10+ cells exhibit eGFP expression (Fig. 1H–J). To examine enhancer activity during neural crest migration, we performed time-lapse imaging. Supplemental Movie 1 highlights the remarkable movement of CNC cells as they migrate throughout the embryonic head (Fig. 1K–M). Thus, Sox10E2 enhancer is a useful tool for in vivo labeling and identifying migrating CNCs.
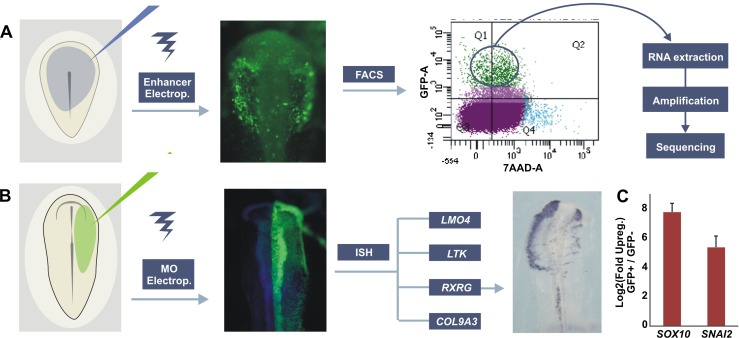
In order to obtain a transcriptional profile of the CNC, Sox10E2:eGFP was electroporated into gastrula-stage chick embryos subsequently incubated to stages of active CNC migration (HH10) (Fig. 2A). After dissection and dissociation of embryos, a pure population of migrating CNC cells was isolated by FACS with 7-AAD exclusion to eliminate unhealthy or dying cells. Approximately 5%–10% of the viable dissociated cranial cells expressed eGFP, resulting in about 500–1000 labeled CNC cells per electroporated embryo. After sorting, cells were tested for enrichment of known neural crest markers such as SOX10 and SNAI2 (Fig. 2C) using qPCR. Isolated GFP+ sorted CNC cells had strong enrichment for both genes relative to GFP− cells. Subsequently, RNA of the purified CNC population was extracted and reverse transcribed. cDNA was amplified using a linear amplification system and used for sequencing library building.
Figure 2.
Experimental design for transcriptome analysis of cranial neural crest cells and loss-of-function studies. (A) Gastrula stage embryos were electroporated with Sox10e2:eGFP construct and incubated until HH10. In preparation for FACS, embryos were dissected and enzymatically dissociated. GFP+ cells were sorted with 7-AAD exclusion to eliminate damaged or dead cells. RNA from GFP+ and GFP− cells was extracted, reverse transcribed, and linearly amplified for high-throughput sequencing. (B) Loss-of-function studies in chicken embryos. Translation-blocking morpholinos (MO) targeted to known neural crest regulators were injected into one side of HH6 embryos, with the uninjected side used as an internal control. Electroporated embryos were allowed to develop until HH10 and expression of novel neural crest specific genes were analyzed by in situ hybridization (ISH). (C) qPCR confirm up-regulation of neural crest markers in sorted Sox10E2:eGFP+ cells in relation to GFP− cells.
Identification of genes enhanced in migrating cranial neural crest
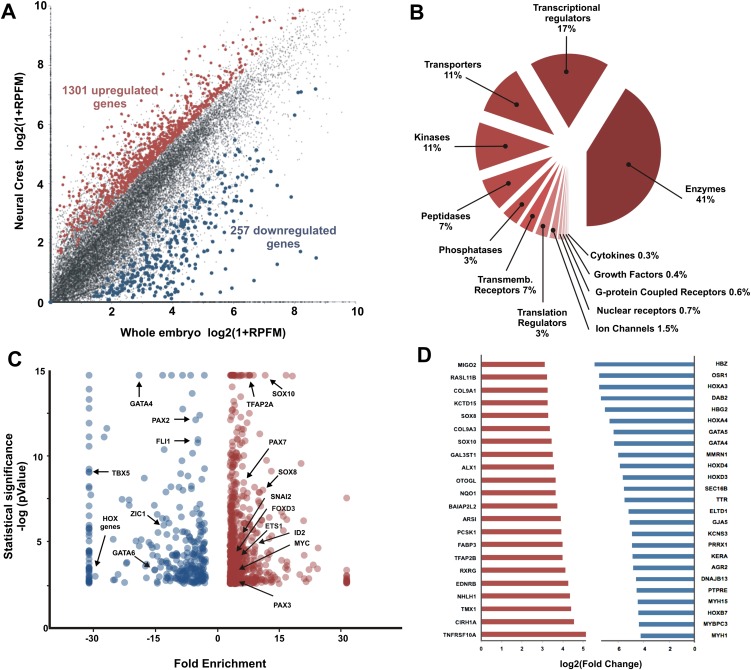
The CNC RNA-seq results were compared with those of GFP− cells sorted from whole embryos of the same stage to identify transcripts enriched in migrating CNC. The results revealed numerous molecules strongly enriched in migrating crest compared with the whole embryo. We identified 1301 significantly up-regulated genes (Fig. 3A; Supplemental Table 1) that satisfied criteria we established for the CNC data set (see Methods). Enhanced genes included phosphatases, transporters, peptidases, transmembrane receptors, kinases, ion channels, G-coupled receptors, transmembrane receptors and transcriptional regulators. Figure 3B shows the relative abundance of transcripts grouped by molecular function. Enzymes accounted for 41% of up-regulated transcripts, followed by transcriptional regulators (17%) and transporter molecules (11%). The data set also included a large number of uncharacterized proteins (83 genes) (see Supplemental Table 1), perhaps reflecting limitations of the current chick genome assembly. In addition, 257 genes were depleted in the migrating CNC population relative to the whole embryo (Supplemental Table 2).
Figure 3.
Cranial neural crest transcriptome data set reveals hundreds of genes up-regulated in cranial neural crest cells. (A) Our transcriptome analysis identified 1301 genes significantly up-regulated in the migratory cranial crest, and 257 genes that were excluded from this population. (B) Genes enriched in CNC. The largest fraction are enzymes, followed by transcriptional regulators and transporter molecules. (C) Transcription factors known to be important players in the migratory neural crest are among the enriched genes in the CNC transcriptome data set. (D) Most enriched and depleted genes in the cranial neural crest. SOX10 and SOX8 are among the genes that are the most enriched in the cranial neural crest, whereas several HOX genes are absent from this anterior cell population, as expected.
As proof of principle regarding data set quality, we looked for known transcription factors, including bona fide neural crest markers such as TFAP2A, PAX7, SOX8 and SOX10, FOXD3, among others. As expected, all were present in our data set (Fig. 3C). SOX10 is one of the genes with highest enrichment relative to GFP− cells (Fig. 3D). ETS1, a key regulator of CNC formation (Théveneau et al. 2007; Betancur et al. 2010b; Simões-Costa et al. 2012), is significantly enriched in the data set although it is strongly expressed in other embryonic tissues such as endothelial cells.
Figure 3D shows genes with high enhancement or depletion in the migratory CNC. In addition to transcription factors, genes known to play important roles in CNC formation are also present. For example, Collagens 2 and 9, crucial for chondrocyte development, are enriched (Fig. 3D), as are nuclear receptors such as RXRG and other transcriptional regulators such as ALX1. Genes visibly down-regulated or absent from the CNC include a number of HOX genes, which is expected since the CNC lacks most HOX genes, GATA factors 4,5,6 as well as TBX5, 20 and 15 (Fig. 3C; Supplemental Table 2). Importantly, ZIC1, important for trunk NC specification and a trunk-specific input in FOXD3 (Simões-Costa et al. 2012), is also absent from the CNC (Fig. 3C).
Biological pathway analysis of cranial neural crest transcriptome
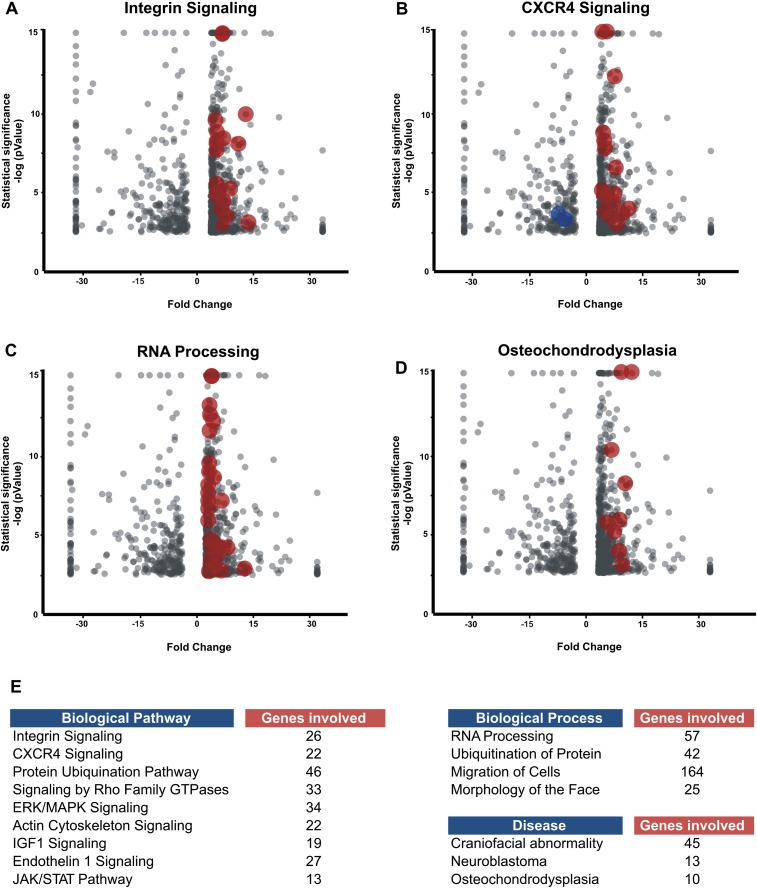
To gain an overview of the molecular processes operational in the CNC transcriptome, we performed a biological pathway analysis of the data set. Confirming its utility, the results reveal enrichment in genes involved in pathways known to be important for neural crest migration, such as integrin (Fig. 4A) and CXCR4 signaling (Fig. 4B). Revealing predictive value, the analysis also suggests molecular processes that have yet to be investigated in depth during neural crest formation. For example, a large number of molecules related to RNA processing are up-regulated in the CNC (Fig. 4C). This suggests that RNA-binding proteins and differential splicing mechanisms may be important in neural crest development. Similarly, a number of molecules involved in post-translational modification, such as the ubiquitination pathway, are present in the data set. This result is consistent with recent findings indicating the importance of molecules involved in post-translational modification in regulating aspects of neural crest development (Lee et al. 2012). The analysis also points to a potential role for pathways that have yet to be investigated in neural crest development, such as the IGF1 and JAK/STAT pathways (Fig. 4E).
Figure 4.
Pathways, processes, and diseases associated with the CNC transcriptome data set. Biological pathway analysis shows enrichment of migrating cranial crest genes involved in integrin (A) and CXCR4 (B) signaling, as expected since both signaling systems are essential for neural crest migration. This analysis also reveals potential roles for post-translational regulation in CNC development as a large number of molecules involved in RNA splicing and processing are up-regulated (C). (D) Genes involved in diseases such as osteochondrodysplasia are present in the data set, which is consistent with the contribution of the neural crest to the craniofacial skeleton. (E) Enrichment of CNC genes in other pathways, processes, and diseases.
A number of genes in the CNC transcriptome data set are disease-related. Our analysis revealed association of CNC genes with diseases such as osteochondrodysplasia (Fig. 4D), consistent with the importance of CNC for the formation of the skeletal elements of the face. Furthermore, the data set contains genes linked to malignant diseases, such as neuroblastoma, glioma, and other types of neural crest derived cancers (Fig. 4E). This is expected due to the similar behavior of neural crest cells and metastatic cancers and the fact that several neural crest genes such as MYC and CXCR4 are routinely used as biomarkers for tumor diagnosis.
Novel transcriptional regulators for the cranial neural crest
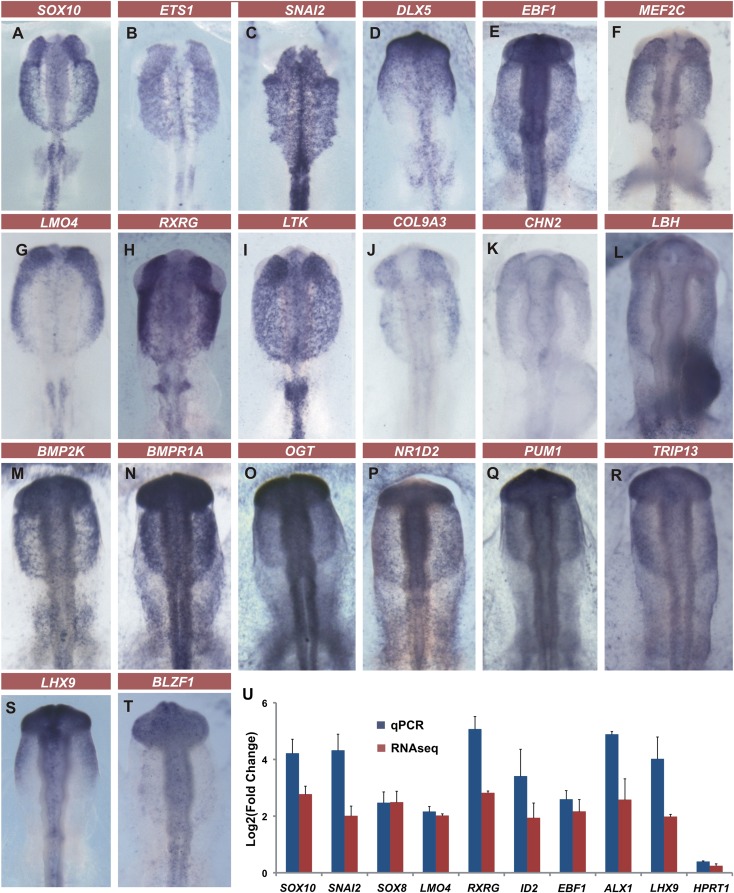
To validate the CNC transcriptome data set, we performed a secondary in situ hybridization screen (Fig. 5). The results reveal many interesting candidate genes that may play a role in the process of CNC migration and/or differentiation. Eighty-five genes were cloned and their expression patterns verified by in situ hybridization. Approximately 90% of genes had strong expression in the migrating CNC as expected (Supplemental Table 3). We also tested enrichment of a number of genes by RT-qPCR in GFP+ cells; results are consistent with the RNA-seq data (Fig. 5P).
Figure 5.
In situ hybridization screen and qPCR tests validate CNC transcriptome data set. In situ hybridization confirms enrichment of migrating CNC genes. These include well-known neural crest markers such as SOX10, ETS1, and SNAI2 (A–C) as well as novel genes previously not known to be expressed in the migrating CNC (D–T). (U) qPCR tests corroborate enrichment found in the RNA-seq data. Vertical error bars on data points represent the standard error of mean obtained from replicates.
Our in situ hybridization screen shows specific CNC gene expression for molecules strongly up-regulated in our data set (Fig. 5). Genes such as transcription factor EBF1, adaptor protein LMO4, and nuclear receptor RXRG are expressed only in the neural crest at the stages analyzed, in a similar manner to SOX10 and SNAI2. Receptors such as LTK also have sharp and specific expression patterns in the neural crest. Transcripts of enzymes like BMP2K and matrix molecules such as COL9A3 were expressed strongly in the CNC, corroborating our sequencing data. Previously, genes up-regulated in the neural crest (Gammill and Bronner-Fraser 2002; Adams et al. 2008) were identified by juxtaposing neural and non-neural ectoderm to induce neural crest and screening macroarrayed embryonic libraries. This process resulted in identification of only approximately a dozen transcriptional regulators enhanced in the neural crest. In contrast, analysis of pure populations of migrating CNC revealed nearly 100 novel transcriptional regulators.
Supplemental Table 4 lists the 50 transcriptional regulators with highest enrichment in CNC cells. It includes transcription factors, cofactors, modulators, and genes involved in epigenetic regulation, 14 of which were previously studied in the context of neural crest formation. In total, we estimate that ∼15%–20% of the genes were investigated previously in the context of neural crest or craniofacial development or are part of pathways that are known to be involved in these processes. Integration of the remainder in the CNC GRN will be key for uncovering novel regulatory modules that are important for neural crest identity and behavior.
Effects of perturbation of neural plate border and neural crest specifier genes on novel targets
To identify novel links in the CNC gene regulatory network, we assayed the effects of knockdown of known neural plate border and neural crest specifier genes on identified targets in the migrating CNC population (Fig. 2B). Four genes were chosen as targets for this analysis: the nuclear receptor RXRG, the tyrosine receptor LTK, the structural protein COL9A3, and the adaptor protein LMO4 (Ochoa et al. 2012; Ferronha et al. 2013), all of which are robustly expressed in the migratory CNC. In addition, we examined effects on transcription factor EBF1. Seven genes known to be expressed in the premigratory neural crest were knocked down using electroporation of translation-blocking morpholinos: ETS1, SOX9, PAX7, TFAP2A, SOX10, MSX1/2, and MYB.
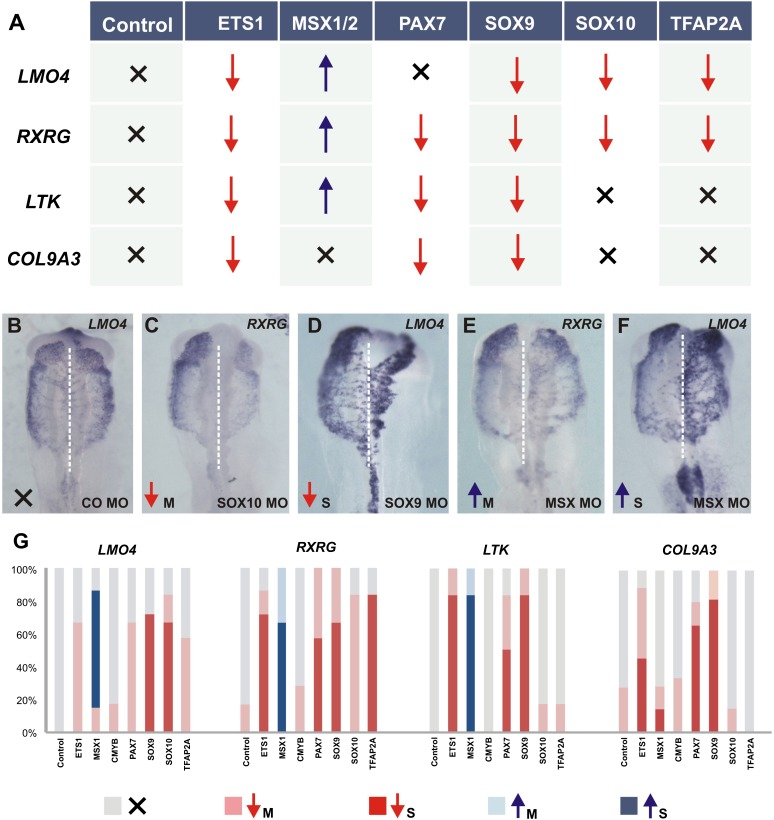
Knockdown of neural crest specifiers, ETS1 and SOX9, affected the four main genes analyzed (Fig. 6; Supplemental Fig. 1), indicating a crucial role for these regulators in CNC development. Indeed, both genes have been identified as direct inputs of the Sox10E2 enhancer (Fig. 1; Betancur et al. 2010b). PAX7 is another important gene in the neural crest GRN, required for neural crest specification (Basch et al. 2006) by directly regulating FOXD3 (Simões-Costa et al. 2012). PAX7 is maintained in the migratory CNC and coexpressed with SOX10 (Supplemental Table 4), and its knockdown causes loss of RXRG, LTK, and COL9A3 (Fig. 6A), but not of LMO4.
Figure 6.
Regulatory interactions between classic and novel regulators of neural crest development. Functional studies reveal epistatic interactions between neural plate border and neural crest specifiers with CNC genes. (A) Summary of the results obtained from the loss-of-function experiments. (B–F) Representative embryos for each of the phenotype classes: (B) no phenotype; (C) mild knockdown; (D) strong knockdown; (E) mild up-regulation; and (F) strong up-regulation. (G) Quantification of knockdown experiments.
Loss of function of SOX10 and TFAP2A, key regulators of neural crest development (Rada-Iglesias et al. 2012), similarly affected transcription of LMO4 and RXRG but did not alter LTK or COL9A3 expression. Remarkably, loss of the neural plate border specifier MSX1/2 resulted in up-regulation of three of the genes examined, despite its requirement for neural crest specification (Simões-Costa et al. 2012). The effects of knockdown of neural crest specifiers on transcription factor EBF1 (Fig. 2) yielded completely different results than the other CNC genes analyzed, suggesting that its regulation may be indirect (Supplemental Fig. 1). MYB knockdown had no significant effect in any of the four main CNC transcripts analyzed. Taken together, our results point to ETS1 and SOX9 as key regulators of CNC development and show differential regulation among the CNC genes surveyed, highlighting the complex nature of the neural crest gene regulatory network.
Discussion
Transcriptional regulation of a dynamic cell population like the neural crest is an intricate process. The constantly shifting environment to which the migrating CNC cells are exposed, together with the onset of their differentiation programs, is likely to contribute to a high level of regulatory complexity. By greatly expanding the candidate genes that can be interrogated for their connectivity in the CNC GRN, our data set provides a platform for analysis necessary for completion of the migrating CNC GRN. We have uncovered approximately 100 novel transcriptional regulators, many of which undoubtedly play an important role in determining neural crest identity, potential, and behavior.
Extensive migratory ability is a defining feature of the neural crest. Accordingly, we observe a large number of molecules known to play critical roles in cell migration in our data set such as molecules involved in changes in cell-cell adhesion and membrane receptors. For example, we noted up-regulation of Rho family small GTPases (Fig. 4E), important for planar cell polarity and mediating cytoskeleton dynamics (Clay and Halloran 2011). In fact, nearly half of the up-regulated genes in migrating CNC were enzymes. This is likely due to the constant structural rearrangements, extensive proliferation, and active signal transduction, such as the MAPK/ERK pathway, ongoing in migratory CNC cells (Fig. 4; Newbern et al. 2008; Stuhlmiller and Garcia-Castro 2012). Furthermore, numerous enzymatic epigenetic modifiers (Hu et al. 2012; Strobl-Mazzulla and Bronner 2012) including helicases and topoisomerases are active in the CNC.
Consistent with classical experiments revealing differences in developmental potential between cranial and trunk neural crest, our data set shows enrichment of major components of the chondroblast differentiation program in migrating CNCs. These include SOXD family members, MIA/CD-RAP, TFAP2A transcription factors, and cartilage-specific matrix molecules COL2A1, COL9A3, COL11A1 and ACAN (Supplemental Table 1). The presence of these transcripts may reflect early specification of a subset of CNC toward an ectomesenchymal fate, perhaps explaining why some cranial crest cells differentiate into ectopic cartilage after grafting to the trunk (Nakamura and Ayer-le Lievre 1982; Le Douarin et al. 2004). Comparative genomic analysis between distinct neural crest subpopulations holds the promise of revealing key circuits that endow the CNC with its unique features.
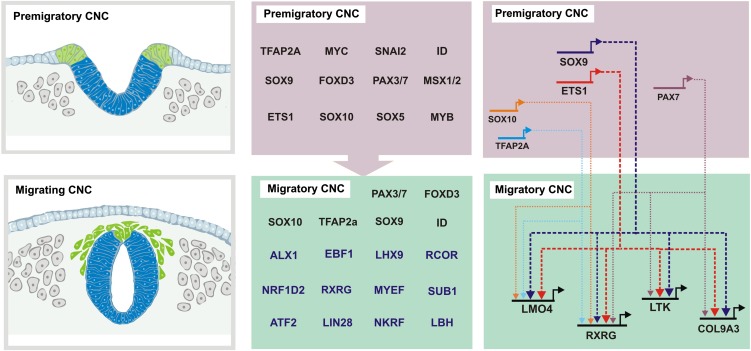
The complexity of the CNC regulatory program is highlighted in our functional analysis, which reveals many previously unknown connections between upstream regulators and the identified effector genes (Fig. 7). Results reveal important trends in regulatory control of CNC-specific transcripts. For instance, our data show that ETS1 and SOX9 are required for the expression of four of five CNC genes analyzed. This suggests a model in which ETS1 and SOX9 may act as pan-neural crest regulators during CNC migration (Fig. 7), hinting at a common subcircuit controlling expression of CNC-specific transcripts. This view is supported by cis-regulatory analysis of bona-fide neural crest markers (Betancur et al. 2010b; Simões-Costa et al. 2012; Barembaum and Bronner 2013), identifying SOX9 and ETS1 as direct inputs in neural crest enhancers.
Figure 7.
Migrating cranial crest data set allows for expansion of neural crest gene regulatory network and identification of new regulatory links. Transcriptome analysis of the migrating cranial neural crest expands the number of regulators in the migratory module of the CNC gene regulatory network. Loss-of-function experiments identify new links between well-characterized regulators and novel neural crest effectors.
Apart from common inputs from SOX9 and ETS1, each of the target genes analyzed requires a different combination of upstream regulators for transcriptional activation. This is not unexpected since the CNC is complex and its regulation involves the interplay of a large number of transcription factors (Betancur et al. 2010a). Since the four genes analyzed have very similar expression patterns, our results suggest the existence of concurrent genetic programs within the CNC that result in similar transcriptional outcomes. According to this model (Fig. 7), different combinations of transcription factors would result in transcriptional activation of distinct genes in CNCs. SOX9 and ETS1 would thus be a part of a common essential genetic circuit working in conjunction with different regulators (PAX7, SOX10, TFAP2A) to activate transcription.
Interestingly, the same regulator can have distinct effects at different developmental times and in different modules of the CNC GRN. For instance, MSX1 plays a critical early role as an activator of neural crest specification (Monsoro-Burq et al. 2005; Simões-Costa et al. 2012), but our data show that in the migrating CNC, it modulates or represses gene expression. Consistent with repressor function, MSX1 has been shown to recruit Polycomb complexes during embryonic development to shut down target genes during myoblast differentiation (Wang et al. 2011). A likely explanation is that the same regulator often can be used reiteratively but to different effect depending upon available partners. These results highlight the complexity of regulatory interactions in the neural crest GRN and demonstrate that the consecutive programs that drive neural crest gene expression can be quite distinct, even if they utilize some of the same suite of regulators.
The migrating CNC transcriptome data set presented here provides a platform for a thorough exploration of the transcriptional state of CNC cells during their active phase of migration. The data set will facilitate expansion of the terminal modules of the neural crest GRN. This will lead to a better understanding of how the genetic program controlling neural crest identity unfolds and is converted into discrete regulatory modules that drive differentiation into a variety cell types. Our results point to a variety of molecules and pathways that have yet to be explored in the context of neural crest development and offer a panoramic view of the CNC transcriptional landscape.
Methods
Electroporation of enhancers and time-lapse imaging
Chicken embryos were incubated to Hamburger and Hamilton (HH)4 (Sauka-Spengler and Barembaum 2008). Embryos were dissected (Chapman et al. 2001), placed in Ringer's solution, injected with 2 µg/µL of the pTK-Sox10e2:eGFP construct (Betancur et al. 2010b), electroporated, and placed in individual culture dishes containing albumen supplemented with Penicillin-Streptomycin (Sigma). For dynamic analysis of the Sox10E2 enhancer, HH4 chick embryos were electroporated as described above. After ∼8 h of incubation, embryos were imaged as described (Ezin and Fraser 2008).
Tissue dissociation and FACS
After electroporation, embryos were incubated at 37°C until HH10 (∼14–16 h of incubation) and dissected above the level of rhombomere 3 to avoid contamination of otic GFP+ cells. Dissected heads were dissociated in dispase/trypsin. Reaction was stopped by addition of 10 times the volume of Hank's solution. Cells were washed, passed through a 40µm strainer (BD) and resuspended in Hank's solution plus 0.5% BSA, 5 units/mL DNase I (Roche). Cells were sorted using BD FACSAria Cell Sorter (BD Biosciences) with 7-AAD exclusion to eliminate dead/damaged cells. GFP+ cells from dissected heads and GFP− cells from whole embryos (WE) were used for library construction and sequencing.
RNA Extraction and Amplification
Sorted cells were pelleted, washed with PBS, and immediately lysed with Lysis Buffer. RNA was extracted with RNAqueous-Micro Kit (Ambion AM1931); genomic DNA was removed by 30 min of TURBO DNase treatment. Quality of the RNA was assayed in an Agilent 2100 Bioanalyzer. All samples had RIN>8. RNA was subsequently amplified with the Ovation RNA-Seq System V2, yielding double-stranded cDNA that was used for library construction.
Library building and sequencing
Sequencing libraries were built according to Illumina Standard Protocols. SR50 sequencing was performed in a HiSeq Illumina machine. Sequence reads were aligned to the Gallus gallus genome with Bowtie (version 0.12.7) and TopHat (version 1.3.1.OSX_x86_64). The following reads and percentage of reads maps were obtained for each of four libraries: CNC1 (21.5 million reads/87% mapped), CNC2 (26.2 million reads/50% mapped), WE1 (21.7 million reads/81% mapped) and WE2 (30.7 million reads/64% mapped). Cufflinks and Cuffdiff were used to calculate gene expression levels and identify differentially expressed transcripts. Two CNC and two whole embryo samples were independently collected, sequenced and mapped, and subsequently analyzed in Cufflinks and Cuffdiff as replicates. The Pearson correlation coefficients obtained between replicates were 0.925 for the CNC samples and 0.957 for the WE samples. A gene was considered to be expressed by the CNC transcriptomic data set if (1) the RPKM values (Reads Per Kilobase of exon per Million fragments mapped) for that gene were above 5 RPKM in the population with higher expression levels; (2) difference in expression levels was significant according to statistical analysis; and (3) the gene had at least twofold up-regulation/depletion in the CNC. The expression levels on the CNC data set (Supplemental Table 1) contain values for samples that were processed as replicates in TopHat. Biological pathway analysis was performed with the aid of Ingenuity iReports, after conversion of the chicken Ensembl gene models to mouse orthologous counterparts.
cDNA synthesis and qPCR
RNA from GFP+ and GFP− sorted cells was isolated using the RNAqueous-Micro Kit (Ambion AM1931), according to the manufacturer's protocol. cDNA was synthesized using SuperScript III First Strand Synthesis kit (Invitrogen) with random primers for RT priming. qPCR was performed using SYBR Green (Bio-Rad) according to the manufacturer's instructions. For reference genes, we used qPCR primers designed for the HPRT1 and TFRC genes.
In situ hybridization and antibody labeling
Whole mount in situ hybridization was performed as described (Acloque et al. 2008). Embryos electroporated with the Sox10E2:eGFP construct were labeled using HNK-1 and SOX10 antibodies (1:100), and goat anti-mouse IgM Alexa 350 or anti-mouse IgG Alexa 350, respectively (1:1000; Molecular Probes). Whole mount immunostaining was performed as described (Ezin et al. 2009). For in situ hybridization, fragments of candidate genes ranging from 600–800 were PCR cloned using the TOPO TA Cloning Kit from Invitrogen (K4610-20). Clones were sequenced and used as templates for DIG-labeled RNA probes. Expression of approximately 80 candidate genes in the CNC was verified in chicken embryos (Supplemental Table 1).
Loss-of-function studies
For morpholino knockdown, unilateral electroporation was performed in HH6 chicken embryos as described (Barembaum et al. 2000), using the following morpholinos: Msx1, Pax7, and Ets1 (Simões-Costa et al. 2012); c-Myb, Sox9, and Sox10 (Betancur et al. 2010b); and Tafp2a (Barembaum and Bronner 2013). Embryos were collected and fixed in 4% paraformaldehyde for 1 h and screened under fluorescence for efficient morpholino incorporation.
Data access
All sequencing data have been deposited in the NCBI BioProject database, under BioProject PRJNA226749 (http://www.ncbi.nlm.nih.gov/bioproject).
Acknowledgments
We thank Diana Perez, Janice Grimm, and Rochelle Diamond for their excellent cell-sorting assistance. The Caltech Flow Cytometry Cell Sorting Facility is supported by funds from the Beckman Institute at Caltech. We thank Dr. Max Ezin for her help with live time-lapse imaging of enhancer activity, and Mike Stone and Brian Jun for technical assistance. This work was supported by NIH HD037105 and DE16459 (to M.E.B.) and the Pew Fellows Program in the Biomedical Sciences (to M.S.-C.), and a Caltech Cell Center fellowship from the Moore Foundation (to M.S.-C.).
Footnotes
[Supplemental material is available for this article.]
Article published online before print. Article, supplemental material, and publication date are at http://www.genome.org/cgi/doi/10.1101/gr.161182.113.
References
- Acloque H, Wilkinson DG, Nieto MA 2008. In situ hybridization analysis of chick embryos in whole-mount and tissue sections. Methods Cell Biol 87: 169–185 [DOI] [PubMed] [Google Scholar]
- Adams MS, Gammill LS, Bronner-Fraser M 2008. Discovery of transcription factors and other candidate regulators of neural crest development. Dev Dyn 237: 1021–1033 [DOI] [PMC free article] [PubMed] [Google Scholar]
- Barembaum M, Bronner ME 2013. Identification and dissection of a key enhancer mediating cranial neural crest specific expression of transcription factor, Ets-1. Dev Biol 382: 567–575 [DOI] [PMC free article] [PubMed] [Google Scholar]
- Barembaum M, Moreno TA, LaBonne C, Sechrist J, Bronner-Fraser M 2000. Noelin-1 is a secreted glycoprotein involved in generation of the neural crest. Nat Cell Biol 2: 219–225 [DOI] [PubMed] [Google Scholar]
- Basch ML, Bronner-Fraser M, García-Castro MI 2006. Specification of the neural crest occurs during gastrulation and requires Pax7. Nature 441: 218–222 [DOI] [PubMed] [Google Scholar]
- Betancur P, Bronner-Fraser M, Sauka-Spengler T 2010a. Assembling neural crest regulatory circuits into a gene regulatory network. Annu Rev Cell Dev Biol 26: 581–603 [DOI] [PMC free article] [PubMed] [Google Scholar]
- Betancur P, Bronner-Fraser M, Sauka-Spengler T 2010b. Genomic code for Sox10 activation reveals a key regulatory enhancer for cranial neural crest. Proc Natl Acad Sci 107: 3570–3575 [DOI] [PMC free article] [PubMed] [Google Scholar]
- Chapman SC, Collignon J, Schoenwolf GC, Lumsden A 2001. Improved method for chick whole-embryo culture using a filter paper carrier. Dev Dyn 220: 284–289 [DOI] [PubMed] [Google Scholar]
- Clay MR, Halloran MC 2011. Regulation of cell adhesions and motility during initiation of neural crest migration. Curr Opin Neurobiol 21: 17–22 [DOI] [PMC free article] [PubMed] [Google Scholar]
- Ezin M, Fraser S 2008. Time-lapse imaging of the early avian embryo. Methods Cell Biol 87: 211–236 [DOI] [PubMed] [Google Scholar]
- Ezin AM, Fraser SE, Bronner-Fraser M 2009. Fate map and morphogenesis of presumptive neural crest and dorsal neural tube. Dev Biol 330: 221–236 [DOI] [PMC free article] [PubMed] [Google Scholar]
- Ferronha T, Rabadán MA, Gil-Guiñon E, Le Dréau G, de Torres C, Martí E 2013. LMO4 is an essential cofactor in the Snail2-mediated epithelial-to-mesenchymal transition of neuroblastoma and neural crest cells. J Neurosci 33: 2773–2783 [DOI] [PMC free article] [PubMed] [Google Scholar]
- Gammill LS, Bronner-Fraser M 2002. Genomic analysis of neural crest induction. Development 129: 5731–5741 [DOI] [PubMed] [Google Scholar]
- Gans C, Northcutt RG 1983. Neural crest and the origin of vertebrates: A new head. Science 220: 268–273 [DOI] [PubMed] [Google Scholar]
- Hall BK 2000. The neural crest as a fourth germ layer and vertebrates as quadroblastic not triploblastic. Evol Dev 2: 3–5 [DOI] [PubMed] [Google Scholar]
- Hu N, Strobl-Mazzulla P, Sauka-Spengler T, Bronner ME 2012. DNA methyltransferase3A as a molecular switch mediating the neural tube-to-neural crest fate transition. Genes Dev 26: 2380–2385 [DOI] [PMC free article] [PubMed] [Google Scholar]
- Kim J, Lo L, Dormand E, Anderson DJ 2003. SOX10 maintains multipotency and inhibits neuronal differentiation of neural crest stem cells. Neuron 38: 17–31 [DOI] [PubMed] [Google Scholar]
- Le Douarin N, Kalcheim C 1999. The neural crest. Cambridge University Press, Cambridge, UK [Google Scholar]
- Le Douarin NM, Creuzet S, Couly G, Dupin E 2004. Neural crest cell plasticity and its limits. Development 131: 4637–4650 [DOI] [PubMed] [Google Scholar]
- Lee PC, Taylor-Jaffe KM, Nordin KM, Prasad MS, Lander RM, LaBonne C 2012. SUMOylated SoxE factors recruit Grg4 and function as transcriptional repressors in the neural crest. J Cell Biol 198: 799–813 [DOI] [PMC free article] [PubMed] [Google Scholar]
- McKeown SJ, Lee VM, Bronner-Fraser M, Newgreen DF, Farlie PG 2005. Sox10 overexpression induces neural crest-like cells from all dorsoventral levels of the neural tube but inhibits differentiation. Dev Dyn 233: 430–444 [DOI] [PubMed] [Google Scholar]
- Meulemans D, Bronner-Fraser M 2004. Gene-regulatory interactions in neural crest evolution and development. Dev Cell 7: 291–299 [DOI] [PubMed] [Google Scholar]
- Monsoro-Burq AH, Wang E, Harland R 2005. Msx1 and Pax3 cooperate to mediate FGF8 and WNT signals during Xenopus neural crest induction. Dev Cell 8: 167–178 [DOI] [PubMed] [Google Scholar]
- Nakamura H, Ayer-le Lievre CS 1982. Mesectodermal capabilities of the trunk neural crest of birds. J Embryol Exp Morphol 70: 1–18 [PubMed] [Google Scholar]
- Newbern J, Zhong J, Wickramasinghe RS, Li X, Wu Y, Samuels I, Cherosky N, Karlo JC, O'Loughlin B, Wikenheiser J, et al. 2008. Mouse and human phenotypes indicate a critical conserved role for ERK2 signaling in neural crest development. Proc Natl Acad Sci 105: 17115–17120 [DOI] [PMC free article] [PubMed] [Google Scholar]
- Ochoa SD, Salvador S, LaBonne C 2012. The LIM adaptor protein LMO4 is an essential regulator of neural crest development. Dev Biol 361: 313–325 [DOI] [PMC free article] [PubMed] [Google Scholar]
- Rada-Iglesias A, Bajpai R, Prescott S, Brugmann SA, Swigut T, Wysocka J 2012. Epigenomic annotation of enhancers predicts transcriptional regulators of human neural crest. Cell Stem Cell 11: 633–648 [DOI] [PMC free article] [PubMed] [Google Scholar]
- Sauka-Spengler T, Barembaum M 2008. Gain- and loss-of-function approaches in the chick embryo. Methods Cell Biol 87: 237–256 [DOI] [PubMed] [Google Scholar]
- Sauka-Spengler T, Bronner-Fraser M 2008. A gene regulatory network orchestrates neural crest formation. Nat Rev Mol Cell Biol 9: 557–568 [DOI] [PubMed] [Google Scholar]
- Simões-Costa M, Bronner M 2013. Insights into neural crest development and evolution from genomic analysis. Genome Res 23: 1069–1080 [DOI] [PMC free article] [PubMed] [Google Scholar]
- Simões-Costa MS, McKeown SJ, Tan-Cabugao J, Sauka-Spengler T, Bronner ME 2012. Dynamic and differential regulation of stem cell factor FoxD3 in the neural crest is encrypted in the genome. PLoS Genet 8: e1003142. [DOI] [PMC free article] [PubMed] [Google Scholar]
- Strobl-Mazzulla PH, Bronner ME 2012. A PHD12-Snail2 repressive complex epigenetically mediates neural crest epithelial-to-mesenchymal transition. J Cell Biol 198: 999–1010 [DOI] [PMC free article] [PubMed] [Google Scholar]
- Stuhlmiller TJ, García-Castro MI 2012. FGF/MAPK signaling is required in the gastrula epiblast for avian neural crest induction. Development 139: 289–300 [DOI] [PMC free article] [PubMed] [Google Scholar]
- Théveneau E, Duband JL, Altabef M 2007. Ets-1 confers cranial features on neural crest delamination. PLoS ONE 2: e1142. [DOI] [PMC free article] [PubMed] [Google Scholar]
- Trainor PA 2010. Craniofacial birth defects: The role of neural crest cells in the etiology and pathogenesis of Treacher Collins syndrome and the potential for prevention. Am J Med Genet A 152A: 2984–2994 [DOI] [PMC free article] [PubMed] [Google Scholar]
- Wang J, Kumar RM, Biggs VJ, Lee H, Chen Y, Kagey MH, Young RA, Abate-Shen C 2011. The Msx1 homeoprotein recruits polycomb to the nuclear periphery during development. Dev Cell 21: 575–588 [DOI] [PMC free article] [PubMed] [Google Scholar]


