

Abstract
Human tumors are comprised of heterogeneous cell populations that display diverse molecular and phenotypic features. To examine the extent to which epigenetic differences contribute to intratumoral cellular heterogeneity, we have developed a high-throughput method, termed MAPit-patch. The method uses multiplexed amplification of targeted sequences from submicrogram quantities of genomic DNA followed by next generation bisulfite sequencing. This provides highly scalable and simultaneous mapping of chromatin accessibility and DNA methylation on single molecules at high resolution. Long sequencing reads from targeted regions maintain the structural integrity of epigenetic information and provide substantial depth of coverage, detecting for the first time minority subpopulations of epigenetic configurations formerly obscured by existing genome-wide and population-ensemble methodologies. Analyzing a cohort of 71 promoters of genes with exons commonly mutated in cancer, MAPit-patch uncovered several differentially accessible and methylated promoters that are associated with altered gene expression between neural stem cell (NSC) and glioblastoma (GBM) cell populations. In addition, considering each promoter individually, substantial epigenetic heterogeneity was observed across the sequenced molecules, indicating the presence of epigenetically distinct cellular subpopulations. At the divergent MLH1/EPM2AIP1 promoter, a locus with three well-defined, nucleosome-depleted regions (NDRs), a fraction of promoter copies with inaccessible chromatin was detected and enriched upon selection of temozolomide-tolerant GBM cells. These results illustrate the biological relevance of epigenetically distinct subpopulations that in part underlie the phenotypic heterogeneity of tumor cell populations. Furthermore, these findings show that alterations in chromatin accessibility without accompanying changes in DNA methylation may constitute a novel class of epigenetic biomarker.
Human tumors often display substantial intratumoral heterogeneity in both phenotypic and molecular features. Cells that are drug-tolerant or have tumor-initiating capabilities are of high biological interest and are estimated to represent 1%–20% of bulk tumor cells (for review, see Visvader and Lindeman 2008). This cellular heterogeneity represents a formidable challenge to the discovery of effective cancer treatments. The frequency and degree of tumor heterogeneity cannot be explained solely by genetic determinants. Additionally, the reversible nature of cancer cell proliferative potential and drug tolerance suggests mechanisms that invoke plasticity (Sharma et al. 2010).
Dynamic control of gene expression is exerted by various epigenetic mechanisms, including DNA methylation, histone post-translational modifications, and nucleosome positioning and occupancy; although the latter three features have not been rigorously proven to be heritable (Schreiber and Bernstein 2002; Fuks 2005; Esteller 2007). Aberrant DNA methylation of CpG (hereafter, CG) dinucleotides is a well-documented phenomenon in cancer (Baylin and Jones 2011). It is widely accepted that DNA methylation near transcriptional start sites (TSSs) is associated with gene silencing. Hypermethylation of tumor-suppressive genes and hypomethylation of tumor-promoting genes is commonly observed, even in early stages of carcinogenesis (Herman and Baylin 2003). Although often evaluated separately, DNA methylation exerts control over gene expression within the context of chromatin. Expressed and poised genes are usually unmethylated and depleted of nucleosomes near their TSSs, thereby exhibiting increased accessibility to trans-activating factors (for review, see Jiang and Pugh 2009). Conversely, the TSSs of transcriptionally inactive genes tend to be associated with increased nucleosome occupancy, conferring chromatin inaccessibility, but can be either unmethylated or methylated. Thus, integrated evaluation of DNA methylation within the context of chromatin accessibility is more informative than evaluating each epigenetic feature separately (Pardo et al. 2011b; You et al. 2011; Kelly et al. 2012). Notably, the extent of cell-to-cell heterogeneity in chromatin accessibility at gene promoters in either disease-free or tumor cells remains ill-defined.
Assessing intratumoral epigenetic heterogeneity necessitates the use of methods able to query chromatin structure at the level of single molecules. Our laboratory has developed a high-resolution footprinting technique, termed MAPit (methyltransferase accessibility protocol for individual templates). MAPit exploits exogenous addition of DNA methyltransferases (DNMTs), to probe accessibility of DNA in chromatin (Kladde et al. 1996; Xu et al. 1998b; Kilgore et al. 2007; Pardo et al. 2009). This technique has been used to simultaneously map DNA methylation and nucleosome positions on single molecules in many gene-specific studies (Kilgore et al. 2007; Wolff et al. 2010; Delmas et al. 2011; Pardo et al. 2011a; You et al. 2011; Yang et al. 2012; Darst et al. 2013), and more recently, genome wide (Kelly et al. 2012).
The identification and study of minority epigenetic subpopulations at multiple loci by gene-specific or genome-wide bisulfite genomic sequencing (BGS) is currently precluded due to requirements for large amounts of input DNA and prohibitive costs associated with obtaining the needed depth in sequencing coverage. To circumvent these limitations, we have adapted bisulfite patch PCR (Varley and Mitra 2010), a highly multiplexed approach to prepare targeted DNA for next-generation sequencing, to accommodate DNA obtained from chromatin probed for accessibility. We applied the resulting method, termed MAPit-patch, to determine the extent to which epigenetic heterogeneity exists in human GBM and control NSC. We concurrently profiled DNA methylation and chromatin accessibility at 71 promoters and identified several classes of epigenetic heterogeneity as well as 29 promoters that were differentially methylated and/or differentially accessible between GBM and NSC. Strikingly, a subpopulation of cells exhibiting inaccessible, but unmethylated, MLH1 promoter chromatin was negative for MLH1 immunostaining and enriched in TMZ-tolerant GBM cells. Epigenetic heterogeneity is therefore a common feature within a given GBM and NSC cell line and may contribute to diverse cellular phenotypes, including drug tolerance.
Results
MAPit-patch, a multiplexed, targeted method for simultaneous mapping of chromatin accessibility and DNA methylation on single molecules
To obtain combined DNA methylation and chromatin accessibility data on individual DNA strands or molecules, nuclei are probed with M.CviPI, which methylates cytosine in accessible GC dinucleotides (Xu et al. 1998a). GC sites within nucleosomes or those occupied by nonhistone proteins impair accessibility to M.CviPI and remain unmethylated (Kladde et al. 1996). For MAPit-BGS (Fig. 1A), genomic DNA is then bisulfite converted to discriminate between methylated (accessible) or unmethylated (inaccessible) GCs, and concomitantly, between endogenously methylated or unmethylated CGs (GCGs have been removed from the current analysis). Bisulfite-treated DNA is then amplified using locus-specific primers, and reaction products from individually cloned molecules are sequenced and analyzed to map the methylation status of all CG and GC sites (Pardo et al. 2011a). For studies requiring interrogation of multiple targets with greater than 20× coverage, MAPit-BGS would be laborious as well as material- and cost-prohibitive.
Figure 1.

MAPit-BGS and MAPit-patch workflow. Both assays begin with (1) preparation of nuclei and (2) incubation with M.CviPI. Upon termination of the chromatin probing reaction, (3) genomic DNA is extracted and processed. (A) For MAPit-BGS, genomic DNA is (4) bisulfite treated such that unmethylated C is deaminated to U, whereas methylated C (m5C) remains m5C. Bisulfite-treated DNA is then (5) PCR amplified using locus-specific primers; then reaction products are (6) purified and cloned. Individual clones are sequenced and data are analyzed to map the methylation status of CG and GC sites. (B) For MAPit-patch, (4) genomic DNA is fragmented using a GC and CG methylation-insensitive enzyme, such as R.AluBI. Fragmented DNA is then (5) denatured and (6) subjected to target selection, whereby left and right patch oligonucleotides hybridize to each end of one strand of each locus and “patch” complementary oligonucleotides for universal priming (U1 and U2) by ligation (step not shown). The U2 oligonucleotide contains exonuclease-resistant modifications at its 3′ end (black oval). Therefore, subsequent (7) 3′ to 5′ exonuclease digestion leaves targeted DNA strands intact and removes unhybridized oligonucleotides as well as nontargeted genomic DNA. Enriched DNA is (8) bisulfite converted and (9) amplified using universal primers that comprise sequences of U1 or complementary to U2, 5-bp barcodes to facilitate multiplexing, and adapter sequences specific for a sequencing platform.
Bisulfite patch PCR is a robust method for targeted next-generation bisulfite sequencing (Fig. 1B; Varley and Mitra 2010). Briefly, purified genomic DNA is digested by a restriction enzyme into fragments with defined ends. After denaturation, in a multiplexed reaction, both ends of selected target loci are hybridized and ligated to specific patch oligonucleotides and universal priming sequences, respectively. After enzymatic enrichment of ligated loci, PCR is performed using primers with platform-specific adapter and universal sequences. Amplified products are sequenced using the appropriate next-generation sequencing platform.
The bisulfite patch PCR study targeted 94 loci in a single reaction using the restriction (R) enzyme R.AluI (recognizes AGCT) for fragmentation of genomic DNA. R.AluI is well suited for patch selection as it occurs frequently in CG islands, which are present in as many as 70% of mammalian promoters (Gardiner-Garden and Frommer 1987; Takai and Jones 2002). However, as digestion by R.AluI is blocked by C-5 methylation, its use is not compatible with M.CviPI-modified DNA. The isoschizomer, R.AluBI, also recognizes AGCT sites, but is not affected by C-5 methylation (Sibenzyme.com; Supplemental Fig. S1), allowing use of the original bisulfite patch PCR oligonucleotide library. Thus, genomic DNA isolated from M.CviPI-probed chromatin digested with R.AluBI can be accommodated in the bisulfite patch PCR protocol, a method hereafter referred to as MAPit-patch.
To identify probing conditions that would allow for detection of different chromatin states, nuclei from NSC were probed with 0, 30, and 100 U M.CviPI and analyzed by MAPit-BGS (Fig. 2). NSC were harvested from serum-free, suspension culture (hereafter, spheroid culture), which maintains these cells in an undifferentiated state and preserves their phenotypic heterogeneity (Deleyrolle and Reynolds 2009). To facilitate pattern recognition, aligned sequences were uploaded into a web-based hierarchical clustering program called MethylMapper (http://genome.ufl.edu:8080/methyl) (Darst et al. 2012). MethylMapper generates 3-color images of clustered CG methylation (Fig. 2, left panels) or GC accessibility (Fig. 2, right panels). Each row represents one sequenced molecule. CG and GC information was clustered end-to-end, so the top-to-bottom presentation order of the molecules is linked in the left and right panels.
Figure 2.

MAPit identifies expected epigenetic patterns and detects heterogeneous chromatin structures at specific loci. MAPit-BGS in NSC nuclei of the promoters of (A) MLH1 (expressed), (B) PYCARD (silenced), and (C) PROM1 (heterogeneously expressed) probed with the indicated units (U) of M.CviPI activity. A schematic of each promoter is indicated at the very top: bent arrows, TSSs; ellipses, length of a 147-bp nucleosome core particle; map coordinates relative to the first TSS are indicated for the most upstream and downstream CG (left) or GC (right) sites. Data were plotted with MethylMapper; each row of pixels represents one sequenced DNA strand or molecule, with the same top-to-bottom presentation order in each panel. Vertical hashes demarcate individual CG (left) or GC (right) sites (GCG excluded), and an additional site density plot is shown below each promoter schematic. The key for CG or GC methylation status is shown in A, bottom. Two or more consecutively methylated CG and GC sites are connected by red and yellow, respectively, whereas two or more consecutively unmethylated CG and GC sites are connected by black. Gray connects the borders between methylated and unmethylated sites. White at either end of a molecule indicates missing or unaligned sequence. Note a variably positioned NDR associated with the neural-specific TSS1b in the PROM1 promoter in C, whereas both TSSs at MLH1 in A colocalize with an NDR, the downstream from which is occupied by a DNA-binding factor(s) (labeled footprint).
In NSC, MAPit-BGS of the proximal promoter of MLH1, an expressed gene, showed that this region is unmethylated and highly accessible around its two TSSs (Fig. 2A), defining two NDRs. A protected region (footprint) of 16 bp within the downstream NDR likely corresponds to a DNA-bound protein or protein complex. The protected region between the two accessible regions is consistent with the size of a nucleosome core particle (147 bp). Conversely, the promoter of PYCARD, a silenced gene, is hypermethylated and largely inaccessible (Fig. 2B). Though both 30 units and 100 units M.CviPI showed equivalent levels of probing at both the MLH1 and PYCARD promoters, we opted to use 100 units in all further reactions to ensure saturation. To determine if epigenetic heterogeneity is also observed, we amplified the promoter of PROM1 (Fig. 2C), which encodes the cell surface antigen CD133, expressed in up to 40% of cultured NSC (Piao et al. 2006; Sun et al. 2009). All analyzed PROM1 sequences had low or no methylation (Fig. 2C, left panel). However, heterogeneity in chromatin accessibility was observed across the locus, especially nearby TSS1b (Fig. 2C, right panel), where transcription initiates in neural tissue (Shmelkov et al. 2004). Approximately 50% of the promoters in the NSC population exhibited substantial accessibility at TSS1b, indicating nucleosome depletion. The remaining half of promoter molecules was inaccessible, and exhibited a nucleosome-sized or larger footprint that encompassed TSS1b. In conclusion, probing with 100 units of M.CviPI enables interrogation of diverse, heterogeneous chromatin states in spheroid cultured cells.
We sought to ensure that M.CviPI probing of chromatin structure and hence GC methylation would not affect the coverage and reproducibility of results obtained by bisulfite patch PCR. Target enrichment was therefore performed using the published patch oligonucleotide library. This library targets promoters within 700 bp of the TSS of 90 genes that are commonly mutated in breast and/or colon cancer (“CAN genes”) (Varley and Mitra 2010). Four control loci were also included and we added 19 additional cancer-associated loci targeted within 600 bp of the TSS (Supplemental Tables S1, S2). MAPit-patch was performed using DNA from NSC and GBM L0 spheroid cultures probed with 0 or 100 units M.CviPI. Barcoded reactions were pooled and sequenced using one-eighth of a plate on a 454 FLX Life Sciences sequencer. After removing sequences with bisulfite conversion efficiencies of <95%, and sequencing reads <100 bp, we obtained 22,356 sequences. Of these, 100% aligned to 104 of the 113 targeted loci (92% of targets), indicating a high sensitivity of the technique. Mean coverage of each promoter was 215 reads (range of 1–1039 reads; median, 99 reads), and the sequencing depth of 87% of the targeted promoters was within 10-fold of the median. Consistent with the published bisulfite patch PCR results (Varley and Mitra 2010), we observed a significant inverse correlation between amplicon length and read coverage with MAPit-patch (Fig. 3A) (P < 0.0001; Pearson's correlation). To determine if targeted loci were reproducibly amplified, the number of reads per locus was plotted for each sample and correlation coefficients between all pairs of samples were calculated (data not shown). The mean correlation coefficient was 0.94, comparable to the value of 0.91 obtained by bisulfite patch PCR. As previously reported by Varley and Mitra (2010), these data indicate that the coverage of each promoter is not stochastic between samples, but is reproducible and affected by amplicon length. Thus, chromatin probing with M.CviPI and R.AluBI substitution in MAPit-patch do not affect the performance of bisulfite patch PCR.
Figure 3.

Probing chromatin with M.CviPI neither alters bisulfite patch PCR performance nor detection of CG methylation. (A) Number of sequencing reads decreases as a function of amplicon size. (B) Linear regression and Pearson's correlation plotted for CG methylation levels in NSC treated with 0-unit versus 100-unit M.CviPI. DNA methylation and chromatin accessibility at the imprinted H19 locus for NSC treated with (C) 0 units or (D) 100 units of M.CviPI. Symbols and the key for methylation status at right of C are as defined in Figure 1.
To determine if probing with M.CviPI would affect accurate quantification of CG methylation, the fraction of methylated CGs (excluding GCGs in all analyses) at each promoter was calculated and compared between the 0- and 100-unit samples. The fraction of CG methylation correlated significantly (P < 0.0001) between the 0- and 100-unit samples, r = 0.99 (Fig. 3B). To confirm that modification by M.CviPI did not alter the ability of bisulfite patch PCR to amplify methylated and unmethylated molecules with equal efficiency, we examined the DNA methylation profile of the imprinted locus H19 in NSC. The 0- and 100-unit M.CviPI-treated samples showed indistinguishable levels of CG methylation (0 units = 48%, 100 units = 50%; P = 0.483) and amplified methylated and unmethylated molecules with equivalent efficiencies (Fig. 3C,D, left panels). In conclusion, MAPit-patch does not introduce bias in quantification of CG methylation nor does it alter the ability to equivalently amplify methylated and unmethylated molecules. In addition, MAPit-patch accurately profiles the expected copy-specific inverse relationship between DNA methylation and chromatin accessibility at the imprinted H19 locus (P = 0.0015) (Fig. 3D, cf. right and left panels).
CAN gene promoter methylation and chromatin accessibility in NSC and GBM L0
We quantified the fraction of methylated CGs at each promoter for which we obtained at least 10× sequencing coverage in NSC and GBM (71 promoters) (Supplemental Tables S3, S4). Promoters exhibiting ≤20% CG methylation were classified as “unmethylated,” those with ≥80% methylation were classified as “methylated,” and those with 21%–79% CG methylation were considered to have variable methylation. Overall, we observed that both NSC and GBM L0 had a similar distribution of promoters by methylation status (Fig. 4A). For each promoter, we calculated the fraction of accessible GCs. As expected, GC accessibility was inversely correlated with CG methylation for both samples (Fig. 4B,C). Interestingly, compared to unmethylated promoters, a similar decrease in GC accessibility was observed among promoters that were methylated and variably methylated, suggesting that decreased accessibility can occur independent of high levels of DNA methylation.
Figure 4.

Overall distribution in NSC and GBM L0 of patterns of promoter CG methylation is similar and inversely associated with GC accessibility. (A) Distribution of promoters by methylation status in NSC (left) and GBM L0 (right). Dot plots of fraction of GC accessibility within each promoter methylation class in (B) NSC and (C) GBM L0. The mean fractions of GC accessibility ± one standard error of the mean (SEM) are indicated. (***) P < 0.001 compared to GC accessibility from unmethylated promoters for each sample.
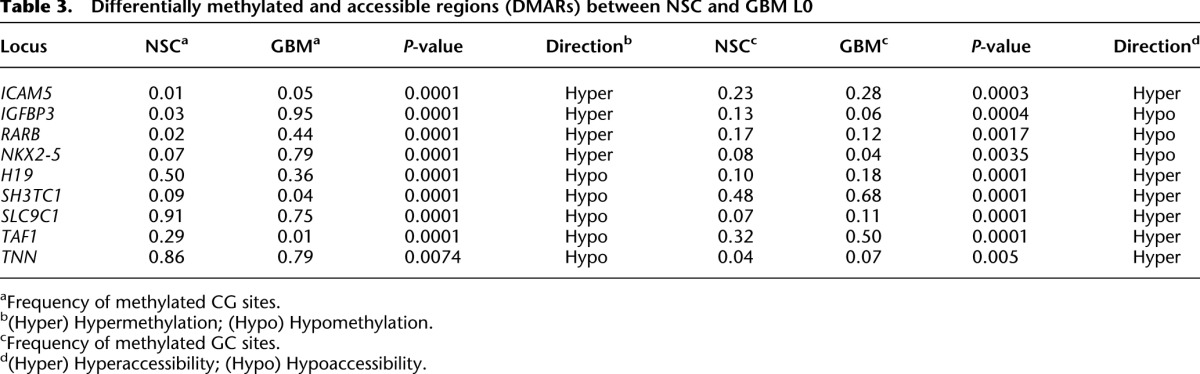
Comparing DNA methylation and chromatin accessibility between NSC and GBM L0 cells, MAPit-patch identified 13 promoters with differential CG methylation (differentially methylated region [DMR]) (Table 1), seven with differential GC accessibility (differentially accessible region [DAR]) (Table 2), and nine with both differential CG methylation and GC accessibility (differentially methylated and accessible region [DMAR]) (Table 3). These genes exhibited reproducible differences (P < 0.01; NSC 0 units M.CviPI versus GBM 0 units, and NSC 100 units versus GBM 100 units) and no statistically significant differences in CG methylation between replicates (NSC 0 units versus NSC 100 units, and GBM 0 units versus GBM 100 units).
Table 1.
Differentially methylated regions (DMRs) between NSC and GBM L0
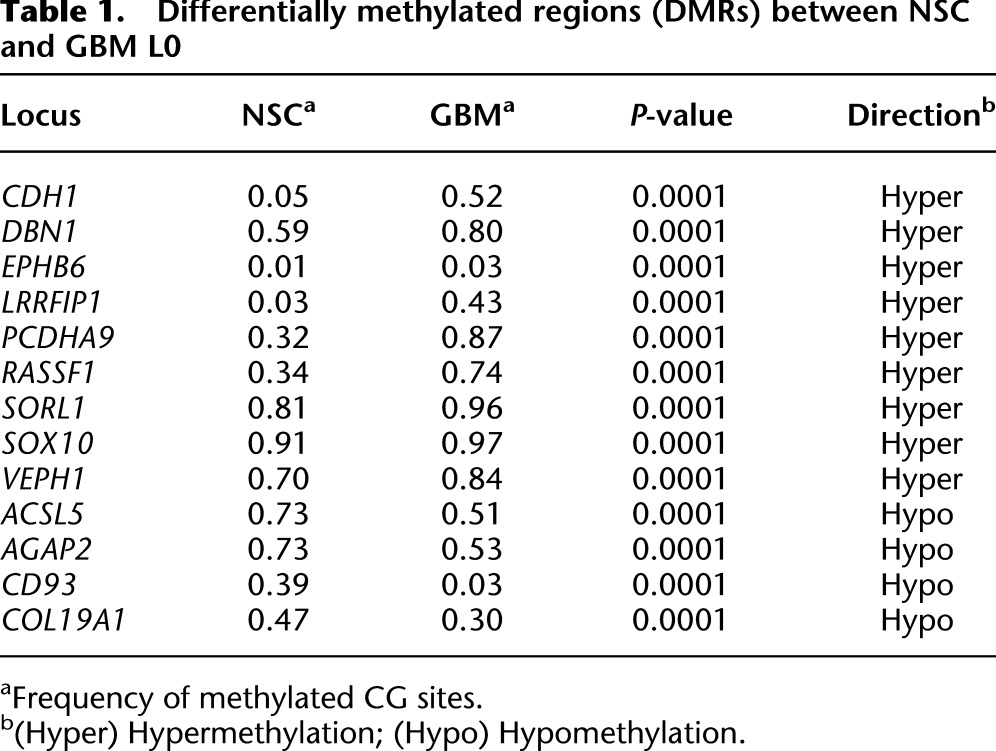
Table 2.
Differentially accessible regions (DARs) between NSC and GBM L0
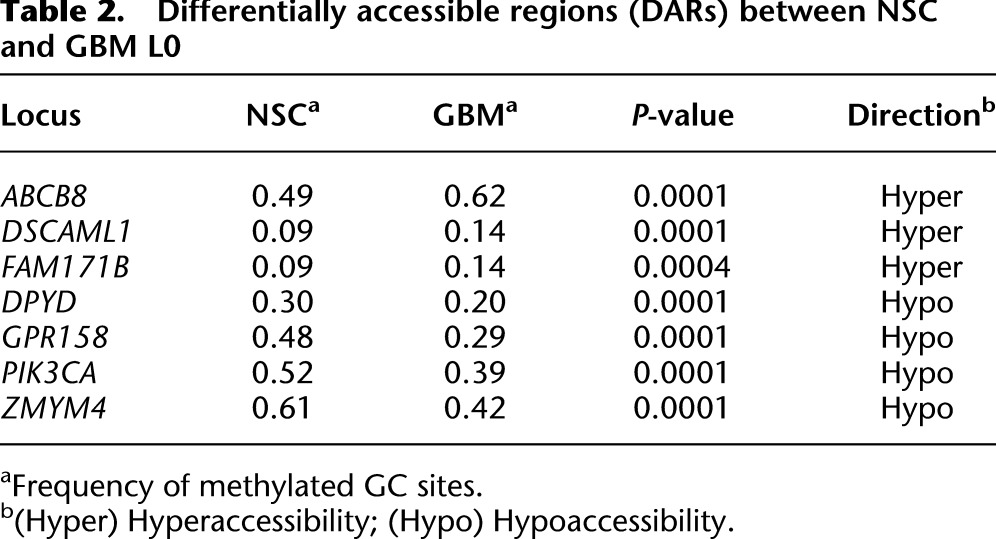
Table 3.
Differentially methylated and accessible regions (DMARs) between NSC and GBM L0
We selected 15 promoters (5 DMR, 4 DAR, and 6 DMAR) and measured gene expression in the NSC culture as well as two primary GBM cultures derived from different patients (L0 and L2), using quantitative reverse transcription PCR (qRT-PCR). Ten of 15 tested promoters exhibited the expected correlations between altered CG methylation, chromatin accessibility, and gene expression (Tables 1–3; Fig. 5). Two genes (AGAP2 and TAF1) showed no expression change in one GBM culture, but showed the expected change in the other GBM culture. Finally, three promoters showed unexpected changes in gene expression (ICAM5, NKX2-5, and ABCB8; NKX2-5 expression data not graphed due to 6500- and 2800-fold increases in GBM L0 and GBM L2, respectively, compared to NSC). For ICAM5, the increase in expression correlates with the increase in GC accessibility rather than the small site-specific increase in CG methylation. These results indicate that the differential epigenetic features identified by MAPit-patch are reflective of differential gene expression in most cases. Importantly, most of the genes that are differentially expressed between NSC and GBM L0 were also differentially expressed in GBM L2. This indicates that these differentially methylated and/or accessible genes, although known to be associated with colon and/or breast cancer, may also be generally affected in GBMs.
Figure 5.

Differential gene expression in NSC and GBM. Relative levels of transcript for a selected subset of genes from Tables 1–3. Each bar represents the mean abundance for each transcript relative to NSC ± 0.5 of the range (n = 2). All data are normalized to 18S rRNA expression.
Heterogeneity in chromatin accessibility and DNA methylation at multiple CAN gene promoters
To identify cell-to-cell heterogeneity, we examined patterns of GC accessibility in target gene promoters that sequenced with ≥20× coverage (54 promoters from NSC; 67 promoters from GBM L0) (Supplemental Tables S3, S4). Two parameters were counted: (1) the number of reads per locus that exhibited ≥126 bp of inaccessible GC sites (i.e., minimal protection consistent with nucleosome occupancy) divided by the total number of reads and subtracted from a value of 1; and (2) the number of reads per locus that contain a nucleosome-free region (three or more consecutively accessible GC sites) divided by the total number of reads. The average of these two values gives the GC accessibility score, reflecting the fraction of molecules that are nucleosome-free and “accessible” at each locus (Supplemental Tables S3, S4). Promoters were stratified into chromatin class quintiles as follows: (1) accessible (≥81% molecules accessible); (2) mostly accessible (61%–80% molecules accessible); (3) half accessible (40%–60% molecules accessible); (4) mostly inaccessible (20%–39% molecules accessible); and (5) inaccessible (≤19% molecules accessible) (Fig. 6A). To provide independent assessment that MAPit-patch accurately assesses the degree of accessibility characteristic of each class of promoters, we performed quantitative restriction enzyme accessibility assays (Fig. 6B; Supplemental Fig. S2, assay optimization). We then identified four promoters that contain a SacI site within 350 bp of a TSS and for which we obtained ≥20× coverage by MAPit-patch. After incubation of GBM L0 nuclei with R.SacI, accessibility was quantitatively measured by qPCR with convergent primers spanning each SacI site. The accessibility profiles of all four promoters in Figure 6B corresponded well with those determined by MAPit-patch (Supplemental Table S4). Confirmation of accessibility by this independent, quantitative approach indicates that the heterogeneous accessibility patterns identified by MAPit-patch reflect biological diversity in chromatin accessibility, not only among the interrogated promoters but also across the cohort of sequenced molecules for each promoter. The distribution of promoter amplicons among the five different accessibility classes was similar for both NSC and GBM L0 (Fig. 6C). CG methylation was inversely correlated with GC accessibility for both NSC and GBM L0 samples (Fig. 6D,E). The stepwise trend of increased CG methylation observed as GC accessibility decreases between chromatin classes suggests a nonrandom distribution of promoters into these five classes that is linked to its epigenetic state.
Figure 6.

Chromatin accessibility in NSC and GBM L0 is heterogeneous and inversely associated with CG methylation. (A) Representative promoters exhibiting the five different GC accessibility patterns. Scale bars in base pairs included at bottom. Brackets at left of each image indicate accessible molecules. (B) Quantitative confirmation of different classes of chromatin accessibility identified by MAPit-patch obtained by measuring protection of SacI sites in the indicated promoters from 0, 40, or 60 units R.SacI activity. Each bar represents the mean protection for each promoter relative to 0-unit R.SacI ± 0.5 of the range (n = 2), normalized to a control locus lacking a SacI site. (C) Distribution of all analyzed promoters into the five accessibility classes for NSC (left) and GBM L0 (right). Dot plots for (D) NSC and (E) GBM L0 of CG methylation in each GC accessibility class. Mean fractions of CG methylation ± SEM are plotted. (*) P < 0.05; (**) P < 0.01; and (***) P < 0.001 relative to fraction CG methylation in inaccessible promoters for each sample.
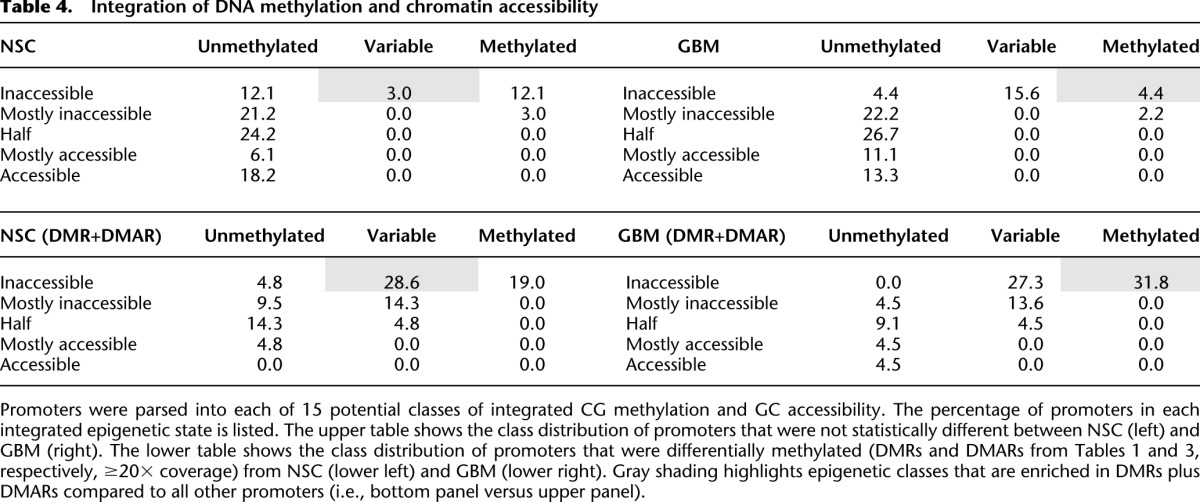
Analyzing epigenetic features in spheroid cells, above we classified CG methylation into three states (Fig. 4) and chromatin accessibility into five states (Fig. 6). Integrating these features yields 15 possible configurations. However, upon parsing the promoters according to combined levels of DNA methylation and chromatin accessibility, we observed that only 10 of the 15 potential states were represented (Supplemental Table S5). Parsing the differentially methylated promoters (DMR + DMAR) from Tables 1 and 3 (with ≥20× coverage) into these classes shows, in NSC, enrichment for promoters that are variably methylated and inaccessible (3.0% versus 28.6%; P = 0.0108) (Table 4, left, cf. gray cells). In contrast, DMR + DMARs from GBM L0 exhibited an enrichment for methylated and inaccessible promoters (4.4% versus 31.8%; P = 0.0043) (Table 4, right, cf. gray cells). These data show that, in contrast to genes that are not epigenetically altered, most genes identified as differentially methylated between GBM L0 and NSC were initially variably methylated and inaccessible in NSC.
Table 4.
Integration of DNA methylation and chromatin accessibility
A subpopulation of drug-tolerant cells is associated with increased promoter nucleosome occupancy
We wanted to determine if epigenetic subpopulations observed in GBM L0 were associated with a disease-relevant phenotype. Molecules from the divergent MLH1/EPM2AIP1 promoter were unmethylated and mostly accessible in GBM at both the distal and proximal promoter region (Fig. 7A–C). There was, however, a subpopulation of promoter copies that were almost completely inaccessible at both target amplicons (Fig. 7B,C, enclosed by cyan rectangles). The protein product of MLH1 is involved in DNA mismatch repair and is considered a tumor suppressor (Bronner et al. 1994; Prolla et al. 1998). Importantly, it is known that loss of MLH1 protein expression renders cells insensitive to treatment with DNA-alkylating agents such as temozolomide (TMZ) (Taverna et al. 2000), which is the frontline chemotherapeutic treatment for GBM (Hegi et al. 2005; Stupp et al. 2005). We hypothesized that the subpopulation of MLH1 promoter copies with inaccessible chromatin observed in GBM may reflect a cellular subpopulation that does not express MLH1 and therefore is tolerant of TMZ.
Figure 7.

A subpopulation of molecules with relatively inaccessible chromatin at the MLH1 promoter is associated with MLH1-negative GBM cells. (A) Schematic of 1.4 kb of the MLH1 promoter. The three coregulated TSSs in this region are shown with bent arrows. Half-arrows indicate the primer binding sites for MLH1 distal (black) and proximal (red) MAPit-BGS amplicons. Asterisks indicate the boundaries of the MAPit-patch amplicons for the distal (black) and proximal (red) MLH1 promoter. MAPit-patch GC accessibility data is shown for the (B) distal and (C) proximal MLH1 promoter. Both amplicons show a subpopulation of relatively inaccessible molecules (circumscribed by cyan rectangles). MAPit-BGS GC accessibility at the (D) distal MLH1 and (E) PMS2 promoters in GBM L0 (top) and GBM L2 (bottom). Note the subpopulation of relatively inaccessible MLH1 molecules (enclosed by cyan rectangles). Schematics of the amplicon for the (D, very top) distal MLH1 promoter obtained using locus-specific primers (i.e., black half-arrows in A) and (E, top) PMS2 promoter are shown. An ellipse is shown scaled to 147 bp. (F) Immunostaining with an anti-MLH1 antibody and flow cytometry. (SSC-A) side scatter-A.
We conducted MAPit-BGS to confirm the presence of the inaccessible subpopulation of MLH1 promoter copies in GBM that was identified by MAPit-patch. As in Figure 7B and C, we observed that the status of MLH1 was mostly accessible, with an inaccessible subpopulation at both the distal (Fig. 7D) and proximal (Supplemental Fig. S3A, lower panel) promoter. This was observed in GBM L0 as well as in GBM L2 but not in NSC (Fig. 2A; Supplemental Fig. S3B). Notably, this inaccessible subpopulation was specific to MLH1 and was not observed at the completely accessible promoter of the PMS2 gene, which encodes the mismatch repair binding partner of MLH1 (Fig. 7E). Immunostaining for MLH1 followed by flow cytometry showed that both GBM lines contained a subpopulation of MLH1-negative or low-expressing cells (Fig. 7F).
To determine if the MLH1-low or -negative phenotype was associated with cells harboring copies of MLH1 promoter chromatin that were inaccessible, GBM cells were treated with TMZ for 4 d to counter select against cells expressing MLH1 protein. Flow cytometry of immunostained cells confirmed dose-dependent enrichment for MLH1-negative/low cells upon treatment with TMZ (Fig. 8A). Surviving TMZ-tolerant cells were assayed for accessibility of distal MLH1 promoter chromatin by MAPit-BGS (Fig. 8B, cf. middle and top panels) and R.SacI digestion (Fig. 8C, MLH1, cf. middle and left blue bars) and found to be enriched for inaccessible chromatin (both experiments, P < 0.0001). TMZ-tolerant cells from the same experiment were outgrown in the absence of TMZ for 10 additional passages and assayed for chromatin accessibility. Compared to the starting TMZ-tolerant cells, the outgrown cells exhibited a significant increase in accessibility of distal MLH1 promoter chromatin to M.CviPI (Fig. 8B, cf. bottom to middle) (P < 0.0001) and R.SacI (Fig. 8C, MLH1, cf. right to middle blue bars) (P < 0.0001) and also re-expressed MLH1 protein (Supplemental Fig. S3C). This supports our hypothesis that chromatin inaccessibility, and by extension increased nucleosome occupancy, reflects decreased MLH1 expression in the absence of DNA methylation.
Figure 8.

Cells with inaccessible chromatin at MLH1 are enriched upon treatment with TMZ. (A) Immunostaining with anti-MLH1 antibody and flow cytometry were conducted on GBM L0 cells after 72-h treatment with the indicated doses of TMZ. Chromatin accessibility at MLH1 was measured in control (top), TMZ-treated (+TMZ, middle), and TMZ-treated cells subsequently propagated in drug-free media (+TMZ, then outgrown –TMZ, bottom) by (B) MAPit-BGS (key at right) and by (C) protection from R.SacI activity. The location of the queried SacI site is indicated by the straight arrow next to the TSS in B (very top). Bars represent the mean protection from R.SacI activity for each locus ±SEM (control and +TMZ, n = 5; outgrown, n = 3), normalized to a control locus lacking a SacI site. A second control locus, SEMA3B, which contains a SacI site, but is inaccessible in GBM L0, was also assayed. (***) P < 0.001.
Discussion
Integrated determination of epigenetic features is important for understanding how epigenetic mechanisms contribute to tumorigenesis and how to effectively target them for cancer treatment. Single-molecule-level technologies that preserve the heterogeneity inherent within human tumors are essential to fully understand the contribution of these factors to disease progression and resistance to treatment. We have described a novel deep sequencing approach, termed MAPit-patch, which simultaneously determines chromatin structure and DNA methylation with single-molecule resolution, thus preserving sample heterogeneity. The method is highly scalable and cost effective, which will facilitate the screening of multiple tissue samples. Also, the targeted (rather than genome-wide) approach is within reach for translating these technologies for assessment of particular disease biomarkers. Using MAPit-patch, we have shown that epigenetic heterogeneity at a given locus is commonly observed in both NSC and GBMs. Furthermore, our results indicate that, in addition to DNA hypo- or hypermethylation, changes in chromatin accessibility alone are associated with tumor-specific alterations in gene expression. Finally, we have shown for the first time that a small subpopulation of cells with inaccessible chromatin at the promoter of a tumor suppressor is associated with drug tolerance. These results show that epigenetic heterogeneity may underlie some of the phenotypic diversity observed in human GBM and has broad implications for molecular profiling of tumors in general.
We identified a number of genes that were differentially methylated and/or accessible and differentially expressed between NSC and GBM L0. The identification of hypomethylation/hyperaccessibility at tumor-promoting genes and hypermethylation/hypoaccessibility at tumor-suppressive genes suggests that these epigenetic features are not random, but represent biologically relevant events. However, additional studies are required to determine the functional significance of DNA methylation, if any, at these genes. Our finding of differentially methylated/accessible genes previously shown to harbor mutations in GBM—COL19A1 (Sumiyoshi et al. 1997), CD93 (Dieterich et al. 2012), AGAP2 (Knobbe et al. 2005), and ACSL5 (Mashima et al. 2009)—supports the validity of this approach in identifying GBM-relevant epigenetic perturbations. Interestingly, most of the genes that were identified as differentially methylated between GBM and NSC were classified as variably methylated in NSC (Table 4, lower). It has been reported that loci exhibiting variability in methylation status between different types of normal tissues are more often aberrantly methylated in tumors (Feinberg and Irizarry 2010; Hansen et al. 2011). It was proposed that these regions exhibit the greatest amount of epigenetic plasticity and are therefore more susceptible to perturbations during tumorigenesis. Our results suggest that this same phenomenon may be observed within a given sample, whereby loci that are variably methylated within the cellular population in a normal tissue are more amenable to aberrant hypo- or hypermethylation in tumors. However, assessment of additional loci in several normal and tumor samples is necessary to support this premise.
We found that a subpopulation of molecules with inaccessible chromatin at MLH1 was associated with a cellular subpopulation of MLH1-negative/low cells. This MLH1-negative/low subpopulation with inaccessible chromatin is enriched upon treatment with TMZ (Fig. 8B,C). These results are significant for several reasons. Although a biomarker exists to predict sensitivity to TMZ treatment, i.e., MGMT promoter methylation and gene silencing (Hegi et al. 2005), a biomarker for TMZ resistance in GBM remains undiscovered. MLH1 functions upstream of MGMT and senses rather than repairs DNA lesions (Taverna et al. 2000). Thus, loss of expression of MLH1 presumably supersedes the effects of aberrant MGMT expression in sensitivity to TMZ (Liu et al. 1996; von Bueren et al. 2012). Second, two studies have shown by immunohistochemistry that small subpopulations of MLH1-negative cells commonly arise in primary GBM. One study showed that MLH1-negative cells were enriched after TMZ treatment in recurrent tumors (Stark et al. 2010). The second study showed that cells lacking PMS2 were enriched in recurrent tumors (Felsberg et al. 2011). Thus, loss of mismatch repair protein expression appears to be associated with clinical relapse of GMB and further studies to test these genes as biomarkers of treatment resistance is of high interest.
Importantly, DNA methylation was tested and excluded as the mechanism driving mismatch repair gene silencing in Felsberg et al. (2011). This is consistent with our results showing that aberrant chromatin inaccessibility, not DNA methylation, is associated with MLH1-negative GBM cells. This is relevant because studies evaluating epigenetic biomarkers often exclusively query DNA methylation. Our results suggest that chromatin accessibility may also be a useful feature to identify disease biomarkers. Furthermore, DNA methylation is considered to be a more stable mark of gene silencing than chromatin inaccessibility and consequently, more difficult to reverse pharmacologically. Thus, identifying differential chromatin accessibility may yield important prognostic insight and increase opportunities for therapeutic intervention.
Upon propagation of TMZ-tolerant cells, a more accessible chromatin state was repopulated at MLH1. One interpretation of this result is that the nucleosome-occupied state was transiently enriched upon TMZ treatment and reversed in its absence. This agrees with the chromatin-dependent reversibility of drug tolerance in cancer cells reported in Sharma et al. (2010). Alternatively, increased accessibility may reflect preferential growth of a small number of cells with nucleosome-depleted MLH1 that survived drug treatment. Additional studies are needed to determine how TMZ-tolerant cells repopulate accessible MLH1 chromatin.
Methods
Cell culture
NSC and GBM spheroid cultures were derived and maintained as previously described (Deleyrolle and Reynolds 2009; Baghbaderani et al. 2010; Deleyrolle et al. 2011).
MAPit-BGS
Nuclei were prepared and probed with 0–100 units of M.CviPI (NEB) as indicated. Reactions were performed, and genomic DNA extracted as previously described (Pardo et al. 2011b). For MAPit-BGS experiments, genomic DNA was processed and analyzed as previously described (Pardo et al. 2011a).
MAPit-patch
Purified genomic DNA was processed as previously described (Varley and Mitra 2010), with the following modifications. Genomic DNA (500 ng) was digested in a 20-μL reaction containing 10 units R.AluBI, manufacturer-provided buffer, and acetylated bovine serum albumin. Reactions were incubated for 3 h at 37°C then heat inactivated for 20 min at 65°C. The patch oligonucleotide hybridization and ligation reaction was carried out as described except that the right U2 capture oligonucleotide that contains a 3-carbon spacer was also synthesized with five phosphorothioate bonds to further protect target loci from exonuclease digestion. Reactions were treated with exonucleases and bisulfite converted as described (Varley and Mitra 2010). Amplification of target loci was carried out in 50-μL reactions with the following components: all recovered bisulfite-converted DNA (10 μL), 1× HotStarTaq buffer (Qiagen), 500 μM MgCl2, 50 μM each dNTP, 250 nM each barcoded primer, and 10 units HotStarTaq DNA polymerase (Qiagen). Reaction products were pooled and PCR purified, then gel purified. Purified products were sequenced at the University of Florida Interdisciplinary Center for Biotechnology Research using the Roche 454 GS FLX+ instrument according to manufacturer protocols.
Sequencing data analysis
Data was processed with custom Python code. Sequences were divided by barcode, using FASTools (http://genome.ufl.edu/rivalab/fastools/), then aligned to the MAPit-patch reference library by BLAST. To prevent bias, C residues in both read and reference sequences were fully converted to T in silico before alignment. After restoration of cytosine information, sequences were scored for percent deamination of HCH, i.e., cytosines neither CG nor GC. Sequences with <95% conversion of HCH to HTH and those covering <50% of the reference sequence were discarded. All GCG sites were removed from analysis. Genome-wide, GCGs represent only 5.6% of all GC dinucleotides, and removal of these sites does not strongly affect chromatin accessibility information (Kelly et al. 2012). For our promoter targets, GCGs represent 30.6% of all CG and 22.2% of all GC dinucleotides. Removal of these sites does not strongly affect DNA methylation or chromatin accessibility information (Supplemental Fig. S4).
R.SacI accessibility assay
Nuclei were prepared exactly as for MAPit, except that ethylenediaminetetraacetic acid and glycerol were omitted and 5 mM MgCl2 was included.
Statistical analysis
All statistical analyses were performed using GraphPad Prism software. Pearson’s correlation was used to determine correlations and coefficients between samples and between amplicon length and abundance. For reproducibility measures, reads per locus were plotted in a correlation matrix for pairwise comparisons as previously described (Varley and Mitra 2010). Comparisons between groups were tested using two-way ANOVA followed by a Bonferroni ad hoc test. Significance values for differentially regulated promoters, copy-restricted signatures, and enrichment for methylation states were obtained using a two-sided Fisher’s exact test.
Immunostaining and flow cytometry
Cells were seeded in spheroid culture conditions, grown for 4 d, then treated with the indicated doses of TMZ. Three days after drug treatment, cells were harvested. Intact cells that excluded propidium iodide were then recovered by fluorescence-activated cell sorting for both downstream immunolabeling using antibody against MLH1 (sc-11442, 1/500 dilution, Santa Cruz) and chromatin accessibility assays. MLH1 staining was quantified by flow cytometry on a Becton Dickinson LSRII instrument.
Data access
Raw 454 sequence reads have been submitted to the NCBI Gene Expression Omnibus (GEO; http://www.ncbi.nlm.nih.gov/geo/) under accession number GSE50047.
Competing interest statement
M.P.K. shares royalties with coinventors for the M.CviPI enzyme used as a chromatin probe.
Acknowledgments
We thank Leo Behie for generously providing the NSC and Robi David Mitra for generously providing the patch oligonucleotide library. We also thank Maximiliaan Schillebeeckx for helpful advice regarding patch library preparation. This work was funded by the NCI R01CA155390 to M.P.K., the Bankhead-Coley Cancer Research Program, Florida Department of Health 1BD03 to N.H.N., and NIH R21CA14102001 to B.A.R. We also thank the National Brain Tumor Society and the Florida Center for Brain Tumor Research for their support.
Footnotes
[Supplemental material is available for this article.]
Article published online before print. Article, supplemental material, and publication date are at http://www.genome.org/cgi/doi/10.1101/gr.161737.113.
References
- Baghbaderani BA, Mukhida K, Sen A, Kallos MS, Hong M, Mendez I, Behie LA 2010. Bioreactor expansion of human neural precursor cells in serum-free media retains neurogenic potential. Biotechnol Bioeng 105: 823–833 [DOI] [PubMed] [Google Scholar]
- Baylin SB, Jones PA 2011. A decade of exploring the cancer epigenome—biological and translational implications. Nat Rev Cancer 11: 726–734 [DOI] [PMC free article] [PubMed] [Google Scholar]
- Bronner CE, Baker SM, Morrison PT, Warren G, Smith LG, Lescoe MK, Kane M, Earabino C, Lipford J, Lindblom A, et al. 1994. Mutation in the DNA mismatch repair gene homologue hMLH1 is associated with hereditary non-polyposis colon cancer. Nature 368: 258–261 [DOI] [PubMed] [Google Scholar]
- Darst RP, Nabilsi NH, Pardo CE, Riva A, Kladde MP 2012. DNA methyltransferase accessibility protocol for individual templates by deep sequencing. Methods Enzymol 513: 185–204 [DOI] [PMC free article] [PubMed] [Google Scholar]
- Darst RP, Haecker I, Pardo CE, Renne R, Kladde MP 2013. Epigenetic diversity of Kaposi’s sarcoma-associated herpesvirus. Nucleic Acids Res 41: 2993–3009 [DOI] [PMC free article] [PubMed] [Google Scholar]
- Deleyrolle LP, Reynolds BA 2009. Isolation, expansion, and differentiation of adult mammalian neural stem and progenitor cells using the neurosphere assay. Methods Mol Biol 549: 91–101 [DOI] [PubMed] [Google Scholar]
- Deleyrolle LP, Harding A, Cato K, Siebzehnrubl FA, Rahman M, Azari H, Olson S, Gabrielli B, Osborne G, Vescovi A, et al. 2011. Evidence for label-retaining tumour-initiating cells in human glioblastoma. Brain 134: 1331–1343 [DOI] [PMC free article] [PubMed] [Google Scholar]
- Delmas AL, Riggs BM, Pardo CE, Dyer LM, Darst RP, Izumchenko EG, Monroe M, Hakam A, Kladde MP, Siegel EM, et al. 2011. WIF1 is a frequent target for epigenetic silencing in squamous cell carcinoma of the cervix. Carcinogenesis 32: 1625–1633 [DOI] [PMC free article] [PubMed] [Google Scholar]
- Dieterich LC, Mellberg S, Langenkamp E, Zhang L, Zieba A, Salomaki H, Teichert M, Huang H, Edqvist PH, Kraus T, et al. 2012. Transcriptional profiling of human glioblastoma vessels indicates a key role of VEGF-A and TGFβ2 in vascular abnormalization. J Pathol 228: 378–390 [DOI] [PubMed] [Google Scholar]
- Esteller M 2007. Cancer epigenomics: DNA methylomes and histone-modification maps. Nat Rev Genet 8: 286–298 [DOI] [PubMed] [Google Scholar]
- Feinberg AP, Irizarry RA 2010. Evolution in health and medicine Sackler colloquium: Stochastic epigenetic variation as a driving force of development, evolutionary adaptation, and disease. Proc Natl Acad Sci (Suppl 1) 107: 1757–1764 [DOI] [PMC free article] [PubMed] [Google Scholar]
- Felsberg J, Thon N, Eigenbrod S, Hentschel B, Sabel MC, Westphal M, Schackert G, Kreth FW, Pietsch T, Loffler M, et al. 2011. Promoter methylation and expression of MGMT and the DNA mismatch repair genes MLH1, MSH2, MSH6 and PMS2 in paired primary and recurrent glioblastomas. Int J Cancer 129: 659–670 [DOI] [PubMed] [Google Scholar]
- Fuks F 2005. DNA methylation and histone modifications: Teaming up to silence genes. Curr Opin Genet Dev 15: 490–495 [DOI] [PubMed] [Google Scholar]
- Gardiner-Garden M, Frommer M 1987. CpG islands in vertebrate genomes. J Mol Biol 196: 261–282 [DOI] [PubMed] [Google Scholar]
- Hansen KD, Timp W, Bravo HC, Sabunciyan S, Langmead B, McDonald OG, Wen B, Wu H, Liu Y, Diep D, et al. 2011. Increased methylation variation in epigenetic domains across cancer types. Nat Genet 43: 768–775 [DOI] [PMC free article] [PubMed] [Google Scholar]
- Hegi ME, Diserens AC, Gorlia T, Hamou MF, de Tribolet N, Weller M, Kros JM, Hainfellner JA, Mason W, Mariani L, et al. 2005. MGMT gene silencing and benefit from temozolomide in glioblastoma. N Engl J Med 352: 997–1003 [DOI] [PubMed] [Google Scholar]
- Herman JG, Baylin SB 2003. Gene silencing in cancer in association with promoter hypermethylation. N Engl J Med 349: 2042–2054 [DOI] [PubMed] [Google Scholar]
- Jiang C, Pugh BF 2009. Nucleosome positioning and gene regulation: Advances through genomics. Nat Rev Genet 10: 161–172 [DOI] [PMC free article] [PubMed] [Google Scholar]
- Kelly TK, Liu Y, Lay FD, Liang G, Berman BP, Jones PA 2012. Genome-wide mapping of nucleosome positioning and DNA methylation within individual DNA molecules. Genome Res 12: 2497–2506 [DOI] [PMC free article] [PubMed] [Google Scholar]
- Kilgore JA, Hoose SA, Gustafson TL, Porter W, Kladde MP 2007. Single-molecule and population probing of chromatin structure using DNA methyltransferases. Methods 41: 320–332 [DOI] [PMC free article] [PubMed] [Google Scholar]
- Kladde MP, Xu M, Simpson RT 1996. Direct study of DNA-protein interactions in repressed and active chromatin in living cells. EMBO J 15: 6290–6300 [PMC free article] [PubMed] [Google Scholar]
- Knobbe CB, Trampe-Kieslich A, Reifenberger G 2005. Genetic alteration and expression of the phosphoinositol-3-kinase/Akt pathway genes PIK3CA and PIKE in human glioblastomas. Neuropathol Appl Neurobiol 31: 486–490 [DOI] [PubMed] [Google Scholar]
- Liu L, Markowitz S, Gerson SL 1996. Mismatch repair mutations override alkyltransferase in conferring resistance to temozolomide but not to 1,3-bis(2-chloroethyl)nitrosourea. Cancer Res 56: 5375–5379 [PubMed] [Google Scholar]
- Mashima T, Sato S, Sugimoto Y, Tsuruo T, Seimiya H 2009. Promotion of glioma cell survival by acyl-CoA synthetase 5 under extracellular acidosis conditions. Oncogene 28: 9–19 [DOI] [PubMed] [Google Scholar]
- Pardo C, Hoose SA, Pondugula S, Kladde MP 2009. DNA methyltransferase probing of chromatin structure within populations and on single molecules. Methods Mol Biol 523: 41–65 [DOI] [PubMed] [Google Scholar]
- Pardo CE, Carr IM, Hoffman CJ, Darst RP, Markham AF, Bonthron DT, Kladde MP 2011a. MethylViewer: Computational analysis and editing for bisulfite sequencing and methyltransferase accessibility protocol for individual templates (MAPit) projects. Nucleic Acids Res 39: e5. [DOI] [PMC free article] [PubMed] [Google Scholar]
- Pardo CE, Darst RP, Nabilsi NH, Delmas AL, Kladde MP 2011b. Simultaneous single-molecule mapping of protein-DNA interactions and DNA methylation by MAPit. Curr Protoc Mol Biol 95: 21.22.1–21.22.18 [DOI] [PMC free article] [PubMed] [Google Scholar]
- Piao JH, Odeberg J, Samuelsson EB, Kjaeldgaard A, Falci S, Seiger A, Sundstrom E, Akesson E 2006. Cellular composition of long-term human spinal cord- and forebrain-derived neurosphere cultures. J Neurosci Res 84: 471–482 [DOI] [PubMed] [Google Scholar]
- Prolla TA, Baker SM, Harris AC, Tsao JL, Yao X, Bronner CE, Zheng B, Gordon M, Reneker J, Arnheim N, et al. 1998. Tumour susceptibility and spontaneous mutation in mice deficient in Mlh1, Pms1 and Pms2 DNA mismatch repair. Nat Genet 18: 276–279 [DOI] [PubMed] [Google Scholar]
- Schreiber SL, Bernstein BE 2002. Signaling network model of chromatin. Cell 111: 771–778 [DOI] [PubMed] [Google Scholar]
- Sharma SV, Lee DY, Li B, Quinlan MP, Takahashi F, Maheswaran S, McDermott U, Azizian N, Zou L, Fischbach MA, et al. 2010. A chromatin-mediated reversible drug-tolerant state in cancer cell subpopulations. Cell 141: 69–80 [DOI] [PMC free article] [PubMed] [Google Scholar]
- Shmelkov SV, Jun L, St Clair R, McGarrigle D, Derderian CA, Usenko JK, Costa C, Zhang F, Guo X, Rafii S 2004. Alternative promoters regulate transcription of the gene that encodes stem cell surface protein AC133. Blood 103: 2055–2061 [DOI] [PubMed] [Google Scholar]
- Stark AM, Doukas A, Hugo HH, Mehdorn HM 2010. The expression of mismatch repair proteins MLH1, MSH2 and MSH6 correlates with the Ki67 proliferation index and survival in patients with recurrent glioblastoma. Neurol Res 32: 816–820 [DOI] [PubMed] [Google Scholar]
- Stupp R, Mason WP, van den Bent MJ, Weller M, Fisher B, Taphoorn MJ, Belanger K, Brandes AA, Marosi C, Bogdahn U, et al. 2005. Radiotherapy plus concomitant and adjuvant temozolomide for glioblastoma. N Engl J Med 352: 987–996 [DOI] [PubMed] [Google Scholar]
- Sumiyoshi H, Inoguchi K, Khaleduzzaman M, Ninomiya Y, Yoshioka H 1997. Ubiquitous expression of the α1(XIX) collagen gene (Col19a1) during mouse embryogenesis becomes restricted to a few tissues in the adult organism. J Biol Chem 272: 17104–17111 [DOI] [PubMed] [Google Scholar]
- Sun Y, Kong W, Falk A, Hu J, Zhou L, Pollard S, Smith A 2009. CD133 (Prominin) negative human neural stem cells are clonogenic and tripotent. PLoS ONE 4: e5498. [DOI] [PMC free article] [PubMed] [Google Scholar]
- Takai D, Jones PA 2002. Comprehensive analysis of CpG islands in human chromosomes 21 and 22. Proc Natl Acad Sci 99: 3740–3745 [DOI] [PMC free article] [PubMed] [Google Scholar]
- Taverna P, Liu L, Hanson AJ, Monks A, Gerson SL 2000. Characterization of MLH1 and MSH2 DNA mismatch repair proteins in cell lines of the NCI anticancer drug screen. Cancer Chemother Pharmacol 46: 507–516 [DOI] [PubMed] [Google Scholar]
- Varley KE, Mitra RD 2010. Bisulfite Patch PCR enables multiplexed sequencing of promoter methylation across cancer samples. Genome Res 20: 1279–1287 [DOI] [PMC free article] [PubMed] [Google Scholar]
- Visvader JE, Lindeman GJ 2008. Cancer stem cells in solid tumours: Accumulating evidence and unresolved questions. Nat Rev Cancer 8: 755–768 [DOI] [PubMed] [Google Scholar]
- von Bueren AO, Bacolod MD, Hagel C, Heinimann K, Fedier A, Kordes U, Pietsch T, Koster J, Grotzer MA, Friedman HS, et al. 2012. Mismatch repair deficiency: A temozolomide resistance factor in medulloblastoma cell lines that is uncommon in primary medulloblastoma tumours. Br J Cancer 107: 1399–1408 [DOI] [PMC free article] [PubMed] [Google Scholar]
- Wolff EM, Byun HM, Han HF, Sharma S, Nichols PW, Siegmund KD, Yang AS, Jones PA, Liang G 2010. Hypomethylation of a LINE-1 promoter activates an alternate transcript of the MET oncogene in bladders with cancer. PLoS Genet 6: e1000917. [DOI] [PMC free article] [PubMed] [Google Scholar]
- Xu M, Kladde MP, Van Etten JL, Simpson RT 1998a. Cloning, characterization and expression of the gene coding for a cytosine-5-DNA methyltransferase recognizing GpC. Nucleic Acids Res 26: 3961–3966 [DOI] [PMC free article] [PubMed] [Google Scholar]
- Xu M, Simpson RT, Kladde MP 1998b. Gal4p-mediated chromatin remodeling depends on binding site position in nucleosomes but does not require DNA replication. Mol Cell Biol 18: 1201–1212 [DOI] [PMC free article] [PubMed] [Google Scholar]
- Yang X, Noushmehr H, Han H, Andreu-Vieyra C, Liang G, Jones PA 2012. Gene reactivation by 5-aza-2′-deoxycytidine-induced demethylation requires SRCAP-mediated H2A.Z insertion to establish nucleosome depleted regions. PLoS Genet 8: e1002604. [DOI] [PMC free article] [PubMed] [Google Scholar]
- You JS, Kelly TK, De Carvalho DD, Taberlay PC, Liang G, Jones PA 2011. OCT4 establishes and maintains nucleosome-depleted regions that provide additional layers of epigenetic regulation of its target genes. Proc Natl Acad Sci 108: 14497–14502 [DOI] [PMC free article] [PubMed] [Google Scholar]