Abstract
Heterocyclic diamidines are strong DNA minor groove binders and have excellent antiparasitic activity. To extend the biological activity of these compounds, a series of arylimidamides (AIAs) analogs, which have better uptake properties in Leishmania and T. cruizi than diamidines, was prepared. The binding of the AIAs to DNA was investigated by Tm, fluorescence displacement titration, circular dichroism, DNase I footprinting, biosensor surface plasmon resonance, X-ray Crystallography and molecular modeling. These compounds form 1:1 complexes with AT sequences in the DNA minor groove and the binding strength varies with substituent size, charge and polarity. This substituent dependent structure and properties provide a SAR that can be used to estimate K values for binding to DNA in this series. The structural results and molecular modeling studies provide an explanation for the differences in binding affinities for AIAs.
Keywords: Arylimidamides (AIAs), DNA, Minor Groove Binder, Molecular Modeling, X-ray Crystallography
Introduction
Protozoal parasitic diseases have caused significant human health problems for centuries and they continue to do so in developing countries. Chagas’ disease (American trypanosomiasis) and Leishmaniasis are particularly widespread and do not currently have satisfactory treatments for the affected populations.[1,2] Chagas’ disease, caused by Trypanosoma cruzi (T. cruzi), is prevalent from the southern United States to Argentina with 90 million people estimated to be at risk and 16–18 million currently infected.[3] Over 300 million people around the world are at risk of contracting the Leishmania parasite and drugs used to treat that disease are also unsatisfactory with most exhibiting considerable toxicity and resistance is developing.[4,5] Aromatic diamidines, such as pentamidine (Figure 1) are active against the Trypanosoma brucei (T. brucei) parasite that causes human African sleeping sickness (HAT) as well as against other parasites.[6] Highly fluorescent heterocyclic diamidine analogs of pentamidine have been developed and fluorescence microscopy, as well as detailed molecular biology analysis, has demonstrated that the mitochondrial kinetoplast is the primary cellular target of the compounds.[7–14] A prodrug of furamidine (DB75, Figure 1) has been used in clinical trials against first stage HAT and a related compound is active against the second stage of the disease.[6,15–18] Clearly compounds of this type are promising for the treatment of HAT and related diseases.[19–21]
Figure 1.
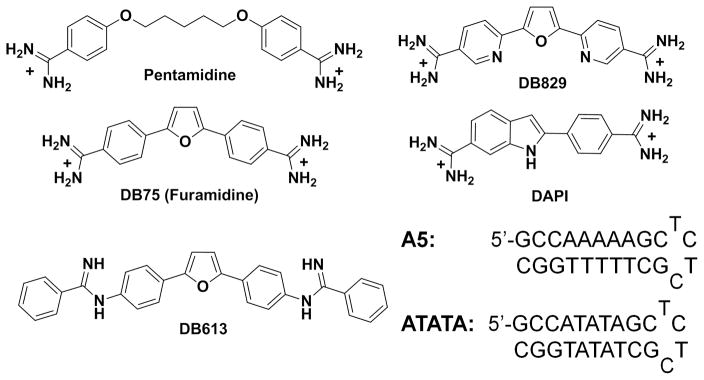
Structure of the compounds and the DNA sequences used in this study. For SPR experiments, 5′-biotin labeled DNA sequences are used.
Since the heterocyclic diamidines bind to the minor groove of DNA at AT sites of four or more base pairs, and the DNA of the kinetoplast has a very large number of appropriate binding sites, targeting this unique DNA structure of the parasite offers a number of therapeutic advantages. Replication of the circular, interlocked kinetoplast DNA appears to be particularly sensitive to the diamidines, perhaps due to compound induced conformational changes that disrupt the kinetoplast structure.[22–24] There are no known DNA structures in humans that are equivalent to the kinetoplast, and targeting the kinetoplast thus offers an excellent route to selective drug action.[11] The diamidines are taken up into T. brucei cells by the P2 membrane transporter and since the parasite lives in blood in all initial stages of infection, uptake is quite effective.[25] These compounds are, however, taken up much less effectively by both the T. cruzi and Leishmania parasites which live in human macrophage cells. They still appear to target the kinetoplast of these organisms but they are much less active against them, presumably due to poor uptake.[26]
A potentially promising route to developing new heterocyclic cations, which could selectively target the kinetoplast of T. cruzi and Leishmania but which also have the potential for better cell uptake, is to modify the amidine group while maintaining the basic structure that is the key component of the DNA interactions. A promising modification involves conversion of the amidines to arylimidamides (AIAs, previously referred to as “reverse” amidines) where a nitrogen of the amidine is linked to the heteroaromatic core (Table 1) rather than the carbon in classical amidines (Figure 1). The AIAs have lower pKa values and typically have much better biological activity against both T. cruzi and Leishmania than the amidines.[27–31] The AIAs offer a new approach for development of drugs against these diseases, but we understand much less about their DNA interactions than with amidine derivatives. As a key step in understanding their biological targets as well as developing these compounds to effectively treat parasites, we have evaluated the interactions of an array of modified AIAs with AT DNA binding sites that are typical of those found in kinetoplast DNA. This is the first detailed study of DNA complexes of AIAs and the results show a surprisingly large variation in DNA interactions with relatively small changes in the structure of the compounds.
Table 1.
Comparison of Tm and fluorescence for AIAs.
| Compound | R | ΔTm [a] (°C) | F70 [b] (μM) |
|---|---|---|---|
| A |
|
||
| DB667 | H | 19.6 | 1.7 |
| DB709 | OCH3 | 13.1 | 1.2 |
| DB745 | OCH2CH3 | 8.1 | 2.0 |
| DB766 | OCH(CH3)2 | 6.0 | 5.5 |
| DB1890 | OCH2CH(CH3)2 | 2.0 | >10 |
| DB1950 | OCH2CH2CH(CH3)2 | 1.0 | >10 |
| DB1852 |
|
0.2 | >10 |
| DB1880 |
|
27.1 | 0.55 |
| DB1876 |
|
25.0 | 0.6 |
| B |

|
||
| DB766 |
|
6.0 | 5.5 |
| DB1831 |
|
7.0 | 1.2 |
| DB1855 |

|
1.1 | 9.0 |
| DB1937 |
|
0.5 | >10 |
poly(dA)·poly(dT), the listed ΔTm values are an average of three independent trials with a reproducibility of ±0.5 °C.
F70: the compound concentration to reduce the fluorescence of DAPI in complex with A5 to 70% of the initial value. The F70 values are reproducible within 10%.
Results and Discussion
Thermal Melting: Ranking the compounds
Thermal melting enables the rapid qualitative evaluation of the relative binding affinities of compounds for DNA.[32] As part of a screen to find new compounds that target kinetoplast AT sequences, ΔTm values for AIAs with poly(dA)·poly(dT) were determined (Table 1). The ΔTm values of the DNA complexes show quite large, structure dependent variations. Triple helix formation (TnAnTn) was excluded because it leads to biphasic melting curves for the duplex and triplex species. Since biphasic curves were not seen with the AIAs (Figure S1 in Supplementary Information), and since duplex specific minor groove binders are usually very poor triplex inducers, we are able to rule out any triplex formation.[33]
O-Alkyl substitution: Scaffold A
The R in Scaffold A of Table 1 has -O-alkyl substituents of increasing size or piperidine groups with two extra charges. The ΔTm values are quite sensitive to compound structure. With the unsubstituted DB667 (H as R, Table 1), for example, the ΔTm is 19.6 °C but as the alkyl group increases in size, there is a large decrease in the ΔTm. With an O-methyl R group, DB709, the ΔTm is down to 13.1 °C, while the compound with an O-CH2CH(CH3)2 alkyl group, DB1890, has only a 2.0 °C ΔTm. DB1880 with a charged O-piperidine group and DB1876 with a charged O-isopropylpiperidine group, on the other hand, have a very high ΔTm even with the substantial size of the substituent.
Variations in the terminal six membered rings: Scaffold B
Compounds in Scaffold B have an extra nitrogen added to the terminal pyridine of DB766 and their ΔTm values are sensitive to the N position (Table 1). The ΔTm values are relatively low for all compounds in the Scaffold B group.
Fluorescence displacement titrations: Comparing the relative affinities
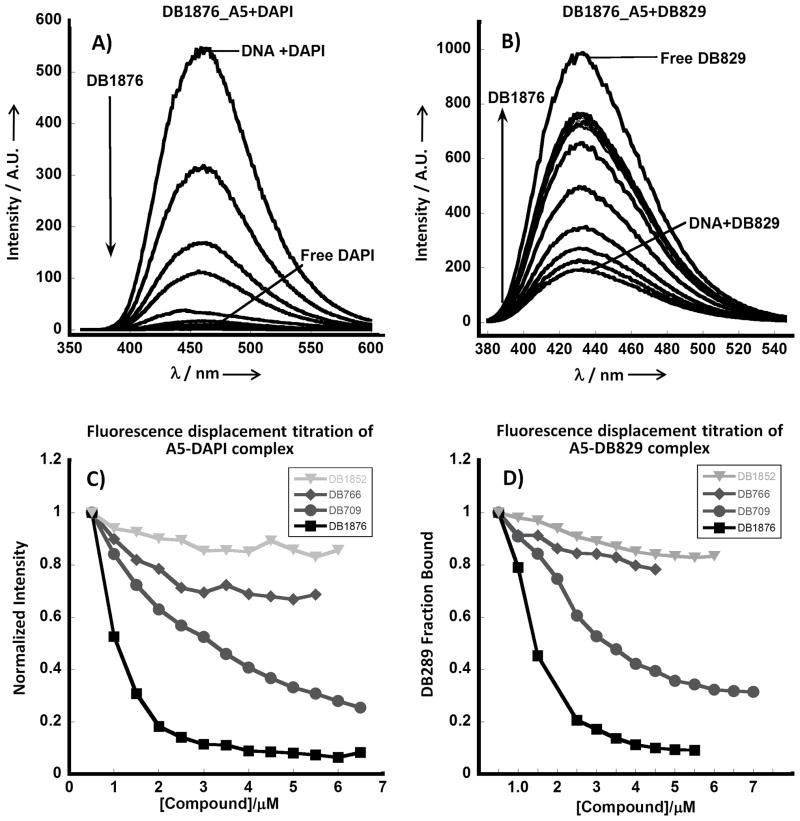
Unlike classical amidines, the AIAs do not fluoresce by themselves and, therefore, fluorescence displacement titrations were used as an additional screen to rank them according to their binding affinity at 25 °C as compared to the high temperatures in Tm experiments. The compounds were tested with hairpin DNAs containing an A5 binding sequence, which is an analog of the poly(dA)·poly(dT) used in Tm experiments, and an ATATA sequence to evaluate the AT sequence dependent interactions with DNA. DNAs with two fluorophores, DAPI and DB829, (Figure 1) which have very different properties were used to test the binding affinities. DAPI alone has low fluorescence but when bound to DNA it fluoresces strongly, whereas DB829 has the reverse fluorescence behavior. Figure 2A,B shows typical fluorescence displacement titrations with DB1876 for DAPI-A5 and DB829-A5 complexes. Titration of the DAPI-A5 complex with DB1876 (Figure 2A) displaces DAPI and results in a decrease in the intensity, as expected. Reverse changes in fluorescence are observed on titration of the DB829 complex (Figure 2B). Figures 2C,D compare ratio plots for titration of the A5-DAPI and A5-DB829 complexes with several compounds from Table 1. The titration displacement curve for DB1876 is sharp and the compound displaces DAPI and DB829 at low compound concentration. The F70, the compound concentration to reduce the fluorescence to 70% of the initial value, for DB1876 is 0.6 (all concentration values in μM) with the DAPI-A5 sequence while the values for the other compounds in the plot are higher: DB709 (F70 = 1.2), DB766 (F70 = 5.5) and DB1852 (F70 > 10). The displacement results with DB829 are in general agreement with the DAPI and Tm results.
Figure 2.
Fluorescence displacement titrations. Titration of DB1876 into: A) DAPI-A5 B) DB829-A5 hairpin DNA complexes. DAPI fluoresces when bound, so as it is displaced, fluorescence intensity decreases. DB829 fluoresces more strongly in solution, so as it is displaced, the fluorescence intensity increases. Normalized fluorescence displacement titration: Representative normalized plots of intensity vs compound concentration for fluorescence displacement titration of DB1876, DB1852, DB766 and DB709 titrated into C) DAPI-A5 D) DB829-A5 complexes. DB1876 has the highest binding affinity; DB709 has a moderately high binding affinity; DB766 and DB1852 have low binding affinity
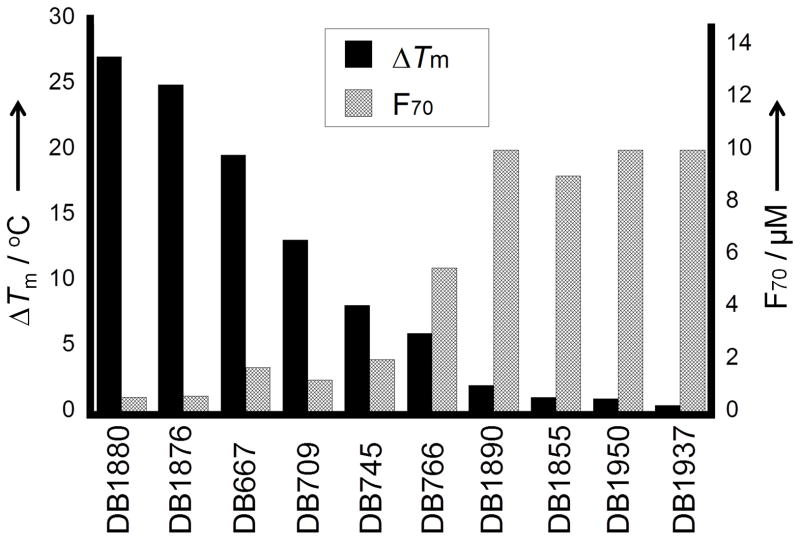
The agreement between the ΔTm and F70 results is illustrated with the plots in Figure 3 for the compounds in Table 1. The fluorescence displacement titration results are in excellent agreement with the inverse of the ΔTm values. Both sets of results show that the AIAs bind to AT DNA sequences in a structure dependent manner and some compounds bind quite strongly.
Figure 3.
Comparative histogram plots of ΔTm (black) and fluorescence (grey) for some compounds that vary significantly in DNA affinity
CD: Determining the binding mode and stoichiometry
CD spectroscopy with A5 and ATATA hairpin DNA sequences was used to obtain information on the binding mode of AIA compounds that were selected based on Tm and F70 results (Figure 4). Positive induced signals in CD spectroscopy are generally obtained for compounds that bind in the DNA minor groove, and this pattern provides a method for evaluating binding modes. DB1876 gives strong induced CD with saturation at about a 1:1 compound to DNA ratio. A plot (Figure 4D) of induced CD (ICD) vs compound / DNA ratio indicates a break at approximately 1:1 for A5 and ATATA and suggests that DB1876 binds as a monomer in the minor groove of these AT sequences. With A5 it is also possible to fit the data differently, with a break at a 1.4:1 ratio. Because these simple oligomers should bind the compound at either a 1:1 or 1:2 ratio, we think the fit at near the 1:1 ratio is most reasonable. DB1852, a close analog of DB1876 with a neutral O-pentacyclic ring, shows poor CD indicating that it binds weakly, in agreement with Tm and F70 results. The CD results thus confirm a minor groove binding mode for the compounds of Figure 2A,B and generally support the Tm and F70 conclusions.
Figure 4.
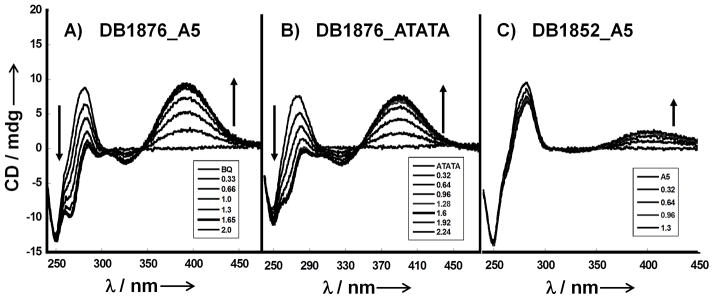
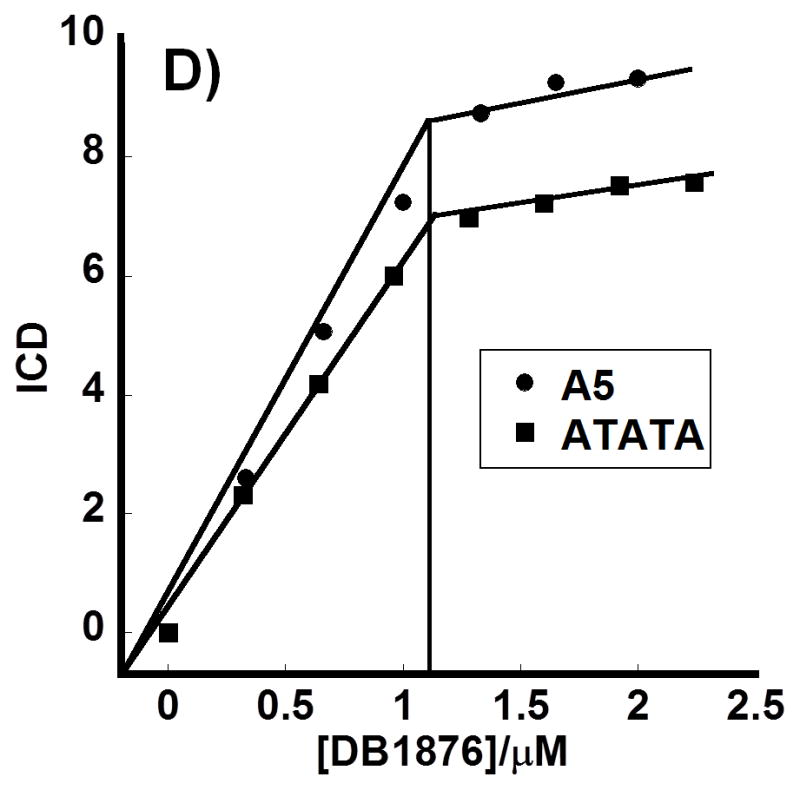
Circular dichroism spectra: A) DB1876-A5 B) DB1876-ATATA C) DB1852-A5 titrations for added ratios (compound to DNA hairpin) from bottom to top range from 0.32 to 3.0 D) A plot of induced CD (ICD) vs DB1876/DNA ratio
SPR-Biosensor: Quantitative and stoichiometric analysis of complexes
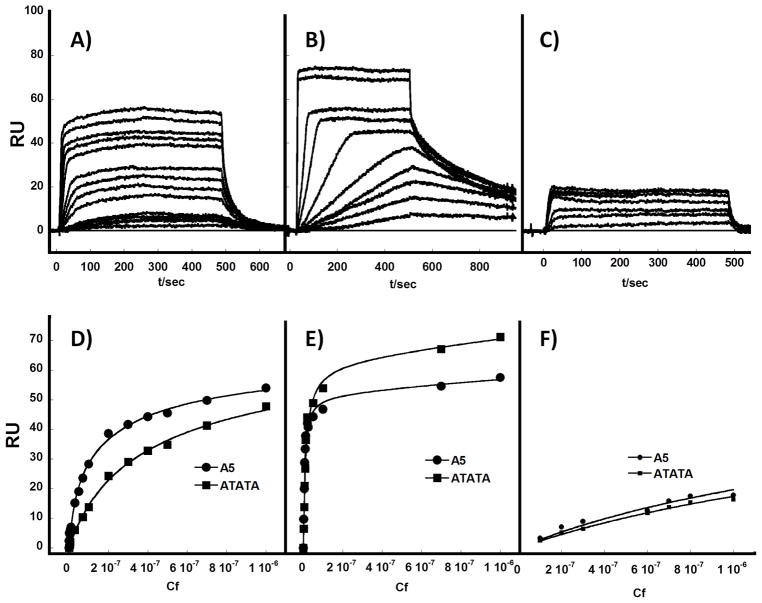
In order to more quantitatively evaluate the interactions of representative AIA analogs with DNA, biosensor-SPR experiments were conducted with DNA hairpin duplexes containing A5 and ATATA sequences. The flow cells for A5 and ATATA had essentially the same amount of DNA immobilized so that their sensorgram saturation levels can be compared directly for stoichiometry differences. The sensorgrams of DB667 (Figure 5A) show fast kinetics of association and dissociation and they can be fitted to a steady state analysis.[34–36] The steady state RU values were plotted against Cf (free compound concentration) and fitted to a single site model (Figure 5D) which is predicted by the RU value at saturation of the DNA binding site.[37] The K (equilibrium binding constant) values are collected in Table 2. DB667 binds strongly to A5 (9.0 × 10⁶ M−1) and somewhat weaker to ATATA (2.8 × 10⁶ M−1). Interestingly, DB709, with O-methyl groups in place of the -H in DB667, has significantly reduced affinity (Figure 5C, F). DB766, which was difficult to study due to poor binding and water solubility, shows very low SPR signals (data not shown) that confirm its weaker binding affinity.
Figure 5.
Surface plasmon resonance. Representative SPR Sensorgrams for: A) DB667, B) DB1876 and C) DB709 binding to immobilized A5 and ATATA hairpin DNAs. The compound concentrations were 0.01 to 1.0 μM from bottom to top sensorgrams. SPR binding affinity plots. RU values from the steady-state region of SPR sensorgrams are plotted against the unbound compound concentration, Cf (flow solution) for D) DB667, E) DB1876 and F) DB709 with A5 and ATATA DNA.
Table 2.
| Compound | A5 (K×106 M−1) | ATATA (K×106 M−1) |
|---|---|---|
| DB667 | 9.0 | 2.8 |
| DB1876 | 85 | 57 |
| DB709 | 0.5 | 0.4 |
| DB613 | 15 | 3.6 |
| DB75 | 18 | 24 |
The listed binding affinities are an average of two independent experiments carried out with two different sensor chips and the values are reproducible within 10%.
Sensorgrams for DB1876, with the O-isopropylpiperidine ring, show that the compound has much slower binding kinetics with DNA than the other AIAs (Figure 5B). At low compound concentrations the slow kinetics prevents reaching a steady state in the experimental time range which is limited by injection volume. Even for these low concentration samples, it is possible to fit the curves with a 1:1 kinetic binding model [33–36] to determine predicted steady-state RU values for DB1876. At the higher concentrations of DB1876 the steady state was reached, and these values can be used directly in the RU versus Cf plots along with predicted values (Figure 5E). DB1876 has very strong binding affinity for A5 and somewhat weaker binding to ATATA (Table 2). These results are in excellent agreement with the more qualitative Tm and fluorescence results.
DNase I footprinting: Sequence specificity
To compare the binding of compounds with high molecular weight DNA to the results obtained on the hairpin DNAs, DNase I footprinting studies were conducted. DNase I cuts DNA at all sites but with variations in rates that depend on the local minor groove geometry. Small molecules that bind in the minor groove block access of the enzyme and result in reduced cleavage. [38,39]
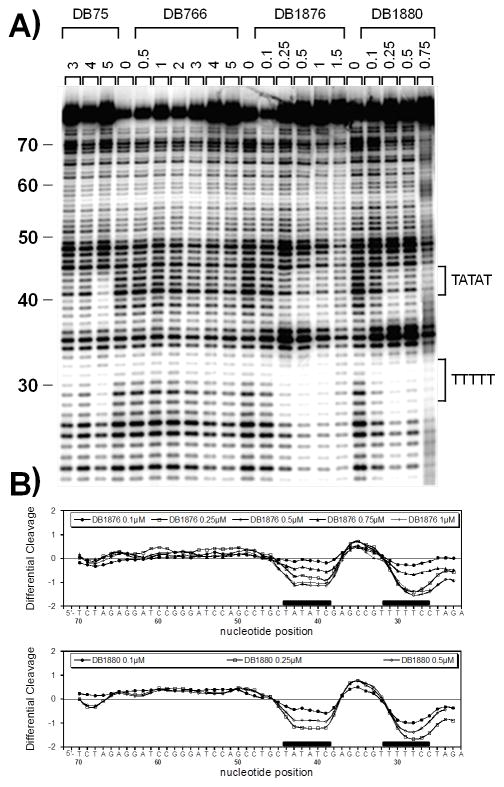
Footprinting results for selected AIAs from Table 1 are shown in Figure 6 with an experimental gel. DB75, a well-characterized diamidine, was used as a control in these studies and displays good footprints at both the alternating and non-alternating AT sequences. Gel results for DB766, with an O-isopropyl substituent, show no detectable footprint up to greater than 1 μM concentration. The more highly charged, DB1876, has strong footprints at 0.5 μM and above, while DB1880 (O-piperidine) has strong footprints at 0.25 μM and above. These results are in agreement with the Tm and SPR results and suggest that the hairpin DNAs affinities are reflected in higher molecular weight DNAs.
Figure 6.
DNase I footprinting titration experiments. The 81bp DNA fragment containing A5 and ATATA sites was incubated with increasing concentrations of DB75, DB766, DB1876 and DB1880 as indicated on the top of the lanes (μM) prior to be subjected to DNase I mild digestion. A) The digested products were separated on a 8% polyacrylamide gel containing 8M urea. Sequences at the footprinting sites are indicated to the right of the gel. B) Corresponding densitometric analysis reveals the localization of the footprints (black boxes) along the DNA sequence.
X-ray crystallography: The structure of the DB1880-DNA complex
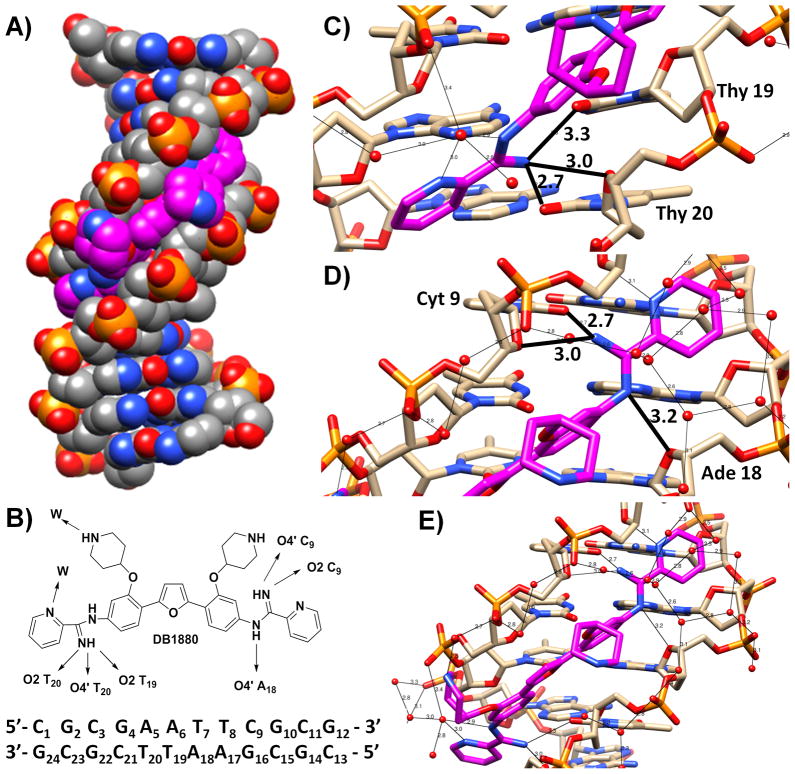
In order to evaluate the structural basis of the AIA-DNA minor groove complexes as well as strong binding of the tetracationic derivatives, crystals of the DB1880-DNA complex were grown and the structure was solved by X-ray crystallography. The d(CGCGAATTCGCG)2 sequence forms a self-complementary B-form DNA duplex helix, as has been observed in a large number of previous studies.[40–43] The helically-twisted DB1880 molecule is bound as a monomer in the minor groove and covers almost all of the six base-pair sequence (A5/T20) (A6/T19) (T7/A18) (T8/A17) (C9/G16) (G10/C15) in this narrow central region of the helix (Figure 7A,B). The two phenyl rings and the furan ring are oriented parallel to the minor groove walls and are embedded deep into the groove, while the two terminal pyridine rings are twisted to the mean plane of these three central rings and are close to the mouth of the minor groove.
Figure 7.
A) Crystallographic structure of DB1880-DNA complex, which is displayed as space filling type. The DNA sequence is shown in grey, DB1880 molecule in magenta, nitrogen atoms in blue and oxygen atoms in red. B) The full sequence with bases numbered and binding schematic. Detailed views of the hydrogen-bond interactions between the DB1880 ligand and the DNA. The distances were measured between heavy atoms and are in Å. C) Showing the three hydrogen bonds between one amidinium nitrogen atom and the O4′ atom of Thy20, and the O2 atoms of Thy20 and Thy19. D) Showing the hydrogen bonds between amidinium nitrogen atoms and the O2 atom of Cyt9, and the O4′ atoms of Cyt9 and Ade18. E) Showing the network of hydrogen bonds bridging water molecules with DB1880 and DNA phosphate oxygen atoms.
There are a number of direct hydrogen-bond and water bridging contacts between the ligand and the DNA, as shown in Figure 7B. One inner-facing amidine nitrogen atom is oriented by 43° out of the plane of the central diphenylfuran moiety and hydrogen bonds to the O2 atoms of thymine 20 and thymine19 (2.7 and 3.3 Å respectively). This nitrogen atom is also involved in hydrogen bonding to the O4′ atom thymine 20 (3.0 Å) (Figure 7C). At the other end of the DB1880 molecule (Figure 7D), the amidinium group is twisted by 72° relative to this plane and one amidinium nitrogen atom hydrogen bonds (2.7 Å) to the O2 atom of cytosine 9, as well as to the O4′ atom of cytosine 9 (3.0 Å). The other amidinium nitrogen atom is involved in hydrogen bonding to the O4′ atom of adenine 18 (3.2 Å) on the complementary strand.
Neither piperidinyl group directly hydrogen bonds to the DNA. One interacts through its nitrogen atom, via a bridging water molecule, to a phosphate group, as does the adjacent pyridine ring, to the next phosphate group on the same strand. The latter water molecule also hydrogen bonds to the adjacent amidinium nitrogen atom as well as to a short chain of water molecules that links to a third phosphate group (Figure 7E). Both piperidine groups extend outwards from the groove so that their cationic ring nitrogen atoms are relatively close to the anionic phosphate groups. Although few water molecules have been located in the vicinity of these nitrogen atoms, we cannot discount the possibility that the water bridging referred to above occurs more extensively, in view of the strong likelihood that further water molecules are present in these regions.
A well-pronounced network of water molecules is apparent, surrounding the outer edge of the bound ligand. This horseshoe-like arrangement extends along the phosphate groups of both strands and terminates at one end of the ligand in a network of two connected rings of water molecules, closely similar to previous observations of water networks in DNA minor groove ligand complexes.[44]
Free compound modeling and docking with DNA
In order to better understand the effects of substituents on AIA-DNA interactions molecular docking studies were performed.
O-Alkyl substitution: Scaffold A
With the unsubstituted DB667 (H as R, Table 1), DFT calculations for optimizing geometry at the 631G* approximation level shows that the phenyl-furan-phenyl system adopts a coplanar conformation (Figure 8A). As the alkyl group increases in size with the addition of O-alkyl substituents, steric clash overcomes the long range conjugation and causes some twist between the phenyls and furan. DB1890, which has an O-CH2CH(CH3)2 R group, for example, has dihedral angles between the phenyl and furan ring of approximately 14°.
Figure 8.
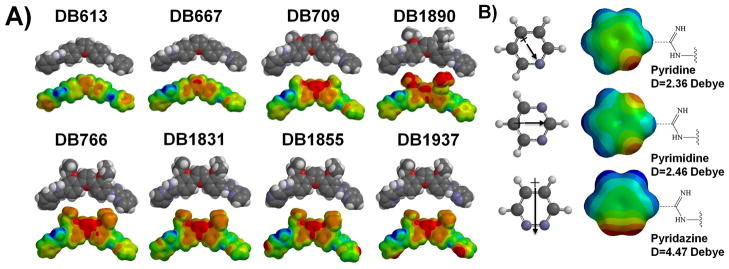
A) Electrostatic potential maps. Equilibrium geometry of the select AIAs calculated by the DFT B3LYP approximation at the 631G* level. Space filling model are shown on the top with space filling electrostatic potential molecular surfaces at the bottom, with blue as a positive potential and red as a negative potential, and the color was set in the same scale. B) Comparison of dipole moments. Ab initio calculated electrostatic potential maps for the pyridine, pyrimidine and pyridazine units of DB766, DB1831 and DB1937, respectively. These units are shown on the left with their dipole moments. The electrostatic potential maps are shown in the center, and the magnitudes of the dipoles are displayed on the right.
DB613 (Figure 1) has the same central phenyl-furan-phenyl rings but with a terminal phenyl substituted AIA groups instead of the pyridine in DB667. The dihedral angles between the AIA and the terminal phenyl or pyridinyl planes are 37° and 4° in DB613 and DB667, respectively. The modeling results suggest that the close planarity of the terminal pyridinyl groups and amidine group, in DB667, could be due to their ability to form amidine group-pyridine hydrogen bonds. Meanwhile in DB613, rotation of terminal phenyl rings into the AIA plane is more hindered by van der Waals repulsion between the hydrogen atoms and a H-bond is not possible.
Molecular electrostatic potential maps (MEP) illustrate the charge distributions of molecules, helps to understand the relative polarity of a molecule and serves as a useful quantity to evaluate structure-activity relationships. The maps clearly show a significantly different distribution of MEPs for the compounds (Figure 8A). As expected, the negative potential is stronger on oxygens in the compounds, while the positive potential is stronger on the amidine group -NH groups. The inner face of the molecules, which faces the floor of the minor groove, has positive character. The opposite face, which faces the solvent, is relatively more negatively charged. This is favorable for AIAs to form hydrogen bonds and electrostatic interactions with bases at the floor of the DNA minor groove at AT sequences. With large -O-alkyl groups on the inner phenyl rings, such as with DB1890, the negative potential is predicted to be partially shifted from the furan ring, to the alkyl substituents.
Molecular docking studies can provide ideas for binding affinity variations across a set of derivatives such as the AIAs and are particularly powerful if guided by X-ray structural results such as those with DB1880. The results obtained from molecular docking indicate that DB667 binds as a monomer in the centre of the minor groove of the d(CGCGAATTCGCG)2 duplex (Figure 9A) and covers almost six base pairs. This orientation fits snugly to the DNA minor groove and the inner-facing amidinium nitrogen atoms are involved in hydrogen bonding to the cytosine and thymine O2 groups. Docking of DB709 into the same DNA sequence gave similar results. As the alkyl substituent increases in size, the substituted compound does not properly fit into the minor groove for optimum binding. Steric hindrance and unfavorable electrostatic contacts of the substituents with the minor groove limit binding. A docking result for DB1890, for example, is shown in Figure 9B. The phenylfuran core is pushed away from the floor of the groove compared to DB667 and all interactions with the DNA site are weakened. Overlay views of DB667 and DB1890, which were extracted from overlays of their DNA complexes followed by the deletion of DNA, are shown in Figure 9C. The less than optimum binding position of DB1890 pushed out and down the groove, can be seen in this comparison.
Figure 9.
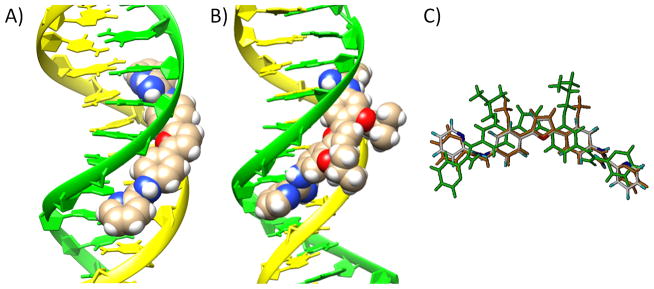
Molecular docking. Models of complexes of DB667 A) and DB1890 B) with the DNA duplex dodecamer sequence d(CGCGAATTCGCG)2 using the X-ray crystal structure of 3OIE as a guide. C) Overlay of the structures for DB667, DB709 and DB1890 docked into the same DNA sequence. DB667 is displayed by atom type color; DB1890 is green; DB709 is orange.
Variations in the terminal six membered rings: Scaffold B
Addition of a nitrogen atom to the terminal pyridine of DB766 gives Scaffold B compounds which show electrostatic potential maps that are sensitive to the N position (Figure 8A). For DB1831 (pyrimidine as R, Table 1), the dihedral angle between the amidine groups and the terminal pyrimidinyl plane is 0°, compared to 4–6° in the other three compounds. This difference is perhaps due to the ability to form two amidine-pyrimidinyl hydrogen bonds and to the elimination of repulsive CH van der Waals interactions with the amidine group in DB1831. The electrostatic potential molecular surfaces of the central aromatic system on DB766, DB1831, DB1855 (pyrazine as R, Table 1), and DB1937 (pyridizine as R, Table 1) are similar; however the MEP map clearly shows a significantly different distribution on the terminal six member rings. In DB1855 and DB1937, the significantly negative potential centralizes on the terminal pyrazinyl or pyridizinyl nitrogen atoms, while the electrostatic potential of the nitrogen atoms of the pyridinyl and pyrimidinyl systems in DB766 and DB1831 are more evenly spread. This quite polar molecular region in DB1855 and DB1937 attracts the bonding electrons more strongly and provides a greater attractive force for the aqueous proton. In an aqueous environment, all four compounds have bound water molecules around them and some of these water molecules need to be released in order to bind to DNA. Since the pyridizinyl group in DB1937 would attract bound water molecules more tightly than DB766 and DB1831, it requires more energy to release the same amount of water molecules to target DNA and this could be a factor in explaining the different binding affinities. A contribution from a pK effect is also possible and may reflect a partial lack of protonation of the amidine groups under the test conditions, which would greatly affect the DNA binding affinity.
In order to better understand the energy contributions, it is important to compare the ab initio calculated MEP for the terminal heterocyclic units (Figure 8B). The pyridizine ring in DB1937 possesses a high dipole moment (4.47 D), which is attributed to the fact that the two nitrogen atoms are located on the same side of the ring. Therefore, there is a greater pull of electrons to that side resulting in a high dipole moment. The dipole moment of pyrazine is 0 since it is symmetrical about the line passing two nitrogen atoms. The higher magnitude of dipole moment for pyridizine, compared to pyridine (2.36 D) and pyrimidine (2.46 D), suggests a possible contribution toward the lower observed binding affinity of DB1937. Intermolecular attractions in pyridizine are stronger than in pyridine and pyrimidine, which are attributed to electrostatic forces arising from the high permanent dipole.
Conclusions
It is useful to put the results on DNA binding of the AIA compounds reported here in context relative to other similar minor groove binding dications. The binding of the diphenylfuran diamidine, DB75 (Figure 1), which has the same central aromatic system as the AIAs in Table 1, to both the A5 and ATATA sequences has been extensively characterized.[23] This compound has an equilibrium constant of approximately 2 × 10⁷ M−1 with both DNAs. DB613 (Figure 1), which has the same central diphenylfuran but with a phenyl substituted AIA group instead of the pyridine in DB667 (Figure 1), has been evaluated with the same DNA sequences and has a similar K as DB75 for A5 but a 4–5 times lower K with ATATA (Table 2). DB667 has slightly lower K values than DB613 with both DNAs. Interestingly, most amidine and AIA derivatives bind more poorly to the ATATA sequence than to A5 and it is actually DB75 that is unusual for its similar binding to the two DNAs. The weaker binding to ATATA in general can be explained by the wider minor groove with that sequence relative to A5.[7,23] Molecular modeling with an AATT sequence that has been crystalized with both amidines and AIAs shows that DB613 and DB667 can be inserted into the minor groove in much the same manner as DB75 in the AATT site. (Figure 9)
Replacement of the central phenyl hydrogen atom in DB667 by larger groups decreases the ΔTm values and increases the amount of compound required to displace DAPI from the minor groove (Table 1). Adding -OCH3, in an otherwise equivalent compound (DB709), gives a reduction in ΔTm of 6–7 °C and substitution with -O-isopropyl (DB766) causes another 6–7 °C decrease. Larger -OR substituents have ΔTm values that approach 0 °C (Table 1). Molecular modeling and docking of these compounds in the minor groove provides a clear rationale for the decrease in Tm with the large substituents (Figure 9). The large substituents are significantly out of the conjugated phenyl-furan ring plane, and as shown in Figure 9, they prevent the attached compounds from penetrating as deeply into the groove as with compounds that have smaller substituents. This weakens H-bond interactions with the base edges at the floor of the groove and van der Waals contacts to the walls of the groove in the complex.
Several compounds were prepared with an additional N in different positions of the terminal pyridyl of DB766. The pyrimidine, DB1831, has essentially the same ΔTm as DB766 but the other two compounds with two Ns have substantially reduced ΔTm values. Modeling of the compounds again provides suggestions as to why the selective decrease in Tm occurs. As can be seen in Figure 8B, the electron density of the pyrimidine in DB1831 is more evenly spread than in the pyridazine and it has a lower dipole moment. If the nitrogens of the pyridazine in DB1937 face into the AT minor groove, this quite polar molecular region will be dehydrated and will have no possible H-bond donors. If the group faces out, the negative potential regions will be near the anionic backbone of the DNA, another unfavorable binding orientation.
DB1876 and DB1880 are unique in the AIA compound set. The piperidine substituent is relatively larger, at least comparable to the cyclopentyl on DB1852, but DB1880 and DB1876 have the highest binding constants of the compounds in Table 1. The two additional charges on DB1880 and DB1876 certainly help binding but this is mitigated to a certain extent by the 0.1M added NaCl in the experiments. In the crystal structure of DB1880-DNA complex, both piperidine groups extend outwards from the groove so that the charged piperidine –NH atoms are relatively close to DNA phosphate groups and this interaction certainly is favorable for binding. But neither piperidyl group directly hydrogen bonds to the DNA. The very hydrophobic -O-cyclopentyl DB1852 clearly does not favorably interact with the minor groove in a similar location.
In summary, the AIAs form 1:1 complexes in AT sequences of 4–6 base pairs and bind with affinities that strongly depend on substituent size, charge and polarity.
Experimental Section
Compounds, DNAs, and Buffers
Syntheses of the compounds of Table 1: Syntheses of DB667, DB709, DB745 and DB766 have been published;[29,45] syntheses of compounds DB1831, DB1855 and DB1937 will be published elsewhere; and all other AIAs are described below. All synthetic compounds were characterized by 1H and 13C NMR and elemental analysis (C,H,N within ±0.4%). Poly(dA)·poly(dT) obtained from Pharmacia Co. was used for Tm experiments. In circular dichroism (CD) and fluorescence experiments, the hairpin DNA oligomers A5 [5′-GCCAAAAAGCTCTCGCTTTTTGGC-3′] and ATATA [5′-GCCATATAGCTCTCGCTATATGGC-3′] with the hairpin loop sequences underlined were used (DNA sequences shown in Figure 1). In SPR experiments the same hairpin DNA oligomers but 5′-labeled with biotin were used. The cacodylic acid buffer (CAC) used in Tm, CD and fluorescence experiments contained 0.01 M cacodylic acid, 0.1 M NaCl, 0.001 M EDTA adjusted to pH 6.25. The SPR experiments were conducted in filtered, degassed CAC buffer with 0.005% P20 surfactant. All the DNA oligomers were purchased from Integrated DNA Technologies, Inc. (IDT, Coraville, IA) with reverse-phased HPLC purification and mass spectrometry characterization.
Preparation of AIAs
The synthetic route of the new compounds in this paper is shown in Scheme 1. Experimental details and characterization data for all the compounds and intermediates may be found in the supplemental material. Starting from 2-bromo-5-nitrophenol, the preparation of 1-bromo-2-alkoxy-4-nitrobenzene 1a-d was achieved either by reacting with alkyl iodide or with tert-butyl 4-hydroxypiperidine-1-carboxylate. In case of compound 1e, the bis-Boc-protecting groups of 1d were first removed by using trifluoroacetic acid in dichloromethane and then reacted with 2-iodopropane. Stille coupling reaction of 1a–e and 2,5-bis(trimethylstannyl)furan in the presence of Pd(PPh3)4 in dioxane gave the corresponding 2,5-bis(2-alkoxy-4-nitrophenyl)furans 2a–e. Reduction of 2a–e was then achieved by catalytic hydrogenation and gave the desired diamino compounds 3a–e. The target AIA salts DB1890, DB1950, DB1852, DB1880 and DB1876 (4a–e) were prepared in a two-step process. First, the free base was obtained by reaction of 3a–e with a hydrobromide salt of napthalen-2-ylmethyl pyridine-2-carbimidothioate in ethanol/acetonitrile. The free bases were subsequently reacted with anhydrous ethanolic HCl to give the AIA salts in good overall yield. In the case of 4d (DB1880), Boc-deprotection was accomplished in the process of the AIA hydrochloride salt formation.
Scheme 1.

Synthesis of the select AIAs. Reagents and reaction conditions: a) RI, t-BuOK, THF, DMF; b) 1): 4-hydroxypiperidine, (Boc)2O, Et3N, CH2Cl2; 2): DEAD/PPh3, THF; c) 1): 20 mol% CF3COOH, CH2Cl2; 2): 2-iodopropane, K2CO3, DMF; d) 2,5-bis(trimethylstannyl)-furan, Pd(PPh3)4, dioxane; e) 10% Pd/C, H2, 50 psi, EtOAc-EtOH (9:1); f) 1): MeCN, EtOH, rt, 24 h; 2): Ethanolic HCl.
Thermal Melting (Tm)
Tm experiments were conducted with a Cary 300 Bio UV-visible spectrophotometer (Varian Inc.) with the software supplied with the instrument. A thermistor fixed into a reference cuvette was used to monitor the temperature with a computer-controlled heating rate of 0.5 °C/min. The oligomers were added to 1 mL of CAC buffer in 1 cm path length reduced volume quartz cells and DNA without compound was used as a control. The concentration of the DNA solutions was determined by measuring the absorbance at 260 nm. Experiments were generally conducted at a concentration of 2 × 10⁻⁵ M base pair for poly(dA)·poly(dT). For experiments with complexes at the ratio of 0.3 compounds per base pair was generally used.
Fluorescence
All experiments were conducted with a Cary Eclipse Fluorimeter (Varian Cary Eclipse, Walnut Creek, CA). Before conducting the fluorescence displacement titration for DNA-AIA complexes it was important to find the required fluorophore (DAPI/DB829, in Figure 1) concentration in each experiment so that addition of the added compounds would cause displacement of the fluorophore that was used. A DNA (50 μM stock solution) was titrated into the cell containing fluorophore with 0.05 μM increments and scans were recorded. A steady change in fluorescent intensity was observed until saturation at 0.8 μM A5 with 0.5 μM DAPI, and 2.2 μM A5 with 0.5 μM DB829. These fluorophore concentrations were then used in each fluorescence displacement experiment.
In the fluorescence displacement assay the DNA-fluorophore complexes were titrated with each compound under study by 0.5 μL of increment (0.5 μM compound stock solutions). The excitation wavelength was set to be 342 nm for DAPI and 363 nm for DB829. In the case of DAPI a 2.5 nm (excitation and emission) slit width was chosen and a 5.0 nm width for DB829. The fluorescence intensity at the maximum peaks was recorded for each scan. In order to compare the two assays, they were plotted as ratio values:
| [1a] |
| [1b] |
where F is the observed fluorescence at each point, Fmin or Fmax are the minimum and maximum intensity units in each titration, and each titration starts at a ratio of 1.0.
Circular dichroism spectroscopy (CD)
CD spectra were obtained on a computer controlled Jasco J-710 spectrometer in 1-cm quartz cells. Typically, a DNA hairpin buffered solution at a 3 μM strand concentration was prepared and the CD spectrum was collected from 480 to 230 nm at the rate of 50 μM/min at 25 ºC. The reported spectra are an average of at least 5 scans. To obtain the stoichiometry of each complex, a DNA solution was titrated with a compound solution, and the induced CD (ICD) of the bound compound was followed at the maximum wavelength.
Biosensor Surface Plasmon Resonance (SPR)
SPR measurements were performed with a four-channel Biacore 2000 optical biosensor system (Biacore, GE Healthcare, Inc.). The 5′-biotin-labeled DNA sequences (A5 and ATATA hairpins, in Figure 1) were immobilized onto streptavidin-coated sensor chips (Biacore SA) as previously described.[34,35] Three flow cells were used to immobilize the DNA oligomer samples, while a fourth cell was left blank as a control. The SPR experiments were performed at 25 ºC in filtered, degassed CAC buffer. Steady state binding analysis was performed with multiple injections of different compound concentrations over the immobilized DNA surface at a flow rate of 25 μL/min and 25 ºC. Solutions of known AIA concentrations were injected through the flow cells until a constant steady-state response was obtained. Compound solution flow was then replaced by buffer flow resulting in dissociation of the complex. The reference response from the blank cell was subtracted from the response in each cell containing DNA to give a signal (RU, response units) that is directly proportional to the amount of bound compound. The predicted maximum response per bound compound in the steady-state region (RUmax) was determined from the DNA molecular weight, the amount of DNA on the flow cell, the compound molecular weight, and the refractive index gradient ratio of the compound and DNA, as previously described.[36,37] The number of binding sites and the equilibrium constant were obtained from fitting plots of RU versus Cfree. Binding results from the SPR experiments were fit with either a single site model (K2 = 0) or with a two site model:
| (2) |
where r represents the moles of bound compound per mole of DNA hairpin duplex, K1 and K2 are macroscopic binding constants, and Cfree is the free compound concentration in equilibrium with the complex.
Purification and Radiolabeling of DNA Restriction Fragments and DNase I Footprinting
DNase I footprinting experiments were performed essentially as described previously.[34,35] Complementary 5′-end phosphorylated oligonucleotides containing AAAAA (A5) and ATATA sites (underlined) 5′-CGGTACCAGATCTTCTAGGAAAAACG GCTCGATATAGCAGGCTGGATCCCG and 5′-GATCCGGGATCCAGCCTGCTATATCGAGCCGTTTTTCCTAGAAGATCTGGTACCGACT were synthesized by Eurogentec (Belgium) and hybridized by heating the mixture at 95°C for 5 min followed by a slow temperature decrease until room temperature. The double-stranded DNA was then sub-cloned in pUC19 previously opened at SacI and BamHI sites. The 81 bp DNA fragment encompassing this sub-cloned sequence was obtained from EcoRI and PstI double digestion of this new pUC19-ATATA vector and 3′-end labeled using α-[32P]-dATP (3000 Ci/mmol each, PerkinElmer, France) and 10 units of Klenow enzyme (BioLabs, France) for 30 min at 37°C separated and isolated from the plasmid remnant using a 6 % native polyacrylamide gel as previously described.[38] Increasing concentrations (as indicated in the legend of figures) of the various tested compounds were incubated 15 min at 37°C with the radio-labeled DNA fragments prior to DNase I digestion (0.001 unit/mL, Sigma, France) for 3 min in digestion buffer (20 mM NaCl, 2 mM MgCl2, 2 mM MnCl2, pH 7.3), stopped by freeze-drying and lyophilization. The cleaved DNA fragments were dissolved in 4 μL of formamide-containing denaturing loading buffer, heat-denatured for 4 min at 90°C and rapid chilling on ice prior to electrophoresis on a denaturing 8% polyacrylamide gel. The gels were then soaked in 10% acetic acid, transferred to Whatman 3 MM paper and dried under vacuum at 80°C. Dried gels were exposed overnight on storage screens and scans using a Molecular Dynamics STORM 860. Quantification of the cleaved bands were performed using Image Quant 4.1 software.
X-ray Crystallography
The oligonucleotide sequence, d(CGCGAA TTCGCG)2, was purchased from DNA Technology A/S (Denmark) and DB1880 was used as the hydrochloride salt without any further purification. The final double-stranded DNA stock solution was 3.0 mM through annealing (6.0 mM in single-stranded DNA in 20 mM sodium cacodylate at pH 6.5) by heating to 85 °C for 15 min and then cooling to room temperature overnight. DNA complex crystals were grown by the hanging drop vapor diffusion method. A successful crystallization experiment typically comprised 1 μL of 1.5 mM annealed double-stranded DNA with 2.25 mM ligand DB1880, mixed with 1 mL reagent solution, composed of 7 % MPD, 140 mM MgCl2 and 20 mM sodium cacodylate (pH 6.5). The hanging drop was equilibrated against a well containing 50 % MPD. Crystals grew in one week at 10 °C. A dataset was collected at 105 K on a single flash-frozen crystal, on an Oxford Diffraction Xcalibur NovaT X-ray diffractometer. The data were processed and scaled using CrysalisPro (Oxford Diffraction) and Scala (from the CCP4 suite).
The structure was solved by molecular replacement using the REFMAC 5.5.0109 program (CCP4), using the DB819-d(CGCGAATTCGCG)2 complex structure (PDB 2B3E)[46] as a model, and refined using REFMAC 5.5.0109. Data collection and refinement statistics are shown in Table 3. The DB1880 ligand and Mg2+ ion could be clearly seen in the initial 3A-weighted 2Fo–Fc electron density maps. The final model (including solvent molecules) was refined using data between 22.66 and 1.90 Å, with final R and Rfree values of 0.163 and 0.240 respectively.
Table 3.
Data collection and refinement statistics for the DB1880-d(CGCGAATTCGCG)2 complex crystal structure
| Data collection | |
| Sequence | d(CGCGAATTCGCG)2 |
| Space group | P212121 |
| Unit cell dimensions | |
| a, b, c (Å) | 24.11, 38.42, 66.21 |
| Resolution (Å) | 66.19 – 1.71 |
| Rint (%) overall | 3.04 |
| I/o′ | 37.88 |
| Completeness (%) | 74.10 |
| Redundancy | 1.9 |
| Refinement | |
| Resolution limits (Å) | 22.7 – 1.90 |
| No. of reflections | 4962 |
| Completeness (%) | 95.1 |
| Rwork/Rfree (%) | 16.3/24.0 |
| No. of atoms | 672 |
| No. of ions | 1 |
| No. of waters | 136 |
| Overall B-factor (Å2) | 21.8 |
| RMS deviations | |
| Bond-lengths (Å) | 0.01 |
| Bond-angles (°) | 1.2 |
| PDB ID | 3OIE |
Molecular structural comparisons of free compounds
Molecular modeling studies were initiated with conformational analysis of the tested compounds in Table 1 with a molecular mechanics MMFF approximation level with the Spartan’10 software package (Wavefunction Inc. Irvine, CA, USA). The Spartan 10 software package was employed to optimize the final geometry by using ab initio calculations with density functional theory (DFT), B3LYP at the 631G* approximation level. The molecular energy was calculated by employing the Hartree-Fock approximation also at the 631G* level. To evaluate their electrostatic and structural properties, molecular electrostatic potential (MEP) color-coded maps were generated in the range from 250 (deepest red) to 700 (deepest blue) kJ/mol and superimposed onto the molecular surface. The different values of the electrostatic potential at the surface are represented by different colors; red represents regions of most negative electrostatic potential, blue represents regions of most positive electrostatic potential and green represents regions of zero potential. The negative electrostatic potential corresponds to an attraction of the proton by the aggregate electron density in the molecule, while the positive electrostatic potential corresponds to the repulsion of the proton by the atomic nuclei.
Molecular docking
Molecular docking studies were performed with the SYBYL-X1.2 software package on a Windows 8 processor Workstation.[47] The Surflex-Dock module of the SYBYL software uses a surface shape-based method which aligns each test ligand to a ‘protomol’.[48–51] The protomol consists of a series of molecular fragments that characterize the surface properties of the target active site including steric effects, hydrogen bond acceptor groups and hydrogen bond donor groups.[48] The docking of the selected compounds (Table 1) into the DNA minor groove consisted of three steps: 1) preparation of the 3D structure of a DNA sequence and construction of protomol; 2) preparation of each compound, and 3) docking of each compound into the protomol.
To generate the protomol, the X-ray crystal structure of the DB1880-DNA complex was used (PDB 3OIE). The bound compound was extracted from the DNA crystal structure and was used as the ligand for protomol generation in the following Surflex-docking steps. After removing the crystallographic water molecules and metal ions and adding hydrogen atoms, the modified DNA sequences were minimized for a maximum of 100 iterations with a termination gradient of 0.01 kcal/(mol Å). The Surflex-dock module of the SYBYL software suite was then implemented and the protomol was generated using a ligand-based approach with the extracted AIA reference compound from the crystal structure. The two important factors that can affect the size and extent of the protomol generated are “proto_thresh” and “proto_bloat”. “Proto_thresh” determines how far the protomol extends into the target site, while “proto_bloat” impacts how far the protomol extends outside of the concavity.[47,50] For the purpose of these experiments, “proto_thresh” was set to 0.2 and “proto_bloat” was left at the default (0).
SYBYL-X1.2 software was then employed to construct the tested compounds in Table 1 in three-dimensional space. They underwent a short molecular dynamics (MD) simulation of 1 ns at a constant temperature and volume (NTV).[52] Briefly, (1) the system temperature was set at 300 K with a coupling constant of 100 fs, (2) Maxwell-Boltzmann distribution was employed for initial atom velocities, (3) the non-bonded pair list was updated every 25 fs, and (4) the duration of the molecular dynamics simulations in vacuo was 1 ns with a time step of 100 fs and a snapshot every 1000 fs. Snapshots from the MD simulation displayed several low energy structures. The low energy structures were then minimized to convergence using the Tripos force field with conjugate gradient algorithm, and Gasteiger–Hückel charges.[46] The termination gradient was 0.01 kcal/(mol Å) and the maximum iterations were 104. The Surflex-dock GeomX module of the SYBYL software suite was then implemented to dock each compound into the protomol. Each docking starts from six multiple initial poses to ensure good search coverage.
Supplementary Material
Acknowledgments
This work was supported by NIH grant AI064200 and by The Bill and Melinda Gates Foundation through a subcontract with the Consortium of Parasitic Drug Development (WDW and DWB), Cancer Research UK grant C129/A4489 (to SN) and the Fonds Européen de Développement Régional (FEDER, European Community) and the Région Nord-Pas de Calais, the Ligue Nationale Contre le Cancer (Comité du Nord, Septentrion), the Association Laurette Fugain and the Institut pour la Recherche sur le Cancer de Lille (IRCL) (to M.-H.D.-C.). R. N. thanks the IRCL for a post-doctoral fellowship.
Footnotes
Supporting information for this article is available on the WWW under http://www.chembiochem.org or from the author.
Contributor Information
W. David Wilson, Email: wdw@gsu.edu.
David W. Boykin, Email: dboykin@gsu.edu.
References
- 1.Coura JR, Viñas PA. Nature. 2010;465:S6–S7. doi: 10.1038/nature09221. [DOI] [PubMed] [Google Scholar]
- 2.Apt W. Drug Des Devel Ther. 2010;4:243–253. doi: 10.2147/dddt.s8338. [DOI] [PMC free article] [PubMed] [Google Scholar]
- 3.de Souza W. Microbes Infect. 2007;9:544–545. doi: 10.1016/j.micinf.2006.12.014. [DOI] [PubMed] [Google Scholar]
- 4.Schofield CJ, Jannin J, Salvatella R. Trends Parasitol. 2006;22:583–588. doi: 10.1016/j.pt.2006.09.011. [DOI] [PubMed] [Google Scholar]
- 5.Soeiro MN, Werbovetz K, Boykin DW, Wilson WD, Wang MZ, Hemphill A. Parasitology. 2013;140:925–951. doi: 10.1017/S0031182013000292. [DOI] [PMC free article] [PubMed] [Google Scholar]
- 6.Barrett MP, Boykin DW, Brun R, Tidwell RR. Br J Pharmacol. 2007;152:1151–1171. doi: 10.1038/sj.bjp.0707354. [DOI] [PMC free article] [PubMed] [Google Scholar]
- 7.Wilson WD, Nguyen B, Tanious FA, Mathis A, Hall JE, Stephens CE, Boykin DW. Curr Med Chem Anticancer Agents. 2005;5:389–408. doi: 10.2174/1568011054222319. [DOI] [PubMed] [Google Scholar]
- 8.Wilson WD, Tanious FA, Mathis A, Tevis D, Hall JE, Boykin DW. Biochimie. 2008;90:999–1014. doi: 10.1016/j.biochi.2008.02.017. [DOI] [PMC free article] [PubMed] [Google Scholar]
- 9.Motta MC. Curr Pharm Des. 2008;14:847–854. doi: 10.2174/138161208784041051. [DOI] [PubMed] [Google Scholar]
- 10.Mathis AM, Bridges AS, Ismail MA, Kumar A, Francesconi I, Anbazhagan M, Hu QY, Tanious FA, Wenzler T, Saulter J, Wilson WD, Brun R, Boykin DW, Tidewell RR, Hall JE. Antimicrob Agents Chemother. 2007;51:2801–2810. doi: 10.1128/AAC.00005-07. [DOI] [PMC free article] [PubMed] [Google Scholar]
- 11.Tevis DS, Kumar A, Stephens CE, Boykin DW, Wilson WD. Nucleic Acids Res. 2009;37:5550–5558. doi: 10.1093/nar/gkp558. [DOI] [PMC free article] [PubMed] [Google Scholar]
- 12.Shapiro TA, Englund PT. Proc Natl Acad Sci. 1990;87:950–954. doi: 10.1073/pnas.87.3.950. [DOI] [PMC free article] [PubMed] [Google Scholar]
- 13.Vázquez O, Sánchez MI, Martínez-Costas J, Vázquez ME, Mascareñas JL. Org Lett. 2010;12:216–219. doi: 10.1021/ol902501j. [DOI] [PubMed] [Google Scholar]
- 14.Sánchez MI, Vázquez O, Martínez-Costas J, Vázquez ME, Mascareñas JL. Chem Sci. 2012;3:2383–2387. [Google Scholar]
- 15.Wenzler T, Boykin DW, Ismail MA, Hall JE, Tidwell RR, Brun R. Antimicrob Agents Chemother. 2009;53:4185–4192. doi: 10.1128/AAC.00225-09. [DOI] [PMC free article] [PubMed] [Google Scholar]
- 16.Thuita JK, Wang MZ, Kagira JM, Denton CL, Paine MF, Mdachi RE, Murilla GA, Ching S, Boykin DW, Tidwell RR, Hall JE, Brun B. PLoS Negl Trop Dis. 2012;6:e1734. doi: 10.1371/journal.pntd.0001734. [DOI] [PMC free article] [PubMed] [Google Scholar]
- 17.Boykin DW, Kumar A, Hall JE, Bender BC, Tidwell RR. Bioorg Med Chem Lett. 1996;6:3017–3020. [Google Scholar]
- 18.Ansede JH, Anbazhagan M, Brun R, Easterbrook JD, Hall JE, Boykin DW. J Med Chem. 2004;47:4335–4338. doi: 10.1021/jm030604o. [DOI] [PubMed] [Google Scholar]
- 19.Tidwell RR, Boykin DW. DNA and RNA Binders. In: Demeunynck M, Bailly C, Wilson WD, editors. From Small Molecules to Drugs. Vol. 2. Wiley-VCH; Weinheim: 2003. pp. 414–460. [Google Scholar]
- 20.Paine MF, Wang MZ, Generaux CN, Boykin DW, Wilson WD, De Koning HP, Olson CA, Pohlig G, Burri C, Brun R, Murilla GA, Thuita JK, Barrett MP, Tidwell RR. Curr Opin Investig Drugs. 2010;11:876–883. [PubMed] [Google Scholar]
- 21.Mayence A, Eynde JJ, Krogstad FM, Krogstad DJ, Cushion MT, Huang TL. J Med Chem. 2004;47:2700–2705. doi: 10.1021/jm030545e. [DOI] [PubMed] [Google Scholar]
- 22.Denise H, Barrett MP. Biochem Pharmacol. 2001;61:1–5. doi: 10.1016/s0006-2952(00)00477-9. [DOI] [PubMed] [Google Scholar]
- 23.Hunt RA, Munde M, Kumar A, Ismail MA, Farahat AA, Arafa RK, Say M, Batista-parra A, Tevis DS, Boykin DW, Wilson WD. Nucleic Acids Res. 2011;39:4265–4274. doi: 10.1093/nar/gkq1362. [DOI] [PMC free article] [PubMed] [Google Scholar]
- 24.Rettig M, Germann MW, Wang S, Wilson WD. Chembiochem. 2013;14:323–331. doi: 10.1002/cbic.201200706. [DOI] [PMC free article] [PubMed] [Google Scholar]
- 25.Carter NS, Berger BJ, Fairlamb AH. J Biol Chem. 1995;270:28153–28157. doi: 10.1074/jbc.270.47.28153. [DOI] [PubMed] [Google Scholar]
- 26.Soeiro MNC, Werbovetz K, Boykin DW, Wilson WD, Wang MZ, Hemphill A. Parasitology. 2013;140:929–951. doi: 10.1017/S0031182013000292. [DOI] [PMC free article] [PubMed] [Google Scholar]
- 27.Stephens CE, Brun R, Salem MM, Werbovetz KA, Tanious F, Wilson WD, Boykin DW. Bioorg Med Chem Lett. 2003;13:2065–2069. doi: 10.1016/s0960-894x(03)00319-6. [DOI] [PubMed] [Google Scholar]
- 28.Silva CF, Batista MM, Mota RA, de Souza EM, Stephens CE, Som P, Boykin DW, Soeiro N. Biochem Pharmacol. 2007;73:1939–1946. doi: 10.1016/j.bcp.2007.03.020. [DOI] [PubMed] [Google Scholar]
- 29.Wang MZ, Zhu XH, Srivastava A, Liu Q, Sweat JM, Pandharkar T, Stephens CE, Riccio E, Parman T, Munde M, Mandal S, Madhubala R, Tidwell RR, Wilson WD, Boykin DW, Hall JE, Kile DE, Werbovetz KA. Antimicrob Agents Chemother. 2010;54:2507–2516. doi: 10.1128/AAC.00250-10. [DOI] [PMC free article] [PubMed] [Google Scholar]
- 30.Silva CF, Meuser MB, De Souza EM, Meirelles MN, Stephens CEL, Som P, Boykin DW, de Soeiro NM. Antimicrob Agents Chemother. 2007;51:3803–3809. doi: 10.1128/AAC.00047-07. [DOI] [PMC free article] [PubMed] [Google Scholar]
- 31.Zhu XH, Liu Q, Yang SH, Parman TF, Green CE, Mirsalis JC, de Nazaré Correia Soeiro M, Mello de Souza E, da Silva CF, da Gama Jaen Batista D, Stephens CE, Banerjee M, Farahat AA, Munde M, Wilson WD, Boykin DW, Wang MZ, Werbovetz KA. Antimicrob Agents Chemother. 2012;56:3690–3699. doi: 10.1128/AAC.06404-11. [DOI] [PMC free article] [PubMed] [Google Scholar]
- 32.Wilson WD, Tanious FA, Fernandez-Saiz M, Rigl CT. Methods Mol Biol. 1997;90:219–240. doi: 10.1385/0-89603-447-X:219. [DOI] [PubMed] [Google Scholar]
- 33.Wilson WD, Mizan S, Tanious FA, Yao S, Zon G. J Mol Recognit. 1994;7:89–98. doi: 10.1002/jmr.300070206. [DOI] [PubMed] [Google Scholar]
- 34.Nguyen B, Tanious FA, Wilson WD. Methods. 2007;42:150–161. doi: 10.1016/j.ymeth.2006.09.009. [DOI] [PubMed] [Google Scholar]
- 35.Liu Y, Wilson WD. Methods Mol Biol. 2012;613:1–23. doi: 10.1007/978-1-60327-418-0_1. [DOI] [PMC free article] [PubMed] [Google Scholar]
- 36.Nanjunda R, Munde M, Liu Y, Wilson WD. In: Methods for Studying DNA/Drug Interactions. Wanunu M, Tor Y, editors. Chapter 4 CRC Press-Taylor & Francis Group; Boca Raton, FL: 2011. [Google Scholar]
- 37.Davis TM, Wilson WD. Methods Enzymol. 2001;340:22–51. doi: 10.1016/s0076-6879(01)40416-2. [DOI] [PubMed] [Google Scholar]
- 38.Peixoto P, Liu Y, Depauw S, Hildebrand MP, Boykin DW, Bailly C, Wilson WD, David-Cordonnier MH. Nucleic Acids Res. 2008;36:3341–3353. doi: 10.1093/nar/gkn208. [DOI] [PMC free article] [PubMed] [Google Scholar]
- 39.Liu Y, Kumar A, Depauw S, Nhili R, David-Cordonnier MH, Lee MP, Ismail MA, Farahat AA, Say M, Chackal-Catoen S, Batista-Parra A, Neidle S, Boykin DW, Wilson WD. J Am Chem Soc. 2011;133:10171–10183. doi: 10.1021/ja202006u. [DOI] [PMC free article] [PubMed] [Google Scholar]
- 40.Brown DG, Sanderson MR, Skelly JV, Jenkins TC, Brown T, Garman E, Stuart D, Neidle S. EMBO J. 1990;9:1329–1334. doi: 10.1002/j.1460-2075.1990.tb08242.x. [DOI] [PMC free article] [PubMed] [Google Scholar]
- 41.Laughton CA, Tanious F, Nunn CM, Boykin DW, Wilson WD, Neidle S. Biochemistry. 1996;35:5655–5661. doi: 10.1021/bi952162r. [DOI] [PubMed] [Google Scholar]
- 42.Nguyen B, Neidle S, Wilson WD. Acc Chem Res. 2009;42:11–21. doi: 10.1021/ar800016q. [DOI] [PMC free article] [PubMed] [Google Scholar]
- 43.Neidle S. Nat Prod Rep. 2001;18:291–309. doi: 10.1039/a705982e. [DOI] [PubMed] [Google Scholar]
- 44.Wei D, Wilson WD, Neidle S. J Am Chem Soc. 2013;135:1369–1377. doi: 10.1021/ja308952y. [DOI] [PMC free article] [PubMed] [Google Scholar]
- 45.Stephens CE, Tanious F, Kim S, Wilson WD, Schell WA, Perfect JR, Franzblau SG, Boykin DW. J Med Chem. 2001;44:1741–1748. doi: 10.1021/jm000413a. [DOI] [PubMed] [Google Scholar]
- 46.Campbell NH, Evans DA, Lee MA, Parkinson GN, Neidle S. Bioorg Med Chem Lett. 2006;16:15–19. doi: 10.1016/j.bmcl.2005.10.036. [DOI] [PubMed] [Google Scholar]
- 47.SYBYL Molecular Modeling Software, Version X1.2. Tripos Inc; St. Louis, MO: 2010. [Google Scholar]
- 48.Jain AN. J Med Chem. 2003;46:499–511. doi: 10.1021/jm020406h. [DOI] [PubMed] [Google Scholar]
- 49.Jain AN. J Comput Aided Mol Des. 2007;21:281–306. doi: 10.1007/s10822-007-9114-2. [DOI] [PubMed] [Google Scholar]
- 50.Holt PA, Chaires JB, Trent JO. J Chem Inf Model. 2008;48:1602–1615. doi: 10.1021/ci800063v. [DOI] [PMC free article] [PubMed] [Google Scholar]
- 51.Dailey MM, Hait C, Holt PA, Maguire JM, Meier JB, Miller MC, Petraccone L, Trent JO. Exp Mol Pathol. 2009;86:141–150. doi: 10.1016/j.yexmp.2009.01.011. [DOI] [PMC free article] [PubMed] [Google Scholar]
- 52.Collar CJ, Zhu X, Werbovetz K, Boykin DW, Wilson WD. Bioorg Med Chem. 2011;19:4552–4561. doi: 10.1016/j.bmc.2011.06.026. [DOI] [PMC free article] [PubMed] [Google Scholar]
Associated Data
This section collects any data citations, data availability statements, or supplementary materials included in this article.


