

Abstract
Fascins, a family of actin-bundling proteins, are expressed in a spatially and temporally restricted manner during development and often in cancer. Fascin 1 has a clear role in cell migration in vitro, but its role in vivo in mammals is not well understood. Here, we investigate the role of fascin 1 in the melanocyte lineage and in melanoma cells. Fascin 1 knockout causes hypopigmentation in adult mice owing to migration and cell cycle progression defects in melanoblasts, the melanocyte precursor cell. Study of live embryo skin explants reveals that E14.5 fascin 1-null melanoblasts migrate slower, and generate fewer and thinner pseudopods. By contrast, fascin 1 expression drives faster migration and lamellipodia protrusion in melanocytes in vitro. In addition, fascin 1 depletion retards melanoblast proliferation in vivo and melanoma cell growth in vitro. These data indicate that fascin 1 not only promotes cell migration in mouse melanocytes but it also has a role in growth and cell cycle progression.
Keywords: Fascin 1 (Fscn1), Melanoblast, Migration, Mouse
INTRODUCTION
Fascins are actin-bundling proteins involved in cytoskeletal dynamics and regulated by protein kinase C (Adams, 1997; Adams and Schwartz, 2000; Aratyn et al., 2007). Fascin 1 is enriched in filopodia (Adams, 1997; Adams and Schwartz, 2000; Aratyn et al., 2007) and in invadopodia (Li et al., 2010; Schoumacher et al., 2010). The expression level and actin-bundling activity of fascin 1 positively correlate with the length, number and lifetime of filopodia (Vignjevic et al., 2006; Hashimoto et al., 2007; Yamakita et al., 2009), as well as two-dimensional cell migration (Yamashiro et al., 1998). In addition, fascin 1 stabilizes invadopodia and protrusive pseudopods of mesenchymal-type cancer cells (Li et al., 2010). Fascin 1 expression is time and tissue specific during embryogenesis (De Arcangelis et al., 2004), and a high level of fascin 1 is often found in various motile embryonic cells, such as macrophage-like plasmatocytes and border cells in Drosophila (Borghese et al., 2006; Zanet et al., 2009), and E10.5-12.5 hepatoblasts in rat (Hayashi et al., 2008).
Melanoblasts, which are melanocyte precursors, emigrate dorsolaterally from the neural tube after differentiating from neural crest cells. Mouse melanoblasts translocate from dermis to epidermis and accumulate at hair follicles before birth. Melanoblast differentiation, migration, proliferation and survival are crucial for early skin development and adult pigmentation (Baxter et al., 2004). Gene mutations or alterations causing melanoblast deficiencies often result in a ‘white-spot’ phenotype and several genes encoding growth factors and respective ligands (Jordan and Jackson, 2000; Harris et al., 2008), transcription factors (Hornyak et al., 2001), secreted metalloproteinases (Silver et al., 2008), Rac1 and the Rac1 GEF pREX-1 (Li et al., 2011; Lindsay et al., 2011) affect melanoblast migration and survival (see also http://www.espcr.org/micemut/).
Here, we demonstrate that mice lacking fascin 1 (Yamakita et al., 2009) have pigmentation defects that result from melanoblast migration defects and delayed cell cycle progression. We validated these results in human melanoma cultured cells. Our studies suggest that fascin 1 is transiently upregulated when melanoblasts are migratory and proliferative during mouse embryogenesis, and that some melanoma cells may also depend on fascin for enhanced motility and normal cell cycle progression.
MATERIALS AND METHODS
Transgenic mice
All experiments were performed according to UK Home Office regulations. Fascin 1-/- mice in C57BL/6 background have been previously described (Yamakita et al., 2009). Z/EG (lacZ/EGFP) mice (Novak et al., 2000) and DCT (dopachrome tautomerase)::lacZ mice (Mackenzie et al., 1997; Pla et al., 2004; Takemoto et al., 2006) have been previously described. Tyrosinase Cre (Tyr::Cre) mice have been previously described (Delmas et al., 2003). Mouse genotyping was performed by the company Transnetyx (Memphis, TN, USA).
Retroviral constructs
Stable cell lines expressing GFP-tagged human fascin 1 were generated by retroviral infection using the modified Retro-X retroviral expression system (Clontech Laboratories). A HindIII restriction site, followed by a Kozak consensus translation initiation site was introduced to the 5′ end of the coding sequence of GFP-fascin 1 (Li et al., 2010) by PCR (5′-AGAAAGCTTATGGTGAGCAAGGGCGAGGAGCTGTTC-3′). In the same reaction, a ClaI restriction site was introduced to the 3′ end (5′-AGAATCGATACTAGTACTCCCAGAGCGAGGCGGGGTC-3′). The HindIII-ClaI DNA fragments containing human fascin 1 were subcloned into HindIII and ClaI sites of the pLHCX retroviral expression vector. High-titre, replication-incompetent retroviral particles encoding the RNA of interest were produced in the Phoenix Eco packaging line (Orbigen, San Diego, CA, USA) for murine melanocytes. Subsequent infection of target lines resulted in transfer of the coding region of interest, along with a selectable marker. Pooled cell lines stably expressing the construct of interest were isolated by selection with hygromycin-B (500 μg/ml) over multiple passages. Control lines were infected with retroviral particles expressing an empty pLHCX control vector transcript, and subjected to an identical selection procedure. Expression of the ectopically introduced proteins of interest was determined by western blot with protein-specific primary antibodies.
β-Galactosidase assay
Timed embryos were dissected in ice-old PBS and fixed in ice-cold 0.25% glutaraldehyde in PBS for 40 minutes. After 10 minutes of washing in ice-cold PBS, embryos were immersed in permeabilization solution (2 mM MgCl2, 0.01% sodium deoxycholate and 0.02% NP-40 in PBS) for 30 minutes at room temperature and stained with X-gal staining solution [2 mM MgCl2, 0.01% sodium deoxycholate, 0.02% NP-40, 5 mM K4Fe(CN)6, 5 mM K3Fe(CN)6 and 1 mg/ml X-gal (Invitrogen, Carlsbad, CA, USA) in PBS (pH 7.4)] as described previously (Loughna and Henderson, 2007) for 48 hours at 4°C. Embryos were maintained in 10% formalin after washes with PBS. The pictures of the forelimbs, trunks and entire embryos were taken at the same magnification for embryos at the same developmental stage under Zeiss Stemi-2000 dissection microscope (EOS utility, Edmund Optics, NJ, USA). For the quantitation of the melanoblasts in the trunks, an area of 1000×500 pixels2 was cropped and gridded with an area per point of 20,000 pixels2 (Image J). For melanoblast quantification in the forelimb, an area of 1100×450 pixels2 was cropped to cover most forelimb skin and gridded with an area per point of 15,000 pixels2. Cell number in sub-areas was counted for E13.5 and E15.5 compared between wild-type, fascin 1-/+ and fascin 1-/- embryos.
Immunohistochemistry (IHC) and immunofluorescence (IF)
Formalin-fixed, paraffin wax-embedded embryos or skin samples were transversely sectioned and de-waxed, rehydrated in xylene and decreasing concentrations of ethanol. Antigen-retrieval process was performed as follows: sections immersed in citrate buffer (pH 6; Lab Vision, Fremont, CA, USA) in a boiling water bath were microwaved for 10 minutes at 600 W and then cooled at room temperature for 20 minutes. The samples were blocked with 5% normal donkey serum (NDS) in PBS and stained sequentially with primary antibodies in PBS containing 5% NDS overnight at 4°C and secondary antibodies in PBS containing 5% NDS for 1 hour at room temperature. The following primary antibodies were used: goat anti-TRP2 antibody (DCT) (D-18, 1:200, Santa Cruz) combined with rabbit anti-cleaved caspase 3 (Asp175) (5A1E, 1:100, NEB) or rabbit anti-phospho-histone H3 (ser10) (1:100, Cell Signaling), mouse anti-BrdU (5-bromo-2′-deoxyuridine) antibody (1:100, DAKO), rabbit anti-cyclin D1 antibody (EP12, 1:100, DAKO) and rabbit anti-fascin 1 (1:100, Sigma-Aldrich). The secondary antibodies (1:500, Invitrogen) were used as follows: Alexa 594-conjugated donkey anti-rabbit or mouse, Alexa 488-conjugated donkey anti-goat. Prolong Gold antifade reagent with DAPI (Invitrogen) was used to counter-stain and mount. For DCT immunohistochemistry stains, the sections were blocked in TBS-T (tris-buffered saline and Tween 20) containing 5% rabbit serum and sequentially incubated with goat anti-TRP2 antibody (DCT) and rabbit anti-goat biotinylated secondary antibody followed with Vectastain ABC-AP kit (Vector Laboratories) and vector red alkaline phosphatase substrate kit (Vector Laboratories). Haematoxylin was used to counterstain. TUNEL assay was performed with in situ cell death detection kit (Fluorescein, Roche), as suggested by the manufacturer’s manual and Alexa 555-conjugated donkey anti-goat was used as secondary antibody to target goat anti-TRP2 antibody (DCT).
Cell cycle distribution
Human melanoma cell line MV3 in six-well plates was transfected with siRNAs (100 nM, sifascin1-1: on-target plus siRNA fascin1 oligo3 from Thermo Scientific or sifascin1-2: Hs-FSCN1 2HP siRNA from Qiagen) with Hiperfect transfection reagent (Qiagen) twice on two sequential days. Cells were re-seeded and the experiments were performed 48 hours post-transfection. Asynchronously growing cells were collected after 1 hour BrdU pulse (20 μM) to measure cell in S phase or challenged with 100 ng/ml nocodazole in presence of cumulative BrdU for 2 hours, 4 hours, 6 hours, 8 hours, 10 hours and 12 hours. This is a modified method of the nocodazole trapping experiment used previously (Gillespie and Walker, 2006). For BrdU/PI analysis, cells were treated with 2 N HCl (room temperature, 15 minutes) prior to 1 hour primary antibody incubation with mouse anti-BrdU antibody (1:40, DAKO). After washing with PBT, cells were then incubated in PBT with Alexa 488-conjugated anti-mouse antibody (1:60; Invitrogen) and resuspended in PBS with 250 μg/ml RNAseA and 10 μg/ml propidium iodide for 30 minutes prior to FACS analysis on BD FACScalibur using CellQuest software (BD). The results were analysed and plotted with FlowJo (Tree Star).
3D cell proliferation assay
3D cell proliferation assays were performed with Cultrex 3D culture collagen I cell proliferation kit (Trevigen, Gaithersburg, MD, USA) following the manufacturer’s instructions. Basically, 0.5 or 1×10⁴ knockdown cells in 100 μl cell culture medium supplemented with 2% collagen I were cultured on the top of the gel plug of 1 mg/ml collagen I in cell culture medium (pH 7) in 96-well plate for 96 hours and 8 μl of cell proliferation reagent were added to each well and incubated at 37°C in a CO2 incubator for 2 hours and the absorbance was read at 450 nm.
Melanoblast migration and pseudopod dynamics
Embryos (E14.5) were dissected from Tyr::Cre Z/EG WT, and fascin 1-/- female mice and skin in the trunk area of embryos was carefully removed under a Zeiss Stemi-2000 dissection microscope (Edmund Optics, NJ). Embryonic skins were immediately mounted and cultured in Greiner Lumox culture dish (Greiner Bio-One) as described previously (Mort et al., 2010; Li et al., 2011; Lindsay et al., 2011). Ex vivo time lapse images were captured on a Nikon A1R or Olympus FV1000 (20× objective, 1024×1024) for 4 hours with an interval of 5 minutes per frame in a 37°C humid chamber of 5% CO2. Cell tracks and speeds were determined with ImageJ manual tracking and chemotaxis tool plug-in. The criteria for pseudopod generation rate, long or short pseudopods and numbers were determined as reported previously (Li et al., 2011). Skin samples were fixed after image capture and detailed cell protrusion pictures were taken as a z-series on an Olympus FV1000 confocal microscope at 1 μm intervals (60× objective, 1024×1024). The diameter of a cross-section through the middle of a pseudopod is expressed as pixels measured with the straight-line tool (ImageJ).
Melanocyte migration and lamellipodial kymograph
Immortalized melanocytes from Tyr::CreERT2+/o Ink4a-/- Rac1f/f mice (M4) were established (Li et al., 2011) and stably expressed GFP-fascin 1 with pLHCX vector as above (M4F). Although these cells are immortal, because of the Ink4a loss, they are not transformed and do not form tumours in nude mice or form invadopodia in vitro (Li et al., 2011) (data not shown). Time-lapse images were captured on Nikon TE 2000 Timelapse microscope (20× objective) at 10-minute intervals for 4 hours. Cell speed was measured with ImageJ plug-in manual tracking and chemotaxis tool. For lamellipodial kymographs, 300 images were captured at 1-second intervals on Nikon TE 2000 Timelapse microscope systems with PFS (20× objective, ×1.5). Lamellipodial kymographs show pixel densities over time (x-axis) on a single pixel-wide straight line (y-axis) in the direction of lamellipodial protrusion (ImageJ plug-in multiple kymograph). Distance extended (d) was measured against lamellipodial persistence (p), defined as the amount of time that the cell spends persistently extending a lamellipod before pausing or entering a retraction phase. Speed of protrusion is shown as a broken line in Fig. 5C and represents the distance protruded (d) divided by the time of protrusion (p).
Fig. 5.

Fascin 1 overexpression increases melanocyte lamellipodium dynamics. (A) GFP fluorescence and transmitted light photo of M4F melanocytes indicate that fascin 1-enriched filopodia (white arrows) are interspersed in the lamellipodium. Scale bar: 5 μm. (B) Cell migration speed generated from three independent experiments. Data are generated from 98 M4 cells and 135 M4F cells. (C) Representative kymograph pictures of M4 (top) and M4F (bottom) showing M4F cells have higher rates of lamellipodia protrusions. Lamellipodial kymographs are analysed by drawing a one pixel wide line (white line in top right box) at a 90° angle across a lamellipodium in the direction of protrusion. Pixel densities along this pixel-wide line are recorded at 1-second intervals for a period of 300 seconds, resulting a time-space image. Scale bars for time and space are shown in the top image. Within the kymograph, a steeper slope of a protrusion corresponds to higher rates for lamellipodia protrusion. Distance extended (d) was measured against lamellipodial persistence (p), defined as the amount of time that the cell spends persistently extending a lamellipod before pausing or entering a retraction phase. Speed of protrusion is shown as a broken line and represents the distance protruded (d) divided by the time of protrusion (p). Frequency is measured by counting the number of lamellipodia per minute. (D) Frequency of lamellipodial protrusion events in M4 and M4F cells. (E-G) Speed (E), persistence (F) and distance (G) of individual lamellipodial protrusions. Data for M4 cells are from 273 protrusion events and for M4F cells from 144 protrusion events. In the box and whisker plots, horizontal line indicates median, box indicates interquartile range and whiskers indicate maximum value to minimum value. Mann-Whitney test; ***P<0.001; *P<0.05; n.s., not significant.
Western blotting
Trunk skin from E14.5 embryos or cells was removed and meshed in RIPA buffer with Halt protease inhibitor cocktail and phosphatase inhibitor cocktail (Thermo Scientific) and same amount of proteins (20 μg) were separated by 4-10% NuPAGE SDS-PAGE (Invitrogen) and transferred to PVDF membrane and probed with primary antibodies and respective species-specific horseradish peroxidase-conjugated secondary antibodies and detected with ECL chemiluminescence detection kits (Pierce). Primary antibodies are: rabbit anti-fascin 1 (Sigma-Aldrich), rabbit anti-phospho-AKT (Ser473) (Cell Signaling), rabbit anti-p44/42 MAPK (Erk1/2) (Cell Signaling), rabbit anti-phospho-p44/42 MAPK (Erk1/2) (Thr202/Tyr204) (Cell Signaling), rabbit anti-pY397FAK (Invitrogen) and rabbit anti-total FAK (Cell Signaling).
BrdU incorporation
Timed matings were set up and pregnant females were injected with 250 μl BrdU (10 mg/ml, BD Pharmingen) at E13.5. After 24 hours, mice were sacrificed and embryos were fixed for histology in 10% neutral-buffered formalin.
Eosin staining
X-gal-stained, formalin-fixed and paraffin-embedded fascin 1 DCT::lacZ embryos (E13.5) were transversely sectioned (10 μm depth). Eosin staining on the sections was performed in a standard fashion. Pictures were taken on Olympus BX51 FL microscope. DCT-positive cells in the epidermis and dermis (E13.5) were counted.
Statistical analysis
To test whether groups of large datasets (e.g. wild type versus -/-) come from a Gaussian distribution, the D’Agostino and Pearson omnibus normality test was performed. If the data failed to pass the normality test, a Mann-Whitney test was used to assess statistical significance. Otherwise, two-tailed, unpaired Student’s t-test was used to assess statistical significance (GraphPad Prism 5). To compare three groups of data (wild type, -/+ and -/-), Kruskal-Wallis one-way ANOVA test and Mann-Whitney test were used (GraphPad Prism 5). *P<0.05, **P<0.01 and ***P<0.001 are statistically significant. n.s. indicates not significant.
RESULTS
Fascin 1-null mice have melanocyte deficient patches
Fascin 1-null pups were weaned at less than Mendelian ratios (Yamakita et al., 2009), but otherwise were healthy and fertile. Fascin 1 was undetectable at the protein level in fascin 1-/- mice and reduced in fascin 1-/+ mice (Fig. 1A; supplementary material Fig. S1A). Fascin 1-/- mice in C57BL/6 background displayed a white patch near the midline of the abdomen, varying from a few white hairs or a thin white line (63% of 30 animals) to a big white patch (37% of 30 animals, Fig. 1B). White abdominal patches have been previously correlated with the absence of melanocytes (Baxter et al., 2004; Silver et al., 2008; Li et al., 2011; Lindsay et al., 2011) and suggest possible melanoblast migration and/or proliferation defects. Immunofluorescence staining of embryonic skin (E14.5) indicated that melanoblasts (DCT positive) had relatively high cytoplasmic fascin 1 staining, which appeared to be enriched in protrusions (Fig. 1C, yellow arrowheads). Fascin 1 is also expressed by dermal stromal cells [Fig. 1C, below the lower white dotted line marked with Ep (epidermis) and De (dermis)] and weakly expressed by basal keratinocytes (Fig. 1C, white arrowheads). Furthermore, fascin 1 mRNA was robustly expressed in E15.5 melanoblasts at levels around threefold higher than in keratinocytes (Lionel Larue, personal communication) (Colombo et al., 2012). Histological analysis revealed an absence of melanocytes in the white patch of abdominal skin from fascin 1-/- mouse (P14, hair follicle in anagen stage) whereas the black dorsal skin of fascin 1-/- mice had normal melanocyte distribution (Fig. 1D,E). Fascin 1-/- mice also displayed reduced pigmentation in the toes and tail (Fig. 1F). Thus, fascin 1 is highly expressed in melanoblasts, but perhaps only transiently, as it was absent from melanocytes isolated and cultured from 1-day-old pups (M4, supplementary material Fig. S1B). By contrast, human melanocytes in culture express fascin 1 (Li et al., 2010), possibly reflecting that human melanocytes remain migratory in the adult and therefore may maintain fascin 1 expression, whereas mouse melanocytes reside in hair follicles and are not motile in the adult (Larue and Beermann, 2007), and may thus lose fascin 1 expression.
Fig. 1.
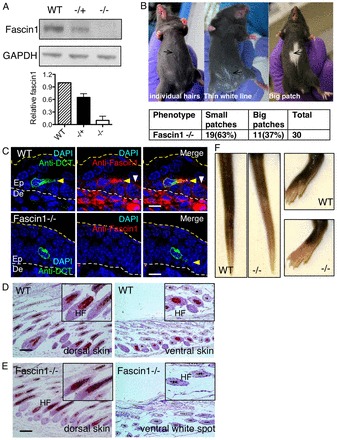
Fascin 1 loss causes hypopigmentation. (A) Fascin1 expression level in skin lysates from fascin 1 wild-type, fascin 1-/+ and fascin 1-/- embryos (E14.5). (B) White patch phenotype of fascin 1-/- mice in C57BL/6 background. Small white patches are defined as a few white hairs to a very thin white straight line in the middle of the abdomen. Big white patches are defined as diversely shaped patches normally covering 5-20% of the abdomen. (C) DCT and fascin 1 immunofluorescence pictures of transversely sectioned embryos. Broken white lines indicate the epidermal (Ep)-dermal (De) border (green: DCT, red: fascin1, blue: DAPI); yellow arrowhead indicates a melanoblast with a protrusion and white arrowhead indicates a basal keratinocyte. Scale bars: 10 μm. (D,E) Immunohistochemistry using DCT antibody and haemoxylin counterstains of wild type (D) and fascin 1-/- (E) dorsal and ventral skin sections. HF, hair follicles. Scale bars: 100 μm. (F) Tails and toes of wild-type and fascin 1-/- C57BL/6 mice.
Fascin 1 deficiency reduces melanoblast number during embryogenesis
To further understand the pigmentation defect, we crossed fascin 1-/- mice with mice harbouring DCT::lacZ, which is a reporter for melanocyte lineage cells (Mackenzie et al., 1997). DCT::lacZ fascin 1-/- mice generally displayed large white patches on the abdomen (supplementary material Fig. S1C). We performed a β-galactosidase assay to determine the number and distribution of DCT::lacZ positive melanoblasts. At E11.5, when the melanoblasts have just emerged from the neural tube, the number and position of melanoblasts was indistinguishable between wild-type, fascin 1-/+ and fascin 1-/- embryos, e.g. melanoblasts appeared to have emerged from the neural tube and were situated in the migration staging area adjacent to the neural tube (Fig. 2A,B). However, fascin 1-/- displayed fewer melanoblasts on the forelimbs and trunks at E13.5 (Fig. 2D,G) and E15.5 (Fig. 2C,E,F,H), and significantly fewer melanoblasts in the distal areas (Fig. 2C-H). In most cases, fascin 1-/+ embryos had an intermediate phenotype. Thus, fascin 1 is not required for neural crest cell to melanoblast differentiation or for emigration from the neural tube; however, fascin 1 rapidly becomes important for cell numbers to increase and for migration in the dermis/epidermis.
Fig. 2.
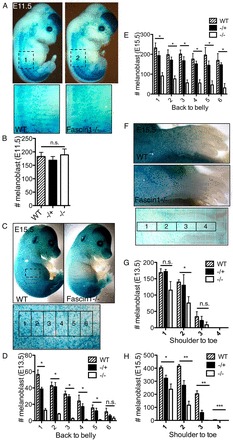
Loss of fascin 1 results in fewer melanoblasts by E13.5 and E15.5. (A) Wild-type and fascin 1-/- embryo pictures and cropped areas used for quantitation (E11.5). (B) Cell number in dorsal-ventral part of E11.5 embryos (wild type, n=8; -/+, n=6; -/-, n=3). Kruskal-Wallis one-way ANOVA test and Mann-Whitney test, n.s., not significant. (C) Wild-type and fascin 1-/- pictures of whole embryos (E15.5) with cropped, gridded subareas for quantitation. (D,E) Melanoblast number in dorsal-ventral regions of E13.5 (D) and E15.5 (E) embryos. (F) Wild-type and fascin 1-/- pictures of the forelimbs with cropped, gridded subareas for quantitation. (G,H) Melanoblast number in the forelimbs of E13.5 (G) and E15.5 (H) embryos. Results are expressed as means±s.e.m. (four to six embryos for each genotype), Kruskal-Wallis one-way ANOVA tests were used to compare melanoblast numbers between wild type, -/+ and -/- in each subarea and Mann-Whitney tests were used to compare between two groups, *P<0.05; **P<0.01; n.s., not significant.
Fascin 1 deficiency delays melanoblast and melanoma cell cycle progression
We examined whether fascin 1 contributed to proliferation in melanoblasts and melanoma cell lines that express high levels of fascin 1 (Li et al., 2010). Melanoblasts proliferate with a doubling rate of ∼16 hours at E10.5-E15.5 (Luciani et al., 2011). No apoptotic melanoblasts were detected from co-stains of TUNEL assay (supplementary material Fig. S2A) or cleaved caspase 3 (apoptosis marker, data not shown) and DCT in wild-type or fascin 1-/- embryos (E14.5). By contrast, BrdU incorporation into fascin 1-/- melanoblasts was significantly reduced following a 24-hour BrdU pulse (Fig. 3A; supplementary material Fig. S2B), indicating that the cell cycle is delayed in fascin 1-/- embryos. Furthermore, we observed fewer phospho-histone H3 (pH3, mitosis marker) positive melanoblasts in fascin 1-/- embryos (Fig. 3B; supplementary material Fig. S2C). Cyclin D1 acts to promote G1- to S-phase transition and cell proliferation, and high cyclin D1 expression marks cells entering S phase of the cell cycle (Sherr, 1995). Cyclin D1-positive melanoblasts were significantly reduced in fascin 1-/- embryos (Fig. 3C; supplementary material Fig. S2D). To further test the role of fascin 1 in proliferation, we examined melanoma cell proliferation in 3D. Although fascin 1-depleted melanoma cells proliferated more slowly in 3D collagen I matrix (supplementary material Fig. S3A), they displayed normal FAK-PI3K-AKT pathway and MAPK/ERK pathway activation (supplementary material Fig. S3B), in contrast to a previous report in hepatic stellate cells, where these pathways were reduced in fascin-depleted cells (Uyama et al., 2012). Asynchronous fascin 1 knockdown MV3 cells exhibit more G1-phase cells and fewer S-phase cells (Fig. 3D). To further validate this, MV3 melanoma cells were trapped with nocodazole, a mitotic inhibitor. From the time of the nocodazole addition, we measured the cumulative BrdU incorporation as cells progressed through S phase before being blocked in M phase (Gillespie and Walker, 2006). We observed substantially fewer sifascin (fascin 1 siRNAs) cells in S phase, indicating that fascin depletion slowed progression through G1 and into S and in agreement with the asynchronous cell experiments (Fig. 3E; supplementary material Fig. S4A). Thus, our studies provide evidence that fascin 1 is important for normal cell cycle progression and proliferation of melanoblasts in vivo and melanoma cells in culture.
Fig. 3.
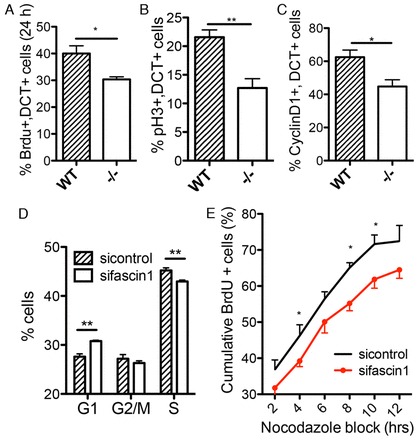
Fascin 1 loss delays melanoblast and melanoma cell cycle progression. (A) Percentage of BrdU-positive DCT labelling melanoblasts (three embryos for each genotype, unpaired Student’s t-test, *P<0.05). (B) Percentage of phospho-histone H3 (ser10) (pH3)-positive DCT labelling melanoblasts (five embryos for each genotype, unpaired Student’s t-test, **P<0.01). (C) Percentage of nuclear cyclin D1-positive DCT labelling melanoblasts (wild-type, n=7; -/-, n=4; unpaired Student’s t-test, *P<0.05). Fifty to 100 cells are counted per embryo in A-C. (D) Cell cycle distribution of MV3 melanoma cells as measured with BrdU/PI FACS analysis. Results are from four independent experiments (mean±s.e.m., unpaired Student’s t-test, **P<0.01). (E) Percentage of BrdU-positive MV3 cells at the indicated time points of nocodazole trapping showing fewer proliferating sifascin1 knockdown cells. Results are from three to six independent experiments (means±s.e.m., unpaired Student’s t-test, *P<0.05). The sifascin1 line is a pool of two different siRNAs that target fascin 1.
Fascin 1 deficiency reduces melanoblast migration and pseudopod generation rate
Fascin 1 (singed in Drosophila) is important for Drosophila haemocyte migration (Zanet et al., 2009), migration of mature dendritic cells to lymph nodes in mice (Yamakita et al., 2011) and for melanoma tumour cell invasion in 3D Matrigel/collagen matrix (Li et al., 2010). We investigated the migration of melanoblasts in live embryo skin to better understand the role of fascin in vivo. Mice carrying a Z/EG double reporter transgene (Novak et al., 2000) and Tyr::Cre (Delmas et al., 2003) were crossed into the fascin 1-/- background to drive GFP expression in the melanoblast lineage. The skin from E14.5 embryonic trunk was imaged as previously described (Mort et al., 2010; Li et al., 2011). Melanoblasts migrate individually within the developing mouse embryo epidermis using two types of protrusions: short stubs and long pseudopods (Li et al., 2011). Melanoblasts in E14.5 wild-type and fascin 1-/- skin explants maintained a similar elongated cell shape with both long and short protrusions (Fig. 4A,G; supplementary material Movies 1, 2). Fascin 1-/- melanoblasts were slightly smaller than wild type (Fig. 4C). In addition, cell migration speed and euclidean distance travelled was significantly reduced for melanoblasts in fascin 1-/- explants compared with wild type (Fig. 4D-F). Around 30% of fascin 1-/- melanoblasts migrated with a speed slower than 0.5 μm/minute compared with fewer than 10% of melanoblasts in wild-type explants (Fig. 4B,E). However, directionality (the ratio between the euclidean distance and total distance travelled) was unaffected by fascin 1 loss (supplementary material Fig. S5A).
Fig. 4.
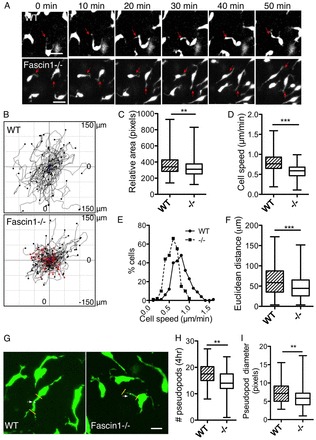
Fascin 1 loss reduces melanoblast cell migration speed and pseudopod generation (E14.5). (A) Picture series of melanoblast migration (wild type and fascin 1-/-). Red arrows indicate the protruding pseudopods. Scale bars: 10 μm. (B) Cell tracks of wild type and fascin 1-/- representative movies. Red lines represent cells with speed slower than 0.5 μm/minute. (C) Relative cell area expressed as pixels and measured with ImageJ line tool. Between 170 and 200 cells are analysed. (D,E) Cell speed (D) and frequency distribution of cell speed (E) of wild-type and fascin 1-/- melanoblasts, as measured with ImageJ plug-in chemotaxis tool. (F) Euclidean migration distance in wild-type and fascin 1-/- melanoblasts. Data are generated from three movies (three different embryos) and 230-250 cells from each genotype are analysed in total. (G) Detailed pictures with cell protrusions. White arrowheads indicate the midpoint of the pseudopods where the diameter was measured. (H,I) Protrusion numbers that melanoblasts generate in 4 hours (H) and pseudopod diameter (I) in still z stacked pictures. Pseudopods of 80-130 cells from three embryos were analysed. Scale bars: 10 μm. In the box and whisker plots, horizontal line indicates median, box indicates interquartile range and whiskers indicate maximum value to minimum value. Mann-Whitney test; **P<0.01; ***P<0.001.
In addition, the rate of pseudopod generation in fascin 1-/- melanoblasts was modestly reduced (Fig. 4G,H) but the lifetime of pseudopods was increased (supplementary material Fig. S5B). These two parameters roughly balanced out so that at any one time, fascin 1-/- melanoblasts and wild type had a similar number of pseudopods (supplementary material Fig. S5C); however, this number was quite variable and ranged between zero and eight pseudopods. Fascin 1-/- melanoblasts also extended thinner protrusions with a smaller cross-sectional width than wild type (Fig. 4G,I). This difference may be due to the proportionally smaller area of the fascin 1-/- cells in embryo skin (Fig. 4C). Thus, fascin 1 is required for efficient melanoblast migration and formation of thick robust pseudopods. In vitro fascin 1 is important for filopodia extension (Vignjevic et al., 2006; Hashimoto et al., 2007) and may be important for melanoblasts to probe the local environment, including contact with keratinocytes and the BM (basement membrane). Although we found that loss of fascin1 reduced the rate of generation of pseudopods, in agreement with these in vitro studies, it is possible that very small filopodia will not be detected at the resolution we are capable of imaging explants, so we cannot comment on those. Overall, we find that fascin 1 is required for efficient pseudopod generation rates, and for normal pseudopod dynamics, but lack of fascin causes only subtle changes overall in pseudopod dynamics.
Mouse melanoblasts migrate across the developing epidermal BM from dermis to epidermis between E11.5 and E13.5. As fascin 1 is implicated in invadopodia formation and invasion of melanoma cells (Li et al., 2010), we examined the effect of fascin 1 deletion on BM crossing. However, the proportion of melanoblasts crossing into the epidermis of Dct::lacZ wild-type, fascin 1-/+ and fascin 1-/- embryos was similar at E13.5 (supplementary material Fig. S6). Although it seems surprising that fascin 1 is not important for migration across the BM, these data agree with our previous study of Rac1 and N-WASP (Li et al., 2011) and further confirm that the relocation from dermis to epidermis probably does not require matrix degradation by invadopod-like structures.
Fascin 1 regulates melanocyte migration and lamellipodial dynamics
To further explore the migratory role of fascin 1, we established an early passage melanocyte cell line from 1-day-old mouse pups with a genetic deletion of Ink4a, which we term M4 (see Materials and methods). M4 represents line 4, as described in our recent study (Li et al., 2012). Fascin 1 protein was undetectable in M4 cells (supplementary material Fig. S1B), perhaps reflecting that murine melanocytes reside mainly in hair follicles and may have lost fascin expression as they are not migratory (Jordan and Jackson, 2000). Fascin 1 protein was not detected in other mouse melanocyte (with Ink4a-/-) or melanoma (mutant NRasQ61K+/o Ink4a-/- background) cell lines that we derived from 1-day-old pups (data not shown) (Ackermann et al., 2005). However, fascin 1 expression was observed in mouse melanoma cell lines B16F1 and B16F10 (supplementary material Fig. S1B) (Vignjevic et al., 2006; Kim et al., 2009), which indicates that the expression of fascin 1 might be dependent on signals from the microenvironment or on mutations other than loss of Ink4a and activation of NRas. Because many human and murine melanoma cell lines express fascin 1 (Li et al., 2010), we stably overexpressed GFP-tagged human fascin 1 in M4 melanocytes (M4F cells). M4 and M4F showed the same sizes in 2D cell culture (supplementary material Fig. S5D) and migrated randomly with similar directionality (supplementary material Fig. S5E). GFP-fascin 1 was cytoplasmic and also concentrated at filopodia and microspikes (Fig. 5A). Fascin 1 expression increased migration speed (Fig. 5B), which is consistent with other studies (Yamashiro et al., 1998; Hashimoto et al., 2005a). Melanocytes displayed broad fan-like lamellipodia towards the direction of migration on a 2D surface. Fascin 1-enriched actin bundles (filopodia and microspikes) are interspersed within the lamellar actin meshwork of motile melanoma cells (Fig. 5A; supplementary material Movie 3) (Pelosi et al., 2003; Vignjevic et al., 2006). We further analysed four parameters of lamellipodial protrusions: protrusion rate, protrusion frequency, protrusion persistence and distance as shown in the lamellipodial kymographs (Fig. 5C). Expression of fascin 1 increased the speed of advancement of lamellipodial protrusions and the generation frequency. Cells expressing GFP-fascin 1 protruded less persistently, although protrusion distance was not affected (Fig. 5D-G). Thus, fascin 1 expression increases melanocyte migration and promotes lamellipodial dynamics in a 2D environment.
DISCUSSION
We demonstrate an important role for fascin in the migration and cell cycle progression of mouse embryo melanoblasts that gives rise to a white abdominal patch on fascin 1-null animals. The white patch arises because melanoblasts have not populated the areas most distal to their sites of origin near the neural tube during embryogenesis and once they differentiate into melanocytes after birth, they are no longer migratory in the mouse skin. Evidence for this comes from showing that expression of Kit-L in the skin can allow repopulation of new hair follicles after birth (Luciani et al., 2011). The role of fascin in migration in 2D in vitro is well documented (Jayo and Parsons, 2010; Machesky and Li, 2010) and recent reports show a requirement in 3D matrix degradation (Li et al., 2010), as well as in the normal embryonic migration and inflammatory responses of Drosophila haemocytes (Zanet et al., 2009). We find that loss of fascin 1 impairs pseudopod generation rate and fascin 1-null cells generate thinner pseudopodia that are less dynamic (longer-lived), leading to slower migration. We were surprised that pseudopods generated by fascin 1 nulls had a slightly increased lifetime, but we also found that expressing fascin 1 in M4 melanocytes in culture decreased lamellipodial persistence, which also indicates that fascin 1 promotes dynamics. This agrees with studies showing increased lamellipodial dynamics of fascin 1-expressing Drosophila haemocytes (Zanet et al., 2009) and is interesting in light of a recent study showing that actin bundles containing fascin 1 are more susceptible to turnover by cofilin (Breitsprecher et al., 2011). Furthermore, fascin 1 can interact with LIMK, a cofilin regulatory kinase (Jayo et al., 2012) and thus fascin can promote dynamics of actin structures via the cofilin-LIMK pathway. Although fascin is implicated in the formation of stable actin networks that mediate cell invasion through matrix (Li et al., 2010; Schoumacher et al., 2010) and in the formation of very stable actin bundles in Drosophila bristles (Cant et al., 1994), melanoblast migration in epidermis does not appear to be invasive, as it does not require N-WASP, Rac1, matrix metalloproteases (Li et al., 2011) or fascin 1 (this study). It is possible that during invasion, the LIMK-cofilin pathway is modulated such that highly stable actin networks can form at specific places in the cell and in other locations dynamics is favoured and maintained by Rho-family GTPase control (Bravo-Cordero et al., 2011).
An interesting difference between the role of fascin 1 in Drosophila haemocytes and fascin 1 in mouse melanoblasts seems to be that fascin 1 loss in Drosophila haemocytes dramatically impairs directed migration and guidance (Zanet et al., 2009). Drosophila embryos mutant for fascin 1 showed an accumulation of haemocytes in the anterioventral regions where they originate and a failure to disperse during development or in response to wounding. By contrast, fascin 1-null melanoblasts were able to home to hair follicles and to reach most areas of the mouse epidermis during embryogenesis. Fascin 1-null haemocytes failed to polarize their actin cytoskeletons (Zanet et al., 2009), whereas melanoblasts devoid of fascin 1 showed relatively normal shape and polarization of pseudopods. This indicates that the requirements for fascin 1 in migration during development are cell type specific, similar to requirements for Rac1, which vary depending on the cell type and tissue context (Migeotte et al., 2010; Wang et al., 2010; Li et al., 2011).
The role of fascin 1 in cell proliferation and cell cycle progression is not entirely clear and has only previously been seen in tumour tissues or tissue culture cells. Quantification of the cell numbers at different stages of embryogenesis and subsequent staining for markers of apoptosis and cell proliferation revealed that fascin-null melanoblasts proliferate slower than normal cells and this phenotype was recapitulated in fascin 1-expressing melanoma cell lines in culture. The embryonic requirement for fascin 1 during melanoblast proliferation might reflect a possible mechanism by which cancer cells could gain not only a motility advantage but also a proliferation advantage by expressing fascin 1. In our studies, fewer fascin 1 knockout melanoblasts were BrdU positive (Fig. 3E), indicating that cells lacking fascin 1 were proliferating slower than controls. In agreement with our knockdown studies, enhanced proliferation was seen in fascin 1-transfected colon carcinoma cells (Jawhari et al., 2003) and oesophageal squamous carcinoma cells (Xie et al., 2005; Xie et al., 2010). However, as highlighted by Hashimoto et al. (Hashimoto et al., 2005b), there is some controversy over whether high fascin 1 levels correlate with high or low proliferation rates in tumours (Pelosi et al., 2003; Hashimoto et al., 2005a). We did not see any significant changes in levels of ERK/MAPK or FAK signalling by western blot detection of phospho-epitopes in cell lysates from fascin knockdown melanoma cells, so the mechanism of involvement of fascin 1 in cell proliferation remains unknown. Although the role of fascin 1 in cell cycle progression is not known, fascin 1 might indirectly affect microtubule spindle dynamics and cell mitosis through the interaction of a myosin X/fascin/actin and actin-microtubule network (Woolner et al., 2008; Nagy and Rock, 2010).
In summary, fascin 1 loss results in hypopigmentation defects in mice that arise from a reduced migration and proliferation of melanoblasts during embryogenesis. Melanoblasts devoid of fascin can still differentiate and migrate in the dermis and epidermis, but with reduced efficiency. Melanoblasts and melanoma cells show proliferation defects when fascin is depleted, suggesting a dependence of these cells on fascin for normal cell cycle progression. Melanoma tumour cells undergo changes associated with de-differentiation towards a more migratory and embryonic state, and this is thought to aid metastatic dissemination. Fascin1 expression benefits melanoma and melanocyte cells in migration, invasion and proliferation; as such, expression of fascin 1 likely provides advantages in tumours.
Acknowledgments
The authors thank Beatson Institute for Cancer Research biological services for animal maintenance; Beatson Advanced Imaging Resource for imaging; Colin Nixon and his staff for great assistance in histology; Lionel Larue for helpful comments on the manuscript and for sharing unpublished data about fascin 1 expression in melanoblasts; and Gabriela Kalna and Matt Neilson of the Beatson Institute Bioinformatics Department for their advice and help with statistical analysis.
Footnotes
Funding
Y.M., A.L., L.M.M. and O.J.S. are funded by a Core Cancer Research UK (CRUK) grant. Deposited in PMC for immediate release.
Competing interests statement
The authors declare no competing financial interests.
Supplementary material
Supplementary material available online at http://dev.biologists.org/lookup/suppl/doi:10.1242/dev.089789/-/DC1
References
- Ackermann J., Frutschi M., Kaloulis K., McKee T., Trumpp A., Beermann F. (2005). Metastasizing melanoma formation caused by expression of activated N-RasQ61K on an INK4a-deficient background. Cancer Res. 65, 4005–4011 [DOI] [PubMed] [Google Scholar]
- Adams J. C. (1997). Characterization of cell-matrix adhesion requirements for the formation of fascin microspikes. Mol. Biol. Cell 8, 2345–2363 [DOI] [PMC free article] [PubMed] [Google Scholar]
- Adams J. C., Schwartz M. A. (2000). Stimulation of fascin spikes by thrombospondin-1 is mediated by the GTPases Rac and Cdc42. J. Cell Biol. 150, 807–822 [DOI] [PMC free article] [PubMed] [Google Scholar]
- Aratyn Y. S., Schaus T. E., Taylor E. W., Borisy G. G. (2007). Intrinsic dynamic behavior of fascin in filopodia. Mol. Biol. Cell 18, 3928–3940 [DOI] [PMC free article] [PubMed] [Google Scholar]
- Baxter L. L., Hou L., Loftus S. K., Pavan W. J. (2004). Spotlight on spotted mice: a review of white spotting mouse mutants and associated human pigmentation disorders. Pigment Cell Res. 17, 215–224 [DOI] [PubMed] [Google Scholar]
- Borghese L., Fletcher G., Mathieu J., Atzberger A., Eades W. C., Cagan R. L., Rørth P. (2006). Systematic analysis of the transcriptional switch inducing migration of border cells. Dev. Cell 10, 497–508 [DOI] [PMC free article] [PubMed] [Google Scholar]
- Bravo-Cordero J. J., Oser M., Chen X., Eddy R., Hodgson L., Condeelis J. (2011). A novel spatiotemporal RhoC activation pathway locally regulates cofilin activity at invadopodia. Curr. Biol. 21, 635–644 [DOI] [PMC free article] [PubMed] [Google Scholar]
- Breitsprecher D., Koestler S. A., Chizhov I., Nemethova M., Mueller J., Goode B. L., Small J. V., Rottner K., Faix J. (2011). Cofilin cooperates with fascin to disassemble filopodial actin filaments. J. Cell Sci. 124, 3305–3318 [DOI] [PMC free article] [PubMed] [Google Scholar]
- Cant K., Knowles B. A., Mooseker M. S., Cooley L. (1994). Drosophila singed, a fascin homolog, is required for actin bundle formation during oogenesis and bristle extension. J. Cell Biol. 125, 369–380 [DOI] [PMC free article] [PubMed] [Google Scholar]
- Colombo S., Champeval D., Rambow F., Larue L. (2012). Transcriptomic analysis of mouse embryonic skin cells reveals previously unreported genes expressed in melanoblasts. J. Invest. Dermatol. 132, 170–178 [DOI] [PubMed] [Google Scholar]
- De Arcangelis A., Georges-Labouesse E., Adams J. C. (2004). Expression of fascin-1, the gene encoding the actin-bundling protein fascin-1, during mouse embryogenesis. Gene Expr. Patterns 4, 637–643 [DOI] [PubMed] [Google Scholar]
- Delmas V., Martinozzi S., Bourgeois Y., Holzenberger M., Larue L. (2003). Cre-mediated recombination in the skin melanocyte lineage. Genesis 36, 73–80 [DOI] [PubMed] [Google Scholar]
- Gillespie D. A., Walker M. (2006). Mitotic index determination by flow cytometry. Subcell. Biochem. 40, 355–358 [DOI] [PubMed] [Google Scholar]
- Harris M. L., Hall R., Erickson C. A. (2008). Directing pathfinding along the dorsolateral path - the role of EDNRB2 and EphB2 in overcoming inhibition. Development 135, 4113–4122 [DOI] [PubMed] [Google Scholar]
- Hashimoto Y., Ito T., Inoue H., Okumura T., Tanaka E., Tsunoda S., Higashiyama M., Watanabe G., Imamura M., Shimada Y. (2005a). Prognostic significance of fascin overexpression in human esophageal squamous cell carcinoma. Clin. Cancer Res. 11, 2597–2605 [DOI] [PubMed] [Google Scholar]
- Hashimoto Y., Skacel M., Adams J. C. (2005b). Roles of fascin in human carcinoma motility and signaling: prospects for a novel biomarker? Int. J. Biochem. Cell Biol. 37, 1787–1804 [DOI] [PubMed] [Google Scholar]
- Hashimoto Y., Parsons M., Adams J. C. (2007). Dual actin-bundling and protein kinase C-binding activities of fascin regulate carcinoma cell migration downstream of Rac and contribute to metastasis. Mol. Biol. Cell 18, 4591–4602 [DOI] [PMC free article] [PubMed] [Google Scholar]
- Hayashi Y., Toda K., Saibara T., Okamoto S., Osanai M., Enzan H., Lee G. H. (2008). Expression of fascin-1, an actin-bundling protein, in migrating hepatoblasts during rat liver development. Cell Tissue Res. 334, 219–226 [DOI] [PubMed] [Google Scholar]
- Hornyak T. J., Hayes D. J., Chiu L.-Y., Ziff E. B. (2001). Transcription factors in melanocyte development: distinct roles for Pax-3 and Mitf. Mech. Dev. 101, 47–59 [DOI] [PubMed] [Google Scholar]
- Jawhari A. U., Buda A., Jenkins M., Shehzad K., Sarraf C., Noda M., Farthing M. J. G., Pignatelli M., Adams J. C. (2003). Fascin, an actin-bundling protein, modulates colonic epithelial cell invasiveness and differentiation in vitro. Am. J. Pathol. 162, 69–80 [DOI] [PMC free article] [PubMed] [Google Scholar]
- Jayo A., Parsons M. (2010). Fascin: a key regulator of cytoskeletal dynamics. Int. J. Biochem. Cell Biol. 42, 1614–1617 [DOI] [PubMed] [Google Scholar]
- Jayo A., Parsons M., Adams J. C. (2012). A novel Rho-dependent pathway that drives interaction of fascin-1 with p-Lin-11/Isl-1/Mec-3 kinase (LIMK) 1/2 to promote fascin-1/actin binding and filopodia stability. BMC Biol. 10, 72 [DOI] [PMC free article] [PubMed] [Google Scholar]
- Jordan S. A., Jackson I. J. (2000). MGF (KIT ligand) is a chemokinetic factor for melanoblast migration into hair follicles. Dev. Biol. 225, 424–436 [DOI] [PubMed] [Google Scholar]
- Kim S. H., Kim Y., Kim M., Kim D. S., Lee S. C., Chi S. W., Lee H., Park S. G., Park B. C., Bae K. H., et al. (2009). Comparative proteomic analysis of mouse melanoma cell line B16, a metastatic descendant B16F10, and B16 overexpressing the metastasis-associated tyrosine phosphatase PRL-3. Oncol. Res. 17, 601–612 [DOI] [PubMed] [Google Scholar]
- Larue L., Beermann F. (2007). Cutaneous melanoma in genetically modified animals. Pigment Cell Res. 20, 485–497 [DOI] [PubMed] [Google Scholar]
- Li A., Dawson J. C., Forero-Vargas M., Spence H. J., Yu X., König I., Anderson K., Machesky L. M. (2010). The actin-bundling protein fascin stabilizes actin in invadopodia and potentiates protrusive invasion. Curr. Biol. 20, 339–345 [DOI] [PMC free article] [PubMed] [Google Scholar]
- Li A., Ma Y., Yu X., Mort R. L., Lindsay C. R., Stevenson D., Strathdee D., Insall R. H., Chernoff J., Snapper S. B., et al. (2011). Rac1 drives melanoblast organization during mouse development by orchestrating pseudopod-driven motility and cell-cycle progression. Dev. Cell 21, 722–734 [DOI] [PMC free article] [PubMed] [Google Scholar]
- Li A., Ma Y., Jin M., Mason S., Mort R. L., Blyth K., Larue L., Sansom O. J., Machesky L. M. (2012). Activated mutant NRas(Q61K) drives aberrant melanocyte signaling, survival, and invasiveness via a Rac1-dependent mechanism. J. Invest. Dermatol. 132, 2610–2621 [DOI] [PMC free article] [PubMed] [Google Scholar]
- Lindsay C. R., Lawn S., Campbell A. D., Faller W. J., Rambow F., Mort R. L., Timpson P., Li A., Cammareri P., Ridgway R. A., et al. (2011). P-Rex1 is required for efficient melanoblast migration and melanoma metastasis. Nat. Commun. 2, 555 [DOI] [PMC free article] [PubMed] [Google Scholar]
- Loughna S., Henderson D. (2007). Methodologies for staining and visualisation of β-galactosidase in mouse embryos and tissues. Methods Mol. Biol. 411, 1–11 [DOI] [PubMed] [Google Scholar]
- Luciani F., Champeval D., Herbette A., Denat L., Aylaj B., Martinozzi S., Ballotti R., Kemler R., Goding C. R., De Vuyst F., et al. (2011). Biological and mathematical modeling of melanocyte development. Development 138, 3943–3954 [DOI] [PubMed] [Google Scholar]
- Machesky L. M., Li A. (2010). Fascin: invasive filopodia promoting metastasis. Commun. Integr. Biol. 3, 263–270 [DOI] [PMC free article] [PubMed] [Google Scholar]
- Mackenzie M. A. F., Jordan S. A., Budd P. S., Jackson I. J. (1997). Activation of the receptor tyrosine kinase Kit is required for the proliferation of melanoblasts in the mouse embryo. Dev. Biol. 192, 99–107 [DOI] [PubMed] [Google Scholar]
- Migeotte I., Omelchenko T., Hall A., Anderson K. V. (2010). Rac1-dependent collective cell migration is required for specification of the anterior-posterior body axis of the mouse. PLoS Biol. 8, e1000442 [DOI] [PMC free article] [PubMed] [Google Scholar]
- Mort R. L., Hay L., Jackson I. J. (2010). Ex vivo live imaging of melanoblast migration in embryonic mouse skin. Pigment Cell Melanoma Res. 23, 299–301 [DOI] [PMC free article] [PubMed] [Google Scholar]
- Nagy S., Rock R. S. (2010). Structured post-IQ domain governs selectivity of myosin X for fascin-actin bundles. J. Biol. Chem. 285, 26608–26617 [DOI] [PMC free article] [PubMed] [Google Scholar]
- Novak A., Guo C., Yang W., Nagy A., Lobe C. G. (2000). Z/EG, a double reporter mouse line that expresses enhanced green fluorescent protein upon cre-mediated excision. Genesis 28, 147–155 [PubMed] [Google Scholar]
- Pelosi G., Pastorino U., Pasini F., Maissoneuve P., Fraggetta F., Iannucci A., Sonzogni A., De Manzoni G., Terzi A., Durante E., et al. (2003). Independent prognostic value of fascin immunoreactivity in stage I nonsmall cell lung cancer. Br. J. Cancer 88, 537–547 [DOI] [PMC free article] [PubMed] [Google Scholar]
- Pla P., Solov’eva O., Moore R., Alberti C., Kunisada T., Larue L. (2004). Dct:lacZ ES cells: a novel cellular model to study melanocyte determination and differentiation. Pigment Cell Res. 17, 142–149 [DOI] [PubMed] [Google Scholar]
- Schoumacher M., Goldman R. D., Louvard D., Vignjevic D. M. (2010). Actin, microtubules, and vimentin intermediate filaments cooperate for elongation of invadopodia. J. Cell Biol. 189, 541–556 [DOI] [PMC free article] [PubMed] [Google Scholar]
- Sherr C. J. (1995). D-type cyclins. Trends Biochem. Sci. 20, 187–190 [DOI] [PubMed] [Google Scholar]
- Silver D. L., Hou L., Somerville R., Young M. E., Apte S. S., Pavan W. J. (2008). The secreted metalloprotease ADAMTS20 is required for melanoblast survival. PLoS Genet. 4, e1000003 [DOI] [PMC free article] [PubMed] [Google Scholar]
- Takemoto Y., Keighren M., Jackson I. J., Yamamoto H. (2006). Genomic localization of a Dct-LacZ transgene locus: a simple assay for transgene status. Pigment Cell Res. 19, 644–645 [DOI] [PubMed] [Google Scholar]
- Uyama N., Iimuro Y., Kawada N., Reynaert H., Suzumura K., Hirano T., Kuroda N., Fujimoto J. (2012). Fascin, a novel marker of human hepatic stellate cells, may regulate their proliferation, migration, and collagen gene expression through the FAK-PI3K-Akt pathway. Lab. Invest. 92, 57–71 [DOI] [PubMed] [Google Scholar]
- Vignjevic D., Kojima S.-i., Aratyn Y., Danciu O., Svitkina T., Borisy G. G. (2006). Role of fascin in filopodial protrusion. J. Cell Biol. 174, 863–875 [DOI] [PMC free article] [PubMed] [Google Scholar]
- Wang X., He L., Wu Y. I., Hahn K. M., Montell D. J. (2010). Light-mediated activation reveals a key role for Rac in collective guidance of cell movement in vivo. Nat. Cell Biol. 12, 591–597 [DOI] [PMC free article] [PubMed] [Google Scholar]
- Woolner S., O’Brien L. L., Wiese C., Bement W. M. (2008). Myosin-10 and actin filaments are essential for mitotic spindle function. J. Cell Biol. 182, 77–88 [DOI] [PMC free article] [PubMed] [Google Scholar]
- Xie J. J., Xu L. Y., Zhang H. H., Cai W. J., Mai R. Q., Xie Y. M., Yang Z. M., Niu Y. D., Shen Z. Y., Li E. M. (2005). Role of fascin in the proliferation and invasiveness of esophageal carcinoma cells. Biochem. Biophys. Res. Commun. 337, 355–362 [DOI] [PubMed] [Google Scholar]
- Xie J.-J., Xu L.-Y., Wu J.-Y., Shen Z.-Y., Zhao Q., Du Z.-P., Lv Z., Gu W., Pan F., Xu X.-E., et al. (2010). Involvement of CYR61 and CTGF in the fascin-mediated proliferation and invasiveness of esophageal squamous cell carcinomas cells. Am. J. Pathol. 176, 939–951 [DOI] [PMC free article] [PubMed] [Google Scholar]
- Yamakita Y., Matsumura F., Yamashiro S. (2009). Fascin1 is dispensable for mouse development but is favorable for neonatal survival. Cell Motil. Cytoskeleton 66, 524–534 [DOI] [PMC free article] [PubMed] [Google Scholar]
- Yamakita Y., Matsumura F., Lipscomb M. W., Chou P. C., Werlen G., Burkhardt J. K., Yamashiro S. (2011). Fascin1 promotes cell migration of mature dendritic cells. J. Immunol. 186, 2850–2859 [DOI] [PMC free article] [PubMed] [Google Scholar]
- Yamashiro S., Yamakita Y., Ono S., Matsumura F. (1998). Fascin, an actin-bundling protein, induces membrane protrusions and increases cell motility of epithelial cells. Mol. Biol. Cell 9, 993–1006 [DOI] [PMC free article] [PubMed] [Google Scholar]
- Zanet J., Stramer B., Millard T., Martin P., Payre F., Plaza S. (2009). Fascin is required for blood cell migration during Drosophila embryogenesis. Development 136, 2557–2565 [DOI] [PubMed] [Google Scholar]