

Abstract
Infectious pathogens often cause serious public health concerns throughout the world. There is an increasing demand for simple, rapid and sensitive approaches for multiplexed pathogen detection. In this paper we have developed a polydimethylsiloxane (PDMS)/paper/glass hybrid microfluidic system integrated with aptamer-functionalized graphene oxide (GO) nano-biosensors for simple, one-step, multiplexed pathogen detection. The paper substrate used in this hybrid microfluidic system facilitated the integration of aptamer biosensors on the microfluidic biochip, and avoided complicated surface treatment and aptamer probe immobilization in a PDMS or glass-only microfluidic system. Lactobacillus acidophilus was used as a bacterium model to develop the microfluidic platform with a detection limit of 11.0 cfu mL−1. We have also successfully extended this method to the simultaneous detection of two infectious pathogens - Staphylococcus aureus and Salmonella enterica. This method is simple and fast. The one-step ‘turn on’ pathogen assay in a ready-to-use microfluidic device only takes ~10 min to complete on the biochip. Furthermore, this microfluidic device has great potential in rapid detection of a wide variety of different other bacterial and viral pathogens.
Introduction
Pathogens often cause infectious diseases and significant economic losses,1 and frequently become serious public health concerns throughout the world, such as the massive outbreak of Escherichia coli O157:H7 infection that occurred in Japan in 1996.2 Pathogen detection technology is vital to the prevention and identification of such infectious diseases and biodefense threats. Recently, there is an increasing demand for simple, rapid and sensitive methods for multiplexed pathogen detection with the capacity to provide rich information of multiple pathogens from one assay, especially in resource-limited settings.
Over the past decades, a variety of methods, such as polymerase chain reaction (PCR)-based methods,3–7 DNA microarrays,8–10 DNA sequencing technology11,12 enzyme-linked immunosorbent assay (ELISA),13,14 staining,15 isolation,16 cell culture,17 and so on, have been employed for pathogen detection. Although the aforementioned DNA-based methods have been widely used for efficient pathogen identification, they cannot detect pathogenic microorganisms directly. They either depend on expensive and high-precision instruments (e.g., DNA sequencing), or require cumbersome procedures, such as cell lysis, DNA extraction, amplification and purification.18 Immunoassays (e.g. ELISA) based on the specific interaction between antibody and antigen can be used for direct pathogen detection.19–21 Antibodies, however, are more expensive, and often face the challenge of cross-reactivity. Additionally, antibodies can easily become denatured and lose their activities to bind to pathogenic microorganisms.
Recently, researchers have found that aptamers, oligonucleic acids or peptide molecules that bind to a specific target molecule, have shown promising applications in diagnostics and therapeutics. Unlike antibodies, aptamers are stable, and the chemical nature of nucleic acids allows easy synthesis and modification of aptamers.22 Aptamers opened new approaches to detect pathogens directly like antibodies. Various aptamer-based biosensors have been developed for pathogen detection, commonly using fluorescent23,24 or electrochemical detection.25,26 However, they either need complicated procedures for surface treatment, probe immobilization, washing steps and sample loading, or lack the ability for multiplexed detection.
Microfluidic lab-on-a-chip techniques developed since the 1990s have attracted significant attention in the past two decades because of a variety of advantages associated with miniaturization, integration, and automation.27–29 These techniques provide a versatile platform for numerous bio-applications, such as forensics,30 pathogen identification,31,32,33 drug discovery,34,35 disease diagnostics,36 cell biology,37–39 and cancer research,40,41 generally through cellular analysis, genetic assays and protein analysis. The ease and low-cost of soft lithography and attractive optical properties of polydimethylsiloxane (PDMS), a silicon-based polymeric elastomer, have made PDMS microfluidic devices the dominant platform in microfluidic bio-applications.42,43 However, PDMS and glass microdevices are often associated with additional complicated chemical surface modifications for probe immobilization. Recently, paper-based microfluidic devices provide a new low-cost platform for different applications related to health care and environmental monitoring in low-resource settings.44–47 Hydrophobic barriers can be easily patterned on individual layers of chromatographic paper to form microfluidic channels,36 without stringent requirements for cleanroom facilities. The porous paper also provides a simple 3D substrate for reagent storage and reactions. Paper-based microfluidic devices, however, typically do not offer the high level of performance and functionality that PDMS affords in liquid flow control and delivery. Each microfluidic chip substrate has its own advantages and disadvantages. Therefore, taking the advantages from both paper and PDMS substrates, herein, we developed a simple PDMS/paper hybrid microfluidic system for fast multiplexed pathogen detection. The introduction of porous paper materials inside PDMS-fabricated microwells provides a simple and efficient strategy for immobilization of various DNA aptamer probes without the need for chemical surface modifications. Although a lot of PDMS-based and paper-based microfluidic systems have been developed for different applications, PDMS/paper hybrid microfluidic systems that take advantage of both substrates are rarely reported. As far as we know, this is the first report to present a PDMS/paper hybrid microfluidic system integrated with DNA biosensors.
We also integrated aptamer-functionalized graphene oxide (GO) biosensors on the chip, using a sensitive “turn on” strategy based on the fluorescence quenching and recovering property of GO when adsorbing and desorbing fluorescent labeled aptamers. Although GO has been employed in microfluidics for cancer cell capture and detection,48 it involves fluorescence resonance energy transfer (FRET) and double-labeled aptamers. Double-labeled aptamers not only increase the reagent cost, but also make GO-based FRET more complex, because FRET requires a certain distance between two fluorophores for efficient energy transfer. To the best of our knowledge, aptamer-functionalized GO biosensors have not been integrated on a microfluidic biochip for pathogen detection. We first used Lactobacillus acidophilus (L. acidophilus) as a bacterium model, and then demonstrated simultaneous detection of two bacterial pathogens Staphylococcus aureus (S. aureus) and Salmonella enterica (S. enterica) using this microfluidic system. This method does not need complicated surface modification and probe immobilization, or troublesome DNA extraction steps, but can provide high-density information of multiple pathogens from one assay from multiplexed detection.
Methods and materials
Chemicals and materials
The sequence information and their corresponding dissociation constants (Kd) of the three aptamers49–51 (Integrated DNA Technologies, Coralville, IA) used in this paper are listed in Table 1, all of which are labeled with Cy3 at the 5′ end. Graphene oxide was purchased from Graphene Laboratories (Calverton, NY). Polydimethylsiloxane (PDMS, Sylgard 184) was obtained from Dow Corning (Midland, MI). Whatman chromatography paper and all other mentioned chemicals and solvents were purchased from Sigma (St. Louis, MO) and used without further purification unless stated otherwise. Unless otherwise noted, all solutions were prepared with ultrapure Milli-Q water (18.2 MΩ cm) from a Millipore Milli-Q system (Bedford, MA).
Table 1.
Information of the three aptamers for bacterium sensing
| Aptamers | Sequences (5′–3′) | Dissociation constant (Kd) |
|---|---|---|
| L. acidophilus (FALA)a | cy3-ATC CGT CAC ACC TGC TCT ACG GCG CTC CCA ACA GGC CTC TCC TTA CGG CAT ATT ATG GTG TTG GCT CCC GTA T |
13 nM49 |
| S. aureus (FASA)a | cy3-GCA ATG GTA CGG TAC TTC CTC GGC ACG TTC TCA GTA GCG CTC GCT GGT CAT CCC ACA GCT ACG TCA AAA GTG CAC GCT ACT TTG CTA A |
35 nM52 |
| S. enterica (FASE)a | cy3-TAT GGC GGC GTC ACC CGA CGG GGA CTT GAC ATT ATG ACA G | Unknown |
FALA, FASA and FASE refer to different fluorescent aptamers for L. acidophilus, S. aureus and S. enterica, respectively.
Microorganism culture
L. acidophilus (ATCC# 4356), S. aureus (ATCC# 29213) and S. enterica (ATCC# 14028) were obtained from the American Type Culture Collection (ATCC, Rockville, MD). L. acidophilus was grown under anaerobic conditions at 37 °C for 48 h in Lactobacilli MRS Broth (BD, Franklin Lakes, NJ). S. enterica and S. aureus were grown in McConkeys agar and 5% sheep blood agar (BD, Franklin Lakes, NJ), respectively, and incubated at 37 °C for 24 h.
Colonies on plates were counted to determine the number of colony-forming units per milliliter (cfu mL−1). Cells were pelleted at 1800 × g at 4 °C and then washed twice with 1 × binding buffer (50 mM Tris-HCl, pH 7.4 with 5 mM KCl, 100 mM NaCl, and 1.0 mM MgCl2) at room temperature (RT). The pathogen cells were finally suspended in 1 × binding buffer before use.
Microfluidic biochip design and fabrication
The microfluidic system includes two PDMS layers as top and middle layers and one glass plate as the bottom layer, as shown in Fig. 1. The top PDMS layer is designed for reagent delivery. It has 32 micro-channels (100 μm wide and 100 μm deep) and inlet reservoirs and one shared waste reservoir in the center. The middle PDMS layer, also called the incubation layer, has four 3 × 8 microwell (2.0 mm in diameter and 3.0 mm in depth) arrays, where incubation and detection were carried out. The total 96 wells can allow for 96 tests from one assay, thus providing high-throughput analysis. A piece of circular chromatography paper was punched into small round pieces (Φ 2.0 mm), placed inside each microwell, and served as the substrate for adsorbing the aptamer-functionalized GO in subsequent steps.
Fig. 1.

Schematic of the PDMS/paper hybrid microfluidic system for one-step multiplexed pathogen detection using aptamer-functionalized GO biosensors (not drawn to scale). (a) Microfluidic biochip layout, (b) and (c) illustrate the principle of the one-step ‘turn-on’ detection approach based on the interaction among GO, aptamers and pathogens. Step 1: when an aptamer is adsorbed on the GO surface, its fluorescence is quenched. Step 2: when the target pathogen is present, the target pathogen induces the aptamer to be liberated from GO and thereby restores its fluorescence for detection.
All PDMS films were prepared following standard soft lithography procedures.42 Briefly, the liquid PDMS base and the curing agent from the Dow Corning Sylgard 184 kit (Corning, NY) were mixed typically at a ratio of 10 : 1 (w/w). After degassing, the liquid pre-polymer mixture poured in a petri dish was placed in an oven and incubated overnight at 60 °C. Different from commonly used PDMS moulding to create micro-channels, we directly created channels on the top PDMS film using a laser cutter (Epilog Zing 16, Golden, CO). Inlet and outlet reservoirs in the top PDMS layer, and microwells in the middle PDMS layer were formed using biopsy punches. After 30 s exposure to an oxidizing air plasma (Ithaca, NY), PDMS films and the glass plate were face-to-face sandwiched to bond irreversibly.
Assay procedures
GO was diluted in Milli-Q water and was then mixed with the fluorescent aptamer solution at a final concentration of 0.04 mg mL−1. The aptamer-functionalized GO was incubated for a period of time to quench the fluorescence of the aptamer, and the optimal quenching time was investigated by introducing aptamer-functionalized GO into detection wells on the chip.
We used two separate PDMS films with orthogonally-oriented microchannels to deliver aptamer-functionalized GO and samples into different detection wells such that it avoided repeated pipetting and the use of expensive robots in loading reagents into the 96 wells in the device. First, a 40 μL solution of aptamer-functionalized GO was loaded into each inlet of the top ‘laterally-orientated’ PDMS microchannels and delivered to the different detection wells by capillary action through micro-channels (Fig. 2a). The chromatography paper inside the wells absorbed aptamer solutions by capillary effect, and was left to dry at RT after the top PDMS layer was peeled away. Second, another top PDMS film with orthogonal channels to the previous aptamer-functionalized GO introduction channels (Fig. 2b, or see Fig. 1 for the whole chip layout) was bound with the middle PDMS layer for the subsequent sample loading. Hence, a ready-to-use microfluidic biochip integrated with aptamer-functionalized GO biosensors for the subsequent assay was prepared.
Fig. 2.
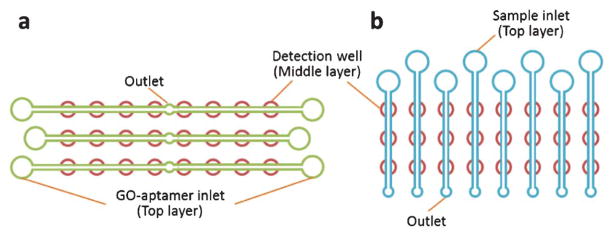
Schematic to illustrate the protocol to introduce the aptamer-functionalized GO (a) and test samples (b) separately into detection wells of one 3 × 8 array unit by using two top PDMS films with orthogonally-orientated microchannels.
During pathogen detection, an aliquot of 30 μL of the test sample was loaded in each sample inlet reservoir to introduce the sample to all the three detection wells on each channel. After incubation for a period of time of 8 min at RT, the biochip was scanned by a Nikon Ti-E Fluorescence Microscope (Melville, NY) that was equipped with a motorized stage and a cooled CCD camera to measure the fluorescence intensities, using appropriate Cy3 optical filters (Ex = 550 nm; Em = 570 nm). Although other temperatures (e.g. 37 °C) might be better for aptamer-target interactions, aptamers and samples were incubated at RT in this study, as other papers reported,53,54 to test the suitability of this method in low-resource settings.
L. acidophilus prepared in 1 × binding buffer was introduced into the microchannels to establish the aptamer based microfluidic system for multiplexed infectious pathogen detection. The aptamer concentration, quenching time and recovery time were investigated to obtain optimal assay conditions. The optimized conditions were further applied to the multiplexed detection of two infectious pathogens – S. aureus and S. enterica.
Results and discussion
Simple one-step pathogen detection strategy in a PDMS/paper hybrid microfluidic system
Fig. 1 shows the main principle of the one-step pathogen detection biosensor using aptamer-functionalized GO in a microfluidic system. GO is a two-dimensional nanomaterial with an extraordinary distance-dependent fluorescence quenching property, by means of π-stacking interactions between nucleotide bases and the GO sheet,55 thus allowing GO to serve as an excellent quencher to different fluorescence dyes.39 The fluorescence is quenched when fluorescent-labeled aptamers are adsorbed on the GO surface (fluorescence ‘OFF’). However, when the corresponding target pathogen is present, the aptamer will bind specifically to the target pathogen and forms a duplex with the target pathogen. The competitive binding of the aptamer and target elicits a conformational alteration of the aptamer so that it becomes rigid,56,57 resulting in lower affinity of the duplex with GO and spontaneous liberation of the Cy3-labeled aptamer from the GO surface. After the release of the aptamer from GO, the distance between the Cy3 dye and GO becomes too far to quench the Cy3 fluorescence efficiently, reversing the quenching effect (fluorescence ‘ON’). In the absence of the target pathogen, no fluorescence restoration is detected.
Instead of using complicated surface modification procedures for aptamer probe immobilization, we use a simple strategy to integrate the aptamer-functionalized GO biosensor in the microfluidic biochip through the novel use of the porous chromatography paper as a simple 3D storage substrate for the aptamer-functionalized GO nano-biosensor in microwells. The aptamer-functionalized GO and sample are simply introduced into microwells through laterally-oriented and vertically-oriented microchannels in two different top PDMS films, as illustrated in Fig. 2a and 2b, respectively. The aptamer-GO complex will be adsorbed and stored in the small pieces of chromatography paper in microwells. The high surface-to-volume property of the porous paper improves reaction kinetics for rapid assays. Once the paper is dry, the device is ready to use. The pathogen test only needs the onestep loading of pathogen samples into detection microwells, even without the need of an additional washing step. Furthermore, this strategy takes cells directly as the detection target, without any complicated DNA treatment such as DNA extraction, amplification and purification. Therefore, this onestep ‘turn-on’ mechanism offers high simplicity and sensitivity in pathogen detection.
Aptamer concentration optimization
Aptamer concentration affects fluorescence quenching and recovery. To optimize the aptamer concentration, four different concentrations of the fluorescent labeled aptamer for L. acidophilus (i.e. FALA in Table 1) ranging from 0.1 to 1.0 μM were tested. Different fluorescence responses of different concentrations of the aptamer before and after quenching and after recovery are shown in Fig. 3. It can be seen that when GO was mixed with the aptamer, the fluorescence of the aptamer was significantly quenched (~70–85%) for all concentrations of the aptamer, and the fluorescence was restored due to the release of the fluorescent aptamer FALA from the GO surface, when 150.0 cfu mL−1 L. acidophilus was introduced. Some groups at low concentrations of aptamers show lower recovery, probably due to the effect from the paper. Because paper is not transparent, fluorescence from the aptamers in the middle of the paper may not be detectable. At lower concentrations, its percentages of this part of fluorescence in the total measured fluorescence might be relatively higher than those at higher concentrations. When choosing optimal aptamer concentrations, not only the recovery efficiency but also the recovered fluorescence intensity need to be considered, because both can directly affect the detection sensitivity. Given higher recovered fluorescence intensity and higher recovery rate (~85%) from 1.0 μM FALA, the aptamer concentration of 1.0 μM was chosen for subsequent experiments.
Fig. 3.
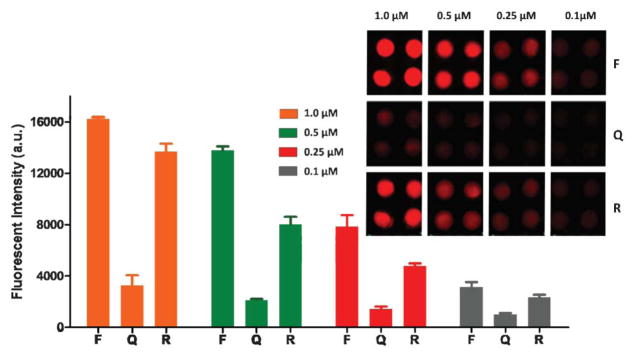
Optimization of the aptamer concentration. The inset is a fluorescence image of different concentrations of the aptamer for L. acidophilus (150.0 cfu mL−1) before quenching (F), after quenching (Q), and after fluorescence recovery (R).
Quenching time and recovery time
To achieve high detection sensitivity, low quenched fluorescence (i.e. low background) and higher recovered fluorescence intensities are desired. Different incubation times of 2, 4, 6, 8, and 10 min for fluorescence quenching and recovery were conducted and compared. As shown in Fig. 4, minimal quenched fluorescence can be achieved within ~8 min, whereas maximal recovered fluorescence can be obtained within ~10 min. In consequence, 8 min and 10 min were used as the quenching time and recovery time, respectively. Therefore, once a ready-to-use device is prepared (i.e. after the integration of aptamer-functionalized GO biosensors on the chip), the one-step assay in such a microfluidic system takes only ~10 min to complete, providing a simple method for fast pathogen detection.
Fig. 4.

Investigation of the quenching time (orange line) and recovery time (green line). L. acidophilus, 150.0 cfu mL−1; the aptamer FALA, 1.0 μM.
Calibration curve and limit of detection (LOD) for L. acidophilus
Under optimized conditions, various concentrations of L. acidophilus were tested on the chip. Fig. 5 shows different recovered fluorescence intensities versus various concentrations of L. acidophilus from 0–300 cfu mL−1. The control experiment (R0 in Fig. 5a) shows low fluorescence background when the test target was absent. With the concentration increase of the bacteria, higher fluorescence intensity was recovered. As shown in Fig. 5b, the linear range of the calibration curve is from 9.4 to 150.0 cfu mL−1 with a correlation coefficient of 99.7%. However, when the concentration of L. acidophilus increases above 150.0 cfu mL−1, the correlation becomes non-linear, indicated by a plateau in the curve. The LOD for the detection of L. acidophilus was calculated to be ~11.0 cfu mL−1, based on the usual 3σ. Multiple detection wells on the chip made it possible to complete the test of eight different concentrations of L. acidophilus in one assay within ~10 min, using the ready-to-use microfluidic system. The successful detection of L. acidophilus enabled us to explore the analysis of more complex pathogen systems.
Fig. 5.

Detection of various concentrations of L. acidophilus. (a) A fluorescent image of a 3 × 8 well array in the detection of L. acidophilus. R0–R7 represent different concentrations of L. acidophilus. R0: 0 cfu mL−1; R1: 300.0 cfu mL−1; R2: 150.0 cfu mL−1; R3: 75.0 cfu mL−1; R4: 37.5 cfu mL−1; R5: 18.8 cfu mL−1; R6: 9.4 cfu mL−1; and R7: 4.7 cfu mL−1. (b) Calibration plot of the recovered fluorescence versus the concentration of L. acidophilus from 0–300.0 cfu mL−1 (n = 8). The inset shows the linear calibration curve for the detection of L. acidophilus from 9.4–150.0 cfu mL−1 with R2 of 99.7%.
Multiplexed pathogen detection
In many cases of real samples, multiple pathogens could coexist. Multiplexed pathogen detection provides not only convenience from one assay, but also more information of multiple pathogens at a time. Therefore, on the basis of the one-step detection of L. acidophilus, we also investigated the capacity of our approach in the detection of more complex pathogen systems – multiplexed pathogen detection. Herein, we chose two common food-borne bacterial pathogens, S. aureus and S. enterica. Both can cause a range of illnesses, from minor vomiting/diarrhea to life-threatening diseases.58,59
To validate the selectivity of the approach for S. aureus and S. enterica, and avoid interference from each other, cross reaction was studied by testing these two pathogens with their corresponding and non-corresponding aptamers separately. As shown in Fig. 6, the top two rows of detection wells were prepared with the FASA-functionalized GO biosensors for S. aureus detection from laterally-orientated microchannels, while the bottom two rows of detection wells were prepared with the FASE-functionalized GO biosensor for S. enterica detection. When the blank sample and S. aureus were introduced from the left two and the middle two columns separately, only the four top middle microwells (rather than the bottom middle four microwells) showed significant fluorescence recovery, indicating the high specificity of the FASA-functionalized GO biosensor and no interference from S. enterica for the detection of S. aureus. Similarly, when S. enterica was introduced from the right two columns, only the right bottom four microwells showed strong fluorescence recovery, indicating no cross reaction observed from S. aureus for the detection of S. enterica as well.
Fig. 6.

Cross reaction investigation by testing S. aureus (106 cfu mL−1) and S. enterica (1375 cfu mL−1) with their corresponding and non-corresponding aptamers. 1.0 μM specific aptamers for S. aureus and S. enterica (i.e. FASA and FASE listed in Table 1) were first immobilized in detection wells of the top two and the bottom two rows, respectively. Blank and pathogen samples were separately introduced from vertically-oriented channels.
After ruling out cross reaction from each other, simultaneous detection of S. enterica from 0–1375 cfu mL−1 and S. aureus from 0–106 cfu mL−1 was performed using the microfluidic biochip integrated with aptamer-functionalized GO biosensors for S. enterica and S. aureus. The calibration curves for the simultaneous detection of S. enterica and S. aureus were generated by plotting the fluorescent intensity against the pathogen concentration, as shown in Fig. 7. The two curves in Fig. 7a show different shapes. The curve of S. enterica tends to be saturated at a lower concentration (1400 cfu mL−1) range than S. aureus (>106 cfu mL−1) does. This is probably due to different affinities of aptamers with GO and their corresponding pathogens. Because of this, the competitive binding of aptamers between GO and pathogens could lead to different saturation points by different concentrations of their target pathogens. The concentrations of S. aureus that we tested seem to be lower than its saturation point, whereas the upper concentration range of S. enterica that we tested tends to approach the saturation point. That is why these two curves present different shapes. The linear ranges of the calibration curves were 42.2–675.0 cfu mL−1 for S. enterica and 104–106 cfu mL−1 for S. aureus. Based on the usual 3σ, the LODs for S. enterica and S. aureus were approximated to be 61.0 cfu mL−1 and 800.0 cfu mL−1, respectively. This indicates comparable performance of our microfluidic approach in this aspect with other aptamer-based detection methods50,60 and some DNA amplification-based methods with DNA extraction, amplification and purification for S. enterica and S. aureus.61,62 Therefore, combining the advantages of high sensitivity and specificity from aptamer-based fluorescent assay with the integrated PDMS/paper hybrid microfluidic biochip, this approach provides not only high simplicity (e.g. one-step) and practicability, but also high-density pathogen information from its multiplexing capacity.
Fig. 7.

One-step simultaneous detection of S. enterica and S. aureus. (a) Calibration plots of the fluorescence intensity versus the pathogen concentration in the simultaneous detection of S. enterica and S. aureus. (b) Linear calibration curves for the detection of S. enterica and S. aureus, with R2 for S. enterica and S. aureus of 99.5% and 99.3%, respectively.
Sample test
Spiked samples were employed for assessing the accuracy of the presented method. S. enterica at concentrations of 84.4 and 168.8 cfu mL−1 and S. aureus at concentrations of 5.0 × 10⁴ and 5.0 × 10⁵ cfu mL−1 were spiked and tested by the microfluidic system. The test results are listed in Table 2. With 84.4 and 168.8 cfu mL−1 S. enterica spiked, 78.4 and 162.7 cfu mL−1 S. enterica were measured, with coefficients of variation (CV) of 7.3% and 5.5%, respectively. With the addition of 5.0 × 10⁴ and 5.0 × 10⁵ cfu mL−1 S. aureus, 5.2 × 10⁴ and 5.4 × 10⁵ cfu mL−1 S. aureus were measured, with coefficients of variation of 7.3% and 9.5%, respectively. The percent recovery for all spiked samples falls into the range between 92.9–107.8%, denoting fairly high accuracy of our approach.
Table 2.
Test results of spiked samples (n = 10)
| Pathogen | Spiked cfu mL−1 | Average measured cfu mL−1 | Coefficient of Variation | Percent Recovery |
|---|---|---|---|---|
| S. enterica | 84.4 | 78.4 | 7.3% | 92.9% |
| 168.8 | 162.7 | 5.5% | 96.4% | |
| S. aureus | 5.0 × 10⁴ | 5.2 × 10⁴ | 7.3% | 103.3% |
| 5.0 × 10⁵ | 5.4 × 10⁵ | 9.5% | 107.8% |
Conclusions
We have developed a simple, fast and multiplexed pathogen detection method using a PDMS/paper hybrid microfluidic system integrated with aptamer-functionalized GO biosensors. We first used L. acidophilus as a bacterium model to develop the microfluidic platform, and then successfully extended this method for the simultaneous detection of two infectious pathogens, S. aureus and S. enterica.
Our microfluidic system has four significant features. (i) It is simple. The detection of pathogenic microorganisms requires only a one-step detection procedure based on integrated aptamer-functionalized GO biosensors. In addition, this approach detects pathogen microorganisms directly, without cumbersome sample preparation procedures, making it feasible for field detection. (ii) The PDMS/paper hybrid microfluidic system can combine advantages from both substrates. For instance, the paper substrate facilitated biosensor immobilization, and avoided complicated surface treatment and aptamer probe immobilization in a PDMS only microfluidic system. (iii) The approach is fast. The assay takes only ~10 min once a ready-to-use microfluidic biochip is prepared. The 96-well array in the microfluidic system also aims at high-throughput analysis. Although the use of a fluorescent microscope limits its applications in field detection at the current stage, the use of a cellular phone camera and colorimetric detection should provide an option for resource-limited settings. (iv) This system has significant potential in the rapid detection of a wide variety of pathogens, including plant, animal, food-borne, biodefense and other infectious diseases.
Acknowledgments
Research reported in this publication was supported by the National Institute Of General Medical Sciences of the National Institutes of Health under Award Number SC2GM105584. The content is solely the responsibility of the authors and does not necessarily represent the official views of the National Institutes of Health. Financial support from the Interdisciplinary Research (IDR level 2) Program at the University of Texas at El Paso, University of Texas (UT) System for the STARS award, and State Key Laboratory of Bioreactor Engineering of China for the Open Project Fund are also gratefully acknowledged.
References
- 1.Paulitz TC, Belanger RR. Annu Rev Phytopathol. 2001;39:103–133. doi: 10.1146/annurev.phyto.39.1.103. [DOI] [PubMed] [Google Scholar]
- 2.Michino H, Araki K, Minami S, Takaya S, Sakai N, Miyazaki M, Ono A, Yanagawa H. Am J Epidemiol. 1999;150:787–796. doi: 10.1093/oxfordjournals.aje.a010082. [DOI] [PubMed] [Google Scholar]
- 3.Atrazhev A, Manage DP, Stickel AJ, Crabtree HJ, Pilarski LM, Acker JP. Anal Chem. 2010;82:8079–8087. doi: 10.1021/ac1013157. [DOI] [PubMed] [Google Scholar]
- 4.Cook M, Lynch WH. Appl Environ Microbiol. 1999;65:3042–3047. doi: 10.1128/aem.65.7.3042-3047.1999. [DOI] [PMC free article] [PubMed] [Google Scholar]
- 5.Soto E, Bowles K, Fernandez D, Hawke JP. Dis Aquat Org. 2010;89:199–207. doi: 10.3354/dao02204. [DOI] [PubMed] [Google Scholar]
- 6.Errampalli D, Saunders J, Cullen D. J Microbiol Methods. 2001;44:59–68. doi: 10.1016/s0167-7012(00)00240-2. [DOI] [PubMed] [Google Scholar]
- 7.Lee JG, Cheong KH, Huh N, Kim S, Choi JW, Ko C. Lab Chip. 2006;6:886–895. doi: 10.1039/b515876a. [DOI] [PubMed] [Google Scholar]
- 8.Rasooly A, Herold KE. Foodborne Pathog Dis. 2008;5:531–550. doi: 10.1089/fpd.2008.0119. [DOI] [PMC free article] [PubMed] [Google Scholar]
- 9.Wang L, Li PC. Anal Biochem. 2010;400:282–288. doi: 10.1016/j.ab.2010.01.017. [DOI] [PubMed] [Google Scholar]
- 10.Peham RJ, Recnik L, Grienauer W, Vellekoop JM, Nöhammer CWMH. Microsyst Technol. 2012;18:311–318. [Google Scholar]
- 11.Li H, Rothberg LJ. Anal Chem. 2004;76:5414–5417. doi: 10.1021/ac049173n. [DOI] [PubMed] [Google Scholar]
- 12.Kolbert CP, Persing DH. Curr Opin Microbiol. 1999;2:299–305. doi: 10.1016/S1369-5274(99)80052-6. [DOI] [PubMed] [Google Scholar]
- 13.Charlermroj R, Himananto O, Seepiban C, Kumpoosiri M, Warin N, Oplatowska M, Gajanandana O, Grant IR, Karoonuthaisiri N, Elliott CT. PLoS One. 2013;8:e62344. doi: 10.1371/journal.pone.0062344. [DOI] [PMC free article] [PubMed] [Google Scholar]
- 14.Janyapoon K, Korbsrisate S, Thamapa H, Thongmin S, Kanjanahareutai S, Wongpredee N, Sarasombath S. Clin Diagn Lab Immunol. 2000;7:977–979. doi: 10.1128/cdli.7.6.977-979.2000. [DOI] [PMC free article] [PubMed] [Google Scholar]
- 15.Swannell RPJ, Williamson FA. FEMS Microbiol Lett. 1988;53:315–324. [Google Scholar]
- 16.Hansen WL, Bruggeman CA, Wolffs PF. J Clin Microbiol. 2009;47:2629–2631. doi: 10.1128/JCM.00821-09. [DOI] [PMC free article] [PubMed] [Google Scholar]
- 17.Vimont A, Vernozy-Rozand C, Montet MP, Lazizzera C, Bavai C, Delignette-Muller ML. Appl Environ Microbiol. 2006;72:261–268. doi: 10.1128/AEM.72.1.261-268.2006. [DOI] [PMC free article] [PubMed] [Google Scholar]
- 18.Lemarchand K, Berthiaume F, Maynard C, Harel J, Payment P, Bayardelle P, Masson L, Brousseau R. J Microbiol Methods. 2005;63:115–126. doi: 10.1016/j.mimet.2005.02.021. [DOI] [PubMed] [Google Scholar]
- 19.Driskell JD, Kwarta KM, Lipert RJ, Porter MD, Neill JD, Ridpath JF. Anal Chem. 2005;77:6147–6154. doi: 10.1021/ac0504159. [DOI] [PubMed] [Google Scholar]
- 20.Tok JB, Chuang FY, Kao MC, Rose KA, Pannu SS, Sha MY, Chakarova G, Penn SG, Dougherty GM. Angew Chem, Int Ed. 2006;45:6900–6904. doi: 10.1002/anie.200601104. [DOI] [PubMed] [Google Scholar]
- 21.Zuo P, Ye BC. J Agric Food Chem. 2006;54:6978–6983. doi: 10.1021/jf061105+. [DOI] [PubMed] [Google Scholar]
- 22.You M, Chen Y, Peng L, Han D, Yin BC, Ye BC, Tan W. Chem Sci. 2011;2:1003–1010. [Google Scholar]
- 23.Bruno JG, Carrillo MP, Phillips T, Andrews CJ. J Fluoresc. 2010;20:1211–1223. doi: 10.1007/s10895-010-0670-9. [DOI] [PubMed] [Google Scholar]
- 24.Ohk SH, Koo OK, Sen T, Yamamoto CM, Bhunia AK. J Appl Microbiol. 2010;109:808–817. doi: 10.1111/j.1365-2672.2010.04709.x. [DOI] [PubMed] [Google Scholar]
- 25.Bruno JG, Kiel JL. Biosens Bioelectron. 1999;14:457–464. doi: 10.1016/s0956-5663(99)00028-7. [DOI] [PubMed] [Google Scholar]
- 26.Torres-Chavolla E, Alocilja EC. Biosens Bioelectron. 2009;24:3175–3182. doi: 10.1016/j.bios.2008.11.010. [DOI] [PMC free article] [PubMed] [Google Scholar]
- 27.Li XJ, Valadez AV, Zuo P, Nie Z. Bioanalysis. 2012;4:1509–1525. doi: 10.4155/bio.12.133. [DOI] [PMC free article] [PubMed] [Google Scholar]
- 28.Kovarik ML, Gach PC, Ornoff DM, Wang Y, Balowski J, Farrag L, Allbritton NL. Anal Chem. 2012;84:516–540. doi: 10.1021/ac202611x. [DOI] [PMC free article] [PubMed] [Google Scholar]
- 29.Kovarik ML, Ornoff DM, Melvin AT, Dobes NC, Wang Y, Dickinson AJ, Gach PC, Shah PK, Allbritton NL. Anal Chem. 2013;85:451–472. doi: 10.1021/ac3031543. [DOI] [PMC free article] [PubMed] [Google Scholar]
- 30.Liu P, Li X, Greenspoon SA, Scherer JR, Mathies RA. Lab Chip. 2011;11:1041–1048. doi: 10.1039/c0lc00533a. [DOI] [PubMed] [Google Scholar]
- 31.Fang X, Liu Y, Kong J, Jiang X. Anal Chem. 2010;82:3002–3006. doi: 10.1021/ac1000652. [DOI] [PubMed] [Google Scholar]
- 32.Zaytseva NV, Goral VN, Montagna RA, Baeumner AJ. Lab Chip. 2005;5:805–811. doi: 10.1039/b503856a. [DOI] [PubMed] [Google Scholar]
- 33.Jin SQ, Yin BC, Ye BC. Appl Environ Microbiol. 2009;75:6647–6654. doi: 10.1128/AEM.00854-09. [DOI] [PMC free article] [PubMed] [Google Scholar]
- 34.Li XJ, Xue X, Li PCH. Integr Biol. 2009;1:90–98. doi: 10.1039/b812987h. [DOI] [PubMed] [Google Scholar]
- 35.Li XJ, Huang J, Tibbits GF, Li PCH. Electrophoresis. 2007;28:4723–4733. doi: 10.1002/elps.200700312. [DOI] [PubMed] [Google Scholar]
- 36.Cheng CM, Martinez AW, Gong J, Mace CR, Phillips ST, Carrilho E, Mirica KA, Whitesides GM. Angew Chem, Int Ed. 2010;49:4771–4774. doi: 10.1002/anie.201001005. [DOI] [PubMed] [Google Scholar]
- 37.Li XJ, Li PCH. Anal Chem. 2005;77:4315–4322. doi: 10.1021/ac048240a. [DOI] [PubMed] [Google Scholar]
- 38.Li XJ, Li PCH. Methods Mol Biol. 2006;321:199–225. doi: 10.1385/1-59259-997-4:199. [DOI] [PubMed] [Google Scholar]
- 39.Zhu Y, Murali S, Cai W, Li X, Suk JW, Potts JR, Ruoff RS. Adv Mater. 2010;22:3906–3924. doi: 10.1002/adma.201001068. [DOI] [PubMed] [Google Scholar]
- 40.Li X, Chen Y, Li PC. Lab Chip. 2011;11:1378–1384. doi: 10.1039/c0lc00626b. [DOI] [PubMed] [Google Scholar]
- 41.Li XJ, Ling V, Li PCH. Anal Chem. 2008;80:4095–4102. doi: 10.1021/ac800231k. [DOI] [PubMed] [Google Scholar]
- 42.Xia Y, Whitesides GM. Annu Rev Mater Sci. 1998;28:153–184. [Google Scholar]
- 43.Tang SKY, Whitesides GM. Optofluidics: Fundamentals, Devices and Applications. 2010:7–31. [Google Scholar]
- 44.Li XJ, Nie ZH, Cheng CM, Goodale AB, Whitesides GM. Proc Micro Total Analysis Systems. 2010;14:1487–1489. [Google Scholar]
- 45.Liu XY, Mwangi M, Li XJ, O’Brien M, Whitesides GM. Lab Chip. 2011;11:2189–2196. doi: 10.1039/c1lc20161a. [DOI] [PubMed] [Google Scholar]
- 46.Nie Z, Nijhuis CA, Gong J, Chen X, Kumachev A, Martinez AW, Narovlyansky M, Whitesides GM. Lab Chip. 2010;10:477–483. doi: 10.1039/b917150a. [DOI] [PMC free article] [PubMed] [Google Scholar]
- 47.Martinez AW, Phillips ST, Whitesides GM, Carrilho E. Anal Chem. 2010;82:3–10. doi: 10.1021/ac9013989. [DOI] [PubMed] [Google Scholar]
- 48.Cao L, Cheng L, Zhang Z, Wang Y, Zhang X, Chen H, Liu B, Zhang S, Kong J. Lab Chip. 2012;12:4864–4869. doi: 10.1039/c2lc40564d. [DOI] [PubMed] [Google Scholar]
- 49.Hamula CLA, Zhang HQ, Guan LL, Li XF, Le XC. Anal Chem. 2008;80:7812–7819. doi: 10.1021/ac801272s. [DOI] [PubMed] [Google Scholar]
- 50.Joshi R, Janagama H, Dwivedi HP, Kumar TMAS, Jaykus LA, Schefers J, Sreevatsan S. Mol Cell Probes. 2009;23:20–28. doi: 10.1016/j.mcp.2008.10.006. [DOI] [PubMed] [Google Scholar]
- 51.Cao XX, Li SH, Chen LC, Ding HM, Xu H, Huang YP, Li J, Liu NL, Cao WH, Zhu YJ, Shen BF, Shao NS. Nucleic Acids Res. 2009;37:4621–4628. doi: 10.1093/nar/gkp489. [DOI] [PMC free article] [PubMed] [Google Scholar]
- 52.Chang YC, Yang CY, Sun RL, Cheng YF, Kao WC, Yang PC. Sci Rep. 2013;3:1863. doi: 10.1038/srep01863. [DOI] [PMC free article] [PubMed] [Google Scholar]
- 53.Zhao W, Schafer S, Choi J, Yamanaka YJ, Lombardi ML, Bose S, Carlson AL, Phillips JA, Teo W, Droujinine IA, Cui CH, Jain RK, Lammerding J, Love JC, Lin CP, Sarkar D, Karnik R, Karp JM. Nat Nanotechnol. 2011;6:524–531. doi: 10.1038/nnano.2011.101. [DOI] [PMC free article] [PubMed] [Google Scholar]
- 54.Huang CC, Chang HT. Chem Commun. 2008:1461–1463. doi: 10.1039/b718752a. [DOI] [PubMed] [Google Scholar]
- 55.Chang H, Tang L, Wang Y, Jiang J, Li J. Anal Chem. 2010;82:2341–2346. doi: 10.1021/ac9025384. [DOI] [PubMed] [Google Scholar]
- 56.Loh KP, Bao Q, Eda G, Chhowalla M. Nat Chem. 2010;2:1015–1024. doi: 10.1038/nchem.907. [DOI] [PubMed] [Google Scholar]
- 57.Lu CH, Yang HH, Zhu CL, Chen X, Chen GN. Angew Chem, Int Ed. 2009;48:4785–4787. doi: 10.1002/anie.200901479. [DOI] [PubMed] [Google Scholar]
- 58.Bost KL, Bento JL, Ellington JK, Marriott I, Hudson MC. Infect Immun. 2000;68:5075–5083. doi: 10.1128/iai.68.9.5075-5083.2000. [DOI] [PMC free article] [PubMed] [Google Scholar]
- 59.Swartz MN. Clin Infect Dis. 2002;34:S111–122. doi: 10.1086/340248. [DOI] [PubMed] [Google Scholar]
- 60.Zelada-Guillen GA, Sebastian-Avila JL, Blondeau P, Riu J, Rius FX. Biosens Bioelectron. 2012;31:226–232. doi: 10.1016/j.bios.2011.10.021. [DOI] [PubMed] [Google Scholar]
- 61.Ramesh A, Padmapriya BP, Chrashekar A, Varadaraj MC. Mol Cell Probes. 2002;16:307–314. doi: 10.1006/mcpr.2002.0428. [DOI] [PubMed] [Google Scholar]
- 62.Okamura M, Ohba Y, Kikuchi S, Takehara K, Ikedo M, Kojima T, Nakamura M. Avian Dis. 2009;53:216–221. doi: 10.1637/8450-081808-Reg.1. [DOI] [PubMed] [Google Scholar]