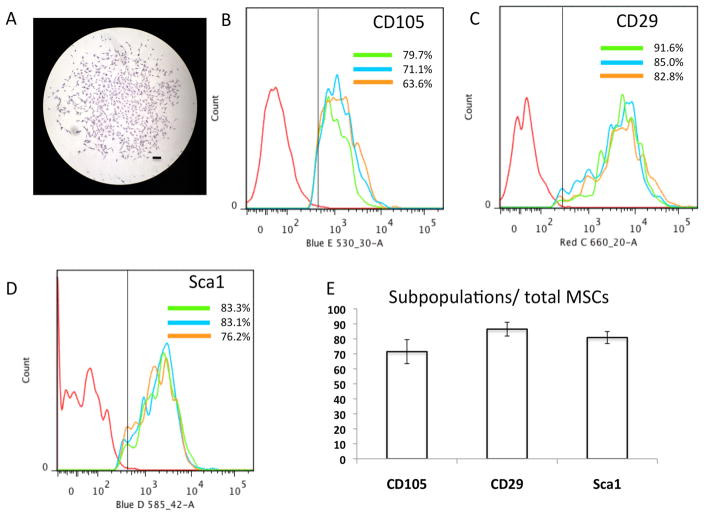
Figure 1. MSC isolation and characterization.
(A) Representative CFU-F colony in the MSC culture visualized by crystal violet staining at day 7. (Scale bars=200μm) (B) Representative FACS histograms showing CD105 expression in 3 different isolations of MSCs. (C) Representative FACS histograms showing CD29 expression in 3 different isolations of MSCs. (D) Representative FACS histograms showing Sca1 expression in 3 different isolations of MSCs. (E) Quantification of the CD105, CD29, Sca1 subpopulations in total MSCs. Data are represented as the mean ± SD of three independent experiments performed.

