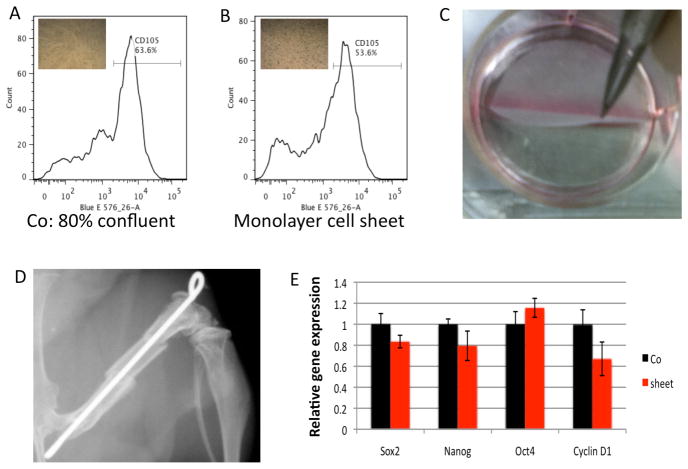
Figure 2. MSC sheet generation, characterization, and transplantation.
(A) Quantification of the CD105 subpopulation in MSCs at 80% confluence. (B) Quantification of the CD105 subpopulation in MSCs from cell sheets. (C) MSC sheets are easily detached from the dish after 24-hours of culture. (D) The x-ray depicts the mouse femoral bone defect and allograft transplantation model used in combination with MSC direct seeding and MSC sheets. (E) Comparison of changes in stem cell marker gene expression before (Co) and after formation of the MSC sheet (Sheet). Data are means ± SD of three independent experiments performed in duplicate and the control gene expression level was set at 1.

