

Abstract
Clinical trials to ameliorate hypoxia as a strategy to relieve the radiation resistance it causes have prompted a need to assay the precise extent and location of hypoxia in tumors. Electron Paramagnetic Resonance oxygen imaging (EPR O2 imaging) provides a non-invasive means to address this need. To obtain a preclinical proof of principle that EPR O2 images could predict radiation control, we treated mouse tumors at or near doses required to achieve 50 percent control (TCD50).
Mice with FSa fibrosarcoma or MCa4 carcinoma were subjected to EPR O2 imaging and immediately radiated to a TCD50 or TCD50 ±10 Gy.. Statistical analysis was permitted by collection of ~ 1300 tumor pO2 image voxels, including the fraction of tumor voxels with pO2 less than 10 mm Hg (HF10). Tumors were followed for 90 days (FSa) or 120 days (MCa4) to determine local control or failure.
HF10 obtained from EPR images showed statistically significant differences between tumors that were controlled by the TCD50 and those that were not controlled for both FSa and MCa4. Kaplan-Meier analysis of both types of tumors showed ~90% of mildly hypoxic tumors were controlled (HF10<10%), and only 37% (FSA) and 23% (MCa4) tumors controlled if hypoxic.
EPR pO2 image voxel distributions in these ~0.5 ml tumors provide a prediction of radiation curability independent of radiation dose. These data confirm the significance of EPR pO2 hypoxic fractions. The ~90% control of low HF10 tumors argue that ½ ml subvolumes of tumors may be more sensitive to radiation and may need less radiation for high tumor control rates.
Keywords: oxygen, imaging, tumors, radiotherapy, TCD50
Introduction
It has been just over a century since Schwarz first observed the sensitizing effect of oxygen on tissue response to radiation (1). This has led to many attempts to exploit modification of tumor hypoxia to enhance cancer control with radiation in humans. Among hypoxic modifiers hyperbaric oxygen (HBO) (2,3), carbogen and radiation sensitizers (4) have been attempted in human trials with mixed, but suggestive results. Recently a meta-analysis of all hypoxic modifier studies in head and neck cancer has been performed showing an improved tumor control and survival when any hypoxic modification is given in conjunction with curative radiotherapy, but, so far, a general application to the clinic has been limited (5,6).
These studies were attempted in patients with remarkably little feedback from patient and tumor specific studies to determine the individual extent of hypoxia. An assumption of hypoxic universality was made. This was based on the lack of available methodology to distinguish tumors that were hypoxic, and which might have benefitted from hypoxic intervention from those which were well oxygenated/mildly hypoxic and would not benefit from the intervention. Studies e.g. (7) have determined that the mean or median pO2 in tumors, obtained with an invasive Eppendorf electrode can predict of success or failure of radiation treatment. EPR spectra from implanted particulate spin probe broaden in proportion to the local concentration of oxygen. This has allowed point sampling of local oxygen concentrations and shown its ability to predict radiation sensitivity (8–10). The difficulty in quantification of pO2 or hypoxia with radionuclide reductive retention assays has limited their use (11). These measurements motivate the development of imaging techniques which can survey entire tumors and provide quantitative (and thereby reproducible) tumor oxygenation patterns and statistical summaries of those patterns. This would allow not only identification of whole tumor hypoxic fractions, but would allow identification of resistant tumor sub-regions that require increased radiation dose. Electron paramagnetic resonance oxygen images (EPR O2 images) provide three dimensional distributions of pO2 in native, unperturbed conditions using injected non-toxic small molecule pO2 reporters of the environment (11–15). Spectroscopic imaging allows direct interrogation of the highly specific and sensitive EPR spectral response of these reporter molecules with spatial resolution of ~1 mm, and pO2 resolution of 3 mm Hg (14). We have shown previously that EPR O2 images provide accurate tumor oxygenation information when compared with fluorescence Oxylite probe, both in terms of pO2 values and their spatial distribution (15) in half ml FSa fibrosarcomas.
Our previous work in FSa fibrosarcomas radiated with a single dose in the range between 20–50 Gy demonstrated that hypoxic fraction of voxels < 10 mm Hg (HF10) obtained from EPR O2 images strongly and independently correlated with tumor control (16). Bivariate analysis of these irradiated tumors showed that they could be divided into failed and controlled populations based on both dose and the HF10. The sloped HF10 vs. dose boundary line separating failed and controlled tumors allowed us to predict, more accurately, the dose increase necessary to control a given tumor.
Taking this a step further, we hypothesize that oxygenation information obtained from EPR O2 images taken before the treatment will allow us to predict the response of an individual tumor to the single dose radiation at the TCD50 level, or a small range of doses near the TCD50. By the definition, TCD50 radiation dose should lead to a local control of 50% of tumors. Hypoxic tumors treated with or near the TCD50 dose would be predicted to more likely to recur, whereas mildly hypoxic tumors would be more likely be controlled. The goal of this study was to demonstrate that EPR O2 images will predict which tumors will be controlled after treating with a TCD50 radiation dose. To demonstrate the universality of this approach we have included both FSa fibrosarcoma and MCa4 adenocarcinoma, differing in their radiosensitivity with TCD50s of 38 and 69 Gy, respectively.
Development of this approach towards the clinical use will enable dose-painting. Identification of hypoxic sub-volumes within a tumor using EPR O2 images would allow adjusting the radiation treatment plan with modification of the dose according to the spatial localization of these sub-volumes.
Materials and Methods
Animals and tumors
A total of 38 C3H/HeN:Hsd (Harlan Sprague-Dawley, Indianapolis, IN) female mice, 6–8 weeks old, were injected IM with 5×10⁵ FSa F9 generation fibrosarcoma cells (provided as F6 generation cells by Kathryn Mason, M.D. Anderson Cancer Center,Houston, TX) into the right hind leg. The tumors grew to 350–500 uL within 7–10 days. At the time of treatment tumor volume was 488±50 μl. The same procedure was used for MCa4 F6 tumors (cell line from ATCC) injected in the gastrocnemius of the right leg of C3H/HeN:Hs d mice. Tumors were treated at a volume of 312±84 μl. The mice underwent first EPR imaging and then were immediately treated with radiotherapy, under the same level of isofluorane aneasthesia (details below). Both cells lines underwent IMPACT1 PCR screening for murine pathogens at Missouri University’s IDEXX RADIL diagnostic laboratories: (http://www.idexxbioresearch.com/radil/Health_Monitoring/Mouse_PCR_Profiles/index.html). No pathogens on the IMPACT1 list were found. For tumor injection only material from F9 and F6 passaging generations were used. All animal experiments were done according to the USPHS “Policy on Humane Care and Use of Laboratory Animals” and the protocols were approved by the University of Chicago Institutional Animal Care and Use Committee (ACUP No. 69681). The University of Chicago Animal Resources Center is an Association for Assessment and Accreditation of Laboratory Animal Care–approved animal care facility.
Tumor control
The tumors were measured twice weekly. Local failure was declared when tumor reached twice its original volume according to three crossed diameter measurements. The tumors were deemed to have been controlled at 90 days after radiotherapy if the tumor did not fail. No FSa tumors controlled at 90 days showed any regrowth, much less that approaching twice its volume. MCa4 tumors did fail later than 90 days so that the time for assessment of MCa4 tumors was extended to 120 days. Because MCa4 failures were much slower, tumors showing slow regrowth after 90 days were sent for histologic analysis to determine the presence of tumor vs scar for legs treated to the higher doses necessary for tumor control.
Radiotherapy
Radiation doses were delivered in a single fraction given locally to the tumor, using 250 KVp X-rays from a Phillips RT 250 (Phillips, East Haven, CT) hardened with 0.5-mm Cu, giving a half-value layer of 1.9 mm Cu. The dose rate was ~3.5 Gy/min. This dose rate was achieved using a jig that rigidly attached to the RT 250 bringing the tumor center to 28 cm from the source. TCD50 for FSa tumors in air-breathing animals was previously determined. Those measurements indicated a TCD50 of 33.8 +0.6/−0.2 Gy for animals breathing air, with no oxygenation manipulation, consistent with the published values (17). MCa4 tumors were irradiated with a narrow range of doses, between 60–80 Gy, near TCD50 of 69 Gy reported in the literature (18). The tumors were immobilized for radiotherapy with a vinyl polysiloxane dental mold half circumference cast (GC America, Alsip, IL), which was used also for EPR imaging. Radiation dose was corrected for the effect for the cast. All other aspects of animal preparation for radiotherapy were identical to that for imaging.
Oxymetric spin probe
For each image of an FSa fibrosarcoma grown in a mouse leg, 20 mg/25-g mouse (0.8 g/kg, equivalent to 0.56 mmol/kg animal weight) of OX063 trityl(methyl-tris[8-carboxy-2, 2,6,6-tetrakis[(2-hydroxyethyl]benzo[1,2-d:4,5-d0]bis[1,3]dithiol-4-yl] trisodium salt; molecular weight, 1,427; GE Healthcare, London, UK) was injected in 0.3 mL of deionized water (pH, 7.6; tonicity, 280 mOsm) and 13.1 mg/ 25g mouse/hr was infused via tail vein over the 30 min during which two 10 minute EPR oxygen images were obtained. This procedure allowed to maintain approximately constant level of oximetric spin probe in the tumor, as was monitored by the EPR signal. For MCa tumors, of OX063d24 trityl(methyl-tris[8-carboxy-2, 2,6,6-tetrakis[(2-hydroxy-2d2-ethyl]benzo[1,2-d:4,5-d0]bis[1,3]dithiol-4-yl] trisodium salt was used at the same concentrations used for native isotope abundance OX063. Deuterated OX063 has a peak to peak linewidth of 8 mT, half that of native isotope abundance. This allowed the use of gradients of strength half that for native abundance giving higher signal to noise.
Anesthesia, immobilization, and preparation of mice
The mice were prepared for imaging as described by Elas et al.(16). In brief, the mice inhaled sufficient isoflurane vapor (1–2%) to achieve normal breathing at 1 Hz and the absence of voluntary movement. Vinyl polysiloxane dental mold material, encompassing approximately one-half of the circumference of the leg was used to immobilize the tumor-bearing leg (Fig. 1). The anesthesia was begun 40 minutes before EPR imaging. The skin temperature was maintained at 33.5 °C (corresponding to 37°C of animal rectal temperature) using opposed heating lamps and measured with a Physitemp (Clifton, NJ) digital thermometer, during all procedures.
Figure 1.
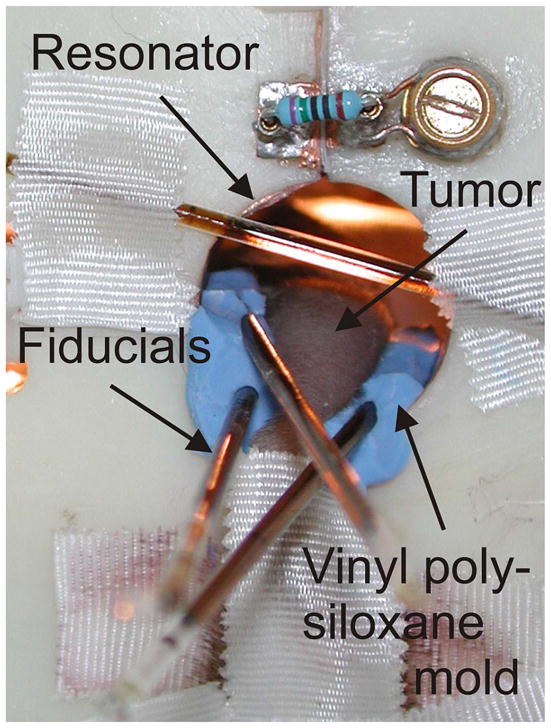
Mouse leg with FSa tumor in the resonator. Vinyl polysiloxane dental mold material (blue) was used to support and immobilize the leg.
EPR Imaging
The general design of the 250 MHz pulse imager used in this study is described elsewhere (19); a new transmit/receive switch, used here enabling 1 KW peak pulse power operation with a reflection resonator, is described elsewhere (20). 62.5 and 250W of RF power, respectively, was used to generate an ESE sequence with π/2 and π pulses with durations of 35 ns (19). This used a fast, switched attenuator to produce the pulses of equal length and different tip angles. The influence of the system RF pulse frequency bandpass profile on image intensity was compensated as described in (19).
EPR O2 Imaging for FSa Fibrosarcomas
FSa fibrosarcomas were imaged with ESE alone. We acquired five images with delays between the pulse pairs, τ, logarithmically spaced in the range from 630 ns and 2.4 μs. For each image, we acquired 208 projections and 53 interleaved baselines for artifact suppression. For FSa fibrosarcoma imaging the gradient amplitude was 15 mT/m; an equal solid angle scheme (21) was used for gradient directional spacing. For MCa4 tumors, O2 imaging was accomplished with an extra inversion recovery pulse before the ESE image readout. The use of deuterated nitroxide allowed the gradient amplitude to be reduced to 7.5 mT/m.
The ESE data acquisition and processing methods are discussed in detail elsewhere (19). Briefly, the transverse relaxation rate R2 =1/γT2, where γ is the electron gyromagnetic ratio, was evaluated by fitting the signal intensity in every voxel of the image to an exponential decay function of 2*τ. The fitted logarithmic slope of the function, R2, is a linear function of pO2. This slope is virtually independent of fluid viscosity so that aqueous calibration provides a reliable estimate of this slope. The extrapolation of the exponential decay function to τ=0 provides an estimate of the EPR line shape integral. This integral can be related to the number of spins in a voxel by comparison with homogeneous solution image. The ESE T2 image acquisition time was 10 minutes.
Assuming that the spin probe uniformly distributes in the voxel volume, the median spin probe concentration was 0.2–0.4 mM in different tumors. However, the spin probe is a tri-anionic acid of molecular weight 1427 D, excluded from intracellular distribution (22). Since the spin probe may not uniformly occupy the tissue volume, the local concentration may be underestimated by a factor of 2 to 5. Based on saline solution measurements of R2 dependence on spin probe concentration, a general concentration correction of 30 mG/mM was applied, using regional amplitude concentration estimates of concentration to the pO2 values, corresponding to a pO2 shift of 6–12 mm Hg to all oxygen values for tumor pO2 values. The correction corresponds to an estimated exclusion volume of 3.5. This empiric correction was applied to account for the spin probe self-relaxation or broadening effect.
EPR O2 Images for MCa4 carcinomas
EPR technique evolved and improved between experiments with FSa fibrosarcomas and MCa4 carcinomas. A pulse sequence was developed to reduce the need for concentration correction of relaxation rates to below measurement uncertainty (23). Inversion recovery sequences to estimate voxel pO2 values for MCa4 carcinomas avoid this concentration in correction. Data (not presented) indicated that in normal saline solutions, concentration relaxation of trityl spin probe was diminished by a factor of 5, rendering a correction unnecessary. Magnetization inversion was created using a 35 ns π applied at eight different time intervals T, referred to as inversion times, before a spin echo image readout with fixed τ optimized for signal to noise to 700 ns, 200 ns greater than the system dead time. Seven inversion times logarithmically spaced from 650 ns to 4 microseconds were used. An eighth ESE with no inversion pulse was used to simulate infinite recovery time and for the purpose of fitting to an exponential inversion recovery, was assigned to the inversion time of 16 microseconds. Nonimaging measurements showed this to give relaxation rates no different than longer time assignments to within a 0.2 mm Hg equivalent relaxation rate uncertainty. No concentration correction was used for these voxel pO2 estimates, and the IRESE T1 image acquisition time was 10 minutes.
Location of tumor voxels in EPR image
Holes were molded in the vinyl polysiloxane cast that tightly accommodated two or three 1-mm inner diameter, 3–4-cm-long borosilicate glass sample tubes containing either 10 mM OX063 (EPR imaging) or water (MRI) as fiducial markers for co-registration of EPR imaging with MRI (Fig. 1). Rapid acquisition with refocused echoes spin-echo images were acquired at 9.4 T on an Omega Bruker/GE imager (Billerica, MA) with the following parameters: repetition time, 3,000 ms; effective excitation time, 56ms; field of view, 3.0 cm; matrix size, 256×256; slice thickness, 1mm; NEX, 1; and rare factor, 8. The MRI with the water fiducials was registered with an image of the EPR fiducials. Registration of the EPR image and MRI images was done in several steps, using in-house software written in MATLAB, version 7.11 (Mathworks, Cambridge, MA), allowing for human intervention. The initial registration estimate was done using an alignment of surfaces of the external fiducials. Next, a manual fine-matching of the tumor EPR image and MRI surfaces was performed, going through all slices within the tumor volume in three directions. A slice of the EPR image with the MRI-defined tumor voxels is shown as the red contour in Fig. 2.
Figure 2.
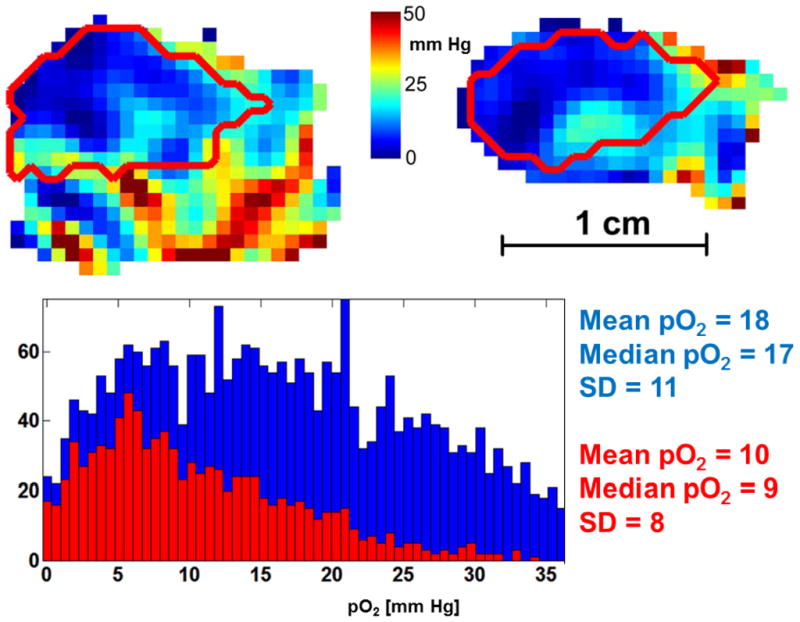
EPR oxygen image of a murine leg with MCa4 tumor. Saggital (left) and coronal (right) slices are presented, with tumor outline obtained from MRI (red). Color bar shows pO2 scale in the range 0–50 mm Hg. Histogram shows pO2 values from the whole image (blue) and from the tumor volume only (red). The maximal pO2 values were as high as 50 mm Hg in appr. 10 voxels the leg and 35 mm Hg in single voxels in the tumor.
Statistical Analysis
Several tumor oxygenation characteristics were considered, including the median oxygen values of the tumor voxels and fraction of tumor voxels with <10 mm Hg oxygen tension (HF10). The fractions of tumor voxels less than these values were evaluated for each tumor. Significance of the comparison of tumors that failed radiation and those that were controlled was estimated via a Student’s two tailed t-test. p values <0.05 were considered significant. The significance of HF10 <10% as a predictor for failure for FSa fibrosarcomas and the HF< 10% or HF<15% for the MCa4 tumors in the Kaplan-Meier survival curves was analyzed using Wilcoxon test. The analyses were performed using the STATA, version 9, statistical package (Stata-Corp, College Station, TX).
Results
Hypoxia visualized in EPR O2 images
EPR oxygen images of MCa4 carcinoma tumor show severe hypoxia in the tumor in comparison to much better oxygenated normal leg areas, as seen from the example shown in Fig. 2. Both histograms of the pO2 values from the leg and from the tumor are skewed towards lower pO2 values, with high number of voxels displaying near zero pO2. Median pO2 in the tumor at 9 mm Hg was half of that in the whole leg.
For the tumor volume as defined from the MRI (red outline in Fig. 2), several oxygenation statistics were determined from the EPR O2 images including median pO2, and fraction of the voxels with pO2 less than 10 mm Hg. HF10 values determined from EPR O2 images varied between tumors from 0 to 27% (FSa) and from 0 to 64% (MCa4). The oxygen images were acquired within 10 minutes, and oxygen partial pressure shown in the images is therefore averaged over this time.
Treatment with TCD50 dose
The TCD50 was determined using the procedure described by Suit (24) as previously reported (16). FSa fibrosarcoma tumors as uniform in size as possible, but differing in oxygenation, were treated with a single dose of 33.8 Gy. After 90 days 37% of FSa tumors (14 out of 38) regrew, whereas 63% (24/38) were controlled. MCa4 tumors of approximately the same size were treated with a range of 60–80 Gy, which is a narrow range around TCD50 value of 69 Gy consistent with the literature (18). This resulted in tumor growth inhibition and regression. In some cases a regrowth occurred, but appeared to be slower than for FSa fibrosarcomas. In case of MCa4 tumors, at 120 days after treatment 60% (24 out of 40) regrew, and 40% (16 out of 40) were controlled. Another subset of MCa4 mice, distributed more tightly around the TCD50 dose, i.e. animals treated with 66–72 Gy (69 ± 3 Gy) was also analyzed.
Table 1 shows the mean of HF10 and median pO2 from controlled and failed FSa and MCa4 tumors. HF10 significantly distinguishes failure from control in the two populations. This can also be clearly seen in Figure 3, showing Kaplan-Meier plots of the two populations of mice defined by the 10% threshold for the HF10. For 0.5 ml FSa tumors those whose EPR O2 images demonstrated hypoxia, with HF10 greater than 10%, 7/19 (36.8%) were controlled. For mildly hypoxic tumors, based on the EPR O2 images with HF10 less than 10% 17/19 (90%) were controlled. In case of MCa4 carcinoma, only 23% (7 out of 30) of hypoxic tumors were controlled, and 90 % (9 out of 10) of mildly hypoxic tumors with HF10,<10% were controlled at 120 days after therapy. In the smaller subset of MCa4 tumors treated with 66–72 Gy, with HF10=15% as a threshold value, 15% (3/17) of hypoxic tumors were controlled, and 80% (4/5) of mildly hypoxic, i.e. with HF10<15% were controlled at 120 days after therapy.
Table 1.
Significance of EPR O2 images statistics from each tumor, distinguishing the population of radiation controls from radiation failures. FSa fibrosarcoma tumors were treated with a single dose of 33.8 Gy, and MCa4 tumors were treated with a single dose from 60–80 Gy, or 66–72 Gy range. Tumors were observed for 90 (FSa) and 120 (MCa4) days, and a local failure was declared when a tumor reached twice its original volume.
| Mean of parameters from controlled tumors | Mean of parameter from failed tumors | p (Student’s 2-tail t-test) | |
|---|---|---|---|
| FSA, n=38 | (n=24) ± SEM | (n=14) ±SEM | |
| Median pO2 | 31 ± 1 mm Hg | 28 ±2 mm Hg | 0.181 |
| HF10 | 7 ± 1.7 % | 11.7 ± 1.7 % | 0.041 |
| MCa4, n=40 (60–80 Gy) | (n=16) ± SEM | (n=24) ±SEM | |
| Median pO2 | 22 ± 6 mm Hg | 14 ± 3 mm Hg | 0.0004 |
| HF10 | 19.2 ± 3.9 % | 35.1 ± 2.7 % | 0.007 |
| MCa4, n=25 (66–72 Gy) | (n=7) ± SEM | (n=18) ±SEM | |
| Median pO2 | 24 ± 9 mm Hg | 13 ± 1 mm Hg | 0.00004 |
| HF10 | 15.8 ± 6.6 % | 39.2 ± 3.2 | 0.0017 |
Figure 3.

Kaplan-Meier plot showing the percent of animals with local tumor control as a function of time after treatment with a single dose of X-rays. A. FSA tumors were treated with 33.8 Gy. 90% of tumors (17 out of 19) with HF10 less than 10% were controlled at 90 days after treatment. In contrast, only 37% of tumors (7 out of 19) were controlled at 90 days when their HF10 was higher than 10%. B. MCa4 tumors were treated with a single dose in the range of 60–80 Gy. 90% of tumors (9 out of 10) with HF10<10% were controlled at 120 days after treatment, whereas 23% (7 out of 30) with HF10≥10% were controlled at 120 days. Wilcoxon test shows that HF10 >10% threshold was a significant predictor of tumor failure (p=0.0138 for FSa, and p=0.0072 for MCa4 tumors). C. Subset of MCa4 tumors treated with a single dose in the range of 66–72 Gy. 80% of tumors (4 out of 5) with HF10≤15% were controlled at 120 days after treatment, whereas 15% (3 out of 20) with HF10>15% were controlled at 120 days. Wilcoxon test shows that HF10 >15% threshold was a significant predictor of tumor failure (p=0.0193).
HF10 >10% was a significant predictor of tumor failure as determined by Wilcoxon analysis of survival data (p=0.0138 for FSa, and p=0.0072 for MCa4, for MCa4 subset HF10>15% p=0.0193). The mouse survival remarkably reflects that of cervical cancer patients presented in Hockel et al. (25) with the time scale converted from days to months, reflecting, roughly, the factor of 30 difference in species lifetimes. The threshold for the sampling in both measurements was 10 mm Hg and there is a rough doubling of survival probability in both subject sets for mildly hypoxic tumors vs. hypoxic tumors.
Discussion
EPR O2 images are a direct, quantitative and noninvasive method of assessing tumor oxygenation (26). pO2 statistics determined from tumor images predicts the tumor response to a single dose of radiation. Hypoxic fraction of less than 10 mm Hg at the level of 10% divided tumors controlled after therapy from those that failed the therapy as seen dramatically in Fig. 3. It is clear that the mildly hypoxic tumors with HF10 less than 10% are controlled with 90% probability. For hypoxic tumors, defined here as having an HF10 greater than 10%, the control probability decreases dramatically to less than 37% for FSa tumors, and to 23% for MCa4 tumors. However, as indicated from the statistical analysis, the 90% vs. 37% control argues that the populations separated by HF10 are significantly different. It is tempting observe that for tumors with HF10 less than 10%, the TCD50 is a TCD90. It suggests that regions of tumors may be highly hypoxic and require higher radiation doses and that regions that are relatively well oxygenated or mildly hypoxic may require less radiation for equivalent control. If such images were available for human use, EPR O2 images could be used for dose painting (27–29). Both FSa and MCa4 tumor models are well characterized radiobiologically (16–18). Instead of a fixed TCD50 dose as we used for FSA tumors, for MCa4 we have used the dose interval of ± 10Gy around their TCD50. This data was obtained from our own measurement of the MCa4 tumor TCD50. Our reason was to provide early indication that the hypoxic fraction might be useful in this second tumor type in predicting tumor response to radiation. Moreover, with varying dose, one might expect that the effect of the HF10 on tumor control would be weakened. In contrast, our results show high statistical significance of HF10 in predicting tumor control. The analysis of the smaller subset of animals, treated with 66–72 Gy, confirmed our conclusions.
The specific choice of 10 mm Hg as the definition of voxel hypoxic fraction is based on earlier radiobiological studies. In oxygen electrode measurements in human tumors, median pO2 at the level of 10 mmHg has been used to distinguish lymph nodes or tumors that responded to therapy from those that did not respond (7,30,31).
What is more, the cellular response to hypoxia, i.e. the HIF system was induced at half maximal level at 10–15 mm Hg (32). In tumors, pO2 of approximately 10 mmHg represents a critical threshold for energy metabolism (33).
The higher significance of the HF10 relative to lower threshold pO2 values in our measurements likely derives from the larger number of voxels with pO2 less than 10 mm Hg relative to the number of voxels in samples obtained with lower thresholds.
Interestingly, the 10 mm Hg threshold produces a Kaplan Meier survival curve in both fibrosarcomas and adenocarcinomas familiar from human tumor measurements provided by invasive micro-electrode measurements. The significance of the survival difference, seen in Fig. 3 is quite high, as noted above.
In our previous work with FSa fibrosarcoma irradiated with varied radiation doses from 20 to 50 Gy we analyzed the effect of different pO2 statistics derived from the tumor EPR O2 images on the results of the treatment. A range of pO2 thresholds was used to define the hypoxic fraction. Statistics that characterized the entire tumor such as mean and median pO2 in the tumor showed a much weaker association with tumor control. Analysis with mean and median pO2 as the tumor statistic gave substantially lower pseudo-R2 correlation on bivariate logistical analysis. They also demonstrated increased misclassification rates. However, given the large gradients and pO2 variations in the image, as in Fig. 2, such overall descriptors of the oxygenation are not expected to show good correlation with tumor control. Interestingly, median pO2 was highly significant for the MCa4 tumor.
EPR spectroscopic oximetry has been used previously to predict sensitivity to radiation in multiple experimental settings (10,34). This method has proven to be useful to identify possible areas of resistance during modulations of tumor hypoxia using drugs and anti-angiogenic treatments (35–38). EPR oximetric imaging, however provides quantitative information on oxygenation and hypoxia from the whole imaged volume, and is therefore a more thorough tool to identify the hypoxic fractions within the tumors in order to improve the therapy outcome (23,39).
Concern may be raised about the applicability of these data to patient treatment. This work involved administration of a single large fraction of radiation to the animal model tumor. Most therapeutic regimens delivered today involve highly fractionated regimens (40). During such administration, oxygenation patterns are likely to change (41,42). In this context, the work presented here can be presented as an argument for more frequent O2 images. Alternatively, it argues that further investigation into the temporal changes in the spatial distributions of hypoxic regions need to be considered.
Conclusions
One of the major values of knowing the distribution of oxygen tensions in an animal tumor is the insight that it gives into the distribution of radiation doses that should be administered to optimally treat a tumor. The current practice of maintaining dose homogeneity over a tumor volume is a statement of ignorance as to the spatial variation of radiation sensitivity within the tumor. We have shown that for two tumor types, mildly hypoxic ½ ml tumors treated to a nominal TCD50, 90% were controlled, while only 37% and 23% of more poorly oxygenated tumors were controlled. In future, the quantitative, non-invasive EPR O2 images of human tumors and local oxygenation statistics like HF10 from sub-volumes within the tumor might allow targeting a local dose modification to improve local control.
Supplementary Material
Acknowledgments
Supported by Grants R01-CA-98575 and P41-EB-002034 from the National Institutes of Health. Dr. Xiaobing Fan helped refine MRI images for tumor localization; Marta Zamora and Erica Markiewicz assisted with animal procedures.
Footnotes
Conflict of interest:
None of the authors of the manuscript has declared any conflict of interest which may arise from being named as an author on the manuscript.
References
- 1.Schwarz G. Uber Desensibilisierung gegen Rontgen- und Radiumstrahlen. Munchner Medizinische Wochenschrift. 1909;56:1217–8. [Google Scholar]
- 2.Henk JM, Smith CW. Radiotherapy and hyperbaric oxygen in head and neck cancer. Interim report of second clinical trial. Lancet. 1977;2:104–5. doi: 10.1016/s0140-6736(77)90117-9. [DOI] [PubMed] [Google Scholar]
- 3.Henk J, Smith CW, Kunkler P. Radiotherapy and hyperbaric oxygen in head and neck cancer. Lancet. 1977:101–3. doi: 10.1016/s0140-6736(77)90116-7. [DOI] [PubMed] [Google Scholar]
- 4.Wardman P. Chemical radiosensitizers for use in radiotherapy. Clin oncol. 2007;19:397–417. doi: 10.1016/j.clon.2007.03.010. [DOI] [PubMed] [Google Scholar]
- 5.Overgaard J. Hypoxic radiosensitization: adored and ignored. J Clin Oncol. 2007;25:4066–74. doi: 10.1200/JCO.2007.12.7878. [DOI] [PubMed] [Google Scholar]
- 6.Overgaard J. Hypoxic modification of radiotherapy in squamous cell carcinoma of the head and neck--a systematic review and meta-analysis. Radiother Oncol. 2011;100:22–32. doi: 10.1016/j.radonc.2011.03.004. [DOI] [PubMed] [Google Scholar]
- 7.Hockel M, Schlenger K, Aral B, Mitze M, Schaffer U, Vaupel P. Association between tumor hypoxia and malignant progression in advanced cancer of the uterine cervix. Can Res. 1996;56:4509–15. [PubMed] [Google Scholar]
- 8.Khan N, Li H, Hou H, Lariviere JPJ, Gladstone DJ, Demidenko E, et al. Tissue pO2 of orthotopic 9L and C6 gliomas and tumor-specific response to radiotherapy and hyperoxygenation. Int J Rad Oncol Biol Phys. 2009;73:1–8. doi: 10.1016/j.ijrobp.2008.10.025. [DOI] [PMC free article] [PubMed] [Google Scholar]
- 9.Bratasz A, Pandian RP, Deng Y, Petryakov S, Grecula JC, Gupta N, et al. In vivo imaging of changes in tumor oxygenation during growth and after treatment. Magn Reson Med. 2007;57:950–9. doi: 10.1002/mrm.21212. [DOI] [PMC free article] [PubMed] [Google Scholar]
- 10.Jordan BF, Gallez B. Surrogate MR markers of response to chemo- or radiotherapy in association with co-treatments: a retrospective analysis of multi-modal studies. Contrast Media Mol Imaging. 2010:323–32. doi: 10.1002/cmmi.397. [DOI] [PubMed] [Google Scholar]
- 11.Matsumoto K, Szajek L, Krishna MC, Cook JA, Seidel J, Grimes K, et al. The influence of tumor oxygenation on hypoxia imaging in murine squamous cell carcinoma using [64Cu] Cu-ATSM or [18F] Fluoromisonidazole positron emission tomography. Int J Oncol. 2007;30:873. [PubMed] [Google Scholar]
- 12.Halpern HJH, Yu C, Peric M, Barth ED, Grdina DJ, Teicher BA. Oxymetry deep in tissues with low-frequency electron paramagnetic resonance. Proc Natl Acad Sci USA. 1994;91:13047–51. doi: 10.1073/pnas.91.26.13047. [DOI] [PMC free article] [PubMed] [Google Scholar]
- 13.Velan SS, Spencer RG, Zweier JL, Kuppusamy P. Electron paramagnetic resonance oxygen mapping (EPROM): direct visualization of oxygen concentration in tissue. Magn Reson Med. 2000;43:804–9. doi: 10.1002/1522-2594(200006)43:6<804::aid-mrm5>3.0.co;2-b. [DOI] [PubMed] [Google Scholar]
- 14.Elas M, Williams BB, Parasca A, Mailer C, Pelizzari CA, Lewis MA, et al. Quantitative tumor oxymetric images from 4D electron paramagnetic resonance imaging (EPRI): Methodology and comparison with blood oxygen level-dependent (BOLD) MRI. Magn Reson Med. 2003;49:682–91. doi: 10.1002/mrm.10408. [DOI] [PubMed] [Google Scholar]
- 15.Elas M, Ahn KH, Parasca A, Barth ED, Lee D, Haney C, et al. Electron paramagnetic resonance oxygen images correlate spatially and quantitatively with Oxylite oxygen measurements. Clin Cancer Res. 2006;12:4209–17. doi: 10.1158/1078-0432.CCR-05-0446. [DOI] [PubMed] [Google Scholar]
- 16.Elas M, Bell R, Hleihel D, Barth ED, McFaul C, Haney CR, et al. Electron Paramagnetic Resonance Oxygen Image Hypoxic Fraction Plus Radiation Dose Strongly Correlates With Tumor Cure in FSa Fibrosarcomas. Int J Radiat Oncol Biol Phys. 2008;71:542–9. doi: 10.1016/j.ijrobp.2008.02.022. [DOI] [PMC free article] [PubMed] [Google Scholar]
- 17.Stone HB, Milas L. Modification of radiation responses of murine tumors by misonidazole (Ro 07-0582), host immune capability, and Corynebacterium parvum. J Natl Can Inst. 1978;60:887–93. doi: 10.1093/jnci/60.4.887. [DOI] [PubMed] [Google Scholar]
- 18.Stone HB, Withers HR. Enhancement of radiation response of a murine mammary carcinoma by two nitrofuran derivatives. Rad Res. 1975;64:443–51. [PubMed] [Google Scholar]
- 19.Epel B, Sundramoorthy S, Mailer C, Halpern H. A versatile high speed 250-MHz pulse imager for biomedical applications. Concepts in Magnetic Reson Part B Magn Reson Eng. 2008;33B:163–76. doi: 10.1002/cmr.b.20119. [DOI] [PMC free article] [PubMed] [Google Scholar]
- 20.Subramanian V, Epel B. A passive dual-circulator based transmit/receive switch for use with reflection resonators in pulse EPR. Concepts in Magnetic Reson Part B Magn Reson Eng. 2009;1:1–13. doi: 10.1002/cmr.b.20141. [DOI] [PMC free article] [PubMed] [Google Scholar]
- 21.Ahn K-H, Halpern HJ. Spatially uniform sampling in 4-D EPR spectral-spatial imaging. J Magn Reson. 2007;185:152–8. doi: 10.1016/j.jmr.2006.12.007. [DOI] [PMC free article] [PubMed] [Google Scholar]
- 22.Williams BB, Hallaq H, Chandramouli GVR, Barth ED, Rivers JN, Lewis M, et al. Imaging Spin Probe Distribution in the Tumor of a Living Mouse With 250 MHz EPR3: Correlation With BOLD MRI. Magn Reson Med. 2002;47:634–8. doi: 10.1002/mrm.10089. [DOI] [PubMed] [Google Scholar]
- 23.Epel B, Halpern HJ. Electron paramagnetic resonance oxygen imaging in vivo. In: Gilbert B, Chechik V, Murphy D, editors. Electron Paramagnetic Resonance. Cambridge, UK: RSC Publishing; 2013. [Google Scholar]
- 24.Suit H, Hwang T, Hsieh C, Howard D, Thames J. Design of radiation dose-response assays for tumor control. In: Kallman R, editor. Rodent Tumor Models in Experimental Cancer Therapy. New York: Pergamon Press; 1987. pp. 154–64. [Google Scholar]
- 25.Höckel M, Schlenger K, Mitze M, Schäffer U, Vaupel P. Hypoxia and Radiation Response in Human Tumors. Sem Rad Oncol. 1996;6:3–9. doi: 10.1053/SRAO0060003. [DOI] [PubMed] [Google Scholar]
- 26.Williams B, Ahn K-H, Mailer C, Halpern H. Extraction of linewidth information from spatial-spectral EPR images using spectral fitting. In: Eaton G, Eaton S, editors. 44th Rocky Mountain Conference on Analytical Chemistry, EPR Symposium. 2002. [Google Scholar]
- 27.Ling CC, Humm J, Larson S, Amols H, Fuks Z, Leibel S, et al. Towards multidimensional radiotherapy (MD-CRT): biological imaging and biological conformality. Int J Rad Oncol Biol Phys. 2000;47:551–60. doi: 10.1016/s0360-3016(00)00467-3. [DOI] [PubMed] [Google Scholar]
- 28.Thorwarth D, Alber M. Implementation of hypoxia imaging into treatment planning and delivery. Radiother Oncol. 2010;97:172–5. doi: 10.1016/j.radonc.2010.05.012. [DOI] [PubMed] [Google Scholar]
- 29.Thorwarth D, Eschmann S-M, Paulsen F, Alber M. Hypoxia dose painting by numbers: a planning study. Int J Rad Oncol Biol Phys. 2007;68:291–300. doi: 10.1016/j.ijrobp.2006.11.061. [DOI] [PubMed] [Google Scholar]
- 30.Vaupel P, Höckel M, Mayer A. Detection and characterization of tumor hypoxia using pO2 histography. Antioxid Redox Signal. 2007;9:1221–35. doi: 10.1089/ars.2007.1628. [DOI] [PubMed] [Google Scholar]
- 31.Gatenby RA, Kessler HB, Rosenblum JS, Coia LR, Moldofsky PJ, Hartz WH, et al. Oxygen distribution in squamous cell carcinoma metastases and its relationship to outcome of radiation therapy. Int J Rad Oncol Biol Phys. 1988;14:831–8. doi: 10.1016/0360-3016(88)90002-8. [DOI] [PubMed] [Google Scholar]
- 32.Jiang B, Semenza G. Hypoxia-inducible factor 1 levels vary exponentially over a physiologically relevant range of O2 tension. Am J Phys Cel Phys. 1996;271:C1172–C1180. doi: 10.1152/ajpcell.1996.271.4.C1172. [DOI] [PubMed] [Google Scholar]
- 33.Höckel M, Vaupel P. Biological consequences of tumor hypoxia. Sem Oncol. 2001;28:36–41. [PubMed] [Google Scholar]
- 34.Khan N, Mupparaju S, Hekmatyar SK, Hou H, Lariviere JP, Demidenko E, et al. Effect of hyperoxygenation on tissue pO2 and its effect on radiotherapeutic efficacy of orthotopic F98 gliomas. Int J Rad Oncol Biol Phys. 2010;78:1193–200. doi: 10.1016/j.ijrobp.2010.05.045. [DOI] [PMC free article] [PubMed] [Google Scholar]
- 35.Khan N, Mupparaju S, Hou H, Lariviere J, Manuscript A, Response T. Radiotherapy in Conjunction with 7-Hydroxystaurosporine: A Multimodal Approach with Tumor pO2 as a Potential Marker of Therapeutic Response. Rad Res. 2009;172:592–7. doi: 10.1667/RR1781.1. [DOI] [PMC free article] [PubMed] [Google Scholar]
- 36.Diepart C, Karroum O, Magat J, Feron O, Verrax J, Calderon PB, et al. Arsenic trioxide treatment decreases the oxygen consumption rate of tumor cells and radiosensitizes solid tumors. Can Res. 2012;72:482–90. doi: 10.1158/0008-5472.CAN-11-1755. [DOI] [PubMed] [Google Scholar]
- 37.Jordan BF, Peeterbroeck J, Karroum O, Diepart C, Magat J, Grégoire V, et al. Captopril and S-nitrosocaptopril as potent radiosensitizers: Comparative study and underlying mechanisms. Cancer Lett. 2010;293:213–9. doi: 10.1016/j.canlet.2010.01.016. [DOI] [PubMed] [Google Scholar]
- 38.Ansiaux R, Dewever J, Grégoire V, Feron O, Jordan BF, Gallez B. Decrease in tumor cell oxygen consumption after treatment with vandetanib (ZACTIMA; ZD6474) and its effect on response to radiotherapy. Rad Res. 2009;172:584–91. doi: 10.1667/RR1744.1. [DOI] [PubMed] [Google Scholar]
- 39.Krishna MC, Matsumoto S, Yasui H, Saito K, Devasahayam N, Subramanian S, et al. Electron paramagnetic resonance imaging of tumor pO2. Rad Res. 2012;177:376–86. doi: 10.1667/rr2622.1. [DOI] [PubMed] [Google Scholar]
- 40.Hall E. Radiobiology for the Radiologist. 5. Philadelphia: Lippincott Williams & Wilkins; 2000. [Google Scholar]
- 41.Kallman R. Rodent Tumor Models in Experimental Cancer Therapy. New York: Pergamon Press; 1987. [Google Scholar]
- 42.O’Hara JA, Goda F, Liu KJ, Bacic G, Hoopes PJ, Swartz HM. The pO2 in a murine tumor after irradiation: an in vivo electron paramagnetic resonance oximetry study. Rad Res. 1995;144:222–9. [PubMed] [Google Scholar]
Associated Data
This section collects any data citations, data availability statements, or supplementary materials included in this article.