

Abstract
Most mechanisms of cell development, physiology, and signal transduction are controlled by protein-protein interactions. Immunoprecipitation of multiprotein complexes detected by flow cytometry (IP-FCM) is a means to quantitatively measure these interactions. The high sensitivity of this method makes it useful even when very little biomaterial is available for analysis, as in the case of rare primary cell subsets or patient samples. Detection of the T cell antigen receptor associated with the CD3 multiprotein complex from as few as 300 primary murine T cells is presented as an example. The method is compatible with quantitative flow cytometry techniques, making it possible to estimate the number of coimmunoprecipitated molecules. Both constitutive and inducible protein-protein interactions can be analyzed, as illustrated in related methodology using glutathione S-transferase–fusion protein pull-down experiments. IP-FCM represents a robust, quantitative, biochemical technique to assess native protein-protein interactions, without requiring genetic engineering or large sample sizes.
Introduction
Multiprotein complexes and protein-protein interactions control many cellular processes, including receptor signaling (1, 2), transcription (3–5), the cell cycle and cell division (6, 7), oncogenic transformation (8), and apoptosis (9). As such, there is a great deal of interest in biology and medicine in documenting, mapping, and understanding the relationships between the many protein complexes involved in the “interactome” (10, 11). Well-known strategies with which to approach protein-protein interaction experiments include coimmunoprecipitation (co-IP) with subsequent Western blotting (12) or mass spectrometry–based identification of binding partners (13, 14), glutathione S-transferase (GST)–fusion protein pull-down experiments (15), yeast two-hybrid analysis (16), fluorescence resonance energy transfer (FRET) (17), and blue native-polyacrylamide gel electrophoresis (BN-PAGE) (18). Together, these and other methods aim to (i) identify the individual members and stoichiometry of both constitutive and transient multiprotein complexes, (ii) understand what controls their interactions, and (iii) determine their biochemical functions and relationships to other complexes. Substantial efforts are under way to convert methodologies and analytical tools into forms compatible with the high-throughput platforms required for large-scale studies.
Because they are dependent on developmental cues, gene expression, and external stimuli, protein-protein interaction networks and signaling pathways are most accurately considered tissue-specific rather than universal (11). Allelic variation within a population adds to the complexity of predicting and measuring all possible protein pathway relationships. For these reasons, it would be helpful to quantify protein-protein interactions in wild-type primary cells by methods that do not necessarily require genetic engineering or large sample sizes.
We describe a protocol for the analysis of coimmunoprecipitated proteins by flow cytometry (IP-FCM), which has been used to study the stoichiometry of multiprotein complexes and the modulation of protein-protein interactions in response to receptor signal transduction and calcium flux (19–22). The method allows a robust, quantitative, biochemical assessment of native protein-protein interactions when very little biomaterial is available for analysis, as in the case of rare primary cell subsets. No genetic engineering, epitope tagging, or radioactive labeling is required; thus, the method can be applied to samples from wild-type subjects, potentially including clinical patients. In addition, it is compatible with 96-well-plate, high-throughput formatting. These characteristics facilitate experimental designs involving triplicates for statistical analysis, which can be impractical with other protein-protein interaction methodologies. The most comparable current methods are IP and pull-down assays followed by Western blotting. However, those methods are usually semiquantitative, comparatively slow to perform, and rarely subject to statistical scrutiny because they require up to 10,000 times as much biomaterial as is needed for IP-FCM. The only special instrumentation needed to perform the IP-FCM method is a flow cytometer.
Cell lysates are incubated with carboxylate-modified polystyrene latex (CML) beads to which monoclonal antibodies (mAb) have been covalently coupled. The primary analyte is the protein directly bound by the mAb coupled to the bead; other proteins that coimmunoprecipitate with the first are secondary analytes, and these are detected by fluorochrome-conjugated mAbs that specifically bind them (Fig. 1A). A quantitative fluorescent bead set can provide a standard curve to translate experimental fluorescence values into known numbers of fluorochromes, allowing an estimation of the number of molecules in the complexes. The Protocol outlines this procedure using 20 × 106 primary murine T lymphocytes to generate IP samples with as many as 10 different probes. After initial experiments of this type, the IP bead:lysate ratio can be modified to make the assay sensitive to as few as 300 cell equivalents per probed sample (see “Troubleshooting: The Key to Good Signals from Very Little Biomaterial”).
Fig. 1.

Principle of bead-based protein-protein interaction analysis by FCM. (A) Immunoprecipitation mAbs or (B) GST-fusion proteins are covalently coupled to CML polystyrene latex beads. When these “capture” beads are incubated with cell lysates, the protein for which the beads are specific (the primary analyte) can bind to the beads together with co-associated proteins (secondary analytes). The primary and secondary analytes on the beads can be probed with fluorochrome-conjugated mAbs and analyzed by flow cytometry.
A similar approach using GST-fusion protein is also described (Fig. 1B). The GST pull-down system involves the bacterial cloning and expression of GST fused to a motif or domain that can be tested for specific binding partners. GST-fusion protein pull-downs can involve binding domains that are directly relevant to signal transduction, such as the Src-homology 2 (SH2) and SH3 domains found on various adaptor and signaling molecules.
Materials
Reagents, Chemicals, Cells, and Antibodies
-
4-(2-aminoethyl) benzenesulfonyl fluoride (AEBSF) (Sigma, #A8456)
Note: This inhibitor is toxic and should be handled with gloves. -
Bovine serum albumin (BSA), Fraction V, 96 to 99% albumin (Sigma, #A-2153)
Note: Store at 4°C. -
CML beads, ~5-μm surfactant-free white carboxylate-modified polystyrene latex beads (Interfacial Dynamics Corporation, #2-5000 or #2-6000, http://www.idclatex.com)
Note: Store at 4°C. -
1-ethyl-3-(3-dimethylaminopropyl)carbodiimide hydrochloride (EDAC) (Pierce, product 22980; Sigma, #E-6383)
Note: Store powder at −20°C. Fetal bovine serum (FBS)
-
Glutathione, reduced (Fluka, #49750)
Note: This is needed if performing the GST pull-down version of the Protocol. -
Glutathione-sepharose beads, high performance (GE Healthcare)
Note: This is needed if performing the GST pull-down version of the Protocol. -
GST-fusion proteins
Note: This is needed if performing the GST pull-down version of the Protocol. We use fusion proteins that have been cloned into the plasmid pGEX-4T-1 and expressed in E. coli DH5α. Hydrochloric acid
-
Monoclonal antibodies (mAb) for IP, ≥0.2 mg/ml (ideally ≥1 mg/ml) in phosphate-buffered saline (PBS)
Note: Store at 4°C. The mAb must be dissolved in PBS without BSA or other proteins present. Antibodies can be purchased dissolved in PBS or may be reconstituted in PBS if lyophilized. If the mAb is dissolved in a Tris-based buffer, then it must be dialyzed into PBS. If the mAb solution contains BSA, the BSA should be removed by chromatography. -
mAb probes, fluorochrome-conjugated, ≥0.2 mg/ml or as supplied by manufacturer (BD Pharmingen, eBioscience, Caltag, Santa Cruz Biotechnology, and other vendors)
Note: For quantitative flow cytometry (qFCM) analysis, we recommend the exclusive use of phycoerythrin (PE)–conjugated mAb probes. -
mAb against GST, mouse immunoglobulin G1 (IgG1), clone B-14, available conjugated to fluorescein isothiocyanate (FITC) or biotin (Santa Cruz Biotechnology, product sc-138)
Note: This is needed if using the GST pull-down version of the Protocol. 2-(N-morpholino)ethanesulfonic acid (MES) (Sigma, #M-5287)
Primary cells, cell lines, or any other protein source
-
Protease Inhibitor General Use Cocktail, containing AEBSF, Bestatin, Aprotinin, EDTA, E-64, and Leupeptin (Sigma, #P2714)
Note: These inhibitors are toxic and should be handled with gloves. -
Rainbow Calibration Particles (Spherotech, Inc., #RCP-30-5A, http://www.spherotech.com)
Note: Store at 4°C. -
Sodium azide
Note: This substance is toxic and should be handled with gloves. Sodium chloride
Sodium fluoride
Sodium hydroxide
Sodium orthovanadate (Sigma, #S-6508)
Tris
Nonionic Detergent
Note: There are many options. Common examples are listed below. The detergent used in a particular experiment must be determined empirically for the protein-protein interactions under study. However, for many protein complexes, the published literature can provide an excellent starting point for which detergent or detergents are likely to best preserve the complexes of interest.
Brij58 (Fluka, #16004)
Brij96V (Fluka, #16011)
Digitonin, high purity (Calbiochem, #300410)
n-Dodecyl-β-D-maltoside (DDM) (Sigma, #D4641)
Nonidet P-40 (NP-40)
Triton X-100
Plastics and Other Supplies
1.5-ml polypropylene microcentrifuge tubes
5-ml polystyrene round-bottom tubes for FCM (BD Falcon, #352052)
Micropipettor tips
-
96-well U- or V-bottom polystyrene plates
Note: Plates are needed only if performing high-throughput experiments.
Software
-
CellQuest (BD Biosciences)
Note: This software is used for acquisition and analysis of data generated using certain Becton Dickinson flow cytometers. Alternatively, other flow cytometry systems and their corresponding software packages can be used. -
FlowJo (Tree Star, Inc.)
Note: This software is optional. It is used for flow cytometry analysis and graphics. -
Excel (Microsoft)
Note: This spreadsheet software is specifically used in conjunction with the Rainbow Calibration particles from Spherotech, Inc. -
Prism GraphPad (Graphpad Software, Inc.)
Note: This software is optional. We use it for statistical analysis, graphing, and curve-fitting.
Equipment
Cold room
Dialysis casettes, Slide-a-lyzer, molecular weight cut-off of 10,000 daltons, 0.5- to 3.0-ml capacity (Pierce, #66380)
-
Flow cytometer
Note: We use FACSCalibur, from Becton Dickinson. Freezer, −20°C
Hemacytometer (Neubauer chamber)
-
Light microscope
Note: 100×magnification is used for counting cells or CML beads with a hemacytometer. Microcentrifuge, refrigerated (Eppendorf, #5417R)
Micropipettors
Refrigerator
Rotating wheel, vertical
Thermomixer (Eppendorf, #5436)
Vibrating shaker (Sarstedt, #CM-9)
Recipes
Note: Prepare all buffers with distilled H2O (dH2O) unless noted.
Recipe 1: PBS, pH 7.4
| Na2HPO4 | 8.1 mM |
| KH2PO4 | 1.5 mM |
| NaCl | 138 mM |
| KCl | 2.7 mM |
| Prepare 1 to 10 liters. If prepared correctly, the pH should be 7.4. | |
Recipe 2: MES Coupling Buffer
| MES (pH 6.0) | 50 mM |
| EDTA | 1 mM |
Recipe 3: EDAC-MES
-
Dissolve 50 mg/ml EDAC powder in MES Coupling Buffer (Recipe 2).
Note: Prepare immediately before use from EDAC powder, which is stored at –20°C.
Recipe 4: Quenching, Blocking, and Storage (QBS) Buffer
| BSA | 1% |
| Sodium azide | 0.02% |
| PBS | 1× |
| Store at 4°C |
Recipe 5: Protease Inhibitor Stock Solutions
| General protease inhibitors | 100× |
| Dissolve Protease Inhibitor General Use Cocktail in 10 ml dH20. Store in 100-μl aliquots at −20°C. | |
| AEBSF | 100× |
| Prepare 25 mM in dH20 | |
| Store in 100-μl aliquots at −20°C | |
Recipe 6: Phosphatase Inhibitor Stock Solutions
| Sodium orthovanadate | 100× |
| Prepare a 200-mM solution in dH20. After adjusting to pH 10 with NaOH or HCl as needed, the solution may turn yellow. Boil until the solution turns colorless, and then cool the solution to room temperature. Readjust the pH to 10 and repeat the process until at room temperature the solution remains colorless. Store in 50-μl aliquots at −20°C. | |
| Sodium fluoride | 100× |
| Prepare a 100-mM solution in dH20. Store in 50-μl aliquots at −20°C | |
Recipe 7: Lysis Buffer
Core lysis buffer
| Tris, pH 7.4 | 50 mM |
| NaCl | 150 mM |
| Protease inhibitors (from stock solutions in Recipe 5) | 1× |
Note: Add the protease inhibitors immediately before use.
Detergent
Brij58, or
Brij96V, or
DDM, or
Digitonin, or
NP-40, or
Triton X-100, or
-
Other detergent of choice
Note: The detergent and concentration (0.3 to 1.0% by weight for powders, by volume for liquids) used in a particular experiment must be determined empirically for the protein-protein interactions under study. Complete solubilization of cell membranes is generally achievable by lysing in 1% detergent. To conserve detergent, lower concentrations of detergent would have to be empirically tested to determine whether equivalent results are produced.Note: If digitonin is used, it must be prepared immediately before use from a 2% solution in dH2O. Boil the 2% solution until it becomes clear, and then cool the solution to room temperature or place on ice. The 2% stock is good for up to 3 days when stored at 4°C. Alternatively, it can be frozen at −20°C.
Optional ingredients
| Phosphatase inhibitors (from stock solutions in Recipe 6) | 1× |
Note: If phosphorylated proteins are of interest, phosphatase inhibitors should be included. Add the phosphatase inhibitors immediately before use.
Recipe 8: GST Elution Buffer
| Detergent (same as that used in Recipe 7) | 0.2 to 1% |
| Glutathione, reduced | 10 mM |
| Tris, pH 7.4 | 50 mM |
| NaCl | 150 mM |
| Protease inhibitors (from stock solutions in Recipe 5) | 1× |
Note: Add the protease inhibitors immediately before use.
Optional ingredients
| Phosphatase inhibitors (from stock solutions in Recipe 6) | 1× |
Note: If phosphorylated proteins are of interest, phosphatase inhibitors should be added immediately before use.
Recipe 9: Post-IP Wash Buffer
Core wash buffer
| Detergent (same as that used in Recipe 7) | 0.2 to 1% |
| Tris, pH 7.4 | 50 mM |
| NaCl | 150 mM |
| Protease inhibitors (from stock solutions in Recipe 5) | 1× |
Note: Add the protease inhibitors immediately before use.
Note: We generally wash in 0.2% detergent to maintain the solubilization of captured proteins. Alternatively, Lysis Buffer (Recipe 7) may be used as the Post-IP Wash Buffer, in which case, more than 0.2% detergent will be present during the washes.
Optional ingredients
| Phosphatase inhibitors (Recipe 6) | 1× |
Note: If phosphorylated proteins are of interest, phosphatase inhibitors should be added immediately before use.
Recipe 10: FCM Staining Buffer
Core staining buffer
| Tris, pH 7.4 | 50 mM |
| NaCl | 100 mM |
| Sodium azide | 0.02% |
| FBS | 5% |
| Store at 4°C. |
Note: If phosphorylated proteins are of interest, BSA (1%) can replace FBS (5%) as the blocking agent.
Optional ingredients
| Phosphatase inhibitors (from stock solutions in Recipe 6) | 1× |
Note: If phosphorylated proteins are of interest, phosphatase inhibitors should be added immediately before use.
| Detergent (same as that used in Recipe 7) | 0.2 to 1% |
Note: The addition of detergent can either help or hinder the detection of proteins by IP-FCM. This must be determined empirically (see the comment in “Staining the IP or pull-down capture beads for FCM” in the “Instructions” section).
Instructions
Covalent Coupling of mAb or GST-Fusion Proteins to CML Beads
A batch of IP or GST-fusion protein pull-down beads is prepared by covalently coupling primary amino groups of either a specific mAb or a GST-fusion protein to carboxyl groups on CML beads. These are the “capture beads” used to bind primary analyte proteins that will be assessed for protein-protein interaction partners. At the end point of the assay, during detection by FCM, the number of capture beads stained per tube can vary from 2.5 × 10³ to 2.5 × 10⁵. We include here conditions to make a batch starting with 18 × 106 beads, with an expected yield of approximately 12 × 106 beads after coupling. Depending on the IP or pull-down capture conditions, this batch will be sufficient for 50 to 5000 FCM samples. Scale up the coupling reaction as needed. We have capture bead stocks that have lasted and still work after more than 3 years. The efficiency of mAb coupling can be determined by staining the beads with fluorochrome-conjugated antibodies against immunoglobulin (Ig) followed by FCM analysis (Fig. 2). Likewise, the efficiency of GST-fusion protein conjugation to beads may be checked by probing the capture beads with a fluorochrome-conjugated mAb against GST followed by FCM analysis.
Fig. 2.
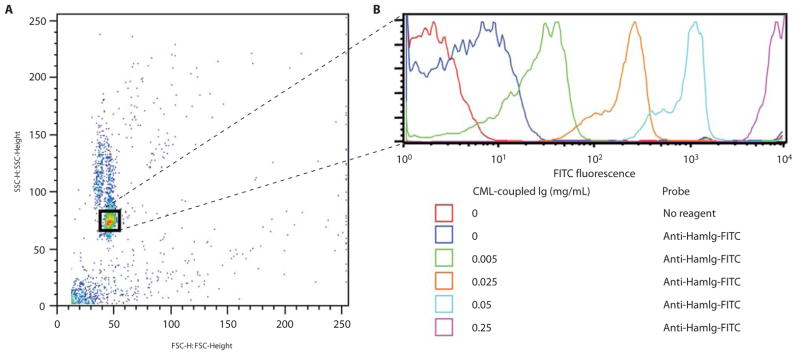
Covalent coupling of IP mAbs to CML beads. Titrated concentrations of the hamster mAb 145-2C11 (specific for murine CD3ε) were coupled to CML beads according to the described protocol. The beads were probed with a FITC-conjugated antibody against hamster Ig (HamIg) and analyzed by flow cytometry in order to visualize the efficacy of the coupling reaction. (A) Identified by its Forward versus Side Scatter profile, the homogeneous bead population is gated, and (B) its fluorescence is displayed in a log-scale histogram. The histograms from several parallel samples are overlaid for comparison. The negligible inherent background fluorescence of the beads is shown from the sample represented by the red histogram. Even concentrations of mAb as low as 0.005 mg/ml are detected coupled to the beads. However, for maximum capturing capacity, concentrations ≥ 0.2 mg/ml during coupling are recommended.
Preparing GST-fusion proteins
Instructions for the cloning, expression, and purification of GST-fusion proteins are available from commercial vendors (such as GE Healthcare) and published articles (15).
-
Obtain ≥ 0.2 mg/ml (ideally ≥ 1 mg/ml) of the GST-fusion protein of interest.
Note: The methods for expression and purification will vary by protein studied and will need to be determined empirically. -
Extensively dialyze the GST-fusion protein against PBS, 1 liter volume changed 2 to 3 times over 24 hours should suffice for samples of 1 ml volume.
Note: Purification of GST often involves its capture on a glutathione-coupled substrate, followed by elution with free glutathione. It is important to remove the free glutathione from solution before coupling to CML beads.
Coupling mAb or GST-fusion proteins to CML beads
-
Determine the concentration of beads from the purchased stock by suspending the beads well and then diluting 1:10,000 in PBS (Recipe 1) and counting with a hemacytometer under a microscope.
Note: To accurately measure the concentration, 30 to 300 beads must be counted. Therefore, you may have to alter the dilution to have the necessary minimum number of beads. Alternatively, the beads may be counted using a Coulter Counter. Pipette 18 × 106 beads into a 1.5-ml microcentrifuge tube.
Wash the beads 2 to 3 times in 0.5 to 1.0 ml MES Coupling Buffer (Recipe 2), centrifuging at 15,000g for 3 min at 25°C after each wash.
Resuspend the beads in 50 μl MES Coupling Buffer (Recipe 2).
Activate the carboxyl groups on the beads by adding 20 μl of freshly prepared EDAC-MES (Recipe 3).
Mix gently for 15 min at 25°C by manually pipetting up and down throughout the period, or by placing the tube on a vertical rotating wheel at sufficient velocity to prevent the beads from settling.
Wash the activated beads two to three times in 0.5 to 1.0 ml PBS (Recipe 1), centrifuging at 15,000g for 3 min at 25°C after each wash.
Resuspend the activated beads in 50 μl PBS (Recipe 1).
Add 50 μl of the mAb or GST-fusion protein (from step 2 in “Preparing GST-fusion proteins”).
-
Mix for 3 to 4 hours at 25°C by placing the tube horizontally on a vibrating shaker. Shake sufficiently to prevent settling of the beads on the bottom of the tube.
Note: Alternatively, the tube can be shaken in the upright position in a thermomixer. -
Wash the IP or pull-down capture beads two to three times in 0.5 to 1.0 ml PBS (Recipe 1), centrifuging at 15,000g for 3 min at 25°C after each wash.
Note: It is critical to discard as much of the supernatant volume as possible between each wash. Otherwise, soluble uncon-jugated mAb or GST-fusion protein may be present in the capture bead preparation. Such soluble protein can bind the target antigen when the IP or pull-down is performed, inhibiting the capture of the target antigen on the beads. Resuspend the capture beads in 100 μl QBS Buffer (Recipe 4), and store overnight or longer at 4°C.
-
Suspending the beads well, dilute 1:10,000 in PBS (Recipe 1), and count with a hemacytometer under a microscope.
Note: The concentration must be measured for each preparative batch in order to precisely control the number of beads used in each IP or pull-down experiment.
IP and GST-Fusion Protein Pull-Down of Primary Cell Lysates for FCM Analysis
Methods to harvest and prepare primary cells for lysis vary greatly depending on the cell type and will not be described in detail here. In addition, optimal detergent and lysis conditions must be determined empirically and will vary depending on the protein-protein interactions under study. For IP-FCM, we use 1% nonionic detergent and isotonic lysis buffer to generate post-nuclear lysates containing native protein complexes. The goal is to completely solubilize the native cellular proteins while keeping the lysate as concentrated as possible. A general rule of thumb is to lyse 200 × 106 “small” cells (such as lymphocytes) per ml, or 50 × 106 “big” cells (such as macrophages or tumor cells) per ml of lysis buffer. After cell lysis, the IP or pull-down is performed by adding 2.5 × 10⁶ capture beads per ml of postnuclear lysate. This is a starting figure; it may be possible to use fewer beads and less starting material than this (see “Troubleshooting: The Key to Good Signals from Very Little Biomaterial”). Finally, the capture beads are stained with fluorochrome-conjugated mAbs, and FCM analysis is performed. This Protocol describes the example of 20 × 106 primary lymphocytes lysed in 100 μl. Details for using 96-well plates in high-throughput format and microcentrifuge tubes for low-throughput format are both provided.
In addition to the experimental samples, the following controls should also be considered: (i) a positive control capture-probe combination to demonstrate the detection of a known protein-protein interaction; (ii) a positive control for the presence and native conformation of the primary analyte captured (this probe should be a mAb specific for a different epitope than is bound by the IP mAb or GST-fusion protein); (iii) negative controls indicating background staining due to nonspecific protein-protein interactions (for example, proteins known not to interact with the primary analyte should not be captured); (iv) negative controls indicating that probe mAbs have low inherent binding to the capture beads (for example, using nonspecific isotype Ig probe mAbs). More discussion on controls is found in the section “Troubleshooting: Nonspecific Interactions.”
By following this Protocol, we obtained representative IP-FCM data from both plentiful (Fig. 3) and low-abundance (Fig. 4) cell sources. The same protocol was followed with the use of GST-fusion protein capture beads to perform pull-downs (Fig. 5).
Fig. 3.

IP-FCM displays a high signal-to-noise ratio. IP-FCM was performed according to the described protocol by lysing 20 × 106 BALB/c murine splenocytes in 1% digitonin lysis buffer. Approximately 7 × 10⁶ splenic T cells were present in the preparation and the TCR/CD3 multiprotein complex was immunoprecipitated with CML beads coupled with a mAb against CD3γε (clone 7D6). Flow cytometric analysis was performed by gating on the beads (as shown in Fig. 2A) and by analyzing bead fluorescence when probed with fluorochrome-conjugated mAbs. Nonspecific hamster Ig-PE (HamIg-PE) displayed low background staining. The abundant CD45 protein was not present in the immunoprecipitated complexes, indicating that membranes were thoroughly solubilized during lysis. Subunits of the complex were specifically coimmunoprecipitat-ed in the predicted stoichiometric ratios: Approximately two times as much CD3ζ (probe clone 6B10) was detected over TCRβ (probe clone H57-597) (27). The geometric mean fluorescence intensity (gMFI) was converted to the number of PE molecules (#PE) on the beads by following the protocol steps in “Quantitative Flow Cytometry (qFCM)” in the “Instructions” section.
Fig. 4.

IP-FCM analysis of a multiprotein complex from a rare primary cell subset. In BALB/c mice, approximately 10% of splenic T cells express a TCR α chain from the Vα2 family (28). Cells were either lysed in 1% digitonin lysis buffer or in 1% NP-40 lysis buffer. The number of T cells per lysate that expressed Vα2 was approximately 7 × 10⁵. Lysates were incubated with CML beads coupled to mAb against Vα2 (clone B20.1) and the co-associated protein subunits were probed with PE-conjugated mAbs and analyzed by flow cytometry. Nonspecific staining (HamIg-PE) and membrane solubilization (shown by the absence of CD45 based on the anti–CD45-PE probe) revealed little background fluorescence and nonspecific protein association. When lysed in 1% digitonin, TCR/CD3 complexes were immunoprecipitated that contained the predicted 2:1 subunit stoichiometry of CD3ε (probe mAb 145-2C11) to TCRβ (probe mAb H57-597) (27). However, when 1% NP-40 lysis buffer was used, the TCR:CD3 interaction was not well maintained. Normal amounts of TCRβ (as compared with the digitonin samples) coprecipitated with Vα2, because TCRα and TCRβ are disulfide-linked and do not separate under the nonreducing lysis conditions used here. However, CD3ε association with Vα2 was drastically reduced by approximately 96%. To accurately calculate these differences, the geometric mean fluorescence intensity (gMFI) was converted to the number of PE molecules (#PE) on the beads by following the protocol steps in “Quantitative Flow Cytometry (qFCM)” in the “Instructions” section. This example demonstrates that IP-FCM is very sensitive for detecting multiprotein complexes from rare cell subsets. It also shows that the choice of detergent can have a major effect on the outcome of IP experiments.
Fig. 5.

GST-fusion protein pull-down with CML beads. (A) When the TCR/CD3 complex is activated by either physiological ligands or stimulatory antibodies, a conformational change in the CD3 complex is induced that uncovers a cryptic binding site for the SH3.1 domain of the cytosolic adaptor protein, Nck (22). This can be assessed by the ability of CD3 to bind to a GST-fusion protein containing the SH3.1 domain of Nck (GST-NckSH3.1) coupled to beads. (B) We used 3 × 10⁵ Jurkat cells (a human T cell line), which were either stimulated (+) or not (−) with mAb against CD3ε (clone UCHT1). Cells were lysed in 0.5% Brij96V lysis buffer, and the lysate was incubated with GST-NckSH3.1 fusion protein beads. After the pull-down, the beads were probed with the same mAb againstCD3ε that had been used to stimulate (clone UCHT1). Beads were washed and then probed with a FITC-conjugated antibody against mouse Ig. The stimulation enhanced the ability of Nck to bind CD3 complexes as shown by the fluorescence shift. (C) 3.5 × 10⁶ primary murine splenocytes were either stimulated (+) or not (−) with mAb against CD3ε (clone 145-2C11). Cells were lysed and pull-downs were performed with GST-NckSH3.1 beads as in (B). Probing the beads with excess mAb against CD3ε mAb (clone 145-2C11) was followed by incubation with a PE-conjugated antibody against hamster Ig. These examples illustrate that this system permits the analysis of inducible protein-protein interactions using cells of either human or mouse origin.
Postnuclear lysate preparation and IP or pull-down
-
Lyse 20 × 106 primary lymphocytes in 100 μl ice-cold Lysis Buffer (Recipe 7) in a 1.5-ml microcentrifuge tube for 20 min on ice.
Note: While the cells are lysing, start step 3. To remove nuclei and insoluble cellular debris, centrifuge the lysate at 20,000g for 10 min at 4°C. Keep the supernatant as the postnuclear lysate and discard the pellet.
-
Place 2.5 × 10⁵ IP or pull-down capture beads in a 1.5-ml microcentrifuge tube and wash the capture beads in 200 μl Lysis Buffer (Recipe 7), centrifuging at 15,000g for 3 min after the wash (4°C). Keep the washed, pelleted capture beads on ice until the lysate is ready.
Note: The wash in step 3 can be omitted if the bead aliquot represents a small proportion of the total volume in which the capture will take place. For example, 5 μ l of unwashed stock capture beads can be added directly to 100 μ l of postnuclear lysate to begin the IP. Begin the IP or pull-down by resuspending the capture beads in the postnuclear lysate.
-
Rock end over end on a vertical rotating wheel 4 hours to overnight at 4°C. Set to sufficient velocity to prevent the beads from settling.
Note: A small volume of postnuclear lysate may remain at the bottom of the tube throughout the incubation, but the capture beads should not settle.
GST-fusion protein capture-elution-recapture IP
It can be useful to elute GST-fusion protein pull-downs and then recapture them with new IPs. For example, if a GST-fusion protein has multiple ligands, a single specific ligand may be poorly captured because the other ligands also occupy binding sites on the bead. Immunoprecipitating eluted complexes can concentrate a particular ligand of interest and improve its visualization by IP-FCM (Fig. 6). This is further discussed in the section “Notes and Remarks.”
Fig. 6.

GST-fusion protein capture-elution-recapture IP. (A) After capture on glutathione-sepharose beads by GST-NckSH3.1, TCR/CD3 complexes bound to the fusion protein can be eluted with reduced glutathione. One particular mAb against CD3ε (APA1/1) competes with GST-NckSH3.1 for its binding site on CD3ε, and simultaneously allows recapture of TCR/CD3 complexes with CML IP beads. (B) We used 30 × 106 primary murine thymocytes, which were either stimulated (+) or not (−) with mAb against TCRβ (clone H57-597) before lysis in 0.3% Brij58 lysis buffer and processing as described in (A). The recapture IP beads displayed little background staining and were devoid of extraneous abundant membrane proteins, such as Thy1.2. Stimulation enhanced the ability of Nck to bind CD3 complexes as shown by CD3ζ fluorescence (probe mAb 6B10). However, substantial capture was also observed from the lysate of unstimulated cells, which reveals that a basal level of Nck accessibility to CD3 exists even in the absence of overt receptor stimulation. HamIg, hamster Ig.
Bind a GST-fusion protein of interest to commercially available glutathione-coupled sepharose beads according to the manufacturer’s instructions.
Prepare postnuclear lysates as described in the section “Postnuclear lysate preparation and IP or pull-down.”
-
Perform pull-downs with the GST-fusion protein-coupled glutathione Sepharose beads, and wash the beads by standard methods and protocols.
Note: We typically use 15 μl of a 50% slurry of GST fusion protein-coupled glutathione Sepharose beads to incubate with 20 to 100 × 106 cell equivalents per lysate. Place 2.5 × 10⁵ IP beads in a 1.5-ml microcentrifuge tube and wash the IP beads in 200 μl Lysis Buffer (Recipe 7), centrifuging at 15,000g for 3 min after the wash (4°C). Keep the washed, pelleted IP beads on ice until the GST-fusion protein sample is ready.
Elute the GST-fusion and co-associated proteins from the glutathione-Sepharose beads by resuspending in the smallest possible volume (15 to 30 μl) of GST Elution Buffer (Recipe 8).
-
Incubate for 30 min (25° to 30°C) by spinning or rocking so that the Sepharose beads do not settle.
Note: We use a benchtop thermomixer set to vibrate sufficiently to prevent the beads from settling. Centrifuge the Sepharose beads at 20,000g for 30 s at 4°C.
-
Transfer the supernatant, containing the eluted GST-fusion and co-associated proteins, to the 1.5-ml microcentrifuge tube with the IP beads.
Note: To increase the yield of eluted proteins, repeat steps 5 through 8 and pool the two rounds of eluted supernatant into a single tube. Rock end-over-end on a vertical rotating wheel 4 hours to overnight at 4°C. Set to sufficient velocity to prevent the beads from settling.
Staining the IP or pull-down capture beads for FCM
-
1
Wash the IP or pull-down capture beads one to three times in 0.2 ml ice-cold Post-IP Wash Buffer (Recipe 9), centrifuging at 15,000g at 4°C for 3 min after each wash.
-
2
Wash the capture beads two to three times in 0.2 to 1.0 ml ice-cold FCM Staining Buffer (Recipe 10), centrifuging at 15,000g at 4°C for 3 min after each wash.
Note: The exact number of washes and whether the FCM Staining Buffer must or must not contain 0.2% detergent need to be empirically determined. If steps 1 to 6 in this section and the subsequent FCM acquisition are finished within 6 hours, our experience has been that the wash in step 1 can be omitted, and the FCM Staining Buffer in step 2 may not need detergent, even when transmembrane proteins are analyzed. It is possible that some detergents may not readily wash away from their hydrophobic interactions with transmembrane proteins over this short time course. -
3a
High-throughput format: Resuspend the capture beads in 0.5 ml of FCM Staining Buffer (Recipe 10) and aliquot 2.5 × 10⁴ beads in 50 μl into each of 10 wells of a 96-well U- or V-bottom plate.
-
3b
Microfuge tubes: Resuspend the capture beads in 0.5 ml of FCM Staining Buffer (Recipe 10) and aliquot 2.5 × 10⁴ beads in 50 μl into 10 separate 1.5-ml microcentrifuge tubes.
-
4
Add fluorochrome-conjugated mAbs to the samples to perform the FCM stain according to the vendor’s instructions or according to empirically determined concentrations. Incubate for 40 min at 4°C..
Note: An example of a good starting point is 1:100 dilution of 0.2 mg/ml PE-conjugated mAb from BD Pharmingen. Usually, a staining dilution that is satisfactory for a similar number of cells (in the case of surface proteins) will work for the IP or pull-down capture beads. Perform titration experiments to optimize. -
5a
High-throughput format: If working in a 96-well plate, wash three times with 0.2 ml FCM Staining Buffer (Recipe 10), centrifuging at 1000g for 5 min at 4°C after each wash. Remove 150 to 175 μl of the supernatant with a multichannel pipettor after each wash..
Note: Plates may be centrifuged at up to 15,000g if the centrifuge has the capacity. Do not “flick” the plate after each wash, because, even though the beads pellet more rapidly than cells, the bead pellet does not really “pack” well and can be more easily disrupted or lost than a cell pellet. -
5b
Microcentrifuge tubes: Wash two times in 0.5 to 1.0 ml FCM Staining Buffer (Recipe 10), centrifuging at 15,000g for 3 min at 4°C after each wash. Gently remove the supernatant after each wash, taking care not to disturb the beads.
-
6
Resuspend the IP or pull-down capture beads in 200 μl FCM Staining Buffer (Recipe 10) per sample. Samples are now ready for FCM.
Quantitative Flow Cytometry (qFCM)
Flow Cytometer Parameters
In most respects, acquiring the IP or pull-down capture bead fluorescence data by flow cytometry is no different than acquiring fluorescence data from cells. However, the cytometer settings are different than those used for cells. The CML beads described in this Protocol are 3 to 5 μm in diameter, approximately half the diameter of a quiescent mouse lymphocyte. Therefore, it can be necessary to manually increase the Forward Scatter amp gain and the Side Scatter voltage in order for the population of bead events to register on the cytometer. Unlike cellular flow cytometry, there should not be subpopulations of any kind among the IP or pull-down capture beads. The settings should be adjusted to exclude bead doublets and debris. To visualize the detection limits, a negative control of unlabeled beads and a positive control of IP beads stained with fluorochrome-conjugated mAb against immunoglobulin (Ig) should be visualized at the two extremes of the log scale. This ensures that the fluorescence from the experimental IP or pull-down samples will be within the scale.
If only one fluorescent probe per sample is used, no fluorescence compensation is necessary. In general, we stain multiprotein complexes with a single fluorochrome-conjugated mAb per FCM sample, and we examine multiple subunits by staining parallel IP or pull-down capture bead samples with mAbs specific for the various subunits. An alternative is to use different fluorochrome-conjugated mAbs simultaneously to stain IP beads for multiple subunits. The former strategy facilitates qFCM when used in conjunction with PE-conjugated mAbs, because steric binding problems resulting from multiple probe antibodies are avoided. Also avoided are potential alterations in fluorescence signals by FRET from adjacent fluorochromes, which can occur with common fluorochrome combinations, including FITC and PE (23) as well as PE and allophycocyanin (APC) (24).
Increase the Forward Scatter amp gain and the Side Scatter voltage until the population of bead events is visible on the cytometer.
Make a gate around the small homogeneous bead population, visualized on a dot plot showing Forward Scatter versus Side Scatter.
Apply this gate to the data to be visualized on the fluorescence channel (or channels) to isolate the beads from doublet-beads and nonbead debris (Fig. 2A).
Set the collection criterion to 250 to 2500 gated acquisition events.
-
Select “log mode” for the fluorescence channel(s) to be collected.
Note: If qFCM analysis is desired, we exclusively use the fluorescence channel assigned to PE-conjugated mAb probes, and we turn off the other fluorescence channels. Set the negative control photomultiplier tube (PMT) voltage while applying unlabeled, unconjugated beads as the first sample.
For the second sample, apply a bright positive control, such as IP beads stained with fluorochrome-conjugated mAb against immunoglobulin (Ig).
Acquire the data for the IP bead samples.
Acquisition of the fluorescence standard curve and qFCM data analysis
Fluorescence data are often presented on a relative scale with arbitrary units because it is inherently semiquantitative. However, a standard curve can be generated from commercially available fluorescent beads, where fluorescence values correspond to known numbers of fluorochromes. If the standard curve and the experimental data from IP-FCM beads are acquired with the same flow cytometer PMT voltage, compensation, and other settings, then the relative fluorescence values from the IP-FCM data can be translated into numbers of fluorochromes per IP bead. Acquisition of the beads used to generate the standard curve (RCP-30-5A) is performed after the experimental samples have been acquired.
PE is the fluorochrome of choice for qFCM analysis (25), and it is important to use PE-conjugated mAbs where the PE:mAb ratio is known, in order to be able to obtain quantitative data. The conjugation chemistry is normally set up with a 1:1 PE:mAb molar ratio, but the ratio of the final product can be most easily confirmed by (i) calling the vendor’s technical department and asking what the PE:mAb ratio is for a particular batch of mAb probe; (ii) running the PE-mAb probe over a size exclusion column and collecting the fraction corresponding to the molecular weight expected for 1:1 conjugation; or (iii) paying extra for a vendor to provide a guaranteed 1:1 conjugation reagent.
Each fluorescence peak from the RCP-30-5A sample represents a def ined number of mean equivalent soluble PE molecules (MEPE). By plotting the relative fluorescence against the MEPE for each peak, the qFCM standard curve is generated and an equation for the curve is calculated. Spherotech Inc. provides an Excel spreadsheet to users upon request that performs the standard curve set-up and converts user-input experimental fluorescence values into MEPE. Alternatively, the equation for the calibration curve can be determined using other software. Figure 7 shows a standard curve using Spherotech’s Excel spreadsheet, along with a calculated equation for the curve using Prism GraphPad. From this standard curve, a quantitative estimate for the number of PE molecules associated with each IP-FCM sample is determined.
Fig. 7.

Generation of the calibration curve for qFCM. This is an example of a PE calibration curve using RCP-30-5A beads from Spherotech Inc. First, the Forward Scatter amp gain and Side Scatter voltage are adjusted to get the beads on-scale, and a gate is drawn around the beads by the same process shown in Fig. 2A (for the CML beads). All other flow cytometry parameters and settings must remain identical to those used during the acquisition of experimental samples. The series of unimodal fluorescence peaks in the histogram represent known numbers of mean equivalent soluble PE molecules (MEPE). By inputting the fluorescence intensities into the vendor-provided spreadsheet, a curve is generated that will allow conversion of experimental relative fluorescence values into numbers of PE molecules. The curve can also be generated individually, by plotting the RCP-30-5A relative fluorescence values against the number of PE molecules associated with each peak. Various software programs can extrapolate an equation for the calibration curve, which can then be used to input experimental fluorescence data and solve for the number of PE molecules. The equation displayed here was calculated by Prism GraphPad.
After the experimental samples have been acquired by FCM, maintain the cytometer settings unaltered and return to set-up mode, so that new data files will temporarily not be acquired.
-
Run a sample of Spherotech beads RCP-30-5A [2 drops diluted in 300 μl PBS (Recipe 1)].
Note: Because these beads are smaller than the IP-FCM beads, it may be necessary to increase the Forward Scatter amp gain and the Side Scatter voltage to get the beads within the scale range. Make a gate around the new small homogeneous bead population, visualized on a dot plot showing Forward versus Side Scatter.
-
Apply this gate to the data to be visualized on the PE fluorescence channel, which will eliminate fluorescence from doublet-beads.
Note: A series of clear, single-mode peaks should now appear in the PE fluorescence channel. Set the acquisition collection criterion to 10,000 gated events.
Remove the set-up mode selection, so that new data files can once again be acquired.
Acquire the fluorescence of the RCP-30-5A sample.
Troubleshooting
Poor Conjugation of mAb or GST to CML Beads
Coupling of mAbs to CML beads can be checked by staining the beads with fluorochrome-conjugated antibodies against Ig, followed by FCM analysis. Likewise, coupling of GST-fusion proteins to beads can be checked by FCM with a commercially available FITC-conjugated antibody against GST. If attachment to the CML beads is poor, check the mAb or GST-fusion protein for degradation prior to coupling. This can be done by verifying mAb or GST-fusion protein size by SDS-PAGE followed by Coomassie staining or Western blotting, or by size-exclusion chromatography. If the protein is not degraded, increase its concentration during the conjugation procedure. Primary amine-containing molecules other than the mAb or GST-fusion protein (Tris, glycine, or glutathione, for example) will compete with the mAb or GST-fusion protein for the beads, so these compounds must not be present during coupling.
Improving the Capture and Detection of Native Protein Complexes by IP-FCM
If coupling is good but no fluorescence signal is observed on the IP-FCM beads, even from what should serve as positive controls for protein-protein interaction, then it is probably necessary to reevaluate the validity of the assumptions and conditions upon which the experiment is based. The cellular source of the complexes, binding of IP and fluorochrome-conjugated probe mAbs to native proteins, and optimal lysis buffers and lysis detergents must all be determined empirically. For many protein-protein interactions, much of this work has already been accomplished using plentiful sources, such as cell lines, and can be immediately applied to primary cells for IP-FCM. Therefore, information as to whether mAbs function well during IP or FCM staining is often available from vendors or the published literature. It is possible that covalent coupling to CML beads could involve a lysine residue important for the binding function of a particular mAb. To overcome this, the mAb may be biotinylated and bound to streptavidin-coupled beads to perform the IP. However, because IP-FCM is quite sensitive, our experience has been that most experiments (at least the positive controls) work to some extent the first time they are attempted, even if a “suboptimal” detergent or IP antibody is used (for example, see the NP-40 lysis buffer sample in Fig. 4).
Low but positive fluorescence signals can be improved by several means. First, increase the concentration of the mAb during covalent coupling to the CML beads to improve their binding capacity. Second, perform preliminary experiments to determine the minimal volume in which the cells can be lysed while still achieving optimal protein solubilization. The lysate contents should be as concentrated as possible without increasing the detection of nonspecific proteins. Third, various different fluorochrome-conjugated probe mAbs can be tried. Sometimes, capture is excellent on the IP beads, but the IP mAb sterically cross-blocks a particular probe mAb, leading to low fluorescence signals. Changing the probe mAb to one that is not cross-blocked by the IP mAb can fix the problem. Fourth, secondary probe reagents can be used to amplify the fluorescence signal. For example, a biotinylated probe mAb can be used, and then reprobed with streptavidin-PE.
The Key to Good Signals from Very Little Biomaterial
When the IP and probe mAb combination is working well, a low fluorescence signal can be due to limited capture of a low-abundance protein. In this case, decreasing the number of IP beads incubated with the lysate can increase the signal. This exemplifies a critical difference in IP-FCM methodology and is counterintuitive for investigators accustomed to doing the opposite to improve IP–Western blot experiments. Decreasing the number of IP beads increases the amount of antigen captured on each individual bead, because low-abundance antigens become distributed across fewer beads. The goal is not to capture the maximum amount of antigen from the lysate; the goal is to obtain high average capture on each individual bead of the IP bead population.
This principle can be used to maximize the IP-FCM signal obtainable when the amount of biomaterial available is quite low, for instance, when studying protein-protein interactions in rare primary cell subsets. Figure 8 demonstrates how IP-FCM data can be obtained for a modestly expressed multiprotein complex from as few as 300 primary cells per sample, by making the lysate as concentrated as possible while immunoprecipitating with as few IP beads as possible.
Fig. 8.

Optimizing the lysate:bead ratio for maximum sensitivity of IP-FCM. There are two key factors involved in maximizing IP-FCM sensitivity: (i) Lyse the cells of interest in as little volume as possible so that their protein contents are as concentrated as possible, and (ii) perform the IP with as few beads as possible. The following illustration involves IP of the TCR/CD3 complex from primary BALB/c murine splenocytes with a mAb against CD3ε (clone 145-2C11), and probing the IP beads with a mAb against TCRβ (clone H57-597). The volume of the IP was constant for all conditions. (A) Decreasing the concentration of the T cell equivalents (# T cell eq.) in the lysate decreases the number of TCR/CD3 complexes captured on IP beads. The more concentrated the lysate contents, the greater the signal detected by IP-FCM. (B) Keeping the lysate concentration constant while decreasing the number of IP beads used increases the average number of captured complexes per IP bead, and thus increases the IP-FCM signal. (C) By iteratively performing criss-cross testing of lysate concentration conditions with the number of IP beads used, one can determine the conditions needed to yield the most sensitive signals from very few starting cells. Here, an IP of 300 T cell equivalents still displays greater than or equal to one log of specific signal for the interaction between CD3ε and TCRβ. We routinely perform sensitive IPs in 5- to 10-μl volume, with IP bead numbers in the thousands.
Polyclonal, Secondary, and Unpurified Antibodies
We recommend the use of purified mAbs for IP and for fluorochrome-conjugated probes whenever possible. Purified polyclonal antibodies may or may not work well as IP capture reagents by IP-FCM, even if they are proven effective for IP and Western blot applications. The polyclonal antibodies of interest represent a portion of the total Ig in polyclonal preparations. When the entire preparation is coupled to CML beads, only a fraction of the coupled material has the specificity of interest, which can translate into relatively low specific binding capacity per IP bead. All antibodies need to be well purified and in PBS for the coupling reaction to be effective. Unpurified antibody sources, such as antisera and ascites fluid, do not tend to work well, because the many other proteins in these preparations inhibit the coupling of the specific antibodies of interest. If polyclonal antibodies must be used to IP, our first suggestion is simply to follow the Protocol as usual to determine whether the signal-to-noise ratio is adequate. If it is not, then one solution may be to affinity purify the specific Ig from the polyclonal preparation using the immunizing antigen, and then couple this specificity-controlled preparation to CML beads.
Some antibodies that might make good IP-FCM probes may be available in purified form only and not directly fluorochrome-conjugated. The purified probe can be followed by a secondary fluorochrome-conjugated antibody (19). However, because the IP bead itself is covered with Ig, many reagents that recognize Ig will directly bind the IP bead; be sure to carefully control for this. Our experience with polyclonal secondary antibodies is that species-specific adsorption is often insufficient to prevent this. For GST-fusion protein pull-down experiments, secondary probe antibody strategies present no problem because the beads are covered with GST-fusion protein instead of Ig (Fig. 5).
Nonspecific Interactions
Especially when working with transmembrane proteins, incomplete solubilization of the membrane during lysis can result in membrane “chunks” that allow proteins to coprecipitate, although they do not interact in the native membranes. To monitor this potential problem, it is helpful to define some negative controls that have their own positive controls. For example, when T cell membranes are not thoroughly solubilized, nonassociated membrane proteins, such as Thy1, CD45, and major histocompatibility complex (MHC) class I, can be coprecipitated with the T cell antigen receptor (TCR) complex. However, these proteins do not coprecipitate when cells are lysed properly. Because both of these results are detectable with IP-FCM, the absence of these extraneous proteins on an IP bead (Figs. 3, 4, 6, and 8) can be interpreted to mean that they are not present and that proper solubilization was achieved.
The specificity of the fluorochrome-conjugated mAb probes can be verified by demonstrating (i) that they fail to bind IP beads for irrelevant antigens, and (ii) that they fail to bind IP beads specific for the antigen of interest when the IP is performed on cell lysates that do not contain the antigen.
Because some proteins nonspecifically “stick” to GST, it is initially wise to compare GST-fusion protein pull-downs with GST pull-downs. If the background nonspecific binding of a particular protein to GST is high, one solution is to preclear lysates prior to the pull-down assay. Incubate lysates for 1 to 4 hours with GST-glutathione-Sepharose beads at 4°C, and then subject the supernatant to the GST-fusion pull-down followed by FCM.
Notes and Remarks
Some advantages of the IP-FCM method are that (i) protein-protein interactions are measured in native, nondenatured state; (ii) high sensitivity for analyses is possible from little starting biomaterial; (iii) the method works for samples from many different wild-type sources, because no genetic engineering or radioactivity is required; (iv) quantitative analysis is possible; and (v) 96-well plate, high-throughput design is possible.
IP-FCM relies on a candidate approach for identifying interaction partners, because predefined probes determine whether specific proteins are present or absent in the immunoprecipitated complexes. Not only will the presence of undefined proteins fail to be detected, but also well-defined proteins that simply were not probed. Related to this, unlike Western blotting, IP-FCM does not show the molecular weight of the proteins detected. Therefore, for some applications, IP-FCM may be best suited for the study of protein-protein interactions that are already well documented, whereas other methods may serve better for the initial discovery of those interactions. However, because the assay can be performed with a 96-well plate of IP-FCM samples, these could be rapidly screened with 96 different probe mAbs (or if done in triplicate, 32 different probe mAbs). Therefore, if many probes were available, IP-FCM could be very useful as a screening technique that might potentially contribute information about novel protein binding partners. The drawback of the candidate approach is real, but there may be a payback in the high-throughput applicability of IP-FCM. A current aim of the Human Proteome Organization (HUPO) and the European Community-funded consortium ProteomeBinders is to generate mAbs specific for all open reading frames of the human genome (26). Such efforts are likely to greatly expand the screening capabilities of antibody-based high-throughput assays like IP-FCM.
IP-FCM follows the principle of a sandwich enzyme-linked immunosorbent assay (ELISA), in which the capture and detection antibodies used can be specific for epitopes on co-associated proteins, allowing analysis of both primary and secondary analytes. If a protein expresses a single motif that is specific for several different binding partners, then IP-FCM will likely display all of those partners to some extent. However, none of those single partners may yield a very bright signal alone. Imagine that a lysate contains ligands X, Y, and Z, all of which compete equally for binding to a single site of receptor W. If the ligands are expressed equally, the maximum signal of W:X that can be detected by immunoprecipitating W is 33% of the total bead-binding capacity. Increasing the amount of lysate (containing X, Y, and Z) would not alter this maximum. IP-FCM signals are limited by concentration of target protein, more than by absolute amount. In contrast, a low W:X signal by IP and Western blotting may be overcome by increasing the total amount of IP mAb and lysate (containing X, Y, and Z). Western blotting is limited by amount, more than concentration. One can attempt to circumvent this problem with capture-elution-recapture strategies (Fig. 6). However, these assay characteristics should be kept in mind when deciding whether to design experiments based on IP-FCM as compared to other methods.
Acknowledgments
We thank A. Gelman, L. Stern, J. Syed, and A. Wells for thoughtful discussions; J. Moore, H. Pletcher, and G. Spagnoli for extra access to flow cytometry facilities; and R. Geha for the GST-SH3.1 construct. This work was supported by a Sangstat-American Society of Transplantation Basic Science Fellowship and a Ruth L. Kirschstein National Research Service Award from the National Cancer Institute, National Institutes of Health (A.G.S.); Ramón y Cajal investigator program of the Universidad Complutense and grant PI060057 from the Instituto de Salud Carlos III (D.G.); NIH grants AI41521 and AI43620 (L.A.T.); the Emmy Noether program, Deutsche Forschungsgemeinschaft (W.W.A.S.); and the Swiss National Science Foundation (E.P.).
References and Notes
- 1.Pellicena P, Kuriyan J. Protein-protein interactions in the allosteric regulation of protein kinases. Curr Opin Struct Biol. 2006;16:702–709. doi: 10.1016/j.sbi.2006.10.007. [DOI] [PubMed] [Google Scholar]
- 2.Kyriakis JM. The integration of signaling by multiprotein complexes containing Raf kinases. Biochim Biophys Acta. 2006 doi: 10.1016/j.bbamcr.2006.11.003. [DOI] [PubMed] [Google Scholar]
- 3.Massague J, Seoane J, Wotton D. Smad transcription factors. Genes Dev. 2005;19:2783–2810. doi: 10.1101/gad.1350705. [DOI] [PubMed] [Google Scholar]
- 4.Corry GN, Underhill DA. Subnuclear compartmentalization of sequence-specific transcription factors and regulation of eukaryotic gene expression. Biochem Cell Biol. 2005;83:535–547. doi: 10.1139/o05-062. [DOI] [PubMed] [Google Scholar]
- 5.Malik S, Roeder RG. Dynamic regulation of pol II transcription by the mammalian Mediator complex. Trends Biochem Sci. 2005;30:256–263. doi: 10.1016/j.tibs.2005.03.009. [DOI] [PubMed] [Google Scholar]
- 6.Prasanth SG, Mendez J, Prasanth KV, Stillman B. Dynamics of pre-replication complex proteins during the cell division cycle. Philos Trans R Soc Lond B Biol Sci. 2004;359:7–16. doi: 10.1098/rstb.2003.1360. [DOI] [PMC free article] [PubMed] [Google Scholar]
- 7.Hirano T. At the heart of the chromosome: SMC proteins in action. Nat Rev Mol Cell Biol. 2006;7:311–322. doi: 10.1038/nrm1909. [DOI] [PubMed] [Google Scholar]
- 8.Richardson KS, Zundel W. The emerging role of the COP9 signalosome in cancer. Mol Cancer Res. 2005;3:645–653. doi: 10.1158/1541-7786.MCR-05-0233. [DOI] [PMC free article] [PubMed] [Google Scholar]
- 9.Werner MH, Wu C, Walsh CM. Emerging roles for the death adaptor FADD in death receptor avidity and cell cycle regulation. Cell Cycle. 2006;5:2332–2338. doi: 10.4161/cc.5.20.3385. [DOI] [PubMed] [Google Scholar]
- 10.Ghavidel A, Cagney G, Emili A. A skeleton of the human protein interactome. Cell. 2005;122:830–832. doi: 10.1016/j.cell.2005.09.006. [DOI] [PubMed] [Google Scholar]
- 11.Stelzl U, Wanker EE. The value of high quality protein-protein interaction networks for systems biology. Curr Opin Chem Biol. 2006;10:551–558. doi: 10.1016/j.cbpa.2006.10.005. [DOI] [PubMed] [Google Scholar]
- 12.Phizicky EM, Fields S. Protein-protein interactions: Methods for detection and analysis. Microbiol Rev. 1995;59:94–123. doi: 10.1128/mr.59.1.94-123.1995. [DOI] [PMC free article] [PubMed] [Google Scholar]
- 13.Conrotto P, Yakymovych I, Yakymovych M, Souchelnytskyi S. Interactome of transforming growth factor-beta type I receptor (TbetaRI): Inhibition of TGFbeta signaling by Epac1. J Proteome Res. 2007;6:287–297. doi: 10.1021/pr060427q. [DOI] [PubMed] [Google Scholar]
- 14.Tu LC, Yan X, Hood L, Lin B. Proteomics analysis of the interactome of N-myc downstream regulated gene 1 and its interactions with the androgen response program in prostate cancer cells. Mol Cell Proteomics. 2007;6:575–588. doi: 10.1074/mcp.M600249-MCP200. [DOI] [PubMed] [Google Scholar]
- 15.Smith DB, Johnson KS. Single-step purification of polypeptides expressed in Escherichia coli as fusions with glutathione S-transferase. Gene. 1988;67:31–40. doi: 10.1016/0378-1119(88)90005-4. [DOI] [PubMed] [Google Scholar]
- 16.Parrish JR, Gulyas KD, Finley RL., Jr Yeast two-hybrid contributions to interactome mapping. Curr Opin Biotechnol. 2006;17:387–393. doi: 10.1016/j.copbio.2006.06.006. [DOI] [PubMed] [Google Scholar]
- 17.Jares-Erijman EA, Jovin TM. Imaging molecular interactions in living cells by FRET microscopy. Curr Opin Chem Biol. 2006;10:409–416. doi: 10.1016/j.cbpa.2006.08.021. [DOI] [PubMed] [Google Scholar]
- 18.Swamy M, Siegers GM, Minguet S, Wollscheid B, Schamel WW. Blue native polyacrylamide gel electrophoresis (BN-PAGE) for the identification and analysis of multiprotein complexes. Sci STKE. 2006;2006:pl4. doi: 10.1126/stke.3452006pl4. [DOI] [PubMed] [Google Scholar]
- 19.Lund-Johansen F, Davis K, Bishop J, de Waal Malefyt R. Flow cytometric analysis of immunoprecipitates: high-throughput analysis of protein phosphorylation and protein-protein interactions. Cytometry. 2000;39:250–259. doi: 10.1002/(sici)1097-0320(20000401)39:4<250::aid-cyto2>3.0.co;2-s. [DOI] [PubMed] [Google Scholar]
- 20.Treves S, Franzini-Armstrong C, Moccagatta L, Arnoult C, Grasso C, Schrum A, Ducreux S, Zhu MX, Mikoshiba K, Girard T, Smida-Rezgui S, Ronjat M, Zorzato F. Junctate is a key element in calcium entry induced by activation of InsP3 receptors and/or calcium store depletion. J Cell Biol. 2004;166:537–548. doi: 10.1083/jcb.200404079. [DOI] [PMC free article] [PubMed] [Google Scholar]
- 21.Teixeiro E, Daniels MA, Hausmann B, Schrum AG, Naeher D, Luescher I, Thome M, Bragado R, Palmer E. T cell division and death are segregated by mutation of TCRbeta chain constant domains. Immunity. 2004;21:515–526. doi: 10.1016/j.immuni.2004.08.014. [DOI] [PubMed] [Google Scholar]
- 22.Gil D, Schrum AG, Alarcon B, Palmer E. T cell receptor engagement by peptide-MHC ligands induces a conformational change in the CD3 complex of thymocytes. J Exp Med. 2005;201:517–522. doi: 10.1084/jem.20042036. [DOI] [PMC free article] [PubMed] [Google Scholar]
- 23.Block MS, Johnson AJ, Mendez-Fernandez Y, Pease LR. Monomeric class I molecules mediate TCR/CD3 epsilon/CD8 interaction on the surface of T cells. J Immunol. 2001;167:821–826. doi: 10.4049/jimmunol.167.2.821. [DOI] [PubMed] [Google Scholar]
- 24.Batard P, Szollosi J, Luescher I, Cerottini JC, MacDonald R, Romero P. Use of phycoerythrin and allophycocyanin for fluorescence resonance energy transfer analyzed by flow cytometry: advantages and limitations. Cytometry. 2002;48:97–105. doi: 10.1002/cyto.10106. [DOI] [PubMed] [Google Scholar]
- 25.Davis KA, Abrams B, Iyer SB, Hoffman RA, Bishop JE. Determination of CD4 antigen density on cells: Role of antibody valency, avidity, clones, and conjugation. Cytometry. 1998;33:197–205. doi: 10.1002/(sici)1097-0320(19981001)33:2<197::aid-cyto14>3.0.co;2-p. [DOI] [PubMed] [Google Scholar]
- 26.Tyers M, Mann M. From genomics to proteomics. Nature. 2003;422:193–197. doi: 10.1038/nature01510. [DOI] [PubMed] [Google Scholar]
- 27.Call ME, Wucherpfennig KW. The T cell receptor: Critical role of the membrane environment in receptor assembly and function. Annu Rev Immunol. 2005;23:101–125. doi: 10.1146/annurev.immunol.23.021704.115625. [DOI] [PubMed] [Google Scholar]
- 28.Schrum AG, Turka LA. The proliferative capacity of individual naive CD4(+) T cells is amplified by prolonged T cell antigen receptor triggering. J Exp Med. 2002;196:793–803. doi: 10.1084/jem.20020158. [DOI] [PMC free article] [PubMed] [Google Scholar]