Abstract
Experimental animal models of Salmonella infections have been widely used to identify genes important in the host immune response to infection. Using an F2 cross between the classical inbred strain C57BL/6J and the wild derived strain MOLF/Ei, we have previously identified Ity3 (Immunity to Typhimurium locus 3) as a locus contributing to the early susceptibility of MOLF/Ei mice to infection with Salmonella Typhimurium. We have also established a congenic strain (B6.MOLF-Ity/Ity3) with the MOLF/Ei Ity3 donor segment on a C57BL/6J background. The current study was designed to fine map and characterize functionally the Ity3 locus. We generated 12 recombinant sub-congenic strains that were characterized for susceptibility to infection, bacterial load in target organs, cytokine profile and anti-microbial mechanisms. These analyses showed that the impact of the Ity3 locus on survival and bacterial burden was stronger in male mice compared to female mice. Fine mapping of Ity3 indicated that two subloci contribute collectively to the susceptibility of B6.MOLF-Ity/Ity3 congenic mice to Salmonella infection. The Ity3.1 sublocus controls NADPH oxidase activity and is characterized by decreased ROS production, reduced inflammatory cytokine response and increased bacterial burden, thereby supporting a role for Ncf2 (neutrophil cytosolic factor 2 a subunit of NADPH oxidase) as the gene underlying this sublocus. The Ity3.2 sub-locus is characterized by a hyperresponsive inflammatory cytokine phenotype after exposure to Salmonella. Overall, this research provides support to the combined action of hormonal influences and complex genetic factors within the Ity3 locus in the innate immune response to Salmonella infection in wild-derived MOLF/Ei mice.
Introduction
Despite reduction of morbidity as a result of the development of antibiotics and vaccines, infectious diseases are still among the leading causes of morbidity and mortality worldwide. Bacterial infections continue to be a major public health concern worldwide, mainly due to the lack of efficacious treatment or the emergence of antibiotic resistance [1], [2]. In particular, a bacterial pathogen that continues to cause significant morbidity is the Gram-negative bacteria Salmonella, which has over 2500 serovars and infects a range of hosts including domestic animals, birds, rodents and humans. In humans, Salmonella enterica serovar Typhimurium (Salmonella Typhimurium) causes diarrheal non-typhoidal salmonellosis (NTS) while Salmonella Typhi is the etiologic agent of typhoid fever. The most recent estimates of the global burden of gastroenteritis due to Salmonella species is approximately 93.8 million cases with 155,000 deaths annually [3] while the estimated total number of typhoid fever cases globally in 2010 was 26.9 million [4].
Susceptibility to infection is considered to be a complex trait, and significant advances in understanding the host response to bacterial infections have been made using mouse models [5]. As Salmonella Typhi is a human-restricted pathogen, the mouse model of the systemic phase of typhoid has been developed using Salmonella Typhimurium. Injection of a sub-lethal dose of Salmonella Typhimurium via the tail vein results in a systemic infection presenting several clinical and pathological similarities with human typhoid disease. A wide range of susceptibilities to infection with Salmonella Typhimurium has been reported among various laboratory mouse strains [6]. The most commonly used inbred strain C57BL/6J is highly susceptible to infection due to a mutation in the gene Slc11a1 [7] . Another highly susceptible strain is the wild-derived MOLF/Ei strain despite harboring functional copies of the genes Slc11a1 and other known Salmonella-susceptibility genes [8]. Using an F2 cross between C57BL/6J and MOLF/Ei, we identified three loci affecting susceptibility to Salmonella infection in MOLF/Ei mice: Slc11a1 (Ity), Ity2 and Ity3 with LOD scores of 18.8, 7.0 and 5.0 respectively. The Ity2 and Ity3 loci were only detected in the presence of functional MOLF/Ei Slc11a1 alleles. In this genetic context, MOLF/Ei alleles at the Ity2 locus conferred resistance while MOLF/Ei allele at the Ity3 locus resulted in increased susceptibility to infection [8]. Using congenic mice we have previously confirmed the effect of the Ity3 locus on Salmonella susceptibility and suggested Ncf2 as a candidate gene underling the Ity3 locus [9]. Ncf2 encodes the p67phox component of the NADPH oxidase complex, which is known to be important in controlling Salmonella replication [10].
In the current study, we report the generation of a panel of 12 subcongenic strains that have helped refine the Ity3 locus to a 23.2 Mb interval. A comprehensive phenotypic analysis of these subcongenic strains revealed that the genomic structure of Ity3 is complex and comprises at least two subloci, Ity3.1, and Ity3.2. The Ity3.1 sub-locus corresponds to a decrease in activity of Ncf2 and is characterized by decreased ROS production, reduced inflammatory cytokine response and increased bacterial burden. The Ity3.2 sublocus is characterized by a hyper responsive inflammatory cytokine phenotype after exposure to Salmonella. These results provide new insights into the genetic architecture of the region of chromosome 1 carrying Ity3, a region known to harbour several QTLs linked to inflammatory and autoimmune diseases [11].
Materials and Methods
Ethics Statement
All animals were maintained at the Animal Care Facility of McGill University according to the guidelines of the Canadian Council on Animal Care (CCAC). The animal protocol for this study was approved by the McGill University Animal Care Committee (UACC, protocol no. 3285).
Generation of Subcongenic Lines
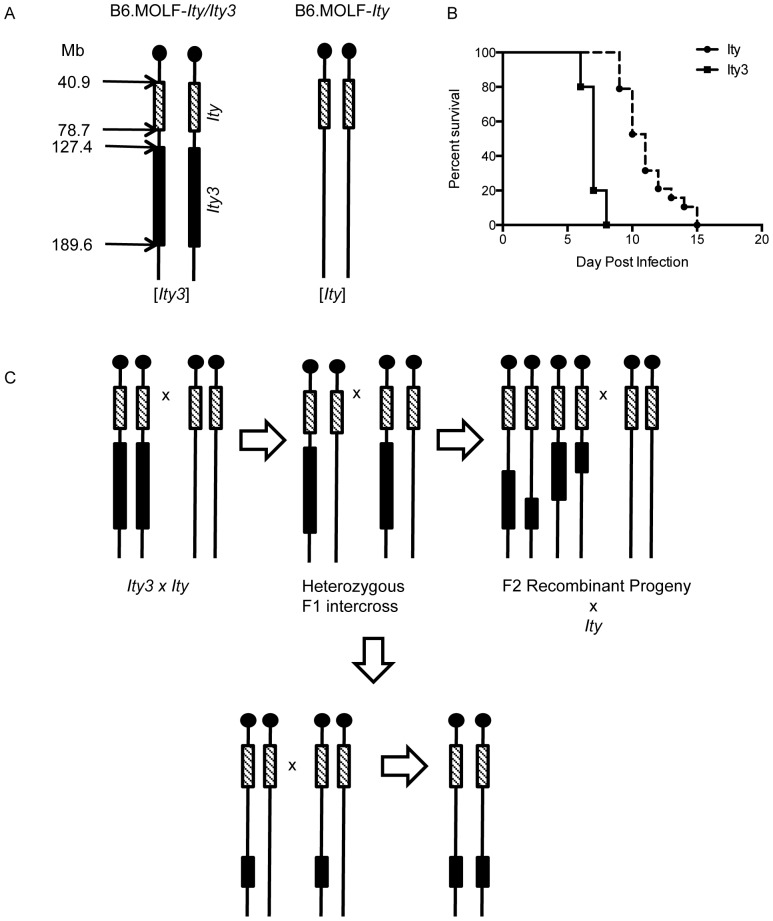
The generation of congenic strains B6.MOLF-Ity (Ity) and B6.MOLF-Ity/Ity3 (Ity3), which carry the MOLF/Ei allele at the Slc11a1 gene, have been described previously [12]. A new panel of subcongenic mice for the Ity3 locus were created by breeding the Ity and Ity3 mice to generate F1 mice heterozygous for the Ity3 locus (Figure 1a). Recombination within the Ity3 locus was achieved by inter-crossing the F1 progeny to generate F2 progeny with numerous break points within the Ity3 locus. Genotyping was performed using microsatellite markers distributed within the Ity3 locus and 12 breakpoints within the Ity3 locus were identified. Animals containing the segment of interest were backcrossed with the parental Ity stain to generate N2 mice. Using marker-assisted breeding, mice with identical breakpoints were intercrossed to generate homozygous mice. This led to the establishment of twelve recombinant B6.MOLF-Ity/Ity3 strains that are different from the strains initially described by us [12].
Figure 1. Breeding scheme used to generate the sub-congenic mice.
A) Schematic representation of mouse chromosome 1 illustrating the position of the congenic intervals Ity and Ity3 in B6.MOLF-Ity/Ity3 and B6.MOLF-Ity mice that were used to generate the subcongenic strains. The position of the congenic intervals is shown in megabases (Mb) according to Ensembl mouse genome Browser. (B) Survival curves of parental B6.MOLF-Ity/Ity3 (Ity3) and B6.MOLF-Ity (Ity) mice. Ity3 congenic mice are more susceptible to Salmonella infection, with a Log-Rank (Mantel-Cox) p-value <0.0001. Using the parental Ity and Ity3 congenic strains, subcongenic mice were generated using the breeding scheme shown in (C). The Ity and Ity3 mice were intercrossed to generate heterozygous mice, which were further backcrossed to the parental Ity mice. Using marker-assisted breeding, 12 subcongenic strains were generated. Boxes represent the MOLF/Ei allele, while the solid black lines represent the C57BL/6J allele. The shaded boxes represent the MOLF/Ei allele at the Ity locus and solid black boxes represent the MOLF/Ei allele at the Ity3 locus.
DNA Extraction and Whole Genome Genotyping
DNA was extracted using a phenol-chloroform extraction, as described previously [13] from tail clippings of all subcongenic strains, as well as C57BL/6J and MOLF/Ei, Ity and Ity3 congenic mice as controls. Whole genome SNP genotyping was done using an Illumina mouse medium density linkage panel that had 1,449 SNPs of which 731 were informative between the C57BL/6J and MOLF/Ei.
In-vivo Salmonella Infections
Mice were infected with 3000 CFUs of Salmonella Typhimurium strain Keller as previously described [9]. Briefly, bacteria were grown on tryptic soy broth to an OD600 of 0.1 and cooled to 4°C for an hour. The bacteria were then plated overnight on tryptic soy agar. The following day, the infectious dose was adjusted to 15×103 CFU/ml and 200 ul was injected in the caudal vein of 8–12 week old mice of both sexes. The animals were monitored 2–3 times daily and mice showing signs of distress (piloerection, sunken eyes and abdomen, lethargy) or body condition scoring less than 2.0 [14] were used for clinical endpoints. Survival analysis was conducted using a Kaplan-Meier survival test.
In vivo Bacterial Burden and Serum Cytokines
For bacterial burden quantification in the spleen and the liver, mice were euthanized using CO2 and at the required day post infection both organs were removed aseptically, weighed and homogenized using a Polytron (Kinematica, Bohemia, NY). The resulting homogenate was diluted in 0.9% saline and plated on tryptic soy agar to determine organ bacteria burden. Blood was collected by cardiac puncture from uninfected (day 0) mice, as well as at day 3 and day 5 post infection. The sera were collected after centrifugation and frozen at −80°C. Serum cytokine levels for IL-6, IFN-γ, TNF, IL-12 were measured using sandwich ELISAs (eBioscience) following the manufacturer’s protocol.
Cells Preparation and PAMP Stimulation
Spleens were aseptically removed from uninfected mice and transferred to growth medium (RPMI 1640). Each spleen was briefly ground between the frosted areas of two sterile microscope slides to generate a cell suspension. This suspension was passaged through a 21 and 25-gauge needle to separate any cellular aggregates. The cells were centrifuged at 1500 r.p.m. for 5 minutes and re-suspended in red blood cells lysis solution (Invitrogen, Burlington, Ontario, Canada) for 5 minutes. The cells were washed and re-suspended in RPMI 1640 supplemented with 10% FBS (HyClone), 100 U/ml penicillin G and 100 µg/ml streptomycin sulfate (Life Technologies). Splenocytes were stimulated overnight with 1 mM CpG DNA (Alpha DNA), 10 mg/ml zymosan (no. TLRL-ZYN; InvivoGen, San Diego, CA), 10 mg/ml LPS055:B5 (no. L6529; Sigma-Aldrich), 10 mg/ml lipoteichoic acid (no. L2515; Sigma-Aldrich), or RPMI alone to measure IL-6 using sandwich ELISAs.
Bone marrow derived macrophages (BMDM) were isolated from femurs of 10–16 week-old male mice. The cells were washed and re-suspended in 10 ml growth medium (RPMI 1640), containing 10% FBS (HyClone), 100 U/ml penicillin G and 100 µg/ml streptomycin sulfate (Life Technologies). The cell suspension was plated on non-adherent bacteriological-grade Petri dishes (Fisher) and supplemented with 30% (vol/vol) L929 cell-conditioned medium as a source of M-CSF and maintained in culture for 5 days. BMDMs were harvested and plated on 6-well plates at a density of 106 cells/ml and cultured for an additional 16–24 hours.
In-vitro Salmonella Typhimurium Infection, Nitric Oxide and Cytotoxicity Assessment
BMDMs were primed with 20 ng/ml IFN-γ overnight prior infection. Salmonella Typhimurium was added to the cells at multiplicities of infection of 10∶1. After a period of 45 minutes, RPMI 1640 medium containing 100 µg/ml gentamycin was added for a period of 1 hour. The medium was replaced by RPMI 1640 containing 10 µg/ml (time point 0). Supernatants were collected for LDH, NO and cytokine measurement at 2, 4 and 6 hours following the addition of a 10 µg/ml gentamycin. Cells were lysed with with 1% Triton-X 100 diluted in PBS and bacterial counts were determined by serial dilutions of the lysates on trypticase soy agar. Nitric oxide production was estimated by measuring the accumulation of nitrate using the Griess reaction (Promega) and lactate dehydrogenase (LDH) released from cells was measured as per manufacturer’s (Roche) instructions.
Reactive Oxygen Species Production
Bone marrow derived cells were plated on non-tissue culture treated petris and incubated with LPS or heat killed Salmonella at an MOI of 1∶20 for 6 hours. RPMI was aspirated and the cells were washed with warm PBS and incubated with CM-H2DCFDA (10 µM, 30 min; Invitrogen) in serum-free medium. Cells were washed with warm PBS, then removed from the well using cold PBS containing 10 mM EDTA, pelleted at 1200 r.p.m., resuspended in cold PBS containing 1% FBS and analysed using a FACSCanto (BD Biosciences) with FlowJo software (Tree Star). Mean fluorescence intensity were used as an indicator for the ROS production.
Statistical Analysis
Statistical analysis was performed using Graph Pad Prism 6 (GraphPad Software, San Diego, CA).
Results
Refinement of the Ity3 Interval Using Sub-congenic Mice
We have shown previously that the transfer of Ity and Ity3 from MOLF/Ei on a C57BL/6J background (B6.MOLF-Ity and B6.MOLF-Ity/Ity3) clearly impact on susceptibility to infection [12]. At that time B6.MOLF-Ity/Ity3 MOLF/B6 congenic mice were used as controls because B6.MOLF-Ity (Ity3B6/B6) mice were unavailable. B6.MOLF-Ity/Ity3 mice were significantly more susceptible to infection (mean survival time (MST) = 8.4±0.3 days) compared to those that carry only one MOLF/Ei allele at Ity3, B6.MOLF-Ity/Ity3 MOLF/B6 (MST = 10.6±0.9 days). In the current paper, we used mice that were homozygous at both loci (Figure 1A). MST was 11.0±2.5 days in B6.MOLF-Ity compared to 7.0±1.8 days in B6.MOLF-Ity/Ity3 (Figure 1B) suggesting some co-dominant effect of MOLF/Ei and C57BL/6J alleles at Ity3 on survival to infection.
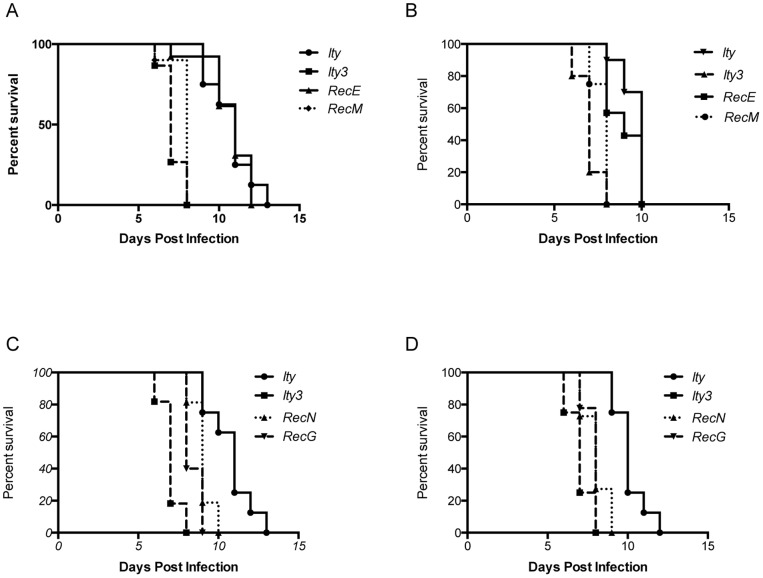
In order to further refine the 62.2 Mb Ity3 locus, we generated 12 subcongenic strains (Ity3.RecA to Ity3.RecS) using marker assisted backcrossing (Figure 1). We used a medium density genotyping array to genotype all 12 subcongenic mice to ensure that any phenotypic differences observed between the sub-congenic strains was due solely to the Ity3 sub-congenic segments. Using this approach no MOLF/Ei alleles were detected outside the Ity and Ity3 regions. This experiment also allowed for a more precise mapping of the boundaries of the different recombinant Ity3 segments (Table 1). All 12 subcongenic strains were evaluated for susceptibility to Salmonella infection. Representative survival analyses are presented in Figure 2. The analysis was done separately in males and females. The difference in survival was more significant in males as compared to females as shown in Figure 2. The male Ity strain was more resistant to infection than female Ity mice. In male mice, the survival curve of recombinant strain Ity3.RecM was undistinguishable from that of Ity3 and strain Ity3.RecE presented a phenotype similar to the Ity control (Figure 2A). A similar observation was made for Ity3.RecM and Ity3.RecE in females (Figure 2B). Based on the survival curves and the mean survival time post infection, the sub-congenic strains were classified as either Ity-like or Ity3-like (Table 1). We also identified two sub-congenic strains, Ity3.RecG and Ity3.RecN that showed an intermediate survival phenotype (Figure 2C–D). These strains carry complementary segments of the Ity3 interval and independently lead to an intermediate phenotype with MST of 8.6±1.7 days and 8.0±2.1 days in Ity3.RecN and Ity3.RecG sub-congenic strains respectively. Based on the survival analyses of the 12 subcongenic mice, the Ity3 interval was refined to a ∼23 Mb interval on chromosome 1 located between position 151.0 Mb and 174.2 Mb (Ensembl build 37). The identification of the two subcongenic strains presenting an intermediate phenotype is suggestive of the presence of at least two loci within the Ity3 locus: Ity3.1 sub-locus located between 151 Mb and 156.2 Mb and Ity3.2 from 158.6 Mb to 174.2 Mb, that together contribute to the enhanced susceptibility of the Ity3 congenic mice (Table 1).
Table 1. Fine mapping of the Ity3 interval using 12 sub-congenic strains.
| Table 1: | |||||||||||||||
| SNP's | Position | Ity | Ity3 | B | C | D | E | F | G | I | S | A | M | N | P |
| D1Mit218 | 127.4 | B6 | M | M | M | M | M | M | M | M | B6 | B6 | B6 | B6 | B6 |
| rs3724826 | 131.5 | B6 | M | B6 | M | M | M | M | M | M | B6 | B6 | B6 | B6 | B6 |
| D1Mit193 | 131.2 | B6 | M | B6 | M | M | M | M | M | M | B6 | B6 | B6 | B6 | B6 |
| Chi3l1 | 134.1 | B6 | M | B6 | B6 | M | M | M | M | M | M | B6 | B6 | B6 | B6 |
| rs6279930 | 137.3 | B6 | M | B6 | B6 | B6 | M | M | M | M | M | B6 | B6 | B6 | B6 |
| D1Mit197 | 136.3 | B6 | M | B6 | B6 | B6 | M | M | M | M | M | B6 | B6 | B6 | B6 |
| rs13476141 | 140.5 | B6 | M | B6 | B6 | B6 | B6 | M | M | M | M | B6 | B6 | B6 | B6 |
| D1Mit448 | 141.1 | B6 | M | B6 | B6 | B6 | B6 | M | M | M | M | B6 | B6 | B6 | B6 |
| rs6382880 | 142.5 | B6 | M | B6 | B6 | B6 | B6 | M | M | M | M | B6 | B6 | B6 | B6 |
| rs13476163 | 146.8 | B6 | M | B6 | B6 | B6 | B6 | M | M | M | M | M | B6 | B6 | B6 |
| D1Mit194 | 147.0 | B6 | M | B6 | B6 | B6 | B6 | M | M | M | M | M | B6 | B6 | B6 |
| D1Mit102 | 147.2 | B6 | M | B6 | B6 | B6 | B6 | M | M | M | M | M | B6 | B6 | B6 |
| D1Mit288 | 149.3 | B6 | M | B6 | B6 | B6 | B6 | M | M | M | M | M | M | B6 | B6 |
| rs6393307 | 151.0 | B6 | M | B6 | B6 | B6 | B6 | M | M | M | M | M | M | B6 | B6 |
| Ncf2 | 152.8 | B6 | M | B6 | B6 | B6 | B6 | B6 | M | M | M | M | M | B6 | B6 |
| D1Mit14 | 156.8 | B6 | M | B6 | B6 | B6 | B6 | B6 | M | M | M | M | M | M | B6 |
| rs3719034 | 157.2 | B6 | M | B6 | B6 | B6 | B6 | B6 | M | M | M | M | M | M | B6 |
| rs6387609 | 157.9 | B6 | M | B6 | B6 | B6 | B6 | B6 | M | M | M | M | M | M | B6 |
| rs3693161 | 160.3 | B6 | M | B6 | B6 | B6 | B6 | B6 | B6 | M | M | M | M | M | B6 |
| Fasl | 161.8 | B6 | M | B6 | B6 | B6 | B6 | B6 | B6 | M | M | M | M | M | B6 |
| rs13476208 | 162.0 | B6 | M | B6 | B6 | B6 | B6 | B6 | B6 | M | M | M | M | M | B6 |
| Sell | 164.1 | B6 | M | B6 | B6 | B6 | B6 | B6 | B6 | M | M | M | M | M | B6 |
| Selp | 164.1 | B6 | M | B6 | B6 | B6 | B6 | B6 | B6 | M | M | M | M | M | B6 |
| D1Mit63 | 165.3 | B6 | M | B6 | B6 | B6 | B6 | B6 | B6 | M | M | M | M | M | B6 |
| rs13476219 | 166.2 | B6 | M | B6 | B6 | B6 | B6 | B6 | B6 | M | M | M | M | M | B6 |
| D1Mit403 | 175.6 | B6 | M | B6 | B6 | B6 | B6 | B6 | B6 | B6 | M | M | M | M | B6 |
| rs13476273 | 182.1 | B6 | M | B6 | B6 | B6 | B6 | B6 | B6 | B6 | M | M | M | M | B6 |
| rs3667164 | 188.7 | B6 | M | B6 | B6 | B6 | B6 | B6 | B6 | B6 | M | B6 | M | M | M |
| D1Mit17 | 189.6 | B6 | M | B6 | B6 | B6 | B6 | B6 | B6 | B6 | M | B6 | M | M | M |
| Survival | Ity | Ity | Ity | Ity | Ity | INT | Ity3 | Ity3 | Ity3 | Ity3 | INT | Ity | |||
| n = | 82 | 39 | 32 | 20 | 11 | 23 | 64 | 45 | 30 | 21 | 36 | 65 | 65 | 14 | |
Position (Mb) based on Ensembl Build 37;
B6 corresponds to the C57BL/6J allele;
M corresponds to the MOLF/Ei allele;
n represents the number of mice tested;
the sub-congenic strains nomenclature is shortened showing only the letter attributed to each strain.
The survival was classified, as either Ity-like (Ity) or Ity3-like (Ity3) or intermediate (INT).
Figure 2. Survival curves of male and female congenic and sub-congenic mice after infection with Salmonella Typhimurium.
The left panel (A) and (C) show the survival of male mice after IV infection with Salmonella Typhimurium while the right panel (B) and (D) show the survival of female mice after infection. Based on the survival curves and mean survival time, strains were classified as either Ity-like or Ity3-like (A, B) Two strains, Ity3.RecN and Ity3.RecG were identified as having an intermediate phenotype (C, D). Log-Rank (Mantel-Cox) for males: p = 0.0025 Ity3.RecG versus Ity; p = 0.0035 Ity3.RecG versus Ity3; p = 0.0008 Ity3.RecN versus Ity; p<0.0001 Ity3.RecN versus Ity3. Log-Rank (Mantel-Cox) for females: p = 0.0001 Ity3.RecG versus Ity; p = 0.0520 Ity3.RecG versus Ity3; p = 0.0001 Ity3.RecN versus Ity; p = 0.0461 Ity3.RecN versus Ity3.
Contribution of Ity3 to High Bacterial Burden in Congenic and Subcongenic Mice
To characterize the phenotypic effect of Ity3 and Ity3.1 and Ity3.2 sub-loci on susceptibility to Salmonella infection, we carried out subsequent analyses using Ity, Ity3, Ity3.RecG and Ity3.RecN strains. These mice were evaluated for a number of additional phenotypes known to be related to Salmonella susceptibility including bacterial load in target tissues, clinical hematology, and pathology. As previously observed in other strains of mice, all four strains developed a mild anemia, lymphopenia and neutrophilia during infection (data not shown). No significant differences were seen between the strains in either infected or uninfected mice. Baseline and post-infection histology (H&E staining) of target organs (spleen and liver) showed no obvious histopathological difference between strains (data not shown).
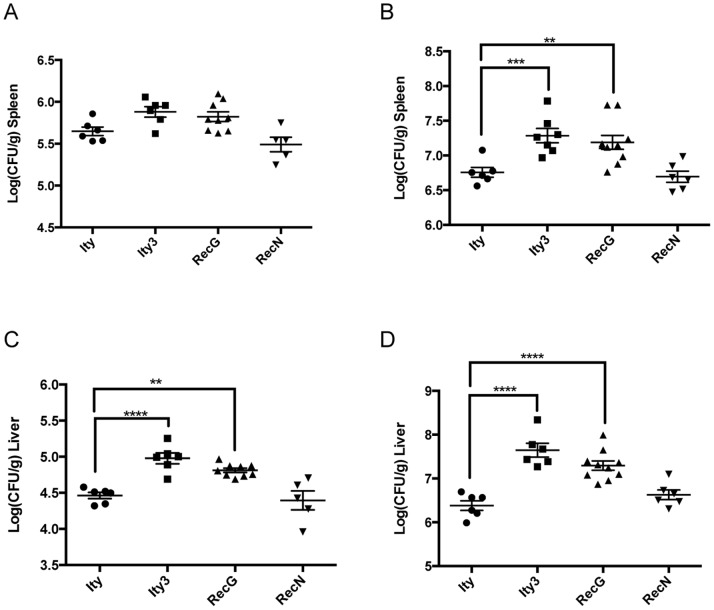
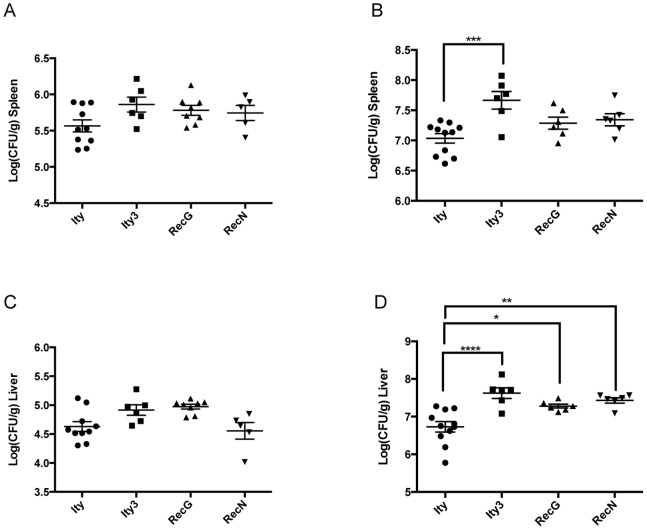
To determine if MOLF/Ei allele at Ity3 results in increase bacterial proliferation, we measured tissue bacterial burden after challenged with Salmonella Typhimurium in the spleen and liver of congenic and subcongenic mice on day 3 and day 5 post-infection. At day 3 post-infection no major differences were seen in the spleen of either males or females (Figure 3A and 4A). Higher bacterial burden was detected only in the liver of males from Ity3 and Ity3.RecG strains compared to Ity mice (Figure 3C and 4C). More pronounced differences were seen in both sexes at day 5 post infection. Significant higher bacterial load was detected in both the spleen and liver of Ity3 male and female mice when compared to the Ity strain (Figure 3B, 3D, 4B, 4D). In males, the two subcongenic mice presenting an intermediate survival phenotype behaved differently with respect to bacterial load, Ity3.RecG presented high bacterial load similarly to Ity3 and Ity3.RecN showed bacterial load similar to those observed in Ity mice (Figure 3B, 3D). In female mice, Ity3.RecG and Ity3.RecN strains showed intermediate phenotypes (Figure 4B and 4D). These data showed that the MOLF/Ei Ity3 locus contributed to high bacterial load in the spleen and liver of male and female congenic mice and suggest the involvement of the Ity3.1 locus.
Figure 3. Bacterial load in the spleen and liver of male congenic and subcongenic strains at day 3 and day 5 post-infection with Salmonella Typhimurium.
The bacterial burden in the spleen (A, B) and liver (C, D), is shown at day 3 (A, C) and day 5 (B, D). Significant differences in log CFU of congenic and subcongenic strains are shown with respect to the reference Ity strain. At day 3-post infection, there was a significant higher bacterial burden in the liver of the Ity3 and Ity3.RecG strains as compared to the Ity strain. At day 5 post infection, the bacterial loads in both the liver and spleen were significantly higher in Ity3.RecG and Ity3 males. The data were analysed by one-way ANOVA followed by Dunnett’s multiple-comparisons testing. *corresponds to a P-value of ≤0.05, **corresponds to a P-value of ≤0.01, ***corresponds to P-value ≤0.001, while ****implies a P≤0.0001.
Figure 4. Bacterial load in the spleen and liver of female congenic and subcongenic strains at day 3 and day 5 post-infection with Salmonella Typhimurium.
The bacterial burden in the spleen (A, B) and liver (C, D), is shown at day 3 (A, C) and day 5 (B, D). Significant differences in log CFU of congenic and subcongenic strains are shown with respect to the reference Ity strain. At day 5-post infection, the bacterial loads in both the liver and spleen were significantly higher in Ity3 females compared to Ity mice. The subcongenic strains Ity3.RecG and Ity3.RecN presented an intermediate phenotype. The data were analysed by one-way ANOVA followed by Dunnett’s multiple-comparisons testing. *corresponds to a P-value of ≤0.05, **corresponds to a P-value of ≤0.01, ***corresponds to P-value ≤0.001, while ****implies a P≤0.0001.
Impact of Ity3 on the Inflammatory Response
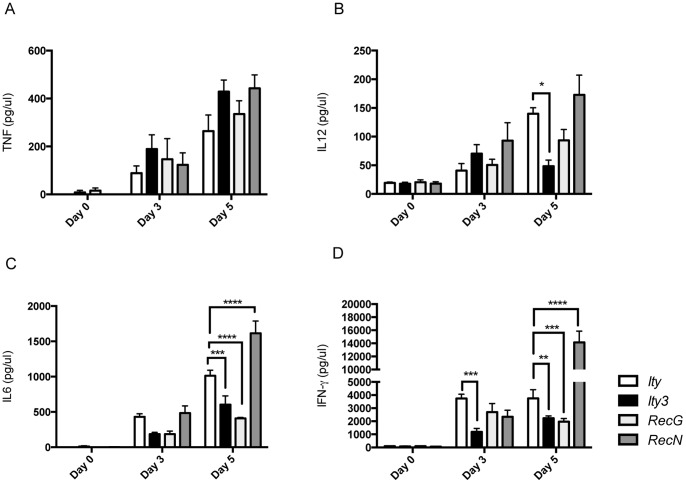
To further dissect the mechanism involved in increased bacterial load in Ity3 mice, we examine the impact of Ity3.1 and Ity3.2 on the inflammatory response to infection, by evaluating cytokine production during infection in vivo (in the sera), ex vivo (splenocytes) and during in vitro infection of BMDM from Ity, Ity3, Ity3.RecG and Ity3.RecN mice. Early during Salmonella infection, immune cells including macrophages, granulocytes and lymphocytes are central to control bacterial replication by producing IL-6, TNF, IFN-γ and IL-12 [15], [16]. We then measured these four cytokines in the sera of male and female mice at day 0 and at day 3 and 5 post infection. All four cytokines were found in greater amount in the sera of males and females during infection. Similar results were observed in both males and females although significant differences in serum cytokine levels were detected only in male congenic and subcongenic strains (Figure 5). There was no variation among strains for TNF production (Figure 5A). Similar differences between Ity and Ity3 were observed for IL-6, IFN-γ and IL-12 at day 5 post-infection with Ity3 presenting significant lower levels of these three cytokines when compared to Ity (Figure 5B–D). The strain Ity3.RecG also presented low levels of IL-6 and IFN-γ when compared to the levels detected in Ity (Figure 5C–D) whereas strain Ity3.RecN presented cytokine levels that were either equivalent to those observed in Ity (Figure 5B) or significantly higher (Figure 5C–D). Even though the two loci have opposite effects on the production of cytokines, the overall production of IL6, IFN-γ and IL-12 in response to Salmonella infection in vivo by Ity3 congenic was significantly lower compared to the Ity strain suggesting the existence of interaction between Ity3.1 and Ity3.2.
Figure 5. Serum cytokine levels in Ity, Ity3, Ity3.RecN and Ity3.RecG male mice during infection with Salmonella Typhimurium.
TNF (A), IL-12 (B), IL-6 (C) and IFN-γ (D) were measured in the serum of congenic Ity (n = 4) and Ity3 (n = 4) and sub-congenic Ity3.RecN (n = 4) and Ity3.RecG (n = 4) mice before infection and at day 3 and day 5 post infection. The data shown are representative of two experiments with n = 4 per experiment. All levels were compared to the resistant strain Ity at each time point. No major differences were observed in the expression of TNF across the four strains (A). The data were analysed by two-way ANOVA followed by Dunnett’s multiple-comparisons testing. *corresponds to a P-value of ≤0.05, **corresponds to a P-value of ≤0.01, ***corresponds to P-value ≤0.001, while ****implies a P≤0.0001.
To further study cytokine production by strain Ity3.RecG and Ity3.RecN, explanted splenocytes were stimulated with a number of PAMPs and IL-6 production was measured (Figure 6A). Consistent with the cytokine levels detected in the serum during infection, splenocytes from Ity3.RecG presented significant lower levels of IL-6 after stimulation with LPS and flagellin. In vitro infection of BMDM also showed a hyporesponsive IL-6 phenotype in Ity3.RecG mice (Figure 6B). The hyperresponsive phenotype of Ity3.RecN could not be detected in vitro. These data suggest that the Ity3.1 locus is mostly responsible for the observed reduced cytokine production in response to TLR activation.
Figure 6. IL-6 production by explanted splenocytes and BMDM from Ity, Ity3, Ity3.RecN and Ity3.RecG after stimulation with PAMPs or infection with Salmonella Typhimurium.
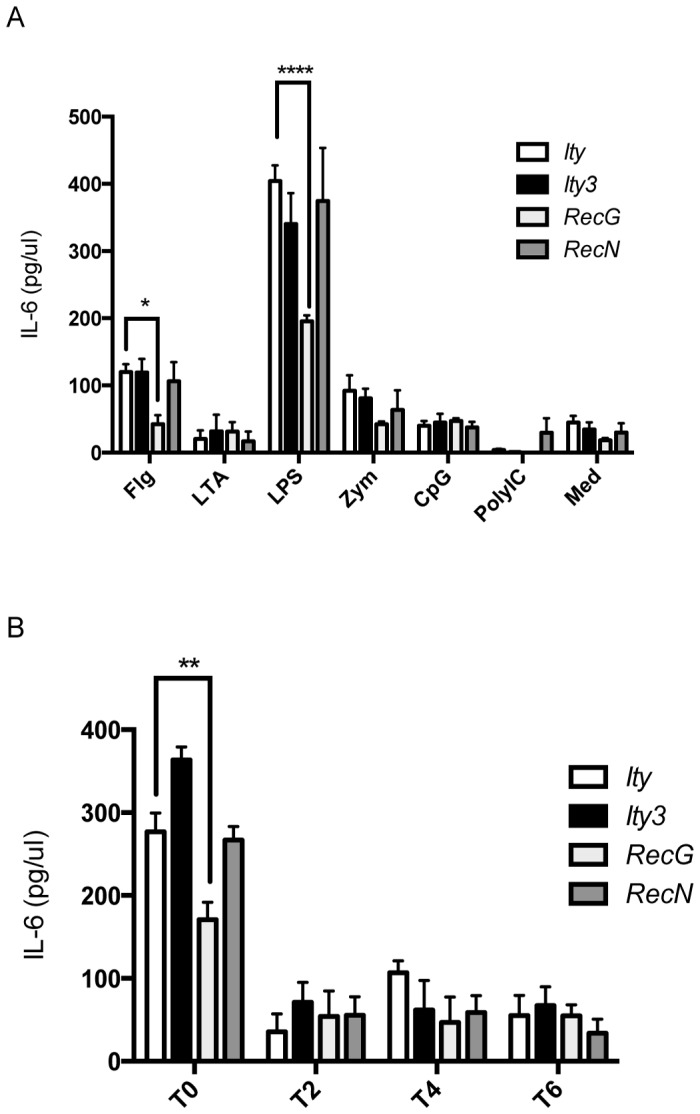
A) IL-6 production by explanted splenocytes after stimulation with flagellin (Flg), lipoteichoic acid (LTA), lipopolysaccharide (LPS), zymosan (Zym), CpG-DNA (CpG), and PolyIC. The culture medium (Med) was used as negative control. Ity (n = 4), Ity3 (n = 4), Ity3.RecN (n = 4) and Ity3.RecG (n = 4). Significant differences in IL-6 production are shown with respect to the reference Ity strain. Splenocytes from Ity3.RecG strain were hypo-responsive to stimulation with Tlr4 and Tlr5 ligands as shown by significant lower levels of IL-6 after stimulation with LPS and flagellin, respectively, as compared to the Ity strain. No major differences were seen in IL-6 production in Ity3 and Ity3.RecN strains implying that these strains do not have a defect in TLR-dependent activation of IL-6 production. The data shown are representative of two experiments with n = 4 per experiment B) IL-6 production measured in the supernatant of BMDM derived from Ity (n = 4), Ity3 (n = 4), Ity3.RecN (n = 4) and Ity3.RecG (n = 4) male mice. The data shown are representative of three experiments with n = 4 per experiment. BMDM were infected with Salmonella Typhimurium. After a period of 45 min, RPMI 1640 containing 100 µg/ml gentamycin was added for a period of 1 h (T0). The medium was subsequently replaced by RPMI 1640 containing 10 µg/ml gentamycin and IL-6 was measured after 2 (T2), 4 (T4) and 6 (T6) hrs of incubation. Significant differences in IL-6 production are shown with respect to the reference Ity strain. The data were analysed by two-way ANOVA followed by multiple-comparisons testing. *corresponds to a P-value of ≤0.05, **corresponds to a P-value of ≤0.01, ***corresponds to P-value ≤0.001, while ****implies a P≤0.0001.
Ity3.1 Influences the Production of Reactive Oxygen Species (ROS)
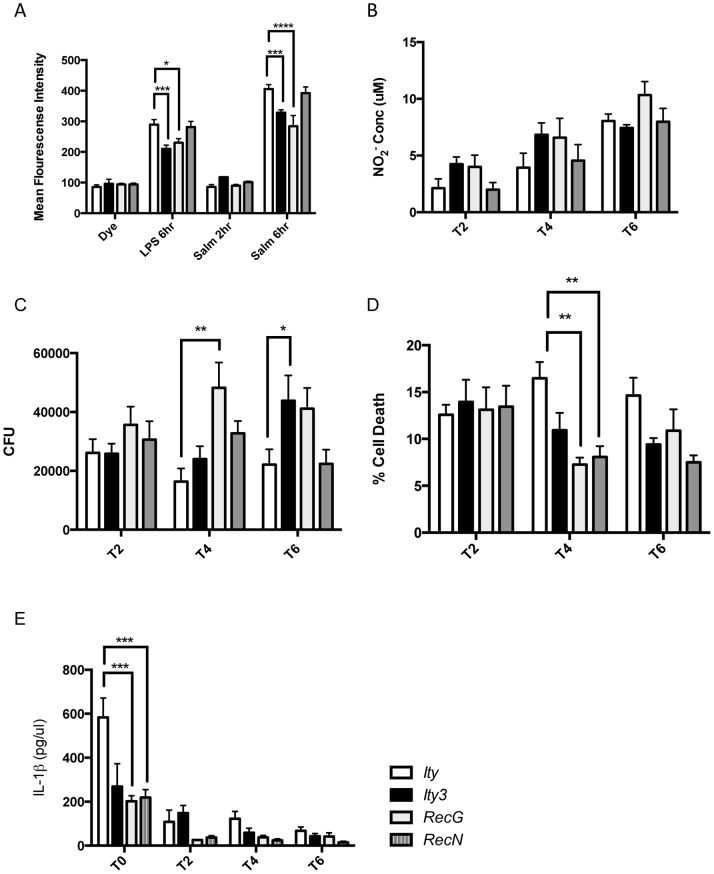
In previous studies, we have reported the candidacy of Ncf2 (a regulatory subunit of the NADPH oxidase) as the gene underlying Ity3 based on its physical location, expression analysis, coding sequence polymorphism and functional studies [9]. NADPH oxidase is known to play a crucial role in innate immunity by generating ROS that have microbicidal activity and as an activator of many signalling pathways [17]. In the current study, we measured H2O2 production by BMDM during exposure to LPS and to heat-killed Salmonella. Consistent with previous results, Ity3 showed lower ROS production after LPS and heat-killed Salmonella stimulation when compared to the control Ity strain (Figure 7A). This effect could be mapped to the Ity3.1 sublocus, the region harbouring Ncf2, since Ity3.RecG but not Ity3.RecN mice showed reduced production of ROS (Figure 7A). We also assayed nitric oxide production by BMDM derived from Ity, Ity3, Ity3.RecG and Ity3.RecN strains at various time points post infection, but no significant differences were observed across the various strains (Figure 7B). In order to assess if lower ROS production played a role in bacterial killing in Ity3.RecG, we infected BMDM with Salmonella and measured bacterial load over time. Significant differences in bacterial count were seen in the strains carrying the MOLF/Ei allele at Ity3.1 (Ity3 and Ity3.RegG) compared to strains carrying the C57BL/6 allele at Ity3.1 (Ity and Ity3.RecN) (Figure 7C). The kinetics of infection were different between Ity3 and Ity3.RegG BMDM with high CFU counts observed at earlier time point in Ity3.RecG BMDM. This illustrates that the MOLF/Ei segment at Ity3.1 leads to reduced bacterial killing by the macrophages, supporting a role for Ncf2 in susceptibility of MOLF/Ei mice to infection.
Figure 7. In vitro Salmonella Typhimurium infection, reactive oxygen species production, and nitric oxide and cytotoxicity assessment in BMDM derived from Ity, Ity3, Ity3.RecN and Ity3.RecG.
A) ROS production by BMDM was quantified following stimulation with either LPS or heat- killed Salmonella Typhimurium. Both LPS and a 6-hour incubation with Salmonella resulted in reduced H2O2 production by Ity3 and Ity3.RecG mice. Levels of nitric oxide production following infection with live Salmonella Typhimurium (B) were similar in all four strains of mice. C) The bacterial loads per well in Ity, Ity3, Ity3.RecN and Ity3.RecG after infection with Salmonella Typhimurium are shown. Bacterial loads were higher in Ity3 mice (T6) and in Ity3.RecG (T4) showing the involvement of the sub-locus Ity3.1 in controlling bacterial load in vitro. D) LDH assay was used to measure cell death after infection of BMDM with Salmonella Typhimurium. Both Ity3.RecG and Ity3.RecN showed decreased LDH release at T4 suggesting these strains have reduced cell death as compared to the congenic parental Ity strains. E) IL-1β was measured in the supernatant of BMDM infected with Salmonella and both Ity3.RecG and Ity3.RecN show reduced IL-1β production. The definition of T0, T2, T4 and T6 is given in the legend of Figure 6. Ity (n = 4), Ity3 (n = 4), Ity3.RecN (n = 4) and Ity3.RecG (n = 4). The data shown are representative of three experiments with n = 4 per experiment. The data were analysed by two-way ANOVA followed by multiple-comparisons testing. *corresponds to a P-value of ≤0.05, **corresponds to a P-value of ≤0.01, ***corresponds to P-value ≤0.001, while ****implies a P≤0.0001.
Because of the known role of ROS in cell death, we evaluated cell death in BMDM after infection with Salmonella by measuring LDH release. Significant lower LDH levels were detected in the two subcongenic Ity3.RecG and Ity3.RecN mice (Figure 7D). These observations may suggest the presence of an additional MOLF/Ei locus common to Ity3.RecG and Ity3.RecN that could play a role in cell death during infection. This locus appeared also to decrease the production of the proinflammatory cytokine IL-1β after in vitro infection (Figure 7E). Taken together, these data suggest that lower ROS production is paralleled by decreased cell death of primary BMDM infected in vitro in Ity3 and Ity3.RecG mice but not in Ity3.RecN suggesting that this cellular phenotype is not linked to the Ity3.1 but rather to an adjacent distal region of Ity3.
Discussion
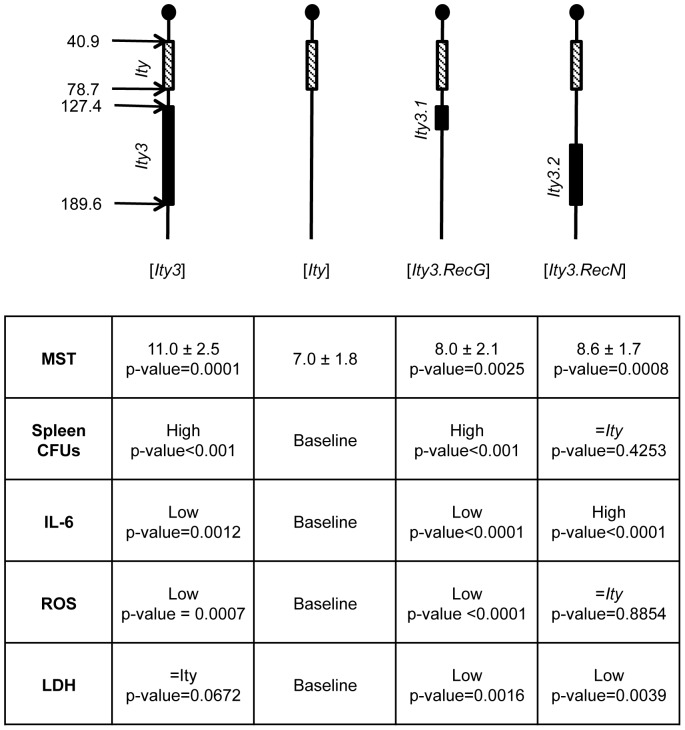
In this study, we report the refinement of the Ity3 locus to a ∼23 Mb interval using a panel of 12 subcongenic strains. We have showed that susceptible Ity3 mice carried high bacterial load in target organs, and reduced oxidative burst activity and systemic proinflammatory response. We have used the new subcongenic strains to map these phenotypes within the Ity3 interval and we identified two subloci (Ity3.1 and Ity3.2) that act together to confer susceptibility to infection in the congenic strain Ity3 (Figure 8). The Ity3.1 locus was shown to be responsible for high bacterial burden and low ROS and cytokine production indicating that the Ity3.1 locus when inherited from MOLF/Ei resulted in systemic innate immune deficiency leading to uncontrolled bacterial growth. The Ity3.2 sublocus presented a hyper-responsive phenotype with respect to cytokine production during infection, a phenotype that can lead to septic shock and consequently increased susceptibility to infection. This hyperresponsive phenotype could not be detected when MOLF/Ei alleles are present at both Ity3.1 and Ity3.2 loci indicating the presence of interaction between these two loci.
Figure 8. Schematic representation of Ity3.RegG and Ity3.RecN subcongenic strains.
Boxes represent MOLF/Ei-derived congenic intervals. The positions of Ity3.1 (151.0–156.2 Mb) and Ity3.2 (158.6–174.2 Mb) are shown on mouse chromosome 1. A summary of selected subphenotypes is shown below the map. Spleen CFUs and IL-6 in the sera were measured 5 days post infection and ROS production and LDH release 6 hrs after exposure of BMDM to Salmonella.
We have previously reported no difference in bacterial burden between the mice carrying MOLF/Ei alleles at the Ity3 locus and mice heterozygous (B6/MOLF) for the Ity3 locus [9]. In this early study, the congenic mice were at generation N5 and we used heterozygous mice at the Ity3 locus as controls because mice with the homozygous B6/B6 alleles at Ity3 mice were not available. In addition, no difference in phenotypic expression was expected between Ity3B6/B6 and Ity3MOLF/B6 because of the recessive mode of inheritance of Ity3 as established in the original F2 cross [8]. In the study by Sancho-Shimizu et al [9], [12] bacterial loads during infection were similar in Ity3MOLF/MOLF and Ity3MOLF/B6 mice which contrast with the significant difference observed in the current study when Ity3MOLF/MOLF mice were compared to Ity3B6/B6 suggesting that the transfer of Ity3 onto a C57BL/6J background for more than 10 generations, results in a codominant mode of inheritance for the bacterial load phenotype. These observations highlight the complex nature of the expressivity of Ity3 with respect to genetic background during infection with Salmonella.
Our study demonstrated that there was a sex-dependent effect in the outcome of infection with Salmonella in congenic mice, the male Ity strain being more resistant to infection than female Ity mice although males and females mice carrying Ity3 presented the same degree of susceptibility. There is significant amount of research illustrating the fact that sex hormones exert potent effects on the immune system [18]–[20]. Previous studies in our laboratory have identified sex-specific QTLs in a chronic model of Salmonella persistence [21] and treatment of female mice with estradiol was shown to increase susceptibility to Salmonella infection, whereas treatment with progesterone increased resistance to infection [22].
The Ity3 segment is a highly gene rich locus (272 protein coding genes and 107 non coding RNA) and this region of chromosome 1 harbours a large number of QTLs (56 QTLs are listed at MGI) influencing different aspects of metabolism and physiology, and immunological, cancer and behavioural traits. This QTL-rich region is also known to modulate the expression of many genes and phenotypes [11], [23]. The corresponding region in humans, Chr 1q21-q25, has been associated with neurobehavioural and metabolic traits (reviewed in [11]). Two additional QTLs directly involved in the host response to infection were mapped to the Ity3 region, Berr1 (berghei resistance locus 1) which confers resistance to cerebral malaria [24] and Ssta2 (susceptibility to Salmonella Typhimurium antigens 2) [25]. The Ssta2 locus was mapped by intercrossing two mouse strains selected for high or low antibody response to flagellar antigens of Salmonella. The high producing mice were more susceptible to infection and showed reduced IFNγ levels in spleen homogenates, an observation that is consistent with the reduced IFNγ production in Ity3 susceptible mice during infection.
In addition to highlighting the complex nature of the innate immune response driven by the Ity3 locus, the current study further supports the hypothesis that reduced Ncf2 activity leads to reduced activation of NF-κB signalling and bactericidal activity [26]. In addition to playing an active role in killing bacteria by producing toxic reactive oxygen intermediaries, ROS is a key signal modulator of TLR activated autophagy of phagosomes, and of caspase-1-induced pyropoptosis [27]–[29]. In fact, we did observe reduced IL-1β secretion and reduced cell death in BMDM of Ity3.RecG and Ity3.RecN strains suggesting that pyroptosis may be a bacterial killing mechanism affected by low ROS levels during Salmonella infection.
In summary, we have shown the existence of two distinct loci within Ity3 that affect different aspects of the immune response and act together to confer susceptibility to Salmonella infection in MOLF/Ei mice. We provide additional evidence of the candidacy of Ncf2 as the gene responsible for the Ity3.1 locus. The validation of Ncf2 as the gene underlying Ity3.1 is awaiting the creation of a knock-in mouse model and the identification of the gene underlying Ity3.2 will provide a better understanding of the genetic complexity of Ity3.
Acknowledgments
We are grateful for the technical assistance of Nadia Prud’homme, Line Larivière, Megan Eva and Catherine Paré.
Funding Statement
RTK is a recipient of a studentship award from the Fonds de la Recherche en Santé du Québec. KEY is a recipient of a Faculty of Medicine Internal Studentship. This work was supported by a Canadian Institutes of Health Research Grant to DM. DM is a McGill Dawson Scholar. The funders had no role in study design, data collection and analysis, decision to publish, or preparation of the manuscript.
References
- 1. Fluit AC (2005) Towards more virulent and antibiotic-resistant Salmonella? FEMS Immunol Med Microbiol 43: 1–11. [DOI] [PubMed] [Google Scholar]
- 2. Mishra RP, Oviedo-Orta E, Prachi P, Rappuoli R, Bagnoli F (2012) Vaccines and antibiotic resistance. Curr Opin Microbiol 15: 596–602. [DOI] [PubMed] [Google Scholar]
- 3. Majowicz SE, Musto J, Scallan E, Angulo FJ, Kirk M, et al. (2010) The global burden of nontyphoidal Salmonella gastroenteritis. Clin Infect Dis 50: 882–889. [DOI] [PubMed] [Google Scholar]
- 4. Buckle GC, Walker CL, Black RE (2012) Typhoid fever and paratyphoid fever: Systematic review to estimate global morbidity and mortality for 2010. J Glob Health 2: 10401. [DOI] [PMC free article] [PubMed] [Google Scholar]
- 5. Tsolis RM, Xavier MN, Santos RL, Baumler AJ (2011) How to become a top model: impact of animal experimentation on human Salmonella disease research. Infect Immun 79: 1806–1814. [DOI] [PMC free article] [PubMed] [Google Scholar]
- 6. Roy MF, Malo D (2002) Genetic regulation of host responses to Salmonella infection in mice. Genes Immun 3: 381–393. [DOI] [PubMed] [Google Scholar]
- 7. Vidal S, Tremblay ML, Govoni G, Gauthier S, Sebastiani G, et al. (1995) The Ity/Lsh/Bcg locus: natural resistance to infection with intracellular parasites is abrogated by disruption of the Nramp1 gene. J Exp Med 182: 655–666. [DOI] [PMC free article] [PubMed] [Google Scholar]
- 8. Sebastiani G, Olien L, Gauthier S, Skamene E, Morgan K, et al. (1998) Mapping of genetic modulators of natural resistance to infection with Salmonella typhimurium in wild-derived mice. Genomics 47: 180–186. [DOI] [PubMed] [Google Scholar]
- 9. Sancho-Shimizu V, Malo D (2006) Sequencing, expression, and functional analyses support the candidacy of Ncf2 in susceptibility to Salmonella typhimurium infection in wild-derived mice. J Immunol 176: 6954–6961. [DOI] [PubMed] [Google Scholar]
- 10. Mastroeni P (2002) Immunity to systemic Salmonella infections. Curr Mol Med 2: 393–406. [DOI] [PubMed] [Google Scholar]
- 11. Mozhui K, Ciobanu DC, Schikorski T, Wang X, Lu L, et al. (2008) Dissection of a QTL hotspot on mouse distal chromosome 1 that modulates neurobehavioral phenotypes and gene expression. PLoS Genet 4: e1000260. [DOI] [PMC free article] [PubMed] [Google Scholar]
- 12. Sancho-Shimizu V, Khan R, Mostowy S, Lariviere L, Wilkinson R, et al. (2007) Molecular genetic analysis of two loci (Ity2 and Ity3) involved in the host response to infection with Salmonella typhimurium using congenic mice and expression profiling. Genetics 177: 1125–1139. [DOI] [PMC free article] [PubMed] [Google Scholar]
- 13. Khan R, Sancho-Shimizu V, Prendergast C, Roy MF, Loredo-Osti JC, et al. (2012) Refinement of the genetics of the host response to Salmonella infection in MOLF/Ei: regulation of type 1 IFN and TRP3 pathways by Ity2. Genes Immun 13: 175–183. [DOI] [PubMed] [Google Scholar]
- 14. Ullman-Cullere MH, Foltz CJ (1999) Body condition scoring: a rapid and accurate method for assessing health status in mice. Lab Anim Sci 49: 319–323. [PubMed] [Google Scholar]
- 15. Coburn B, Grassl GA, Finlay BB (2007) Salmonella, the host and disease: a brief review. Immunol Cell Biol 85: 112–118. [DOI] [PubMed] [Google Scholar]
- 16. Broz P, Ohlson MB, Monack DM (2012) Innate immune response to Salmonella typhimurium, a model enteric pathogen. Gut Microbes 3: 62–70. [DOI] [PMC free article] [PubMed] [Google Scholar]
- 17. Lam GY, Huang J, Brumell JH (2010) The many roles of NOX2 NADPH oxidase-derived ROS in immunity. Semin Immunopathol 32: 415–430. [DOI] [PubMed] [Google Scholar]
- 18. Hou J, Zheng WF (1988) Effect of sex hormones on NK and ADCC activity of mice. Int J Immunopharmacol 10: 15–22. [DOI] [PubMed] [Google Scholar]
- 19. McKay LI, Cidlowski JA (1999) Molecular control of immune/inflammatory responses: interactions between nuclear factor-kappa B and steroid receptor-signaling pathways. Endocr Rev 20: 435–459. [DOI] [PubMed] [Google Scholar]
- 20. D'Agostino P, Milano S, Barbera C, Di Bella G, La Rosa M, et al. (1999) Sex hormones modulate inflammatory mediators produced by macrophages. Ann N Y Acad Sci 876: 426–429. [DOI] [PubMed] [Google Scholar]
- 21. Caron J, Lariviere L, Nacache M, Tam M, Stevenson MM, et al. (2006) Influence of Slc11a1 on the outcome of Salmonella enterica serovar Enteritidis infection in mice is associated with Th polarization. Infect Immun 74: 2787–2802. [DOI] [PMC free article] [PubMed] [Google Scholar]
- 22. Kita E, Yagyu Y, Nishikawa F, Hamuro A, Oku D, et al. (1989) Alterations of host resistance to mouse typhoid infection by sex hormones. J Leukoc Biol 46: 538–546. [DOI] [PubMed] [Google Scholar]
- 23. Loguercio S, Overall RW, Michaelson JJ, Wiltshire T, Pletcher MT, et al. (2010) Integrative analysis of low- and high-resolution eQTL. PLoS One 5: e13920. [DOI] [PMC free article] [PubMed] [Google Scholar]
- 24. Longley R, Smith C, Fortin A, Berghout J, McMorran B, et al. (2011) Host resistance to malaria: using mouse models to explore the host response. Mamm Genome 22: 32–42. [DOI] [PubMed] [Google Scholar]
- 25. Trezena AG, Souza CM, Borrego A, Massa S, Siqueira M, et al. (2002) Co-localization of quantitative trait loci regulating resistance to Salmonella typhimurium infection and specific antibody production phenotypes. Microbes Infect 4: 1409–1415. [DOI] [PubMed] [Google Scholar]
- 26. Laroux FS, Romero X, Wetzler L, Engel P, Terhorst C (2005) Cutting edge: MyD88 controls phagocyte NADPH oxidase function and killing of gram-negative bacteria. J Immunol 175: 5596–5600. [DOI] [PubMed] [Google Scholar]
- 27. Huang J, Canadien V, Lam GY, Steinberg BE, Dinauer MC, et al. (2009) Activation of antibacterial autophagy by NADPH oxidases. Proc Natl Acad Sci U S A 106: 6226–6231. [DOI] [PMC free article] [PubMed] [Google Scholar]
- 28. Cruz CM, Rinna A, Forman HJ, Ventura AL, Persechini PM, et al. (2007) ATP activates a reactive oxygen species-dependent oxidative stress response and secretion of proinflammatory cytokines in macrophages. J Biol Chem 282: 2871–2879. [DOI] [PMC free article] [PubMed] [Google Scholar]
- 29. Miao EA, Rajan JV, Aderem A (2011) Caspase-1-induced pyroptotic cell death. Immunol Rev 243: 206–214. [DOI] [PMC free article] [PubMed] [Google Scholar]


