

Abstract
Context:
Thyroid cancer incidence rates in the United States and globally have increased steadily over the last 40 years, primarily due to a tripling of the incidence of papillary thyroid carcinoma (PTC).
Objective:
The purpose of this study was to analyze trends in demographic, clinical, pathologic, and molecular characteristics of PTC from 1974 to 2009.
Design and Setting:
We identified and histologically reviewed 469 consecutive cases of PTC from one US institution from 4 preselected periods (1974 to 1985, 1990 to 1992, 2000, and 2009) and assessed BRAF and RAS point mutations and RET/PTC rearrangements among 341 tumors ≥0.3 cm in size. Changes over time were analyzed using polytomous and binary logistic regression; all analyses were adjusted for age and sex.
Results:
During this period, the median age of patients at diagnosis increased from 37 to 53 years (P < .001) and the percentage of microcarcinomas (≤1.0 cm) increased from 33% to 51% (P < .001), whereas extrathyroidal extension and advanced tumor stage decreased from 40% to 21% (P = .005) and from 43% to 28% (P = .036), respectively. Changes in tumor histopathology showed a decrease in classic PTC and an increase in the follicular variant (P < .001). The proportion of tumors with a BRAF mutation was stable (∼46%) but increased from 50% to 77% (P = .008) within classic papillary PTCs. The proportion of tumors with RAS mutations increased from 3% to 25% and within follicular pattern tumors from 18% to 44% (P < .001). The proportion of RET/PTC rearrangements decreased from 11% to 2% (P = .038).
Conclusions:
Similar to US national trends, we found an increasing age at diagnosis and greater detection of smaller-sized intrathyroidal PTCs. However, the overall proportion of BRAF mutations remained stable. Sharply rising percentages of the follicular variant histology and RAS mutations after 2000 suggest new and more recent etiologic factors. The increased incidence is not likely to be due to environmental or therapeutic radiation because the percentage of RET/PTC rearrangements decreased.
The incidence of thyroid cancer has increased over the past 4 decades in many countries, including the United States (1–5). This increase is primarily due to the rise in the incidence of papillary thyroid cancer (PTC), whereas the rates of follicular, anaplastic, and medullary thyroid cancer have not changed markedly (2, 3, 6). Data from the Surveillance, Epidemiology and End Results (SEER) program indicate that the age-adjusted incidence rate of PTC in the United States in 2005 to 2006 was 9.25 per 100,000, a 3.2-fold increase since 1973 to 1974 when the incidence was 2.88 per 100,000 (7). Over the past 5 years, thyroid cancer rates in the United States have been growing faster than those of any other cancer type (8).
Reasons for the rising incidence of PTC remain unknown. About half of the increase in PTC rates occurred in tumors ≤1.0 cm, with another 30% for tumors of 1.1 to 2 cm and 20% for tumors of >2.0 cm (9), so the increase is not likely to be entirely due to a greater use of ultrasound and fine needle aspiration biopsy to detect small tumors. Because exposure to ionizing radiation during childhood is a well-established risk factor for thyroid cancer (10, 11), it is conceivable that the rising incidence may reflect increasing use of medical radiation procedures, such as diagnostic computed tomography scans (12, 13). Other possible temporally relevant risk factors include body mass index, smoking, environmental chemicals, and reproductive patterns (9). Finally, incidence rates may also be affected by changes in the histopathologic criteria for the encapsulated follicular variant of PTC, which have gradually become more permissive during the last 20 years (14).
The molecular pathogenesis of PTC involves several known mutational events, including point mutations in the BRAF and RAS genes and chromosomal rearrangements of the RET gene called RET/PTC. These genetic alterations lead to activation of the MAPK signaling pathway (15), and one of these mutations is found in approximately 70% of all PTCs (16). Studies have linked different mutational types with specific etiologic factors for thyroid cancer. RET/PTC chromosomal rearrangements have been associated with radiation exposure (Chernobyl, atomic bomb survivors in Japan, and radiotherapy), whereas BRAF and RAS point mutations are rare in radiation-associated cancer and are more likely to result from chemical carcinogenesis, possibly in association with high dietary iodine levels or other environmental exposures (15, 17, 18). Therefore, tracking changes in mutational profiles over time may provide clues for understanding the increase in thyroid cancer incidence. In addition, BRAF mutations are associated with invasive and clinically more aggressive PTCs (19). Thus, changes in the proportions of BRAF mutations may have important long-term clinical implications.
To our knowledge, this is the first study to examine temporal changes in mutational profiles and standardized histopathologic features of thyroid cancer in the United States over the last 4 decades, which provides novel insights into the increasing incidence of thyroid cancer.
Patients and Methods
Study patients and tumor samples
The study protocol was approved by the institutional review boards of the University of Pittsburgh and the National Cancer Institute. A total of 469 cases with a histologic diagnosis of PTC were retrieved from the Department of Pathology, University of Pittsburgh Medical Center in 4 preselected time periods: 1974 to 1985 (n = 127), 1990 to 1992 (n = 59), 2000 (n = 53), and 2009 (n = 230). More cases were selected from the earliest and latest periods to increase the power for identifying temporal trends. Cases were chosen consecutively within each of the preselected time periods until the numeric target based on a priori sample size calculations was fulfilled. Clinical and demographic information was abstracted from pathology reports. Two pathologists (C.K.J. and Y.E.N.) reviewed histologic slides to verify and standardize the histologic diagnosis, tumor variants, and growth patterns using the current World Health Organization criteria (20). Follicular variant PTCs were subclassified into encapsulated and infiltrative types (21). The TNM classification system was used for pathologic staging (22). Out of 469 selected cases, 38 had no paraffin blocks available and a further 70 had tumors <0.3cm. Of the 361 remaining cases with tumors ≥0.3 cm in size, 20 contained an insufficient amount of residual tumor tissue, and, therefore, molecular analyses were conducted for 341 tumors. The respective breakdown of cases by time period was as follows: 1974–1985 (n = 89), 1990–1992 (n = 41), 2000 (n = 40), and 2009 (n = 171).
DNA isolation
Five 5-μm unstained paraffin sections were used for manual microdissection of tumor tissue. Genomic DNA was extracted using a DNeasy Blood and Tissue Kit (QIAGEN). For paraffin blocks stored for longer than 10 years, digestion with proteinase K was extended from 16 hours to 24 to 48 hours.
Mutational analysis for BRAF and RAS genes
Mutation screening for BRAF codons 599, 600, and 601, NRAS codon 61, HRAS codon 61, and KRAS codons 12 and 13 was performed using real-time LightCycler PCR (Roche) and fluorescence melting curve analysis as reported previously (23). PCR amplification of DNA from old archival tissues was extended from 40 to 45 cycles. All samples positive for mutations on melting curve analysis were confirmed by bidirectional sequencing on an ABI 3100 sequencer using the Big Dye Terminator Kit (Applied Biosystems) (23).
Detection of RET/PTC rearrangements
RET/PTC1 and RET/PTC3 rearrangements were detected by dual-color interphase fluorescence in situ hybridization. BAC clones RP11–351D16, RP11–369L1, and RP11–481A12 were used to generate probes for the RET, CCDC6 (H4) and NCOA4 (ELE1) genes, respectively. The RET probe was labeled with Green-dUTP using a nick translation kit (Vysis). Either the CCDC6 or theNCOA4 probe was labeled with Orange-dUTP (Vysis). Hybridization was performed, and slides were scored as described previously (24). Tumors with ≥9% of cells with 3 RET signals were considered positive for RET/PTC rearrangement (24). All positive cases were then hybridized with probes for either RET and CCDC6 or RET and NCOA4 to identify the type of RET/PTC rearrangement.
Statistical analysis
We assessed demographic, pathologic, and molecular changes, ie, trends, over the 4 time periods in several ways. We used standard polytomous regression analyses to evaluate changes over time for outcomes with multiple levels (tumor size, histopathology, and others). Because no obvious outcome level represents a referent “control,” we adjusted parameter estimates (β) and resulting odds ratios (ORs) ([exp(β)]) to reflect relative deviations from no (ie, 0) trend across calendar years (Table 1). In addition, for presentation purposes, ORs were scaled to represent changes per 10 years over the study period. The ORs allow easier interpretation of trends; ORs >1.00 denote increasing trends over time, ORs <1.00 denote decreasing trends over time, and ORs equal to 1.00 denote consistency with no changes over time. OR confidence intervals (CIs) cannot be readily computed for the polytomous regression contrasts given in Table 1. However, as below, 95% CI are given for the polytomous regressions with assigned reference categories and for the bivariate logistic regressions reported in Supplemental Table 1 (published on The Endocrine Society's Journals Online web site at http://jcem.endojournals.org). The P value for heterogeneity reflects a potential significant difference in trends over time across outcome levels. When the test of heterogeneity was borderline significant (P ≤ .10), the selected outcome levels were compared, and the P values specific to each comparison were calculated (as in the analyses of tumor size, histopathology, and lymph node stage). All polytomous regression analyses were repeated by setting one arbitrarily chosen outcome level as a referent. In addition, we repeated regression analyses for outcomes with multiple levels by categorizing them into binary outcomes (one level vs all others combined). For binary outcomes, polytomous regression reduces to binary logistic regression. In this simplest case, if the proportion at one outcome level increases over time, then the proportion at the other outcome level must decrease. We present the results and details of polytomous regression models with assigned referent levels as well as bivariate logistic models in Supplemental Table 1. Tests of trend and heterogeneity of trends in the polytomous regression models and in the bivariate logistic models were derived from the likelihood ratio test (25). Epicure software (Hirosoft International) was used for binary regression analyses, whereas SPSS software (IBM SPSS version 21.0; IBM Corp) was used for polytomous logistic regression analyses and R software (R version 3.0.1, http://www.r-project.org/) was used for linear regression analyses of continuous outcomes, eg, age. Certain analyses with very small numbers of outcomes were analyzed also, using exact logistic regression methods, via LogXact 10 (Cytel, Inc). All tests were two-sided; unless otherwise noted, all analyses were adjusted for age and sex. See the Supplemental Methods for additional information.
Table 1.
Trends in Clinical and Pathologic Characteristics of PTC Over Time, University of Pittsburgh Medical Center 1974–2009
| Characteristic | Time Period |
Scaled ORa | Pb | |||
|---|---|---|---|---|---|---|
| 1974–1985 (n = 127) | 1990–1992 (n = 59) | 2000 (n = 53) | 2009 (n = 230) | |||
| Median age, y (range) | ||||||
| All | 37 (10–77) | 51 (12–78) | 50 (20–82) | 53 (15–89) | NA | <.001 |
| Female | 38 (10–77) | 41 (12–78) | 50 (20–82) | 51 (19–89) | <.001 | |
| Male | 34 (18–66) | 56 (23–77) | 52 (28–66) | 56 (15–78) | <.001 | |
| Sex, n (%) | ||||||
| Female | 92 (72.4) | 43 (72.9) | 46 (86.8) | 176 (76.5) | 1.08 | .113c |
| Male | 35 (27.6) | 16 (27.1) | 7 (13.2) | 54 (23.5) | 0.93 | |
| Tumor size, n (%) | ||||||
| ≤1.0 cm | 42 (33.1) | 26 (44.1) | 22 (41.5) | 118 (51.3) | 1.16 | |
| 1.1–2.0 cm | 48 (37.8) | 13 (22.0) | 13 (24.5) | 59 (25.7) | 0.94 | |
| 2.1–3.0 cm | 21 (16.5) | 9 (15.3) | 9 (17.0) | 21 (9.1) | 0.86 | .100 |
| 3.1–4.0 cm | 7 (5.5) | 6 (10.2) | 4 (7.5) | 16 (7.0) | 1.06 | |
| >4.0 cm | 9 (7.1) | 5 (8.5) | 5 (9.4) | 16 (7.0) | 0.99 | |
| Histologic variants, n (%) | ||||||
| Classic papillary | 66 (52.0) | 25 (42.4) | 20 (37.7) | 43 (18.7) | 0.72 | |
| Follicular | 13 (10.2) | 2 (3.4) | 7 (13.2) | 58 (25.2) | 1.53 | |
| Microcarcinomad | 42 (33.1) | 26 (44.1) | 22 (41.5) | 118 (51.3) | 1.12 | <.001 |
| Tall cell | 1 (0.8) | 5 (8.5) | 0 (0.0) | 8 (3.5) | 1.06 | |
| Others | 5 (3.9) | 1 (1.7) | 4 (7.5) | 3 (1.3) | 0.76 | |
| Histologic growth pattern, n (%) | ||||||
| Classic papillary | 97 (76.4) | 31 (58.5) | 29 (56.9) | 82 (36.3) | 0.79 | |
| Follicular | 23 (18.1) | 16 (30.2) | 13 (25.5) | 128 (56.6) | 1.51 | <.001 |
| Microcarcinomae | 0 (0.0) | 6 (10.2) | 2 (3.8) | 4 (1.7) | 0.88 | |
| Tall cell | 1 (0.8) | 5 (8.5) | 4 (7.5) | 12 (5.2) | 0.79 | |
| Others | 6 (4.7) | 1 (1.7) | 5 (9.4) | 4 (1.7) | 1.21 | |
| Tumor multifocality, n (%) | ||||||
| Single | 71 (55.9) | 34 (57.6) | 32 (60.4) | 124 (53.9) | 0.99 | .793 |
| Multiple | 56 (44.1) | 25 (42.4) | 21 (39.6) | 106 (46.1) | 1.01 | |
| Extrathyroidal extension, n (%) | ||||||
| Negative | 76 (59.8) | 43 (72.9) | 38 (73.1) | 178 (79.1) | 1.14 | .005 |
| Positive | 51 (40.2) | 16 (27.1) | 14 (26.9) | 47 (20.9) | 0.88 | |
| Tumor stage, n (%)f | ||||||
| T1–2 | 72 (56.7) | 40 (67.8) | 34 (65.4) | 164 (71.9) | 1.09 | |
| T3–4 | 55 (43.3) | 19 (32.2) | 18 (34.6) | 64 (28.1) | 0.91 | .036 |
| Node stage, n (%) | ||||||
| N0 | 21 (16.5) | 9 (15.3) | 14 (26.4) | 88 (38.3) | 1.39 | |
| N1 | 34 (26.8) | 17 (28.8) | 11 (20.8) | 42 (18.3) | 0.91 | <.001 |
| NX | 72 (56.7) | 33 (55.9) | 28 (52.8) | 100 (43.5) | 0.79 | |
Abbreviation: NA, not applicable.
The scaled OR ([exp(β)]) represents the changes per 10 years over the study period. The ORs for the trends represent relative departures from no trend with calendar time. ORs and CIs for other logistic models with slightly different assignments for referent groups are provided in Supplemental Table 1.
Unless otherwise described, P for linear trend is adjusted for age and gender.
Adjusted for age only.
Microcarcinoma is a tumor ≤1.0 cm in size.
The growth pattern for these microcarcinomas could not be determined.
Three tumors of unknown stage were excluded.
Results
Clinical and pathologic changes during 4 time periods
The median age at diagnosis for PTC in female and male patients increased from 38 and 34 years in 1974–1985 to 51 and 56 years in 2009 (P < .001) (Table 1). Although there was no significant variation in tumor size over time overall (P = .100) (Table 1), the trends for tumors >1.0 cm vs ≤1.0 cm were significantly different (P = .012) (Supplemental Table 1). This finding is consistent with a significant increase in microcarcinomas (tumors ≤1.0 cm) from 33% to 51% and a corresponding significant decrease in larger tumors over time (Supplemental Table 1). The age trends by tumor size (adjusted for period and sex) are shown in Supplemental Table 2. As can be seen, these are borderline significant for the group of tumors ≤1.0 cm vs >1 cm (P = .056), with relative risk increasing with age (relative risk = 1.14/10 years; 95% CI, 1.01 to 1.30) and otherwise not. There was a significant relative variation in the histopathology of PTCs over time both when microcarcinomas were considered as a separate group (P < .001) (Table 1 and Supplemental Table 1) and when these were reclassified according to the histological growth pattern (P < .001) (Table 1 and Supplemental Table 1). In both instances, the variation observed was due to a highly significant relative decrease in the percentage of the classic type of PTC (P < .001) and a corresponding significant relative increase in the follicular variant of PTC (P < .001) (Figure 1, A and B). The increase in follicular variant PTC over time involved not only the encapsulated follicular variant (P = .002), for which diagnostic criteria changed over time, but also the infiltrative follicular variant (P < .001), for which diagnostic criteria remained unchanged (Figure 1C).
Figure 1.
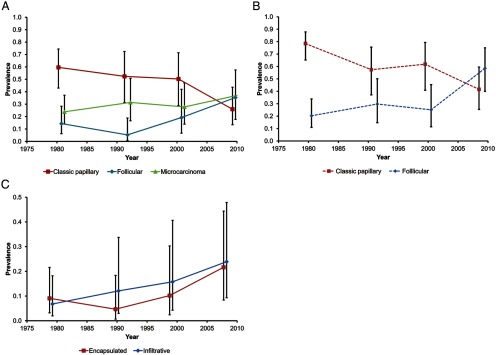
Time trends in the age- and sex-adjusted prevalence (with 95% CI) of specific histopathologic types of PTC. A, Time trends for the most common types of PTC: classic papillary, follicular variant, and microcarcinoma defined as tumor ≤1 cm in size. B, Time trends for classic papillary and follicular variant of PTC irrespective of tumor size, ie, with microcarcinomas reclassified based on their growth pattern. C, Time trends for encapsulated and infiltrative types of the follicular variant of PTC (University of Pittsburgh Medical Center, 1974–2009).
Other significant changes over time included a reduction in the percentage of extrathyroidal tumor extension (P = .005) (Table 1), an increase in the percentage of tumors of stage 1 to 2 (P = .036, Table 1), and an increase in the percentage of tumors with no lymph node metastases (N0) (P < .001, Table 1) with a corresponding decrease in the number of tumors with no information on lymph node metastases (NX). If changes were restricted to classic papillary or follicular growth pattern PTCs (irrespective of size), similar patterns of calendar year variation of N0 and NX stages were observed (data not shown). However, the frequency of tumor multifocality did not significantly vary over time (P = .793) (Table 1). Notably, the trends in histopathologic characteristics of PTCs were not due to a change in the extent of histopathologic analysis of thyroidectomy specimens over time, because the number of thyroid tissue blocks and sections examined per sample were similar in all time periods (mean, 10.0–12.8 sections per case).
Based on the review of surgical pathology reports, a clinical history of ionizing radiation exposure was more frequently recorded in 1974–1985 (19%) than in other time periods (eg, in 2009 [1.3%]) (P < .001, data not shown). There was a significant increase in the percentage of patients with a recorded clinical history of hyperparathyroidism over time (0.8%–8.3%, P = .006, data not shown).
Mutational analysis
A total of 341 tumors (72.7%) were ≥0.3 cm in size and had sufficient residual tumor tissue for mutational analysis, including 89 (70.1%) from 1974 to 1985, 41 (69.5%) from 1990 to 1992, 40 (75.5%) from 2000, and 171 (74.3%) from 2009. In the 1974–1985 time period, the analysis was successful in 92% for HRAS, 89% for BRAF, 78% for NRAS, 46% for KRAS, and 79% for RET/PTC. In the more recent time periods, >95% of cases were successfully analyzed for all mutations. All mutations detected in PTCs were mutually exclusive and nonoverlapping.
Trends in BRAF mutations
We identified 151 BRAF mutations in 329 cases (Table 2), including 149 V600E and 2 cases with double mutations, one T599R and V600E and one T599I and K601E. The percentage of BRAF mutations overall was stable over time, fluctuating between 41% and 58% (Table 2 and Figure 2). Further analysis revealed that the percentage of BRAF mutations in classic PTCs significantly increased from 50% to 77% (P = .008) (Table 3), whereas there was no change in the percentage of BRAF mutations in the follicular variant of PTC (P = .827) (Table 3). When classic variant BRAF-positive PTCs were separated by size, there was no evidence that the percentage of microcarcinomas within this tumor type changed significantly over time (P = .583) (Table 3).
Table 2.
Changes in Prevalence of Somatic Mutations in PTC Over Time, University of Pittsburgh Medical Center, 1974–2009
| Mutation | Time Period |
Pa | |||
|---|---|---|---|---|---|
| 1974–1985 | 1990–1992 | 2000 | 2009 | ||
| BRAF, n (%) | 34/79 (43.0) | 24/41 (58.5) | 23/40 (57.5) | 70/169 (41.4) | .273 |
| RAS (total), n (%) | 2/68 (2.9) | 1/41 (2.4) | 1/40 (2.5) | 42/169 (24.9) | <.001 |
| HRAS | 1/82 (1.2) | 1/41 (2.4) | 1/40 (2.5) | 8/169 (4.7) | .102b |
| NRAS | 1/69 (1.4) | 0/40 (0.0) | 0/40 (0.0) | 32/169 (18.9) | <.001 |
| KRAS | 0/41 (0.0) | 0/39 (0.0) | 0/40 (0.0) | 2/169 (1.2) | .099b |
| RET/PTC (total), n (%) | 8/70 (11.4) | 2/33 (6.1) | 2/38 (5.3) | 4/169 (2.4) | .038 |
| RET/PTC1 | 6/70 (8.6) | 1/33 (3.0) | 2/38 (5.3) | 3/169 (1.8) | .127 |
| RET/PTC3 | 2/70 (2.9) | 1/33 (3.0) | 0/38 (0.0) | 1/169 (0.6) | .153 |
P value for linear trend adjusted for age and sex. Results were obtained by fitting binomial logistic models via maximum likelihood. Comparisons are for mutation present vs all others.
Adjusted for age only.
Figure 2.

Time trends in the age- and sex-adjusted prevalence (with 95% CI) of the three mutation types in papillary thyroid carcinoma (University of Pittsburgh Medical Center, 1974–2009).
Table 3.
Trends in Prevalence of BRAF and Ras Mutations by PTC Growth Pattern, University of Pittsburgh Medical Center, 1974–2009
| Time Period |
Pa | ||||
|---|---|---|---|---|---|
| 1974–1985 | 1990–1992 | 2000 | 2009 | ||
| BRAF, n (%) | |||||
| Classic papillaryb | 31/62 (50.0) | 16/22 (72.7) | 17/24 (70.8) | 50/65 (76.9) | .008 |
| Microcarcinomac | 10/31 (32.3) | 3/16 (18.8) | 4/17 (23.5) | 19/50 (38.0) | .583 |
| Follicularb | 0/12 (0.0) | 3/13 (23.1) | 0/9 (0.0) | 9/88 (10.2) | .827 |
| RAS (total), n (%) | |||||
| Classic papillary | 0/52 (0.0) | 0/21 (0.0) | 0/24 (0.0) | 1/65 (1.5) | NA |
| Follicular | 2/11 (18.2) | 1/13 (7.7) | 1/9 (11.1) | 39/88 (44.3) | <.001 |
| Microcarcinomac | 2/2 (100.0) | 1/1 (100.0) | 0/1 (0.0) | 15/39 (38.5) | .036/.093e |
| Infiltratived | 1/2 (50.0) | 0/3 (0.0) | 0/3 (0.0) | 18/29 (62.1) | .039/.075e |
| RET/PTC (total), n (%) | |||||
| Classic papillary | 6/52 (11.5) | 1/18 (5.6) | 2/23 (8.7) | 1/65 (1.5) | .141 |
| Follicular | 0/12 (0.0) | 1/9 (11.1) | 0/8 (0.0) | 3/88 (3.4) | NA |
Abbreviation: NA, not applicable.
P value for linear trend adjusted for age and sex. Results were obtained by fitting binomial logistic models via maximum likelihood. Comparisons are for mutation present vs absent.
Histologic types were either classic papillary or follicular. The microcarcinomas have been assigned to their respective type; for 7 microcarcinomas the histologic type could not be determined so some numbers do not exactly match those in Table 2.
Microcarcinomas (≤1.0 cm) within BRAF-positive classic papillary PTCs and within RAS-positive follicular variant PTCs were analyzed separately.
RAS-positive tumors within infiltrative type follicular variant PTCs were analyzed separately.
fMid P value for exact linear trend.
Trends in RAS mutations
RAS mutations occurred in 46 of 329 cases, including 33 NRAS, 11 HRAS, and 2 KRAS mutations (Table 2). The RAS mutation prevalence increased sharply in the most recent calendar period (P < .001) (Table 2 and Figure 2), due primarily to the increase in NRAS mutations. Overall, 43 of 46 PTCs (93.5%) with RAS mutations had a follicular growth pattern. Over time, the percentage of RAS mutations increased exclusively in the follicular variant (P < .001) (Table 3). Although based on small numbers, there was a suggestion that the proportion of microcarcinomas in the follicular variant RAS-positive PTCs decreased over time (P = .036/Pexact =0.093) (Table 3), whereas the proportion of infiltrative tumors increased (P = .039/Pexact=0.075) (Table 3).
Trends in RET/PTC rearrangement
RET/PTC rearrangements occurred in 16 of 310 tumors, including 12 tumors with RET/PTC1 and 4 tumors with RET/PTC3 rearrangements (Table 2). The prevalence of RET/PTC rearrangement decreased over time (P = .038) (Table 2 and Figure 2). Stratifying by histologic growth pattern (Table 3), 10 (62.5%) tumors with RET/PTC rearrangements had a classic papillary growth pattern, whereas 4 (25%) had the follicular growth pattern.
Discussion
The incidence of PTC, the most common type of thyroid cancer, has been increasing in the United States and in many other countries since the early 1970s (1–5). Consistent with US national trends (2, 3, 6), we found a continuously increasing age at thyroid cancer diagnosis and a greater prevalence of low-stage, smaller-sized, intrathyroidal PTCs. Specifically, we observed a significant increase in tumors ≤1.0 cm in size, which now represents the most common presentation of thyroid cancer in the United States (26). The reduction in tumor size correlates with an increase in the percentage of intrathyroidal tumors, which lack direct invasion outside of the thyroid gland and metastatic spread to lymph nodes. The latter trend may be partially attributed to the increased rate of lymph node dissection among patients without clinical node involvement.
This study included careful histopathologic evaluation of glass slides from >450 tumors from different time periods. The analysis revealed a sharp decrease in the proportion of classic papillary type and an increase in the follicular variant. This finding is consistent with a previous US report based on the SEER database, which found a significant, progressive increase in the incidence of the follicular variant of PTC over time (3, 27). However, our finding differs from the study of PTC diagnosed in several regions of Italy that found no change in the proportions of PTC variants over time (28). The reasons for the different patterns of trends in the two studies are unclear but may be related to the fact that the Italian study included cases diagnosed during a later period, 1996 to 2000 (28). Microscopic criteria for the noninvasive, encapsulated follicular variant of PTC became less stringent during the early1990s, so that some tumors previously diagnosed as benign follicular adenomas would be now classified as the follicular variant of PTC (14). Applying uniform criteria to all time periods, we found an increase in both infiltrative and encapsulated follicular variants over time. This finding suggests that, at least for infiltrative follicular variant of PTC, the increase cannot be totally explained by changes in histological criteria and that new etiologic factors may have influenced the rising incidence of tumors with the follicular growth pattern.
Our molecular analyses revealed three important trends in the mutational composition of PTCs over time: (1) the overall proportion of RAS point mutations increased significantly after 2000, and this was entirely due to increases in the follicular variant of PTC, (2) the proportion of BRAF mutations was largely stable over the entire time period, although it increased significantly within the classic papillary type of PTC, particularly after 1985, and (3) the proportion of RET/PTC rearrangements significantly decreased. These findings provide etiologic insights into the increasing incidence of thyroid cancer. In thyroid cancer, critical genes are known to be altered via two distinct mutational mechanisms: point mutation and chromosomal rearrangement. Whereas the former derives from a single nucleotide change within the DNA chain, the latter represents a large-scale genetic abnormality, with breakage and fusion of parts of the same or different chromosomes. These two mutational mechanisms are associated with different etiologic factors. Specifically, thyroid cancer–specific chromosomal rearrangements have a strong association with ionizing radiation exposure. As many as 80% of PTCs in persons exposed to radiation either accidentally (mostly radioiodine) or therapeutically (mostly external beam) carry RET/PTC (29–31). In contrast, point mutations of BRAF and RAS are less common in radiation-related tumors (32). For PTCs found in atomic bomb survivors in Japan, the RET/PTC prevalence increased monotonically with increasing radiation dose, whereas BRAF point mutations showed an inverse relation (33, 34). Childhood exposure to external ionizing radiation is a well-established risk factor for thyroid cancer (10). During the 1940s and 1950s, ionizing radiation was sometimes used for medical treatment of tinea capitis, enlarged tonsils, and an enlarged thymus gland. In our study, patients from the time period 1974 to 1985 were younger at diagnosis (median age, 37 years) than those in other time periods, and 19% had a history of childhood radiation exposure recorded in pathology reports compared with less than 2% in 2009. The decreasing frequency of RET/PTC over time suggests that the increasing incidence of thyroid cancer was not likely to be due to ionizing radiation exposure, at least in the form of environmental and therapeutic radiation known to be associated with RET/PTC rearrangement.
The increase in the frequency of RAS mutations within the follicular variant PTC suggests the potential for new non-radiation–associated etiologies for this tumor type. RAS mutation–driven carcinogenesis has been associated with exposure to environmental chemical carcinogens in experimental animals and in human tumors (35–40). Examples of the latter include RAS mutations in hepatocellular carcinomas in workers exposed to vinyl chloride (41), in lung adenocarcinomas associated with tobacco smoking (42), and in acute leukemias in patients with occupational exposure to chemical agents or in their children (43, 44). In our data, the increase in RAS mutations began after 2000, which suggests a more recent etiologic factor, distinct from those factors affecting the increase starting in the early 1970s, but coinciding in time with an acceleration in the rate of increases in PTCs in US women and men aged 45 years and older (1).
An important finding in this study was the overall stable prevalence of BRAF mutations and the increase in BRAF among tumors of the classic papillary type of PTC, particularly after 1985. A similar increasing trend in BRAF prevalence in classic PTCs during 1991 to 2005 was observed in another region of the United States (45) and during 1996 to 2010 in several regions of Italy (28), suggesting a universal trend, although in our study this trend started earlier. The significance of this finding is 2-fold. First, the continuously high percentage of BRAF point mutations overall, together with the increasing percentage of BRAF mutations within classic PTCs during the period of increasing incidence of thyroid cancer, supports a role for environmental factors, perhaps dietary or chemical influences. These factors may be distinct from those associated with the increase in RAS-positive follicular variant PTCs. Indeed, a recent study of BRAF mutations in PTCs in China showed a 2-fold increased risk of BRAF V600E mutations in regions with high iodine levels in drinking water compared with that in regions with normal iodine content in drinking water (46). Another recent study reported a significantly higher incidence of BRAF mutations in PTCs from the volcanic region of Sicily, where there are high concentrations of boron, iron, vanadium, manganese, and other chemical elements in drinking water, compared with that in neighboring regions with normal concentrations of these elements (47). It is important to note that the Hawaiian Islands, another volcanic region, has one of the highest incidence rates of thyroid cancer in the United States (48), although high fish and iodine intake may also be factors. Second, the stable occurrence of BRAF mutations coupled with the stable proportion of microcarcinomas within BRAF-positive classic variant PTCs suggests that the growing incidence of thyroid cancer is not derived solely from better detection of incidental, nonprogressing tumors because BRAF V600E mutations are known to occur in association with aggressive histopathologic features of PTCs, increased tumor recurrence, and tumor-related mortality (49, 50). The stable prevalence of BRAF mutations raises the possibility that the increase in cancer incidence probably involves clinically relevant tumors, which are detected and removed at early stages, preventing the progression to more aggressive disease.
This study has several limitations. First, 25% to 30% of tumors in each time period were ≤0.3 cm and therefore had insufficient material for mutation analysis. However, the demographic and clinical characteristics of these patients were generally similar to those of patients with larger tumors. Second, our case series was derived from one institution, and therefore our results may not be representative of the entire United States. However, demographic and tumor features (age at diagnosis, sex, and tumor size) of these patients with PTCs were generally consistent with SEER thyroid cancer cases, and some of the molecular findings were similar to those reported previously in other regions of the United States (45). This study was based on cases selected consecutively within noncontiguous time periods. Therefore, it is possible that some fluctuations could have been missed, although we believe that such a design was adequate to reveal major time trends. Only cases with an original diagnosis of PTC were selected for this study; consequently, the proportion of follicular variant PTCs, particularly of the encapsulated type that in the early calendar period could have been classified as follicular adenoma or carcinoma, may be underestimated and the trend overestimated. However, because the increase in follicular variant PTCs was apparent for both encapsulated and infiltrative type tumors (not affected by changes in diagnostic criteria over time) and increases in RAS-positive follicular PTCs were also evident in infiltrative type tumors, the observed time trends are likely to be real.
In conclusion, our results suggest that the increase in the incidence of PTC over the last 40 years was characterized by increased age at diagnosis and detection of smaller-sized, intrathyroidal PTCs, which nevertheless possesses the potential for progression evident from the common, stable occurrence of BRAF mutations. A rapid increase in tumors with the follicular growth pattern and in the prevalence of RAS mutations suggests new or more recent etiologic factors, probably of a chemical or dietary nature. In contrast, the trends for RET/PTC rearrangements suggest that the role of ionizing radiation, at least as related to environmental exposures and historical patterns of radiation treatment for benign conditions, may be diminishing.
Acknowledgments
We are grateful to Dr. Elaine Ron (1943–2010) for her vision and untiring work in launching this project. Her efforts and her memory were with us throughout and were integral in bringing it to fruition.
This work was supported by the Intramural Research Program of the National Cancer Institute (NCI) Division of Cancer Epidemiology and Genetics and NCI contract HSSN261200900017C/N02CP-90017 with subcontract 5–312-0212208 to the University of Pittsburgh.
Disclosure Summary: The authors have nothing to disclose.
Footnotes
- CI
- confidence interval
- OR
- odds ratio
- PTC
- papillary thyroid carcinoma
- SEER
- Surveillance, Epidemiology and End Results.
References
- 1. Chen AY, Jemal A, Ward EM. Increasing incidence of differentiated thyroid cancer in the United States, 1988–2005. Cancer. 2009;115:3801–3807 [DOI] [PubMed] [Google Scholar]
- 2. Davies L, Welch HG. Increasing incidence of thyroid cancer in the United States, 1973–2002. JAMA. 2006;295:2164–2167 [DOI] [PubMed] [Google Scholar]
- 3. Albores-Saavedra J, Henson DE, Glazer E, Schwartz AM. Changing patterns in the incidence and survival of thyroid cancer with follicular phenotype—papillary, follicular, and anaplastic: a morphological and epidemiological study. Endocr Pathol. 2007;18:1–7 [DOI] [PubMed] [Google Scholar]
- 4. Colonna M, Guizard AV, Schvartz C, et al. A time trend analysis of papillary and follicular cancers as a function of tumour size: a study of data from six cancer registries in France (1983–2000). Eur J Cancer. 2007;43:891–900 [DOI] [PubMed] [Google Scholar]
- 5. Burgess JR, Tucker P. Incidence trends for papillary thyroid carcinoma and their correlation with thyroid surgery and thyroid fine-needle aspirate cytology. Thyroid. 2006;16:47–53 [DOI] [PubMed] [Google Scholar]
- 6. Howlader N, Noone AM, Krapcho M, et al. SEER Cancer Statistics Review, 1975–2009 (Vintage 2009 Populations). National Cancer Institute, Bethesda, MD: http://seer.cancer.gov/csr/1975_2009_pops09/. Published April 2012. Updated August 20, 2012 Accessed June 11, 2013 [Google Scholar]
- 7. Cramer JD, Fu P, Harth KC, Margevicius S, Wilhelm SM. Analysis of the rising incidence of thyroid cancer using the Surveillance, Epidemiology and End Results national cancer data registry. Surgery. 2010;148:1147–1152; discussion 1152–1143 [DOI] [PubMed] [Google Scholar]
- 8. Siegel R, Naishadham D, Jemal A. Cancer statistics, 2013. CA Cancer J Clin. 2013;63:11–30 [DOI] [PubMed] [Google Scholar]
- 9. Enewold L, Zhu K, Ron E, et al. Rising thyroid cancer incidence in the United States by demographic and tumor characteristics, 1980–2005. Cancer Epidemiol Biomarkers Prev. 2009;18:784–791 [DOI] [PMC free article] [PubMed] [Google Scholar]
- 10. Ron E, Lubin JH, Shore RE, et al. Thyroid cancer after exposure to external radiation: a pooled analysis of seven studies. Radiat Res. 1995;141:259–277 [PubMed] [Google Scholar]
- 11. Cardis E, Kesminiene A, Ivanov V, et al. Risk of thyroid cancer after exposure to 131I in childhood. J Natl Cancer Inst. 2005;97:724–732 [DOI] [PubMed] [Google Scholar]
- 12. Mettler FA, Jr, Bhargavan M, Faulkner K, et al. Radiologic and nuclear medicine studies in the United States and worldwide: frequency, radiation dose, and comparison with other radiation sources—1950–2007. Radiology. 2009;253:520–531 [DOI] [PubMed] [Google Scholar]
- 13. Nikiforov YE. Is ionizing radiation responsible for the increasing incidence of thyroid cancer? Cancer. 2010;116:1626–1628 [DOI] [PMC free article] [PubMed] [Google Scholar]
- 14. Widder S, Guggisberg K, Khalil M, Pasieka JL. A pathologic re-review of follicular thyroid neoplasms: the impact of changing the threshold for the diagnosis of the follicular variant of papillary thyroid carcinoma. Surgery. 2008;144:80–85 [DOI] [PubMed] [Google Scholar]
- 15. Nikiforov YE, Nikiforova MN. Molecular genetics and diagnosis of thyroid cancer. Nat Rev Endocrinol. 2011;7:569–580 [DOI] [PubMed] [Google Scholar]
- 16. Adeniran AJ, Zhu Z, Gandhi M, et al. Correlation between genetic alterations and microscopic features, clinical manifestations, and prognostic characteristics of thyroid papillary carcinomas. Am J Surg Pathol. 2006;30:216–222 [DOI] [PubMed] [Google Scholar]
- 17. Ciampi R, Knauf JA, Kerler R, et al. Oncogenic AKAP9-BRAF fusion is a novel mechanism of MAPK pathway activation in thyroid cancer. J Clin Invest. 2005;115:94–101 [DOI] [PMC free article] [PubMed] [Google Scholar]
- 18. Boas M, Feldt-Rasmussen U, Main KM. Thyroid effects of endocrine disrupting chemicals. Mol Cell Endocrinol. 2012;355:240–248 [DOI] [PubMed] [Google Scholar]
- 19. Tufano RP, Teixeira GV, Bishop J, Carson KA, Xing M. BRAF mutation in papillary thyroid cancer and its value in tailoring initial treatment: a systematic review and meta-analysis. Medicine (Baltimore). 2012;91:274–286 [DOI] [PubMed] [Google Scholar]
- 20. LiVolsi VA, Albores-Saavedra J, Asa SL, Baloch ZW, Sobrinho-Simões M, Wenig B. Papillary carcinoma. In: DeLellis RA, Lloyd RV, Heitz PU, Eng C, eds. World Health Organization Classification of Tumours Pathology and Genetics of Tumours of Endocrine Organs. Lyon, France: IARC Press; 2004:57–66 [Google Scholar]
- 21. Ghossein R. Encapsulated malignant follicular cell-derived thyroid tumors. Endocr Pathol. 2010;21:212–218 [DOI] [PubMed] [Google Scholar]
- 22. Edge SB, Byrd DR, Compton CC, Fritz AG, Greene FL, Trotti A. AJCC Cancer Staging Manual. 7th ed New York, NY: Springer; 2010 [Google Scholar]
- 23. Nikiforov YE, Steward DL, Robinson-Smith TM, et al. Molecular testing for mutations in improving the fine-needle aspiration diagnosis of thyroid nodules. J Clin Endocrinol Metab. 2009;94:2092–2098 [DOI] [PubMed] [Google Scholar]
- 24. Zhu Z, Ciampi R, Nikiforova MN, Gandhi M, Nikiforov YE. Prevalence of RET/PTC rearrangements in thyroid papillary carcinomas: effects of the detection methods and genetic heterogeneity. J Clin Endocrinol Metab. 2006;91:3603–3610 [DOI] [PubMed] [Google Scholar]
- 25. Cox DR, Hinkley DV. Theoretical Statistics. London, UK: Chapman and Hall; 1974 [Google Scholar]
- 26. Hughes DT, Haymart MR, Miller BS, Gauger PG, Doherty GM. The most commonly occurring papillary thyroid cancer in the United States is now a microcarcinoma in a patient older than 45 years. Thyroid. 2011;21:231–236 [DOI] [PubMed] [Google Scholar]
- 27. Lin HW, Bhattacharyya N. Clinical behavior of follicular variant of papillary thyroid carcinoma: presentation and survival. Laryngoscope. 2010;120(suppl 4):S163. [DOI] [PubMed] [Google Scholar]
- 28. Romei C, Fugazzola L, Puxeddu E, et al. Modifications in the papillary thyroid cancer gene profile over the last 15 years. J Clin Endocrinol Metab. 2012;97:E1758–E1765 [DOI] [PubMed] [Google Scholar]
- 29. Rabes HM, Demidchik EP, Sidorow JD, et al. Pattern of radiation-induced RET and NTRK1 rearrangements in 191 post-Chernobyl papillary thyroid carcinomas: biological, phenotypic, and clinical implications. Clin Cancer Res. 2000;6:1093–1103 [PubMed] [Google Scholar]
- 30. Nikiforov YE, Rowland JM, Bove KE, Monforte-Munoz H, Fagin JA. Distinct pattern of ret oncogene rearrangements in morphological variants of radiation-induced and sporadic thyroid papillary carcinomas in children. Cancer Res. 1997;57:1690–1694 [PubMed] [Google Scholar]
- 31. Bounacer A, Wicker R, Caillou B, et al. High prevalence of activating ret proto-oncogene rearrangements, in thyroid tumors from patients who had received external radiation. Oncogene. 1997;15:1263–1273 [DOI] [PubMed] [Google Scholar]
- 32. Nikiforova MN, Ciampi R, Salvatore G, et al. Low prevalence of BRAF mutations in radiation-induced thyroid tumors in contrast to sporadic papillary carcinomas. Cancer Lett. 2004;209:1–6 [DOI] [PubMed] [Google Scholar]
- 33. Hamatani K, Eguchi H, Ito R, et al. RET/PTC rearrangements preferentially occurred in papillary thyroid cancer among atomic bomb survivors exposed to high radiation dose. Cancer Res. 2008;68:7176–7182 [DOI] [PubMed] [Google Scholar]
- 34. Takahashi K, Eguchi H, Arihiro K, et al. The presence of BRAF point mutation in adult papillary thyroid carcinomas from atomic bomb survivors correlates with radiation dose. Mol Carcinog. 2007;46:242–248 [DOI] [PubMed] [Google Scholar]
- 35. Hong HL, Devereux TR, Melnick RL, et al. Both K-ras and H-ras protooncogene mutations are associated with Harderian gland tumorigenesis in B6C3F1 mice exposed to isoprene for 26 weeks. Carcinogenesis. 1997;18:783–789 [DOI] [PubMed] [Google Scholar]
- 36. Kelley MJ, Littman SJ. Etiology of the mutational spectrum of ras genes in human carcinomas. J Natl Cancer Inst. 2002;94:1516–1517 [DOI] [PubMed] [Google Scholar]
- 37. Pazzaglia S, Mancuso M, Primerano B, et al. Analysis of c-Ha-ras gene mutations in skin tumors induced in carcinogenesis-susceptible and carcinogenesis-resistant mice by different two-stage protocols or tumor promoter alone. Mol Carcinog. 2001;30:111–118 [DOI] [PubMed] [Google Scholar]
- 38. Sills RC, Boorman GA, Neal JE, Hong HL, Devereux TR. Mutations in ras genes in experimental tumours of rodents. IARC Sci Publ. 1999;146:55–86 [PubMed] [Google Scholar]
- 39. Weihrauch M, Benicke M, Lehnert G, Wittekind C, Wrbitzky R, Tannapfel A. Frequent k-ras-2 mutations and p16(INK4A)methylation in hepatocellular carcinomas in workers exposed to vinyl chloride. Br J Cancer. 2001;84:982–989 [DOI] [PMC free article] [PubMed] [Google Scholar]
- 40. Brandt-Rauf PW, Li Y, Long C, Monaco R, Kovvali G, Marion MJ. Plastics and carcinogenesis: the example of vinyl chloride. J Carcinog. 2012;11:5. [DOI] [PMC free article] [PubMed] [Google Scholar]
- 41. Weihrauch M, Benick M, Lehner G, et al. High prevalence of K-ras-2 mutations in hepatocellular carcinomas in workers exposed to vinyl chloride. Int Arch Occup Environ Health. 2001;74:405–410 [DOI] [PubMed] [Google Scholar]
- 42. Porta M, Crous-Bou M, Wark PA, et al. Cigarette smoking and K-ras mutations in pancreas, lung and colorectal adenocarcinomas: etiopathogenic similarities, differences and paradoxes. Mutat Res. 2009;682:83–93 [DOI] [PubMed] [Google Scholar]
- 43. Barletta E, Gorini G, Vineis P, et al. Ras gene mutations in patients with acute myeloid leukaemia and exposure to chemical agents. Carcinogenesis. 2004;25:749–755 [DOI] [PubMed] [Google Scholar]
- 44. Shu XO, Perentesis JP, Wen W, Buckley JD, Boyle E, Ross JA, Robison LL. Parental exposure to medications and hydrocarbons and ras mutations in children with acute lymphoblastic leukemia: a report from the Children's Oncology Group. Cancer Epidemiol Biomarkers Prev. 2004;13:1230–1235 [PubMed] [Google Scholar]
- 45. Mathur A, Moses W, Rahbari R, et al. Higher rate of BRAF mutation in papillary thyroid cancer over time: a single-institution study. Cancer. 2011;117:4390–4395 [DOI] [PMC free article] [PubMed] [Google Scholar]
- 46. Guan H, Ji M, Bao R, et al. Association of high iodine intake with the T1799A BRAF mutation in papillary thyroid cancer. J Clin Endocrinol Metab. 2009;94:1612–1617 [DOI] [PubMed] [Google Scholar]
- 47. Pellegriti G, De Vathaire F, Scollo C, et al. Papillary thyroid cancer incidence in the volcanic area of Sicily. J Natl Cancer Inst. 2009;101:1575–1583 [DOI] [PubMed] [Google Scholar]
- 48. Parkin DM, Bray F, Ferlay J, Pisani P. Global cancer statistics, 2002. CA Cancer J Clin. 2005;55:74–108 [DOI] [PubMed] [Google Scholar]
- 49. Xing M, Alzahrani AS, Carson KA, et al. Association between BRAF V600E mutation and mortality in patients with papillary thyroid cancer. JAMA. 2013;309:1493–1501 [DOI] [PMC free article] [PubMed] [Google Scholar]
- 50. Xing M. BRAF mutation in papillary thyroid cancer: pathogenic role, molecular bases, and clinical implications. Endocr Rev. 2007;28:742–762 [DOI] [PubMed] [Google Scholar]