

Abstract
Cell-type diversity in the brain enables the assembly of complex neural circuits, whose organization and patterns of activity give rise to brain function. However, the identification of distinct neuronal populations within a given brain region is often complicated by a lack of objective criteria to distinguish one neuronal population from another. In the external segment of the globus pallidus (GPe), neuronal populations have been defined using molecular, anatomical, and electrophysiological criteria, but these classification schemes are often not generalizable across preparations and lack consistency even within the same preparation. Here, we present a novel use of existing transgenic mouse lines, Lim homeobox 6 (Lhx6)–Cre and parvalbumin (PV)–Cre, to define genetically distinct cell populations in the GPe that differ molecularly, anatomically, and electrophysiologically. Lhx6–GPe neurons, which do not express PV, are concentrated in the medial portion of the GPe. They have lower spontaneous firing rates, narrower dynamic ranges, and make stronger projections to the striatum and substantia nigra pars compacta compared with PV–GPe neurons. In contrast, PV–GPe neurons are more concentrated in the lateral portions of the GPe. They have narrower action potentials, deeper afterhyperpolarizations, and make stronger projections to the subthalamic nucleus and parafascicular nucleus of the thalamus. These electrophysiological and anatomical differences suggest that Lhx6–GPe and PV–GPe neurons participate in different circuits with the potential to contribute to different aspects of motor function and dysfunction in disease.
Keywords: basal ganglia, connectivity, globus pallidus, intrinsic excitability, transgenic mice
Introduction
The basal ganglia are a set of subcortical nuclei that play an important role in facilitating voluntary movement in health and disease (Albin et al., 1989; DeLong, 1990). The basal ganglia are thought to control movement through the coordinated activity of the direct and indirect pathways that have opposite effects on movement (Alexander and Crutcher, 1990; Smith et al., 1998b; Kravitz et al., 2010). The external segment of the globus pallidus (GPe) is a central nucleus in the motor-suppressing indirect pathway, which receives inputs from the striatum, subthalamic nucleus (STN), and parafascicular nucleus of the thalamus (pf; Robledo and Féger, 1990; Kincaid et al., 1991; Kita and Kitai, 1991; Parent and Hazrati, 1995). In vivo recordings have shown that GPe neurons fire independently (Nini et al., 1995), with firing rates that are characterized by complex temporal patterns and low correlation during movement (DeLong et al., 1985; Wichmann et al., 1994; Jaeger et al., 1995; Bergman et al., 1998).
Overall, the specific contributions of the GPe to basal ganglia function are not well defined, but the GPe has been strongly implicated in the onset and maintenance of motor dysfunction in movement disorders, such as dystonia and Parkinson's disease (Lozano et al., 2000; Di Cristo et al., 2004; Pradeepkumar et al., 2004; Kita, 2007; Obeso et al., 2008). Most notably, the activity of GPe neurons in patients suffering from Parkinson's disease is reduced, and the synchronization of GPe neurons is thought to contribute to pathological oscillations (Nini et al., 1995; Plenz and Kital, 1999; Raz et al., 2000; Bevan et al., 2002; Levy et al., 2002; Terman et al., 2002; Isaksson et al., 2004). Consistent with the hypothesis that oscillations contribute to motor dysfunction, deep brain stimulation of the GPe has been shown to relieve parkinsonian motor symptoms in humans (Vitek et al., 1998, 2004, 2012; Yelnik et al., 2000).
Progress in linking activity of GPe neurons to behavior has been complicated by the fact that the GPe contains a heterogeneous population of neurons that likely contribute differentially to motor function in healthy and diseased individuals. Anatomical studies have shown that GPe neurons project to a number of brain areas, but most of these projections are given little consideration in models of basal ganglia function (Parent et al., 1983; Smith and Bolam, 1989; Kita and Kitai, 1994; Smith et al., 1998a; Sato et al., 2000). For example, the identification of pallidostriatal neurons using tracing techniques in rodents and primates suggests a complexity of neural circuit organization in the GPe that has long been underappreciated (Kita and Kitai, 1994; Bevan et al., 1998; Kita et al., 1999; Sato et al., 2000; Mallet et al., 2012). Attempts have been made to classify cell types in the GPe, but these criteria are often difficult to generalize across preparations (Nambu and Llinaś, 1994; Cooper and Stanford, 2000; Kita, 2007; Deister et al., 2013), rely on postmortem cell-type identification (Hoover and Marshall, 1999; Sato et al., 2000; Hoover and Marshall, 2002), or rely on activity in disease states (Chattopadhyaya et al., 2004; Opalinska et al., 2004; Mallet et al., 2012).
Here, we use transgenic mouse lines to define two genetically distinct, non-overlapping populations of GPe neurons in healthy rodents. Viral expression of enhanced yellow fluorescent protein (EYFP) revealed that Lim homeobox 6 (Lhx6)–GPe and parvalbumin (PV)–GPe neurons differed in their axonal projection patterns as well as electrophysiological properties measured in slice recordings. These results provide a new set of tools to target molecularly, anatomically, and electrophysiologically distinct cell types in the GPe that will enable studies of the organization and function of GPe circuits in health and disease.
Materials and Methods
Mouse lines and tissue processing.
All procedures were performed in accordance with the guidelines from the National Institutes of Health and with approval of the Carnegie Mellon University Institutional Animal Care and Use Committee. Male and female heterozygous 4- to 8-week-old mice on a C57BL/6J background were used for experiments. Lhx6–GPe neurons were targeted using Lhx6–GFP (GENSAT, www.gensat.org) or Lhx6–Cre (Fogarty et al., 2007) mouse lines. PV–GPe neurons were targeted using a Pvalb–2A–Cre mouse line (Madisen et al., 2010).
For immunohistochemistry, mice were perfused transcardially with PBS, followed by 4% paraformaldehyde in PBS. Brains were removed and drop-fixed with the same fixative at 4°C for 24 h. After rising with PBS, brains were transferred to 30% sucrose in PBS and stored at 4°C for at least 24 h before sectioning. Tissue was sectioned in 30 μm sections, blocked with 10% normal donkey serum, and permeabilized with 0.5% Triton X-100 for 1 h. Primary antibody incubations were performed at 4°C for 24 h, using rabbit anti-GFP (1:500; Millipore), chicken anti-GFP (1:1000; Aves), mouse anti-NeuN (1:1000; Millipore), rabbit anti-TH (1:1000), or at 4°C for 48 h when using rabbit anti-PV (1:1000; Swant). Primary antibodies were detected with Alexa Fluor 488-conjugated goat anti-chicken (1:500; Vector Laboratories), Alexa Fluor 488-conjugated goat anti-rabbit (1:500; Vector Laboratories), Alexa Fluor 568-conjugated donkey anti-rabbit (1:500; Vector Laboratories), Alexa Fluor 568-conjugated donkey anti-mouse (1:500; Vector Laboratories), Alexa Fluor 647-conjugated donkey anti-rabbit (1:500; Vector Laboratories), or Alexa Fluor 647-conjugated donkey anti-mouse (1:500; Vector Laboratories), incubated for 2 h at room temperature.
For processing of Fluoro-Gold (FG) labeling, primary antibody incubations were performed at 4°C for 48 h using rabbit anti-FG (1:3000; Fluorochrome). Primary antibody was detected using Alexa Fluor 647-conjugated donkey anti-rabbit (1:500; Vector Laboratories) for 3 h at room temperature.
Animal surgery and viral injections.
Injections of adenoassociated virus 2 (AAV2)–double-floxed inverted open reading frame (DIO)–EYFP or AAV5–DIO–channelrhodopsin 2 (ChR2)–EYFP (used for electrophysiology), produced at the University of North Carolina (Vector Core Facility), were made in 4- to 5-week-old PV–Cre or Lhx6–Cre transgenic mice. Anesthesia was induced using 50 mg/ml ketamine and 15 mg/ml xylazine and maintained throughout surgery using 2% isoflurane. Mice were placed in a stereotaxic frame (David Kopf Instruments), the scalp was opened, and bilateral holes were drilled in the skull (0.27–0.30 mm anterior, 2.1–2.2 mm lateral from bregma). One hundred fifty to 200 nl of virus were injected with a Nanoject (Drummond Scientific) through a pulled glass pipette (∼30 μm tip diameter) whose tip was positioned 3.70 mm below the top of the skull. To prevent backflow of virus, the pipette was left in the brain for 5 min after completion of the injection. Animals were housed for at least 2 weeks after injection to allow time for viral expression.
Injections of FG were done using the same surgical procedures, but bilateral holes were drilled over the striatum (1.0 mm anterior, 2.3 mm lateral from bregma), and 1 μl of FG (0.5% in saline; Fluorochrome) was injected 3.7 mm below the surface of the skull using a syringe pump (0.2 μl/min; Genietouch). Mice were perfused 2 weeks after injections, and tissue was prepared as described above.
Fluorescence quantification.
Quantification of axonal projection patterns of Lhx6–GPe and PV–GPe neurons was performed in sagittal sections from hemispheres in which GPe injections met the following criteria: viral expression within the GPe was strongest within the central plane of analysis (1.56 mm lateral; Paxinos, 2004, his Fig. 114), and labeled cell bodies were observed throughout the full rostrocaudal, dorsoventral, and mediolateral extent of the structure. Analyses were performed in seven sagittal planes (lateral from bregma; in mm): 3.12, 2.76, 2.04, 1.56, 1.20, 0.84, and 0.48 (Paxinos, 2004). Hemispheres in which there was significant spillover of virus and EYFP expression in neighboring structures, such as the reticular thalamic nucleus (RT), ventral palladium, and striatum, were excluded from analysis. To aid in visualization of axonal projections from the GPe, EYFP signal was enhanced with an immunostain against GFP. Epifluorescent images were taken at 25× magnification in seven sagittal slices of each brain, and the same sectional planes across animals were used for analyses. To control for differences in viral expression or antibody retrieval, data from each animal were normalized to the fluorescence intensity in the GPe during analysis. Images were analyzed offline using the pixel intensity-measuring tool in NIH ImageJ. Data were quantified by averaging the pixel intensity within and across each brain structure. On average, three 100 × 100 pixels (75 × 75 μm; area is 5625 μm2) squares were quantified in each of the images. The mean of all pixel intensities designated as within a single structure was found and normalized to GPe expression of each animal. For example, dorsolateral striatum was identified in three planes of section (lateral from bregma; in mm): 3.12, 2.76, and 2.04. Three measures of pixel intensity were taken by randomly placing the 75 × 75 μm square throughout the image. The mean of each image was taken and then averaged across the three planes of section to identify the average pixel intensity of dorsolateral striatum. Finally, the average was normalized to the brightest GPe expression found within the animal, which was located in the central plane of analysis (1.56 mm lateral; Paxinos, 2004, his Fig. 114). Striatum, RT, internal segment of the globus pallidus (GPi), basolateral amygdala (BLA), parasubthalamic nucleus (PSTh), and pf were analyzed using the method described above.
Because of the irregular shape of the STN and the ease at which the STN borders could be identified at 25× magnification, the NIH ImageJ hand draw tool was used to measure average pixel intensity of the entire structure. Similar to other structures, the STN was identified in more than one plane of section, and the pixel intensity from each plane was averaged and then normalized to GPe expression.
In the case of the substantia nigra (SN), a tyrosine hydroxylase (TH) stain was used to define the borders between dopamine neurons of the pars compacta (SNc) and the nondopaminergic (GABAergic) neurons of the pars reticulata (SNr). GFP and TH expression was sequentially imaged in the GPe and SN using the epifluorescent microscope at 10× magnification. For NIH ImageJ analysis, zones were clearly defined using TH expression as a marker for the SNc and using the hand draw tool described above. These zones were then overlaid on the images showing GFP expression, and the average pixel intensity was found. The average across sections was taken and normalized to GPe expression. Differences in normalized fluorescence intensities were compared using a t test.
Results of FG retrograde labeling were analyzed in two to four sections each from three PV mice (PV–Cre × Ai3 or PV–Cre × Ai9) and three Lhx6 mice (Lhx6–GFP). GPe sections were magnified to 63× on an epifluorescent microscope. The number of FG-positive (FG+) neurons in an 225 × 175 μm square of tissue were counted and scored as Lhx6+, PV+, or neither. Populations of FG+ neurons that were either Lhx6 or PV were compared using a Fisher's exact test.
Three-dimensional Sholl analysis.
To quantify the selective innervation of striatal fast-spiking striatal interneurons (FSIs) by Lhx6–GPe and PV–GPe neurons, a three-dimensional Sholl analysis was performed as described previously (Chattopadhyaya et al., 2004). Briefly, tissue from mice expressing EYFP in Lhx6–GPe or PV–GPe neurons was immunostained for PV and NeuN to identify FSIs and medium spiny neurons (MSNs) in the striatum, respectively. Although NeuN does not selectively stain MSNs, MSNs make up 95% of neurons in the striatum, so for the purposes of this analysis, we assumed that NeuN+/PV-negative (PV−) neurons were most likely MSNs. Confocal z-stack images of presumed striatal FSIs and MSNs were taken at 63× magnification, and channels were sequentially imaged to avoid bleedthrough. Stacked images were merged using NIH ImageJ, and concentric circles of increasing diameter (2 μm) were drawn from the center of each identified neuron. Innervation was quantified as the number of axonal varicosities counted in each circle.
Electrophysiological recordings.
Parasagittal sections (300 μm thickness) containing the GPe or pf were prepared from brains of 5- to 8-week-old mice. Lhx6–GPe neurons were targeted in slices from Lhx6–GFP mice, Lhx6–Cre mice injected in the GPe with AAV2–DIO–EYFP, or Lhx6–Cre mice crossed to the reporter strains Ai9 (red) or Ai3 (green) (Jackson Laboratories). PV–GPe neurons were targeted in slices from PV–Cre mice injected in the GPe with AAV2–DIO–EYFP or PV–Cre crossed to Ai9 or Ai3 reporter strains.
Slices were prepared on a Leica VT1200 vibratome in an ice-cold HEPES cutting solution (in mm): 92 NaCl, 2.5 KCl, 1.2 NaH2PO4, 30 NaHCO3, 20 HEPES, 25 glucose, 5 sodium ascorbate, 2 thiourea, 3 sodium pyruvate, 10 MgCl2, and 0.5 CaCl2. Slices were allowed to recover for 15 min at 33°C in a chamber filled with N-methyl-d-glucamine (NMDG)–HEPES recovery solution (in mm): 93 NMDG, 2.5 KCl, 1.2 NaH2PO4, 30 NaHCO3, 20 HEPES, 25 glucose, 10 MgSO4, 0.5 CaCl2, 5 sodium ascorbate, 2 thiourea, and 3 sodium pyruvate. After 15 min, slices were held at room temperature for at least 1 h before recording in a holding solution that was similar to the HEPES cutting solution but with 1 mm MgCl2 and 2 mm CaCl2. Recordings were made at 33°C in carbogenated ACSF (in mm): 125 NaCl, 26 NaHCO3, 1.25 NaH2PO4, 2.5 KCl, 12.5 glucose, 1 MgCl2, and 2 CaCl2. For recordings of intrinsic excitability, 50 μm picrotoxin and 5 μm DNQX were included in the bath to block fast inhibitory and excitatory transmission, respectively.
Data were collected with a MultiClamp 700B amplifier (Molecular Devices) and ITC-18 analog-to-digital board (HEKA) using Igor Pro software (Wavemetrics) and custom acquisition routines (Recording Artist; Richard C. Gerkin, Phoenix, AZ). Current-clamp recordings were filtered at 10 kHz and digitized at 40 kHz; voltage-clamp recordings were filtered at 2 kHz and digitized at 10 kHz. Electrodes were made from borosilicate glass (pipette resistance, 2–4 m). The internal solution for current-clamp recordings consisted of the following (in mm): 130 KeMSO3, 10 NaCl, 2 MgCl2, 0.16 CaCl2, 0.5 EGTA, 10 HEPES, 2 Mg-ATP, and 0.3 Na-GTP. The internal solution for voltage-clamp recordings consisted of the following (in mm): 120 CsMeSO3, 15 CsCl, 8 NaCl, 0.5 EGTA, 10 HEPES, 2 Mg-ATP, 0.3 Na-GTP, and 5 QX-314.
Differences in electrophysiological parameters were compared using a Wilcoxon's nonparametric test. Action potential (AP) half-width was calculated as the width of the AP, measured at a point halfway between threshold and AP peak. AP threshold was defined as the voltage at which the acceleration in voltage exceeded 3 × 10⁵ V/s. Maximum firing rate was measured as the average maximum firing rate over a 1 s step that could be sustained without entering depolarization block. Input resistance was calculated in voltage clamp as the deviation from the holding current caused by a 5 mV hyperpolarizing step. The change in current was calculated as the difference between baseline holding current and the average current during the last 10 ms of the 40 ms hyperpolarizing voltage step. Whole-cell capacitance was calculated by integrating the area under the transient after a 5 mV hyperpolarizing voltage step from the holding potential, −80 mV. The holding current was subtracted before integrating.
Results
Distinct neuronal subpopulations identified in Lhx6 and PV transgenic mouse lines
Transgenic mouse lines were used to identify two distinct subpopulations of neurons in the GPe. In the first transgenic line, Pvalb–2a–Cre (PV–Cre; Madisen et al., 2010), gene expression was driven under the promoter for PV, a calcium binding protein found in GABAergic neurons in the CNS. In the second transgenic line, Lhx6–Cre (Fogarty et al., 2007) or Lhx6–GFP (GENSAT), gene expression was driven under the promotor for Lhx6, a homeobox protein found in a subset of GABAergic neurons in the brain (Marin et al., 2000; Cobos et al., 2006). An immunostain against PV in tissue from an Lhx6–GFP mouse revealed non-overlapping populations of neurons in the GPe (Fig. 1A). Lhx6–GPe and PV–GPe neurons each accounted for approximately one-third of NeuN+ neurons in the GPe. Lhx6–GPe neurons made up 34% (1030 of 3517) of NeuN+ GPe neurons, whereas PV–GPe neurons made up 29% (1149 of 3517), with only 2% (54 of 3517) of NeuN+ GPe neurons expressing both (Fig. 1B). Neurons were scored as positive for Lhx6 or PV if pixel intensity was >10× background.
Figure 1.
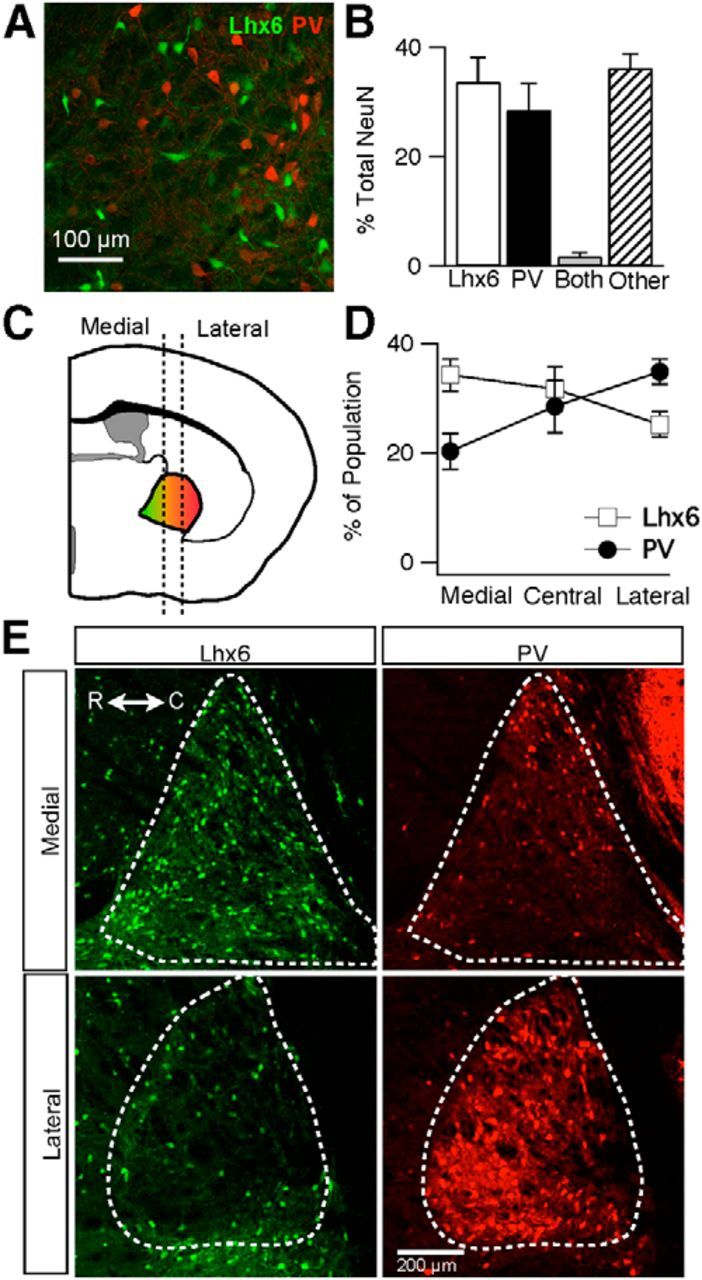
Identification and distribution of Lhx6–GPe and PV–GPe neurons in transgenic mice. A, Epifluorescent image from the GPe of an Lhx6–GFP mouse immunostained for PV showing two distinct populations of Lhx6+/PV− (green) and Lhx6−/PV+ (red) neurons. B, Graph showing the percentage of neurons that are Lhx6+/PV−, Lhx6−/PV+, both, or other throughout the GPe. Error bars are SEM. C, Schematic depiction of cell-type gradient found along the mediolateral axis. Dotted lines divide the GPe into the three zones used for analysis of the mediolateral axis. The Lhx6 population (green) is found primarily in the medial portion, whereas PV population (red) is found more laterally. D, Graph of the percentage of each cell population located within the three divisions along the mediolateral axis. Error bars are SEM. E, Epifluorescent images of medial and lateral sections of the GPe showing Lhx6–GFP (green) or PV immunofluorescence (red). R, Rostral; C, caudal. Scale bar, 200 μm.
Because the fraction of PV–GPe neurons observed with immunostaining was lower than what has been reported in other species, we used a second genetic approach to quantify the fraction of PV–GPe neurons. PV–Cre mice were crossed to fluorescent reporter mice (Ai3), and fixed sections from these animals were immunostained with NeuN and PV. Consistent with our immunohistochemistry data, genetically identified PV–GPe neurons were less than half of all GPe neurons (41%, 235 of 571), and 78% (1226 of 1544) of genetically defined PV–GPe neurons were immunopositive for PV.
To quantify the spatial distribution of Lhx6 and PV neurons within the GPe, cells were counted along mediolateral, dorsoventral, and rostrocaudal axes. No gradients were observed along the rostrocaudal and dorsoventral axes, but opposing gradients were observed along the mediolateral axis (Fig. 1C–E). Lhx6–GPe neurons were most concentrated in the medial portions of the GPe and decreased in concentration from medial to lateral, whereas PV–GPe neurons were most concentrated in the lateral and less concentrated in the more medial portions of the GPe.
Lhx6–GPe and PV–GPe neurons express different baseline firing rates
To determine whether Lhx6–GPe and PV–GPe neurons correspond to electrophysiologically distinct subpopulations, neurons of each cell type were targeted for recording in acute slices from 5- to 8-week-old Lhx6 or PV transgenic mice. To determine the rates of intrinsic pacemaking in each cell type, 50 μm picrotoxin and 5 μm DNQX were bath applied to block fast inhibitory and excitatory transmission, respectively. In the cell-attached configuration, both cell types fired tonically with low interspike variability [coefficient of variation (CV)Lhx6 = 0.31 ± 0.39, n = 25 vs CVPV = 0. 22 ± 0.25, n = 20; p = 0.1; Fig. 2A]. On average, PV–GPe neurons exhibited faster extracellular firing rates than Lhx6–GPe neurons (Lhx6, 34.2 ± 33.2 Hz, range of 1.3–142 Hz vs PV, 64.4 ± 34.3 Hz, range of 9.2–131 Hz; p = 0.001; Fig. 2B). To ensure that extracellular firing rates were not influenced by the voltage-clamp recording configuration or the gigaohm seal, we recorded extracellular firing rates in a second population of neurons using loose patch in cell-attached recording mode. Once again, PV–GPe neurons were found to have significantly higher extracellular firing rates than Lhx6–GPe neurons (Lhx6, 28.9 ± 17.7 Hz, range of 3.9–55.2 Hz, n = 20 vs PV, 66.1 ± 39.0 Hz, range of 14.8–140 Hz, n = 17; p < 0.0001). In the whole cell-recording configuration, spontaneous firing persisted in 20 of 27 PV–GPe neurons but in only 18 of 38 Lhx6–GPe neurons (Fig. 2C). Spontaneous firing rates were measured within 5 min of break-in because spontaneous firing rates tended to rundown over the duration of a recording. Spontaneous firing rates recorded in whole-cell configuration were also significantly faster in PV–GPe neurons compared with Lhx6–GPe neurons (Lhx6, 7.8 ± 14.2 Hz, n = 38 vs PV, 28.4 ± 24.9 Hz, n = 27; p = 0.0003; Fig. 2D).
Figure 2.

Differences in baseline firing rates of Lhx6–GPe and PV–GPe neurons. A, Representative traces of cell-attached recordings from Lhx6 (left) and PV (right) neurons, showing tonic firing with low interspike variability. B, Extracellular firing rates (FR) recorded for the population of PV–GPe neurons were significantly faster than those for Lhx6–GPe neurons. *p = 0.001. C, Representative traces of spontaneous firing in whole-cell recording configuration for Lhx6 (left) and PV (right) neurons. D, Spontaneous firing rates recorded for the population of PV–GPe neurons were significantly faster than those for Lhx6–GPe neurons. *p = 0.0003. E, Responses of representative Lhx6 (left) and PV (right) neurons to 3 s hyperpolarizing steps in current clamp. F, Amplitude of sag current plotted as a function of Vm reached immediately after the hyperpolarizing step for neurons in E. G, H, Maximum amplitude of the sag current (G) and its linear relationship to Vm (H), recorded for the population of Lhx6–GPe and PV–GPe neurons.
Because autonomous pacemaking in GPe neurons relies in part on hyperpolarization-activated, cyclic nucleotide-gated cation (HCN) channels (Chan et al., 2004), we hypothesized that differences in intrinsic firing rates between Lhx6–GPe and PV–GPe neurons might arise from differences in hyperpolarization-activated currents (Ih). To measure Ih, Lhx6–GPe and PV–GPe neurons were given 3 s hyperpolarizing current injections of increasing magnitude (Fig. 2E). In the current-clamp recording configuration, hyperpolarization resulted in an Ih-mediated rectification of the membrane potential, often referred to as a membrane potential “sag,” which increased monotonically as a function of membrane potential (Fig. 2F). Surprisingly, we observed no difference in the maximum sag recorded in Lhx6–GPe and PV–GPe neurons (Lhx6, 16.1 ± 7.0 mV, n = 35 vs PV, 13.8 ± 5.5 mV, n = 22; p = 0.22; Fig. 2G) and no difference in the slope of the monotonic relationship between sag and membrane potential (Lhx6, −0.264 ± 0.14 vs PV, −0.259 ± 0.13; p = 0.77; Fig. 2H). These results suggest that differences in Ih expression are unlikely to account for differences in intrinsic firing rates of Lhx6–GPe and PV–GPe neurons but do not rule out this possibility entirely.
Lhx6–GPe and PV–GPe neurons have different passive and active membrane properties
Variability in a number of passive and active membrane properties has been reported across GPe neurons, including resting membrane potential, firing rate adaptation, and AP shape (Nambu and Llinaś, 1994; Cooper and Stanford, 2000). To determine whether passive membrane properties vary systematically between Lhx6–GPe and PV–GPe neurons, neurons were held in voltage clamp (−80 mV) and given brief hyperpolarizing steps (−5 mV, 100 ms). Figure 3A shows the response of a representative Lhx6–GPe neuron and a representative PV–GPe neuron. Input resistance, calculated from the current flowing during the hyperpolarizing step, was significantly greater in Lhx6–GPe relative to PV–GPe neurons (3000.6 ± 168 MΩ, n = 38 vs 170 ± 88 MΩ, n = 28; p = 0.0007; Fig. 3B). Whole-cell capacitance, calculated as the integral under the transient (Fig. 3A, inset), was significantly greater in PV–GPe relative to Lhx6–GPe neurons (241 ± 113 pF, n = 28 vs 164 ± 65 pF, n = 38; p = 0.002; Fig. 3C). Because capacitance is proportional to the surface area of a neuron, these results suggest that PV–GPe neurons are larger or have more extensive dendritic arborizations than Lhx6–GPe neurons.
Figure 3.
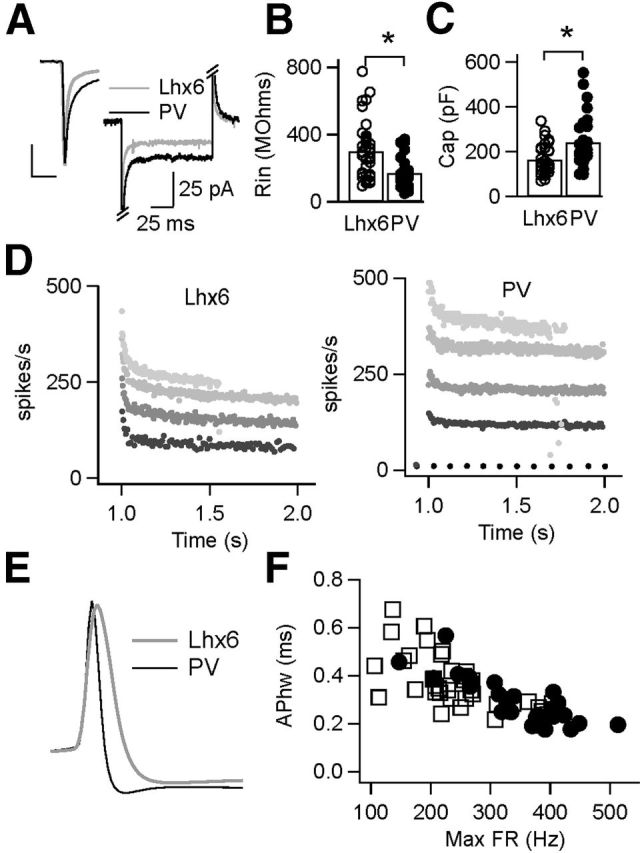
Differences in passive and active membrane properties of the Lhx6–GPe and PV–GPe neurons in slice recordings. A, Voltage-clamp recordings (Vhold = −80 mV) showing the response of representative Lhx6–GPe and PV–GPe neurons after a brief hyperpolarizing step (−5 mV, 100 ms). Inset shows the difference in membrane time constant (τ). Calibration: 100 pA, 2 ms. B, C, Population data showing significant differences in input resistance (Rin; B; *p = 0.0007) and whole-cell capacitance (Cap; C; *p = 0.002) between Lhx6–GPe and PV–GPe neurons. D, Instantaneous firing rates from representative Lhx6 (left) and PV (right) neurons in response to 1 s depolarizing current injections of increasing amplitude until neurons entered depolarization block. For Lhx6–GPe neurons, firing rates are shown in response to injections of 0 (no spikes), 200, 400, 800, and 1400 pA. For PV–GPe neurons, firing rates are shown in response to injections of 0, 400, 800, 1200, and 2700 pA. E, Average spike waveforms of representative Lhx6–GPe and PV–GPe neurons firing at 5–10 Hz. F, Scatter plot of AP width versus maximum firing rate (FR) for the population of Lhx6–GPe and PV–GPe neurons. These parameters varied continuously across the population but were significantly different between Lhx6–GPe and PV–GPe neurons.
To compare active membrane properties of Lhx6–GPe and PV–GPe neurons, the recording configuration was switched to current clamp, and neurons were driven to fire with 1 s depolarizing current steps. The amplitude of injected current was increased incrementally until a neuron reached its maximum firing rate, defined as the average firing rate sustained over the 1 s step without entering depolarization block (Fig. 3D). The maximum firing rate of PV–GPe neurons was significantly greater than that of Lhx6–GPe neurons (347 ± 80 Hz, n = 38 vs 248 ± 80 Hz, n = 27; p < 0.0001). Maximum firing rate was well correlated with AP width (Fig. 3F), and PV–GPe neurons had narrower APs than Lhx6–GPe neurons (0.28 ± 0.09 ms, n = 27 vs 0.37 ± 0.11 ms, n = 38; p = 0.003; Fig. 3E). Although AP widths and maximum firing rates varied continuously across the population of GPe neurons, Lhx6–GPe neurons clustered more at one end of the distribution, whereas PV–GPe neurons clustered more at the other end of the distribution (Fig. 3F). Using maximum firing rate as the sole criteria enabled Lhx6–GPe and PV–GPe neurons to be distinguished with ∼75% accuracy (78% of PV–GPe neurons had maximum firing rates >300 Hz, and 72% of Lhx6–GPe neurons had maximum firing rates <300 Hz). This degree of overlap emphasizes the importance of using genetic markers to segregate cell types in the GPe. A list of additional parameters quantifying the firing properties of Lhx6–GPe and PV–GPe neurons is provided in Table 1.
Table 1.
Intrinsic properties of GPe neurons
| Lhx6 | PV | |
|---|---|---|
| n | 40 | 30 |
| Input resistance (MΩ) | 301 ± 168 | 170 ± 16** |
| Capacitance (pF) | 164 ± 65 | 241 ± 113** |
| Vm rest (mV) | −71.7 ± 7.2 | −68.9 ± 5.5 |
| AP threshold (mV) | −55.4 ± 14.1 | −55.7 ± 4.4 |
| AP half-width (ms) | 0.37 ± 0.11 | 0.28 ± 0.09** |
| Afterhyperpolarization (mV) | 19.3 ± 4.0 | 21.9 ± 4.7* |
| Maximum firing rate (Hz) | 249 ± 80 | 347 ± 80** |
| Adaptation ratio (Hz) | 0.80 ± 0.11 | 0.81 ± 0.03 |
| Linear slope (Hz/nA) | 491 ± 164 | 494 ± 287 |
| Cell-attached firing rate (Hz) | 34 ± 33 | 62 ± 34** |
| Cell-attached CV | 0.31 ± 0.39 | 0.22 ± 0.25 |
| Whole-cell firing rate (Hz) | 7.8 ± 14.2 | 28 ± 25** |
| Sag (mV) | 16.1 ± 7.0 | 13.8 ± 5.5 |
Summary of intrinsic parameters recorded in Lhx6–GPe and PV–GPe neurons.
**p < 0.01;
*p < 0.05. Values for AP threshold and Vm rest were corrected for liquid junction potential (12 mV). Values are mean ± SD.
Projections of Lhx6–GPe and PV–GPe neurons to the STN
To study the axonal projection patterns of Lhx6–GPe and PV–GPe neurons, we used the Cre-dependent AAV2 to express EYFP selectively in one neuronal population or the other. Virus was stereotaxically injected into the GPe of PV–Cre and Lhx6–Cre transgenic mice, and tissue was processed and analyzed 2 weeks later. To control for variations in viral expression or immunolabeling across mice, fluorescence intensities in target brain regions were normalized to fluorescence intensity in the GPe of the same animal (see Materials and Methods). Fluorescence intensities measured in the GPe ranged from 146 to 249 a.u. but were not significantly different between Lhx6 and PV mice (Lhx6, 216 ± 27 a.u., n = 4 vs PV, 202 ± 51 a.u., n = 4; p = 0.6; Fig. 4C). To confirm that fluorescence intensity varied similarly as a function of axonal density in both mouse lines, we measured the fluorescence intensity of a small region of tissue (143 μm2) and manually counted the number of axonal varicosities present. In both mouse lines, a linear relationship was observed between fluorescence intensity and number of boutons, quantified in brain areas receiving low (striatum), medium (SNr), and high (STN) amounts of axonal projections (Fig. 4D). Therefore, we were able to use the normalized fluorescence intensity to compare the density and pattern of axonal projections from Lhx6–GPe and PV–GPe neurons to many different brain regions.
Figure 4.
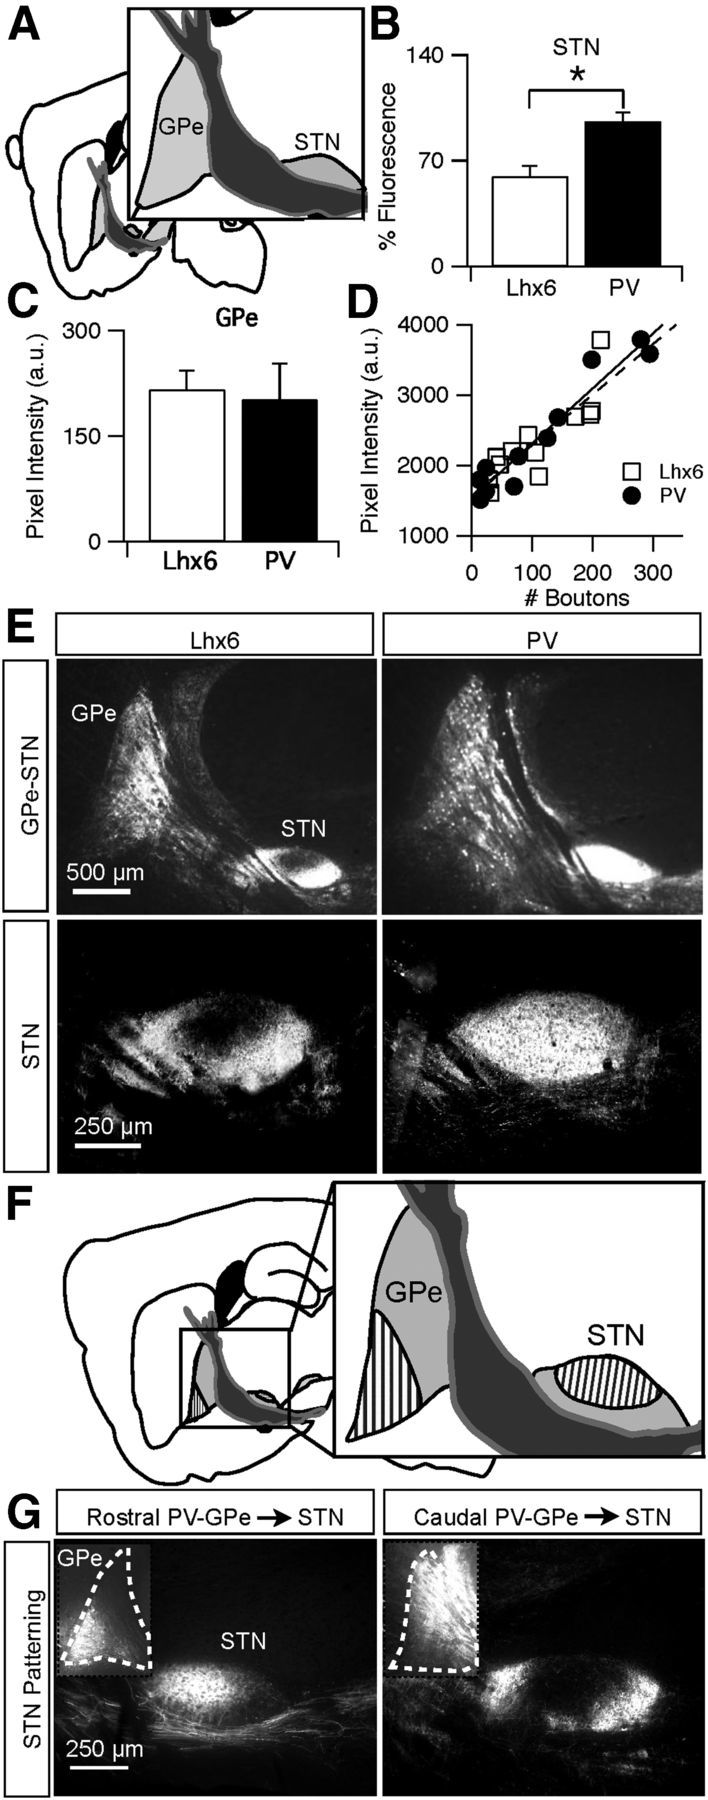
PV–GPe neurons project more strongly to the STN than Lhx6–GPe neurons. A, Schematic of central sagittal plane used for analysis. B, Normalized fluorescence intensity of axons from Lhx6–GPe and PV–GPe neurons in the STN. *p = 0.006. Error bars are SEM. C, Fluorescence intensities measured in the GPe of Lhx6–Cre and PV–Cre mice 2 weeks after viral injections. Error bars are SD. D, Scatter plot showing a similar linear relationship between pixel intensity and bouton number within a 143 μm2 area of tissue, analyzed in brain areas receiving low, medium, and high densities of axonal innervation. E, EYFP fluorescence in Lhx6–Cre (left) and PV–Cre (right) mice 2 weeks after viral injections. Top, Magnification at 2.5× epifluorescent images displaying typical expression in the GPe and STN. Bottom, Magnification at 10× epifluorescent images from the central plane of analysis displaying fluorescence in the STN. F, Schematic of the topographic organization of PV–GPe projections from the rostral (striped) and caudal (solid) GPe to the STN. G, Representative examples of viral injections in the rostral (left) or caudal (right) GPe and their resulting projections onto the STN.
The first brain region investigated was the STN, the canonical target of the GPe (Fig. 4A). Both Lhx6–GPe and PV–GPe neurons densely innervated the STN, but innervation from PV–GPe neurons was significantly greater than innervation from Lhx6–GPe neurons (Lhx6, 59.9 ± 13.6 a.u., n = 4 vs PV, 96.2 ± 11.3 a.u., n = 4; p = 0.006; Fig. 4B). This difference in innervation density was primarily attributable to the unique patterning of Lhx6 projections to the STN. Unlike PV–GPe projections, which were evenly distributed throughout the extent of the nucleus, Lhx6–GPe projections were clustered around the periphery of the STN and did not target the central portion of the nucleus (Fig. 4E).
To examine the topographical organization of projections from the GPe to the STN, viral injections were targeted to rostral and caudal portions of the GPe (Fig. 4F). No differences in axonal projection patterns to the STN were observed in the Lhx6–Cre line from different regions of the GPe. In contrast, axonal projection patterns to the STN were topographically organized in the PV–Cre line. The rostroventral region projected to the central portion of the STN and rarely showed expression in the periphery (Fig. 4G, left). In contrast, the caudal region of the GPe projected to the periphery of the STN, similar to what was observed in the Lhx6 population (Fig. 4G, right). These results suggest a topographic organization of PV projections to distinct zones within the STN.
Lhx6–GPe and PV–GPe neurons differentially innervate the SNc but similarly innervate GABAergic output nuclei of the basal ganglia
The SN is subdivided into two regions that subserve distinct purposes in basal ganglia function (Fig. 5A). The SNr is made up of GABAergic neurons that act as a major output of the basal ganglia (Samantaray et al., 2004). The SNc is a region that lies dorsal to the SNr and contains a dense collection of dopaminergic neurons that innervate the striatum and many other structures (Björklund and Dunnett, 2007). GPe projections have been shown to innervate both the SNr and SNc in rats, but these connections are still poorly understood (Paladini et al., 1999). In the SNr, there was no significant difference in density of axons arising from Lhx6–GPe versus PV–GPe neurons (Lhx6, 15.3 ± 3.85 a.u., n = 4 vs PV, 22.8 ± 14.7 a.u., n = 3; p = 0.3; Fig. 5B). Both populations of neurons projected to the SNr diffusely with no clear topographical organization (Fig. 5C, top and middle).
Figure 5.

Lhx6–GPe and PV–GPe projections to basal ganglia output nuclei. A, Schematic of the central sagittal plane used for analysis and reference to the distinct areas of the SN: SNc (red) and SNr (green). B, Normalized fluorescence intensity of axons from Lhx6–GPe and PV–GPe neurons in the SNr and SNc. Lhx6–GPe neurons projected more densely to the SNc than PV–GPe neurons, and Lhx6 projections to the SNc were denser than those to the SNr. *p = 0.03; **p = 0.002. Error bars are SEM. C, Top, Epifluorescent images of axons from Lhx6–GPe and PV–GPe neurons in the SNr and SNc (outlined with dotted line). Middle, Overlay of GPe axons (green) and TH immunofluorescence (red). Bottom, Confocal images of Lhx6–GPe and PV–GPe axons (green) in the SNc; TH+ dopamine neurons are red. D, Schematic of GPi location within the internal capsule. E, Normalized fluorescence intensity of axons from Lhx6–GPe and PV–GPe neurons in the GPi. Error bars are SEM. F, Confocal images of Lhx6–GPe and PV–GPe axons in the GPi. Note that the GPi neurons did not express EYFP.
A markedly different scenario was observed in the SNc. As seen in Figure 5C, the distinct clustering of axons was observed in the dorsal region of the SN. To resolve the borders of the SNc and SNr, tissue was stained with antibodies against TH to label dopamine neurons. Axonal projections to the SNc were more concentrated than those to the SNr, and the majority of SNc projections arose from Lhx6–GPe neurons (Lhx6, 41.0 ± 9.40 a.u., n = 4 vs PV, 21.4 ± 6.05 a.u., n = 3; p = 0.03; Fig. 5C).
The GPi, one of the major output structures of the basal ganglia, is nested in the internal capsule fibers between the GPe and STN (Fig. 5D). Both Lhx6–GPe and PV–GPe neurons projected to the GPi in equal amounts (Lhx6, 37.5 ± 25.7 a.u., n = 4 vs PV, 45.8 ± 11.1 a.u., n = 4; p = 0.57; Fig. 5E). As expected, axonal projections from the both populations of GPe neurons formed basket synapses onto the neurons of the GPi (Fig. 5F). Viral expression was not observed in GPi neurons.
Lhx6–GPe neurons project more densely to the dorsolateral striatum than PV–GPe neurons
The densities of axons from Lhx6–GPe or PV–GPe neurons innervating the striatum were quantified within three functionally distinct striatal zones: dorsolateral, dorsomedial, and ventral. The dorsolateral region of the striatum is important for sensorimotor processing, whereas ventral striatum deals with appetitive and rewarding aspects of behavior (Packard and Knowlton, 2002; Kelley, 2004; O'Doherty et al., 2004). The dorsomedial region is important for instrumental conditioning and behavioral flexibility and is considered the associative territory of striatum (Ragozzino et al., 2002; Yin et al., 2005). GPe neurons sent sparse projections to striatum and formed a gradient of high to low density along the dorsoventral axis and the lateromedial axis (Fig. 6B,C).
Figure 6.
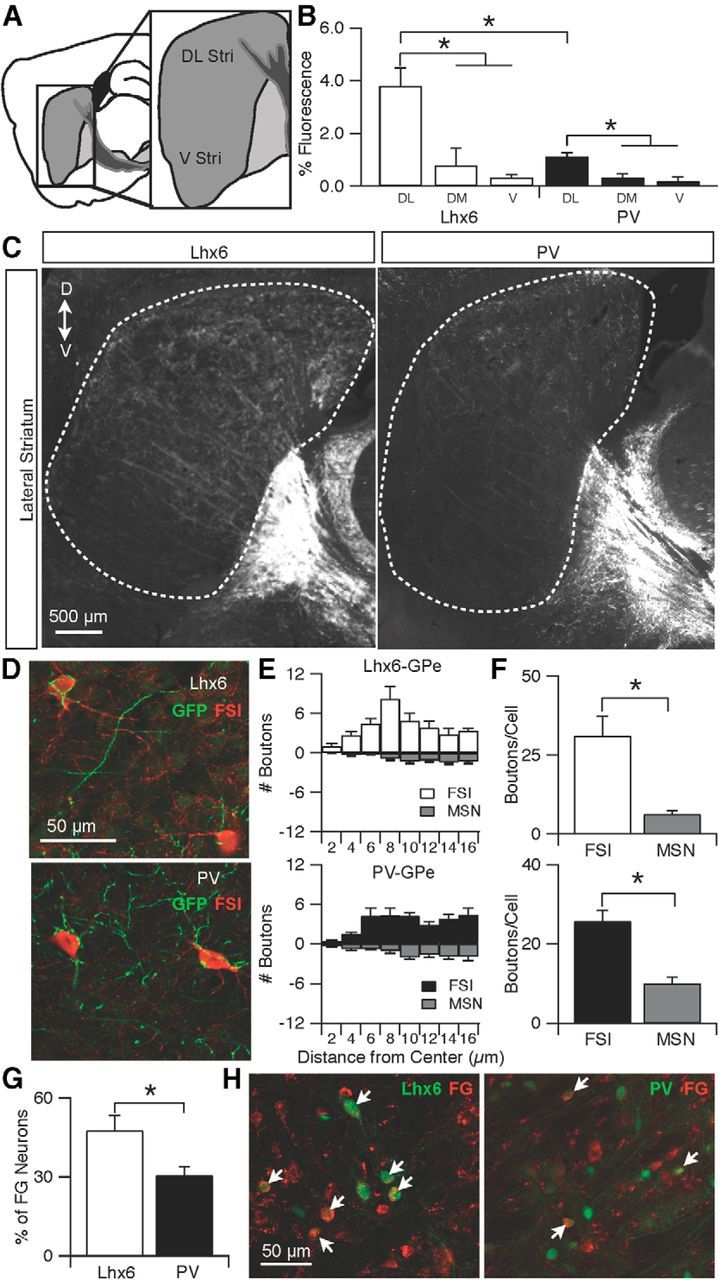
Lhx6–GPe neurons project more strongly to the dorsolateral striatum than PV–GPe neurons. A, Schematic of the sagittal plane used for analysis. DL Str, Dorsolateral striatum; V Str, ventral striatum. B, Normalized fluorescence intensity of axons from Lhx6–GPe and PV–GPe neurons to the dorsolateral striatum (DL), dorsomedial striatum (DM), and ventral striatum (V). Striatal projections from both cell types were significantly denser to the dorsolateral region than to the dorsomedial or ventral regions (Lhx6: DL vs DM, p = 0.020; DL vs V, p = 0.003; PV: DL vs DM, p = 0.006; DL vs V, p = 0.004); dorsolateral projections from Lhx6–GPe neurons were significantly denser than dorsolateral projections from PV–GPe neurons. Error bars are SEM. C, Epifluorescent images of axons from Lhx6–GPe and PV–GPe neurons in the striatum. D, Dorsal; V, ventral. D, Confocal images showing the selective innervation of Lhx6–GPe axons (top, green) or PV–GPe axons (bottom, green) onto striatal FSIs (red). E, Results of Sholl analysis. Number of boutons from Lhx6–GPe (top) or PV–GPe (bottom) neurons were counted in concentric circles of increasing diameter (2 μm) around striatal FSIs or MSNs. F, Bar graphs comparing total number of boutons onto FSIs or MSNs from Lhx6–GPe (top, *p = 0.001) or PV–GPe (bottom, *p = 0.0001) neurons. G, Bar graph showing the percentage of FG-labeled neurons that were either Lhx6+ or PV+. Significantly more FG neurons were Lhx6+ than were PV+ (*p = 0.003). H, Confocal images of the GPe in tissue from an Lhx6–GFP mouse, stained for PV and antibodies against FG. The Lhx6–GPe (left) and PV–GPe (right) neurons (green) showed colocalization with the retrograde tracer FG (red). Arrows indicate double-labeled neurons.
In the dorsolateral region of the striatum (DL Str), in which GPe projections were most dense, axonal projections from Lhx6–GPe neurons were significantly more dense than axonal projections from PV–GPe neurons (DL StrLhx6, 3.80 ± 1.38 a.u., n = 4 vs DL StrPV, 1.14 ± 0.27 a.u., n = 4; p = 0.009; Fig. 6B,C). In contrast, axonal projections to the medial striatum (DM Str), an associative territory of the striatum, were less dense for both cell types, and the density did not differ significantly between Lhx6–GPe and PV–GPe neurons (DM StrLhx6, 0.79 ± 1.32 a.u., n = 4 vs DM StrPV, 0.32 ± 0.29 a.u., n = 4; p = 0.5; Fig. 6B). Similarly, the ventral striatum (V Str) showed little to no axonal projections from both populations of neurons (V StrLhx6, 0.34 ± 0.23 a.u., n = 4 vs V StrPV, 0.19 ± 0.31 a.u., n = 4; p = 0.48).
Consistent with previous work, axonal projections from both Lhx6–GPe and PV–GPe neurons appeared to target GABAergic interneurons in the striatum (Bevan et al., 1998), as indicated by axonal varicosities that were clustered around PV+ interneurons, corresponding to FSIs (Fig. 6D). To quantify the selectivity of GPe innervation for striatal FSIs compared with MSNs, we counted the number of boutons surrounding each cell type using a Sholl analysis (Chattopadhyaya et al., 2004). Striatal FSIs received significantly more innervation from the GPe than MSNs (Fig. 6E,F).
Our quantification of axon densities suggests that Lhx6–GPe neurons give rise to a greater proportion of striatal projections than do PV–GPe neurons. To confirm this result, we injected the retrograde tracer FG into the dorsolateral striatum of Lhx6–GFP or PV–Cre × Ai9 mice (Fig. 6G,H). After 2 weeks, tissue was processed and analyzed to determine what percentage of retrogradely labeled neurons in the GPe were either Lhx6 or PV. As shown in Figure 6G, FG labeled significantly more Lhx6–GPe neurons than PV–GPe neurons (Lhx6, 47.5 ± 18.4%, n = 84 of 177 vs PV, 30.5 ± 11.0%, n = 59/182; p = 0.003, Fisher's exact test). Together, these data suggest that a greater proportion of GPe projections to the striatum arise from Lhx6–GPe neurons, and the focus of these projections is interneurons in the sensorimotor input region of the striatum.
Distinct projections of PV–GPe neurons to the pf
GPe projections to the thalamus have been described previously (Hazrati and Parent, 1991; Chattopadhyaya and Pal, 2004) but are typically restricted to the RT, which is located rostral to the GPe and extends farther medially in the brain (Fig. 7A). The RT is a specialized thalamic nucleus containing mostly GABAergic neurons that inhibit numerous thalamic nuclei and have no direct cortical projections (Houser et al., 1980; Ohara, 1988; Pinault and Deschênes, 1998). Consistent with previous studies, axonal projections from both populations of neurons were found in the RT with no significant difference in density (Lhx6, 28.0 ± 6.71 a.u., n = 4 vs PV, 24.4 ± 14.0 a.u., n = 4; p = 0.6; Fig. 7B,C).
Figure 7.

Lhx6–GPe and PV–GPe projections to the thalamus. A, Schematic of thalamic nuclei locations in a medial sagittal slice. B, Normalized fluorescence intensity of axons from Lhx6–GPe and PV–GPe neurons to the RT. There was no significant difference between the two populations. Error bars are SEM. C, Epifluorescent images of axons from Lhx6–GPe and PV–GPe neurons in the RT. D, Normalized fluorescence intensity of axons from Lhx6–GPe and PV–GPe neurons in the pf. Axons from Lhx6–GPe neurons were not observed in the pf. Error bars are SEM. *p = 0.0005. E, Epifluorescent images of axons from Lhx6–GPe and PV–GPe neurons in the pf. Inset, Confocal image of dense axonal innervation in the pf from PV–GPe neurons. Scale bar, 25 μm. F, IPSC recorded in a pf neuron in response to optical stimulation (1 ms) of ChR2-expressing PV–GPe axons. Graph shows IPSC amplitudes recorded from five pf neurons and the population average.
In contrast to projections to the RT, Lhx6–GPe and PV–GPe neurons differed substantially in their projections to the pf. The Lhx6–GPe population exhibited virtually no axonal projections to the pf, whereas PV–GPe neurons projected densely, covering the full extent of the nucleus (Lhx6, 0.83 ± 1.3 a.u., n = 4 vs PV, 69.0 ± 19.9 a.u., n = 4; p = 0.0005; Fig. 7D,E). As seen in Figure 7E, the nuclei surrounding the pf showed no axonal projections, which would be expected if axons arose from spillover labeling of neurons in the RT. Furthermore, there was a topographic organization of projections from the GPe to the pf. On targeted injections of rostral and caudal portions of the GPe, we found that the pf was only targeted by caudal PV–GPe neurons but not by rostral PV–GPe neurons (data not shown). Injections in the rostral portion of the GPe show little to no expression within the pf. To ensure that PV–GPe axonal projections to the pf were functionally active and not just fibers of passage, a virus containing ChR2–EYFP was injected into the GPe of PV–Cre mice. Optically evoked IPSCs from a holding potential of −70 mV were observed in five of five pf neurons (565.04 ± 312.3 pA, n = 5; Fig. 7F), confirming that PV–GPe neurons form functional inhibitory synapses onto pf neurons. These results suggest the presence of a previously undescribed output projection from the GPe to the pf.
Discussion
Here, we establish the use of Lhx6 and PV transgenic mouse lines to identify genetically distinct classes of GPe neurons that differ molecularly, anatomically, and electrophysiologically. Viral-mediated expression of EYFP revealed that both Lhx6–GPe and PV–GPe neurons differed in their axonal innervation of a number of brain regions, including the striatum, SNc, STN, and the pf. These results reveal cell-type-specific segregation of GPe output and establish genetic tools for elucidating the role of distinct GPe output pathways in behavior and disease.
Lhx6 and PV transgenic mouse lines subdivide GPe neurons into two groups
Approximately two-thirds of GPe neurons were labeled in Lhx6 (one-third) or PV (one-third) transgenic mouse lines. The remaining one-third of GPe neurons could represent a third, as yet unidentified, neuronal population in the GPe or could represent incomplete labeling of Lhx6 and PV populations. Although the fraction of PV–GPe neurons in mice (one-third) was lower than that reported in rats (two-thirds; Kita, 2007), we observed a similarly low number of PV neurons using both immunohistochemical and genetic techniques. These results suggest that the number of PV–GPe neurons is lower in mice than in other species, such as rats and primates.
Lhx6 is a homeobox protein expressed in the medial ganglionic eminence (MGE) during development. The MGE is the origin of most forebrain GABAergic interneurons (Marin et al., 2000; Cobos et al., 2006), as well as GPe neurons (Flandin et al., 2010; Nóbrega-Pereira et al., 2010). It remains unclear why only a subset of GPe neurons are labeled in Lhx6 transgenic mice, but one possibility is that Lhx6–GPe neurons correspond to a fraction of MGE neurons in which Nkx2.1 expression is downregulated during embryonic stages (Nóbrega-Pereira et al., 2010). Whereas PV has been used previously to identify a subset of GPe neurons (Kita, 1994, 2007; Mallet et al., 2012), our results show for the first time that Lhx6 can be used to identify a second, non-overlapping subset of GPe neurons.
Lhx6–GPe and PV–GPe neurons were differentially distributed along the lateromedial axis of the GPe. PV–GPe neurons were more densely distributed in the lateral portion of the GPe, the sensorimotor territory of the nucleus (Alexander and Crutcher, 1990; Matsumura et al., 1995; Haber et al., 2000; François et al., 2004), in which pharmacological activation produces dyskinetic movements in primates (Matsumura et al., 1995; Grabli et al., 2004). In contrast, Lhx6–GPe neurons were more densely distributed in the medial portion of the GPe, the limbic and associative territories of the nucleus (Alexander and Crutcher, 1990; Haber et al., 2000; François et al., 2004), in which pharmacological activation produces stereotypies and hyperactivity (Grabli et al., 2004).
Lhx6 and PV neurons have different intrinsic electrophysiological properties
Differences in the electrophysiological properties of GPe neurons have been described both in vivo (Kelland et al., 1995; Mallet et al., 2008, 2012; Benhamou et al., 2012) and in slice preparations (Nambu and Llinaś, 1994; Cooper and Stanford, 2000; Kita, 2007; Deister et al., 2013), but a rigorous classification scheme has not been established. Furthermore, there is some controversy about whether or not intrinsic properties can even be used to define groups of GPe neurons because these properties vary continuously across the population and can change during the course of an experiment (Günay et al., 2008; Deister et al., 2013).
Because Lhx6–GPe and PV–GPe neurons are genetically defined, this establishes a rigorous classification scheme with which to determine how intrinsic firing properties vary across cell types in the GPe. Intracellular recordings from Lhx6–GPe and PV–GPe neurons revealed that intrinsic parameters varied continuously across the population, but a number of parameters differed significantly between these two cell types. PV–GPe neurons had narrower APs and could sustain higher maximum firing rates than Lhx6–GPe neurons, suggesting that PV–GPe neurons are better tuned to reliably respond to rapid, high-frequency inputs than Lhx6–GPe neurons. In addition, PV–GPe neurons had lower input resistances and higher whole-cell capacitances than Lhx6–GPe neurons, suggesting that PV–GPe neurons are larger.
Lhx6–GPe and PV–GPe neurons also differed with respect to spontaneous firing rates, which were higher in PV–GPe neurons. Spontaneous firing in GPe neurons is mediated by a combination of Ih and persistent Na+ currents (Chan et al., 2004, 2011; Mercer et al., 2007). Our results that sag currents were similar between Lhx6–GPe and PV–GPe neurons suggests that additional currents besides Ih may contribute to the different firing rates between these two cell populations, including persistent Na+ currents or Ca2+-sensitive K+ currents, which have also been shown to regulate firing rates in GPe neurons (Deister et al., 2009; Schultheiss et al., 2010).
Implications of genetically defined output pathways for basal ganglia function
Historically, one of the most robust classification schemes for GPe neurons has been based on their axonal projection patterns (Bevan et al., 1998; Hoover and Marshall, 1999; Kita et al., 1999; Sato et al., 2000; Hoover and Marshall, 2002; Kita, 2007; Mallet et al., 2012). Although both Lhx6–GPe and PV–GPe neurons projected to many of the same brain regions, the density of these projections differed significantly in a number of areas, including the striatum and SNc, which were more densely innervated by Lhx6–GPe neurons, and the STN and pf, which were more densely innervated by PV–GPe neurons (Fig. 8). Both cell types made similarly dense projections to a number of additional brain regions, both within and outside the basal ganglia, including the GPi, SNr, RT, BLA, and PSTh (Fig. 8). We also observed that both cell types made projections to the cortex, but the diffuse nature of these projections made quantification difficult.
Figure 8.

Summary of normalized fluorescence intensity of axons from Lhx6–GPe (white) and PV–GPe (black) neurons to identified brain structures. Error bars are SEM. Asterisks denote significance between cell types.
Based on axonal density and retrograde labeling, we found that Lhx6–GPe neurons made up a greater portion of GPe projections to the striatum than PV–GPe neurons. This is consistent with previous studies in which most striatal-projecting neurons lack PV expression (Hoover and Marshall, 1999, 2002; Kita et al., 1999; Mallet et al., 2012). Our results suggests that Lhx6 labels a greater proportion of “pallidostriatal neurons” described previously in monkeys and rats (Bevan et al., 1998; Sato et al., 2000). Axons of pallidostriatal neurons target GABAergic interneurons in the striatum (Bevan et al., 1998), and this projection may play an important and underappreciated role in regulating striatal activity (Wilson, 2009; Gage et al., 2010).
Lhx6–GPe neurons also make stronger projections to the SNc than PV–GPe neurons. The SNc contains the majority of dopamine neurons that innervate the dorsal striatum as well as the GPe (Parent and Smith, 1987; Lavoie et al., 1989; Rommelfanger and Wichmann, 2010). Dopamine release from the SNc is critically involved in motor aspects of basal ganglia function (Gerfen et al., 1990; Björklund and Dunnett, 2007; Kreitzer and Malenka, 2008; Gerfen and Surmeier, 2011; Surmeier et al., 2011); therefore, projections from Lhx6–GPe neurons may play an underappreciated yet influential role in movement (Häusser and Yung, 1994; Paladini et al., 1999).
The axonal projections of PV–GPe neurons were significantly stronger to the STN than those of Lhx6–GPe neurons. The difference in STN innervation by PV–GPe and Lhx6–GPe neurons was most apparent in an inner region of the nucleus, essentially devoid of innervation from Lhx6–GPe neurons but strongly innervated by PV–GPe neurons located in the rostral portion of the nucleus. This result confirms the presence of a topographical projection from the GPe to the STN that has been observed in primates (François et al., 2004), but the functional role of the medial portions of the STN in rodents is not known. The GPe and STN form a reciprocally connected network that has received much attention for its role in pathological oscillations in Parkinson's disease (Bergman et al., 1994; Nini et al., 1995; Plenz and Kital, 1999; Magill et al., 2001; Bevan et al., 2002; Terman et al., 2002; Mallet et al., 2008; Holgado et al., 2010; Fan et al., 2012). Although both Lhx6–GPe and PV–GPe neurons project strongly to the STN, changes in the denser PV–GPe projections may play a more prominent role in the development or maintenance of pathological oscillations in Parkinson's disease.
The most striking difference in the projection patterns of Lhx6–GPe and PV–GPe neurons observed was in the pf, which received dense innervation from PV–GPe neurons but not Lhx6–GPe neurons. The pf plays a role in attention and behavioral flexibility, and its projections to the striatum are particularly important for the control of cholinergic interneurons (Matsumoto et al., 2001; Minamimoto and Kimura, 2002; Smith et al., 2004, 2011). The dense projections of PV–GPe neurons to the pf suggest that they are an important component of non-motor output pathways of the GPe. The pf may play a role in motor control as well, based on results that deep brain stimulation in the pf is particularly effective at alleviating tremors in patients with movement disorders (Krauss et al., 2002; Goff et al., 2009; Stefani et al., 2009).
In summary, we have shown that Lhx6 and PV transgenic mice can be used as tools to identify genetically distinct circuits within the GPe with the potential to subserve different roles in basal ganglia function. By virtue of their projections to striatal interneurons and SNc dopamine neurons, Lhx6–GPe neurons are well positioned to regulate striatal output and influence the balance of direct and indirect pathway activity to determine overall levels of motor output. In contrast, PV–GPe neurons make stronger projections to the STN and pf, brain areas with both motor and non-motor functions and areas that have been implicated specifically in the generation of pathological oscillations and tremor in Parkinson's disease, suggesting a role of PV–GPe neurons in these aspects of disease pathophysiology.
Footnotes
This work was supported by National Institutes of Health Grant R00 NS076524. We thank Richard C. Gerkin for specialized IGOR analysis and acquisition routines, Nicoletta Kessaris for providing Lhx6–Cre mice, Hongkui Zeng for providing PV–Cre mice, and Haibeng Teng of the Molecular Biosensor and Imaging Center for assistance with the confocal microscopy.
References
- Albin RL, Young AB, Penney JB. The functional anatomy of basal ganglia disorders. Trends Neurosci. 1989;12:366–375. doi: 10.1016/0166-2236(89)90074-X. [DOI] [PubMed] [Google Scholar]
- Alexander GE, Crutcher MD. Functional architecture of basal ganglia circuits: neural substrates of parallel processing. Trends Neurosci. 1990;13:266–271. doi: 10.1016/0166-2236(90)90107-L. [DOI] [PubMed] [Google Scholar]
- Benhamou L, Bronfeld M, Bar-Gad I, Cohen D. Globus Pallidus external segment neuron classification in freely moving rats: a comparison to primates. PLoS One. 2012;7:e45421. doi: 10.1371/journal.pone.0045421. [DOI] [PMC free article] [PubMed] [Google Scholar]
- Bergman H, Wichmann T, Karmon B, DeLong MR. The primate subthalamic nucleus. II. Neuronal activity in the MPTP model of parkinsonism. J Neurophysiol. 1994;72:507–520. doi: 10.1152/jn.1994.72.2.507. [DOI] [PubMed] [Google Scholar]
- Bergman H, Feingold A, Nini A, Raz A, Slovin H, Abeles M, Vaadia E. Physiological aspects of information processing in the basal ganglia of normal and parkinsonian primates. Trends Neurosci. 1998;21:32–38. doi: 10.1016/S0166-2236(97)01151-X. [DOI] [PubMed] [Google Scholar]
- Bevan MD, Booth PA, Eaton SA, Bolam JP. Selective innervation of neostriatal interneurons by a subclass of neuron in the globus pallidus of the rat. J Neurosci. 1998;18:9438–9452. doi: 10.1523/JNEUROSCI.18-22-09438.1998. [DOI] [PMC free article] [PubMed] [Google Scholar]
- Bevan MD, Magill PJ, Terman D, Bolam JP, Wilson CJ. Move to the rhythm: oscillations in the subthalamic nucleus-external globus pallidus network. Trends Neurosci. 2002;25:525–531. doi: 10.1016/S0166-2236(02)02235-X. [DOI] [PubMed] [Google Scholar]
- Björklund A, Dunnett SB. Dopamine neuron systems in the brain: an update. Trends Neurosci. 2007;30:194–202. doi: 10.1016/j.tins.2007.03.006. [DOI] [PubMed] [Google Scholar]
- Chan CS, Shigemoto R, Mercer JN, Surmeier DJ. HCN2 and HCN1 channels govern the regularity of autonomous pacemaking and synaptic resetting in globus pallidus neurons. J Neurosci. 2004;24:9921–9932. doi: 10.1523/JNEUROSCI.2162-04.2004. [DOI] [PMC free article] [PubMed] [Google Scholar]
- Chan CS, Glajch KE, Gertler TS, Guzman JN, Mercer JN, Lewis AS, Goldberg AB, Tkatch T, Shigemoto R, Fleming SM, Chetkovich DM, Osten P, Kita H, Surmeier DJ. HCN channelopathy in external globus pallidus neurons in models of Parkinson's disease. Nat Neurosci. 2011;14:85–92. doi: 10.1038/nn.2692. [DOI] [PMC free article] [PubMed] [Google Scholar]
- Chattopadhyaya B, Di Cristo G, Higashiyama H, Knott GW, Kuhlman SJ, Welker E, Huang ZJ. Experience and activity-dependent maturation of perisomatic GABAergic innervation in primary visual cortex during a postnatal critical period. J Neurosci. 2004;24:9598–9611. doi: 10.1523/JNEUROSCI.1851-04.2004. [DOI] [PMC free article] [PubMed] [Google Scholar]
- Chattopadhyaya R, Pal A. Improved model of a LexA repressor dimer bound to recA operator. J Biomol Struct Dyn. 2004;21:681–689. doi: 10.1080/07391102.2004.10506959. [DOI] [PubMed] [Google Scholar]
- Cobos I, Long JE, Thwin MT, Rubenstein JL. Cellular patterns of transcription factor expression in developing cortical interneurons. Cereb Cortex. 2006;16(Suppl 1):i82–i88. doi: 10.1093/cercor/bhk003. [DOI] [PubMed] [Google Scholar]
- Cooper AJ, Stanford IM. Electrophysiological and morphological characteristics of three subtypes of rat globus pallidus neurone in vitro. J Physiol. 2000;527:291–304. doi: 10.1111/j.1469-7793.2000.t01-1-00291.x. [DOI] [PMC free article] [PubMed] [Google Scholar]
- Deister CA, Chan CS, Surmeier DJ, Wilson CJ. Calcium-activated SK channels influence voltage-gated ion channels to determine the precision of firing in globus pallidus neurons. J Neurosci. 2009;29:8452–8461. doi: 10.1523/JNEUROSCI.0576-09.2009. [DOI] [PMC free article] [PubMed] [Google Scholar]
- Deister CA, Dodla R, Barraza D, Kita H, Wilson CJ. Firing rate and pattern heterogeneity in the globus pallidus arise from a single neuronal population. J Neurophysiol. 2013;109:497–506. doi: 10.1152/jn.00677.2012. [DOI] [PMC free article] [PubMed] [Google Scholar]
- DeLong MR. Primate models of movement disorders of basal ganglia origin. Trends Neurosci. 1990;13:281–285. doi: 10.1016/0166-2236(90)90110-V. [DOI] [PubMed] [Google Scholar]
- DeLong MR, Crutcher MD, Georgopoulos AP. Primate globus pallidus and subthalamic nucleus: functional organization. J Neurophysiol. 1985;53:530–543. doi: 10.1152/jn.1985.53.2.530. [DOI] [PubMed] [Google Scholar]
- Di Cristo G, Wu C, Chattopadhyaya B, Ango F, Knott G, Welker E, Svoboda K, Huang ZJ. Subcellular domain-restricted GABAergic innervation in primary visual cortex in the absence of sensory and thalamic inputs. Nat Neurosci. 2004;7:1184–1186. doi: 10.1038/nn1334. [DOI] [PubMed] [Google Scholar]
- Fan KY, Baufreton J, Surmeier DJ, Chan CS, Bevan MD. Proliferation of external globus pallidus-subthalamic nucleus synapses following degeneration of midbrain dopamine neurons. J Neurosci. 2012;32:13718–13728. doi: 10.1523/JNEUROSCI.5750-11.2012. [DOI] [PMC free article] [PubMed] [Google Scholar]
- Flandin P, Kimura S, Rubenstein JL. The progenitor zone of the ventral medial ganglionic eminence requires Nkx2–1 to generate most of the globus pallidus but few neocortical interneurons. J Neurosci. 2010;30:2812–2823. doi: 10.1523/JNEUROSCI.4228-09.2010. [DOI] [PMC free article] [PubMed] [Google Scholar]
- Fogarty M, Grist M, Gelman D, Marín O, Pachnis V, Kessaris N. Spatial genetic patterning of the embryonic neuroepithelium generates GABAergic interneuron diversity in the adult cortex. J Neurosci. 2007;27:10935–10946. doi: 10.1523/JNEUROSCI.1629-07.2007. [DOI] [PMC free article] [PubMed] [Google Scholar]
- François C, Grabli D, McCairn K, Jan C, Karachi C, Hirsch EC, Féger J, Tremblay L. Behavioural disorders induced by external globus pallidus dysfunction in primates II. Anatomical study. Brain. 2004;127:2055–2070. doi: 10.1093/brain/awh239. [DOI] [PubMed] [Google Scholar]
- Gage GJ, Stoetzner CR, Wiltschko AB, Berke JD. Selective activation of striatal fast-spiking interneurons during choice execution. Neuron. 2010;67:466–479. doi: 10.1016/j.neuron.2010.06.034. [DOI] [PMC free article] [PubMed] [Google Scholar]
- Gerfen CR, Surmeier DJ. Modulation of striatal projection systems by dopamine. Annu Rev Neurosci. 2011;34:441–466. doi: 10.1146/annurev-neuro-061010-113641. [DOI] [PMC free article] [PubMed] [Google Scholar]
- Gerfen CR, Engber TM, Mahan LC, Susel Z, Chase TN, Monsma FJ, Jr, Sibley DR. D1 and D2 dopamine receptor-regulated gene expression of striatonigral and striatopallidal neurons. Science. 1990;250:1429–1432. doi: 10.1126/science.2147780. [DOI] [PubMed] [Google Scholar]
- Goff LK, Jouve L, Melon C, Salin P. Rationale for targeting the thalamic centre-median parafascicular complex in the surgical treatment of Parkinson's disease. Parkinsonism Relat Disord. 2009;15(Suppl 3):S167–S170. doi: 10.1016/S1353-8020(09)70807-7. [DOI] [PubMed] [Google Scholar]
- Grabli D, McCairn K, Hirsch EC, Agid Y, Féger J, François C, Tremblay L. Behavioural disorders induced by external globus pallidus dysfunction in primates: I. Behavioural study. Brain. 2004;127:2039–2054. doi: 10.1093/brain/awh220. [DOI] [PubMed] [Google Scholar]
- Günay C, Edgerton JR, Jaeger D. Channel density distributions explain spiking variability in the globus pallidus: a combined physiology and computer simulation database approach. J Neurosci. 2008;28:7476–7491. doi: 10.1523/JNEUROSCI.4198-07.2008. [DOI] [PMC free article] [PubMed] [Google Scholar]
- Haber SN, Fudge JL, McFarland NR. Striatonigrostriatal pathways in primates form an ascending spiral from the shell to the dorsolateral striatum. J Neurosci. 2000;20:2369–2382. doi: 10.1523/JNEUROSCI.20-06-02369.2000. [DOI] [PMC free article] [PubMed] [Google Scholar]
- Häusser MA, Yung WH. Inhibitory synaptic potentials in guinea-pig substantia nigra dopamine neurones in vitro. J Physiol. 1994;479:401–422. doi: 10.1113/jphysiol.1994.sp020305. [DOI] [PMC free article] [PubMed] [Google Scholar]
- Hazrati LN, Parent A. Projection from the external pallidum to the reticular thalamic nucleus in the squirrel monkey. Brain Res. 1991;550:142–146. doi: 10.1016/0006-8993(91)90418-U. [DOI] [PubMed] [Google Scholar]
- Holgado AJ, Terry JR, Bogacz R. Conditions for the generation of beta oscillations in the subthalamic nucleus-globus pallidus network. J Neurosci. 2010;30:12340–12352. doi: 10.1523/JNEUROSCI.0817-10.2010. [DOI] [PMC free article] [PubMed] [Google Scholar]
- Hoover BR, Marshall JF. Population characteristics of preproenkephalin mRNA-containing neurons in the globus pallidus of the rat. Neurosci Lett. 1999;265:199–202. doi: 10.1016/S0304-3940(99)00251-7. [DOI] [PubMed] [Google Scholar]
- Hoover BR, Marshall JF. Further characterization of preproenkephalin mRNA-containing cells in the rodent globus pallidus. Neuroscience. 2002;111:111–125. doi: 10.1016/S0306-4522(01)00565-6. [DOI] [PubMed] [Google Scholar]
- Houser CR, Vaughn JE, Barber RP, Roberts E. GABA neurons are the major cell type of the nucleus reticularis thalami. Brain Res. 1980;200:341–354. doi: 10.1016/0006-8993(80)90925-7. [DOI] [PubMed] [Google Scholar]
- Isaksson J, Acharya S, Barman J, Cheruku P, Chattopadhyaya J. Single-stranded adenine-rich DNA and RNA retain structural characteristics of their respective double-stranded conformations and show directional differences in stacking pattern. Biochemistry. 2004;43:15996–16010. doi: 10.1021/bi048221v. [DOI] [PubMed] [Google Scholar]
- Jaeger D, Gilman S, Aldridge JW. Neuronal activity in the striatum and pallidum of primates related to the execution of externally cued reaching movements. Brain Res. 1995;694:111–127. doi: 10.1016/0006-8993(95)00780-T. [DOI] [PubMed] [Google Scholar]
- Kelland MD, Soltis RP, Anderson LA, Bergstrom DA, Walters JR. In vivo characterization of two cell types in the rat globus pallidus which have opposite responses to dopamine receptor stimulation: comparison of electrophysiological properties and responses to apomorphine, dizocilpine, and ketamine anesthesia. Synapse. 1995;20:338–350. doi: 10.1002/syn.890200407. [DOI] [PubMed] [Google Scholar]
- Kelley AE. Ventral striatal control of appetitive motivation: role in ingestive behavior and reward-related learning. Neurosci Biobehav Rev. 2004;27:765–776. doi: 10.1016/j.neubiorev.2003.11.015. [DOI] [PubMed] [Google Scholar]
- Kincaid AE, Penney JB, Jr, Young AB, Newman SW. The globus-pallidus receives a projection from the parafascicular nucleus in the rat. Brain Res. 1991;553:18–26. doi: 10.1016/0006-8993(91)90224-J. [DOI] [PubMed] [Google Scholar]
- Kita H. Parvalbumin-immunopositive neurons in rat globus pallidus: a light and electron microscopic study. Brain Res. 1994;657:31–41. doi: 10.1016/0006-8993(94)90950-4. [DOI] [PubMed] [Google Scholar]
- Kita H. Globus pallidus external segment. Prog Brain Res. 2007;160:111–133. doi: 10.1016/S0079-6123(06)60007-1. [DOI] [PubMed] [Google Scholar]
- Kita H, Kitai ST. Intracellular study of rat globus-pallidus neurons—membrane properties and responses to neostriatal, subthalamic and nigral stimulation. Brain Res. 1991;564:296–305. doi: 10.1016/0006-8993(91)91466-E. [DOI] [PubMed] [Google Scholar]
- Kita H, Kitai ST. The morphology of globus-pallidus projection neurons in the rat—an intracellular staining study. Brain Res. 1994;636:308–319. doi: 10.1016/0006-8993(94)91030-8. [DOI] [PubMed] [Google Scholar]
- Kita H, Tokuno H, Nambu A. Monkey globus pallidus external segment neurons projecting to the neostriatum. Neuroreport. 1999;10:1467–1472. doi: 10.1097/00001756-199905140-00014. [DOI] [PubMed] [Google Scholar]
- Krauss JK, Pohle T, Weigel R, Burgunder JM. Deep brain stimulation of the centre median-parafascicular complex in patients with movement disorders. J Neurol Neurosurg Psychiatry. 2002;72:546–548. doi: 10.1136/jnnp.72.4.546. [DOI] [PMC free article] [PubMed] [Google Scholar]
- Kravitz AV, Freeze BS, Parker PR, Kay K, Thwin MT, Deisseroth K, Kreitzer AC. Regulation of parkinsonian motor behaviours by optogenetic control of basal ganglia circuitry. Nature. 2010;466:622–626. doi: 10.1038/nature09159. [DOI] [PMC free article] [PubMed] [Google Scholar]
- Kreitzer AC, Malenka RC. Striatal plasticity and basal ganglia circuit function. Neuron. 2008;60:543–554. doi: 10.1016/j.neuron.2008.11.005. [DOI] [PMC free article] [PubMed] [Google Scholar]
- Lavoie B, Smith Y, Parent A. Dopaminergic innervation of the basal ganglia in the squirrel monkey as revealed by tyrosine hydroxylase immunohistochemistry. J Comp Neurol. 1989;289:36–52. doi: 10.1002/cne.902890104. [DOI] [PubMed] [Google Scholar]
- Levy R, Hutchison WD, Lozano AM, Dostrovsky JO. Synchronized neuronal discharge in the basal ganglia of parkinsonian patients is limited to oscillatory activity. J Neurosci. 2002;22:2855–2861. doi: 10.1523/JNEUROSCI.22-07-02855.2002. [DOI] [PMC free article] [PubMed] [Google Scholar]
- Lozano AM, Lang AE, Levy R, Hutchison W, Dostrovsky J. Neuronal recordings in Parkinson's disease patients with dyskinesias induced by apomorphine. Ann Neurol. 2000;47:S141–S146. [PubMed] [Google Scholar]
- Madisen L, Zwingman TA, Sunkin SM, Oh SW, Zariwala HA, Gu H, Ng LL, Palmiter RD, Hawrylycz MJ, Jones AR, Lein ES, Zeng H. A robust and high-throughput Cre reporting and characterization system for the whole mouse brain. Nat Neurosci. 2010;13:133–140. doi: 10.1038/nn.2467. [DOI] [PMC free article] [PubMed] [Google Scholar]
- Magill PJ, Bolam JP, Bevan MD. Dopamine regulates the impact of the cerebral cortex on the subthalamic nucleus-globus pallidus network. Neuroscience. 2001;106:313–330. doi: 10.1016/S0306-4522(01)00281-0. [DOI] [PubMed] [Google Scholar]
- Mallet N, Pogosyan A, Márton LF, Bolam JP, Brown P, Magill PJ. Parkinsonian beta oscillations in the external globus pallidus and their relationship with subthalamic nucleus activity. J Neurosci. 2008;28:14245–14258. doi: 10.1523/JNEUROSCI.4199-08.2008. [DOI] [PMC free article] [PubMed] [Google Scholar]
- Mallet N, Micklem BR, Henny P, Brown MT, Williams C, Bolam JP, Nakamura KC, Magill PJ. Dichotomous organization of the external globus pallidus. Neuron. 2012;74:1075–1086. doi: 10.1016/j.neuron.2012.04.027. [DOI] [PMC free article] [PubMed] [Google Scholar]
- Marin O, Anderson SA, Rubenstein JL. Origin and molecular specification of striatal interneurons. J Neurosci. 2000;20:6063–6076. doi: 10.1523/JNEUROSCI.20-16-06063.2000. [DOI] [PMC free article] [PubMed] [Google Scholar]
- Matsumoto N, Minamimoto T, Graybiel AM, Kimura M. Neurons in the thalamic CM-Pf complex supply striatal neurons with information about behaviorally significant sensory events. J Neurophysiol. 2001;85:960–976. doi: 10.1152/jn.2001.85.2.960. [DOI] [PubMed] [Google Scholar]
- Matsumura M, Tremblay L, Richard H, Filion M. Activity of pallidal neurons in the monkey during dyskinesia induced by injection of bicuculline in the external pallidum. Neuroscience. 1995;65:59–70. doi: 10.1016/0306-4522(94)00484-M. [DOI] [PubMed] [Google Scholar]
- Mercer JN, Chan CS, Tkatch T, Held J, Surmeier DJ. Nav1.6 sodium channels are critical to pacemaking and fast spiking in globus pallidus neurons. J Neurosci. 2007;27:13552–13566. doi: 10.1523/JNEUROSCI.3430-07.2007. [DOI] [PMC free article] [PubMed] [Google Scholar]
- Minamimoto T, Kimura M. Participation of the thalamic CM-Pf complex in attentional orienting. J Neurophysiol. 2002;87:3090–3101. doi: 10.1152/jn.2002.87.6.3090. [DOI] [PubMed] [Google Scholar]
- Nambu A, Llinaś R. Electrophysiology of globus pallidus neurons in vitro. J Neurophysiol. 1994;72:1127–1139. doi: 10.1152/jn.1994.72.3.1127. [DOI] [PubMed] [Google Scholar]
- Nini A, Feingold A, Slovin H, Bergman H. Neurons in the globus pallidus do not show correlated activity in the normal monkey, but phase-locked oscillations appear in the MPTP model of parkinsonism. J Neurophysiol. 1995;74:1800–1805. doi: 10.1152/jn.1995.74.4.1800. [DOI] [PubMed] [Google Scholar]
- Nóbrega-Pereira S, Gelman D, Bartolini G, Pla R, Pierani A, Marín O. Origin and molecular specification of globus pallidus neurons. J Neurosci. 2010;30:2824–2834. doi: 10.1523/JNEUROSCI.4023-09.2010. [DOI] [PMC free article] [PubMed] [Google Scholar]
- Obeso JA, Rodríguez-Oroz MC, Benitez-Temino B, Blesa FJ, Guridi J, Marin C, Rodriguez M. Functional organization of the basal ganglia: therapeutic implications for Parkinson's disease. Mov Disord. 2008;23(Suppl 3):S548–S559. doi: 10.1002/mds.22062. [DOI] [PubMed] [Google Scholar]
- O'Doherty J, Dayan P, Schultz J, Deichmann R, Friston K, Dolan RJ. Dissociable roles of ventral and dorsal striatum in instrumental conditioning. Science. 2004;304:452–454. doi: 10.1126/science.1094285. [DOI] [PubMed] [Google Scholar]
- Ohara PT. Synaptic organization of the thalamic reticular nucleus. J Electron Microsc Tech. 1988;10:283–292. doi: 10.1002/jemt.1060100306. [DOI] [PubMed] [Google Scholar]
- Opalinska JB, Kalota A, Gifford LK, Lu P, Jen KY, Pradeepkumar PI, Barman J, Kim TK, Swider CR, Chattopadhyaya J, Gewirtz AM. Oxetane modified, conformationally constrained, antisense oligodeoxyribonucleotides function efficiently as gene silencing molecules. Nucleic Acids Res. 2004;32:5791–5799. doi: 10.1093/nar/gkh893. [DOI] [PMC free article] [PubMed] [Google Scholar]
- Packard MG, Knowlton BJ. Learning and memory functions of the basal ganglia. Annu Rev Neurosci. 2002;25:563–593. doi: 10.1146/annurev.neuro.25.112701.142937. [DOI] [PubMed] [Google Scholar]
- Paladini CA, Celada P, Tepper JM. Striatal, pallidal, and pars reticulata evoked inhibition of nigrostriatal dopaminergic neurons is mediated by GABA(A) receptors in vivo. Neuroscience. 1999;89:799–812. doi: 10.1016/S0306-4522(98)00355-8. [DOI] [PubMed] [Google Scholar]
- Parent A, Hazrati LN. Functional-anatomy of the basal ganglia. 2. The place of subthalamic nucleus and external pallidum in basal ganglia circuitry. Brain Res Rev. 1995;20:128–154. doi: 10.1016/0165-0173(94)00008-D. [DOI] [PubMed] [Google Scholar]
- Parent A, Smith Y. Differential dopaminergic innervation of the two pallidal segments in the squirrel monkey (Saimiri sciureus) Brain Res. 1987;426:397–400. doi: 10.1016/0006-8993(87)90896-1. [DOI] [PubMed] [Google Scholar]
- Parent A, Mackey A, De Bellefeuille L. The subcortical afferents to caudate nucleus and putamen in primate: a fluorescence retrograde double labeling study. Neuroscience. 1983;10:1137–1150. doi: 10.1016/0306-4522(83)90104-5. [DOI] [PubMed] [Google Scholar]
- Paxinos G. The mouse brain in stereotaxic coordinates. San Diego: Academic; 2004. [Google Scholar]
- Pinault D, Deschênes M. Projection and innervation patterns of individual thalamic reticular axons in the thalamus of the adult rat: a three-dimensional, graphic, and morphometric analysis. J Comp Neurol. 1998;391:180–203. doi: 10.1002/(SICI)1096-9861(19980209)391:2<180::AID-CNE3>3.0.CO%3B2-Z. [DOI] [PubMed] [Google Scholar]
- Plenz D, Kital ST. A basal ganglia pacemaker formed by the subthalamic nucleus and external globus pallidus. Nature. 1999;400:677–682. doi: 10.1038/23281. [DOI] [PubMed] [Google Scholar]
- Pradeepkumar PI, Cheruku P, Plashkevych O, Acharya P, Gohil S, Chattopadhyaya J. Synthesis, physicochemical and biochemical studies of 1′,2′-oxetane constrained adenosine and guanosine modified oligonucleotides, and their comparison with those of the corresponding cytidine and thymidine analogues. J Am Chem Soc. 2004;126:11484–11499. doi: 10.1021/ja048417i. [DOI] [PubMed] [Google Scholar]
- Ragozzino ME, Ragozzino KE, Mizumori SJ, Kesner RP. Role of the dorsomedial striatum in behavioral flexibility for response and visual cue discrimination learning. Behav Neurosci. 2002;116:105–115. doi: 10.1037/0735-7044.116.1.105. [DOI] [PMC free article] [PubMed] [Google Scholar]
- Raz A, Vaadia E, Bergman H. Firing patterns and correlations of spontaneous discharge of pallidal neurons in the normal and the tremulous 1-methyl-4-phenyl-1,2,3,6-tetrahydropyridine vervet model of parkinsonism. J Neurosci. 2000;20:8559–8571. doi: 10.1523/JNEUROSCI.20-22-08559.2000. [DOI] [PMC free article] [PubMed] [Google Scholar]
- Robledo P, Féger J. Excitatory influence of rat subthalamic nucleus to substantia-nigra pars reticulata and the pallidal complex: electrophysiological data. Brain Res. 1990;518:47–54. doi: 10.1016/0006-8993(90)90952-8. [DOI] [PubMed] [Google Scholar]
- Rommelfanger KS, Wichmann T. Extrastriatal dopaminergic circuits of the basal ganglia. Front Neuroanat. 2010;4:139. doi: 10.3389/fnana.2010.00139. [DOI] [PMC free article] [PubMed] [Google Scholar]
- Samantaray S, Sharma R, Chattopadhyaya TK, Gupta SD, Ralhan R. Increased expression of MMP-2 and MMP-9 in esophageal squamous cell carcinoma. J Cancer Res Clin Oncol. 2004;130:37–44. doi: 10.1007/s00432-003-0500-4. [DOI] [PMC free article] [PubMed] [Google Scholar]
- Sato F, Lavallée P, Lévesque M, Parent A. Single-axon tracing study of neurons of the external segment of the globus pallidus in primate. J Comp Neurol. 2000;417:17–31. doi: 10.1002/(SICI)1096-9861(20000131)417:13.0.CO%3B2-I. [DOI] [PubMed] [Google Scholar]
- Schultheiss NW, Edgerton JR, Jaeger D. Phase response curve analysis of a full morphological globus pallidus neuron model reveals distinct perisomatic and dendritic modes of synaptic integration. J Neurosci. 2010;30:2767–2782. doi: 10.1523/JNEUROSCI.3959-09.2010. [DOI] [PMC free article] [PubMed] [Google Scholar]
- Smith Y, Bolam JP. Neurons of the substantia nigra reticulata receive a dense GABA-containing input from the globus pallidus in the rat. Brain Res. 1989;493:160–167. doi: 10.1016/0006-8993(89)91011-1. [DOI] [PubMed] [Google Scholar]
- Smith Y, Shink E, Sidibé M. Neuronal circuitry and synaptic connectivity of the basal ganglia. Neurosurg Clin N Am. 1998a;9:203–222. [PubMed] [Google Scholar]
- Smith Y, Bevan MD, Shink E, Bolam JP. Microcircuitry of the direct and indirect pathways of the basal ganglia. Neuroscience. 1998b;86:353–387. doi: 10.1016/S0306-4522(98)00004-9. [DOI] [PubMed] [Google Scholar]
- Smith Y, Raju DV, Pare JF, Sidibe M. The thalamostriatal system: a highly specific network of the basal ganglia circuitry. Trends Neurosci. 2004;27:520–527. doi: 10.1016/j.tins.2004.07.004. [DOI] [PubMed] [Google Scholar]
- Smith Y, Surmeier DJ, Redgrave P, Kimura M. Thalamic contributions to basal ganglia-related behavioral switching and reinforcement. J Neurosci. 2011;31:16102–16106. doi: 10.1523/JNEUROSCI.4634-11.2011. [DOI] [PMC free article] [PubMed] [Google Scholar]
- Stefani A, Peppe A, Pierantozzi M, Galati S, Moschella V, Stanzione P, Mazzone P. Multi-target strategy for Parkinsonian patients: the role of deep brain stimulation in the centromedian-parafascicularis complex. Brain Res Bull. 2009;78:113–118. doi: 10.1016/j.brainresbull.2008.08.007. [DOI] [PubMed] [Google Scholar]
- Surmeier DJ, Carrillo-Reid L, Bargas J. Dopaminergic modulation of striatal neurons, circuits, and assemblies. Neuroscience. 2011;198:3–18. doi: 10.1016/j.neuroscience.2011.08.051. [DOI] [PMC free article] [PubMed] [Google Scholar]
- Terman D, Rubin JE, Yew AC, Wilson CJ. Activity patterns in a model for the subthalamopallidal network of the basal ganglia. J Neurosci. 2002;22:2963–2976. doi: 10.1523/JNEUROSCI.22-07-02963.2002. [DOI] [PMC free article] [PubMed] [Google Scholar]
- Vitek JL, Bakay RA, Hashimoto T, Kaneoke Y, Mewes K, Zhang JY, Rye D, Starr P, Baron M, Turner R, DeLong MR. Microelectrode-guided pallidotomy: technical approach and its application in medically intractable Parkinson's disease. J Neurosurg. 1998;88:1027–1043. doi: 10.3171/jns.1998.88.6.1027. [DOI] [PubMed] [Google Scholar]
- Vitek JL, Hashimoto T, Peoples J, DeLong MR, Bakay RA. Acute stimulation in the external segment of the globus pallidus improves parkinsonian motor signs. Mov Disord. 2004;19:907–915. doi: 10.1002/mds.20137. [DOI] [PubMed] [Google Scholar]
- Vitek JL, Zhang J, Hashimoto T, Russo GS, Baker KB. External pallidal stimulation improves parkinsonian motor signs and modulates neuronal activity throughout the basal ganglia thalamic network. Exp Neurol. 2012;233:581–586. doi: 10.1016/j.expneurol.2011.09.031. [DOI] [PMC free article] [PubMed] [Google Scholar]
- Wichmann T, Bergman H, DeLong MR. The primate subthalamic nucleus. III. Changes in motor behavior and neuronal activity in the internal pallidum induced by subthalamic inactivation in the MPTP model of parkinsonism. J Neurophysiol. 1994;72:521–530. doi: 10.1152/jn.1994.72.2.521. [DOI] [PubMed] [Google Scholar]
- Wilson CJ. What controls the timing of striatal spiny cell action potentials in the up state? Adv Biobehav Biol. 2009;58:49–61. doi: 10.1007/978-1-4419-0340-2_4. [DOI] [Google Scholar]
- Yelnik J, Damier P, Bejjani BP, Francois C, Gervais D, Dormont D, Arnulf I, M Bonnet A, Cornu P, Pidoux B, Agid Y. Functional mapping of the human globus pallidus: contrasting effect of stimulation in the internal and external pallidum in Parkinson's disease. Neuroscience. 2000;101:77–87. doi: 10.1016/S0306-4522(00)00364-X. [DOI] [PubMed] [Google Scholar]
- Yin HH, Ostlund SB, Knowlton BJ, Balleine BW. The role of the dorsomedial striatum in instrumental conditioning. Eur J Neurosci. 2005;22:513–523. doi: 10.1111/j.1460-9568.2005.04218.x. [DOI] [PubMed] [Google Scholar]