Abstract
Examination of spontaneous muscle activity is an important part of the routine electromyogram (EMG) in assessing neuromuscular diseases. The EMG is specifically valuable as a diagnostic test in supporting the diagnosis of amyotrophic lateral sclerosis (ALS). High density surface EMG (HDS EMG) is a relatively new technique that has until now been utilized in research, but has the potential for clinical application. This study presents a simple HDS EMG method for automatic detection of spontaneous action potentials from surface electrode array recordings of ALS patients. To reduce computational complexity while maintaining useful information from the electrode array recording, the multi-channel HDS EMG was transferred to single dimensional data by calculating the maximum difference across all channels of the electrode array. A spike detection threshold was then set in the single dimensional domain to identify the firing times of each spontaneous action potential spike while a spike extraction threshold was used to define the onset and offset of the spontaneous spikes. This data was used to extract the spontaneous spike waveforms from the electrode array EMG. A database of detected spontaneous spikes was thus obtained, including their waveforms, on all channels along with their corresponding firing times. This newly developed method makes use of the information from different channels of the electrode array EMG recording. It also has the primary feature of being simple and fast in implementation, with convenient parameter adjustment and user-computer interaction. Hence it has good possibilities for clinical application.
INTRODUCTION
Diffuse, abundant spontaneous muscle activity may be a typical electrophysiological feature in many neuromuscular diseases. Various spontaneous electromyogram (EMG) signals collectively are the electrophysiological manifestation of widespread degeneration of the bulbar and spinal motoneurons (Brooks, 1994). This examination of spontaneous muscle activity is an important part of the routine EMG, particularly in supporting the diagnosis of amyotrophic lateral sclerosis (ALS). The electrophysiological diagnosis of ALS includes the detection of positive sharp waves or fibrillation potentials concomitant with reinnervation changes in the motor unit action potentials (MUAPs) in three of four regions (bulbar, cervical, thoracic and lumbosacral) (Brooks, 1994). The presence of spontaneous EMG may portend lower motoneuron dysfunction prior to clinical symptoms such as weakness or muscle atrophy, possibly even before the onset of definite reinnervation changes in the MUAPs (de Carvalho and Swash 1998; Rosenfeld 2000; Barkhaus and Nandedkar 2005). Thus, enhanced detection of spontaneous EMG may be of great importance for early diagnosis of ALS. ALS is almost inevitably fatal in 3–5 years. With the introduction of potential new therapies (Swash, 2000), early diagnosis of ALS has become an extremely important issue in optimizing management..
The intramuscular needle electrode is routinely used for detection of spontaneous muscle activity. It is generally accepted that the spontaneous activity of single muscle fibers such as fibrillation potentials or positive sharp waves can only be detected by such electrodes. Conversely, other spontaneous motor unit activity that may represent the collective activity of many muscle fibers (e.g. fasciculation potentials) can be recorded by both concentric needle electrodes as well as regular surface electrodes. While fibrillation potentials are considered to be the most important feature of active denervation such as seen in ALS, recent discussion has revisited the potential application of fasciculation potentials to enhance the diagnostic sensitivity of ALS (de Carvalho 2000; de Carvalho et al. 2008; Benatar and Tandan, 2011; Noto et al. 2012).
In recent years, high density surface EMG (HDS EMG) techniques have been developed using electrode arrays comprised of a number of closely spaced, miniscule recording probes or bars (Zwarts and Stegeman 2003; Merletti et al. 2003; Rau et al. 2004; Lapatki et al, 2004; Pozzo et al. 2004; Merletti et al. 2009;). These electrode arrays cover a relatively large area of a muscle. Their noninvasive nature allows long recording times. The latter is required for a quantitative evaluation of the discharge patterns of spontaneous motor unit action potentials, which may vary from a few milliseconds to more than a minute (Howard and Murray, 1992). Because of the added value of the spatial information, such electrode arrays can facilitate further discrimination between spontaneous action potentials (Drost et al. 2007). These discharge patterns have been used to assess their different origins (Kleine et al. 2008; Kleine et al 2012). Although it has great potential to offer additional investigative and diagnostic information, HDS EMG has not been used as a clinical tool for evaluation of neuromuscular diseases (Drost et al., 2006). If new criteria are to be considered in using fasciculation potentials to facilitate earlier diagnosis of ALS (de Carvalho et al. 2008; Benatar and Tandan, 2011), it would be helpful to develop a clinically applicable method to optimize their detection. This work presents a simplified method to automatically detect action potential spikes from HDS EMG recordings in ALS patients, which is suitable for clinical assessment of fasciculation potentials. Our intent was not to develop complicated signal processing technique to discriminate between different spontaneous spikes. Our goal was to develop a clinically applicable method characterized by quick and convenient implementation for detecting the occurrence of spontaneous spikes, regardless of their motor unit origins (similar to the strategy used in routine needle EMG examination). Development of such methods will promote clinical integration of HDS EMG in the evaluation of neuromuscular diseases.
METHODS
A. Testing Signals
The testing data used in this study were recordings from 6 subjects with “Definite ALS” or “Probable ALS with Laboratory Support” based on El Escorial criteria from the third author’s institution. These patients had already been studied by conventional clinical EMG as part of their clinical evaluation (Brooks 1994). All subjects gave written, informed consent prior to participation in this study. This study was approved by the local Human Studies Committee.
Data collection protocol followed a spontaneous muscle activity paradigm. No disturbing sensory stimuli were allowed in the examination room. Each subject was positioned comfortably supine on an examination table with a pillow under their head. The tested arm was placed in its natural, resting position. The biceps brachii (BB) muscle was recorded with the elbow partially flexed and forearm in semi-pronation. A 20-channel linear bar electrode array (Figure 1), designed and fabricated in our laboratory, was used for all recordings. The distance between two consecutive recording bars is 5 mm, and each bar is 1 mm in width and 10 mm in length, arranged in a linear configuration. After placement of the linear electrode array from proximal to distal tendon junctions of the BB muscle, the subjects were asked to completely relax. Surface EMG signals were recorded for at least 10 minutes in a relaxed condition. The surface electrode array signals were amplified by the Refa EMG Recording System (TMS International BV, Enschede, The Netherlands) in a monopolar configuration, with a reference electrode located on the olecranon (each channel also has a common feedback subtraction of the average of all the recording channels). The surface EMG signals were sampled at 2k Hz per channel, with a band pass filter setting of 20–500 Hz.
Figure 1.
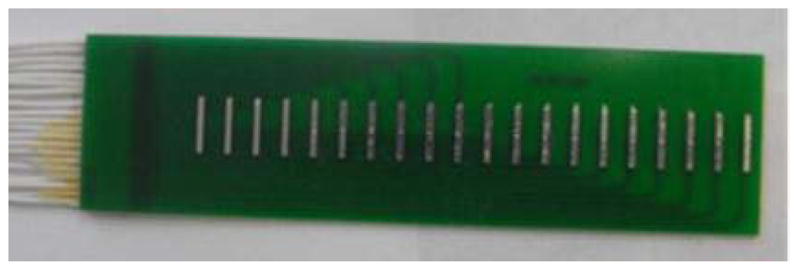
The linear electrode array used in this study.
B. Spontaneous Spike Detection
For an electrode array, a single channel EMG data is represented by a row vector dj=(x[1], x[2],…,x[Ns]), where j is the channel index and Ns is the total number of samples. The whole data set from the electrode array recording, represented as D●, is a matrix of Nch rows and Ns columns, where Nch is the number of electrode channels (Nch=20 in this study). A spontaneous spike can be represented by a matrix of Nch rows and M columns, where M is the duration of the spike. Six steps are involved in the spike detection algorithm from an electrode array.
Step 1: Select appropriate channels
One challenge with electrode array recording is to ensure the signal quality for all the channels (especially for electrode arrays comprised of a number of tiny recording probes). The minute skin-electrode contact area induces high skin-electrode impedance which is a major reason for high recording noise. Despite careful skin preparation, situations are sometimes encountered where the signal-to-noise ratio is poor in several channels of an electrode array. Thus in the first step, we reviewed all of the recording channels: those channels having poor recording quality were excluded from further analysis. If all the channels have good signal quality, this step is unnecessary (this is usually the case for most of the liner bar electrode array recordings).
Step 2: Signal segmentation
Due to the lengthy recording period of the linear electrode array used in this study, it is not feasible to analyze the entire recording time or epoch. Thus, the signal was sequentially segmented into 100 s segments from beginning to end, with each segment being processed separately.
Step 3: Creating a one-dimensional signal
To facilitate convenient and fast spontaneous spike detection in the electrode array EMG recordings, a single dimensional signal, oneV, was constructed using signals from all the channels:
More specific,
Thus, the amplitude of oneV[i] at each time equals the maximum difference across all channels of the array.
To reduce the high frequencies that induce error in the spike detection algorithm, a Hanning window was used to smooth the oneV signal, resulting in soneV:
where n is the Hanning window size, which is user-adjustable depending on the raw EMG signal. Increasing n will result in more smoothed signal while concomitantly reducing the detection sensitivity. In this study, n was set to 20 ms as a compromise.
Step 4: Spontaneous spike detection
This step is to determine whether or not a spontaneous spike has occurred. A spike detection threshold was applied to the soneV signal, and any activity above this threshold indicates that a spontaneous spike occurred. The spike detection threshold was set as r × max(soneV), where 0 < r < 1. r was set to be 0.2 in most cases of this study. A plot is provided in our program for a user to review the total soneV, as well as the preset threshold. This plot is a visual aid to the user to select the most appropriate level for spike detection threshold. In addition, the soneV signal can be plotted together, corresponding to all the available segments. The output of this step is the occurrence times of the peaks of the detected spontaneous spikes.
Step 5: Onset and offset detection of spontaneous spikes
This step extracts the beginning and end points of the detected spontaneous spikes in the previous step. To determine how long the data should be extracted for an individual spike, another threshold was set to determine the onset and offset of the spike. This threshold is called spike extraction threshold. In contrast to spike detection threshold, the spike extraction threshold is not fixed. In this study, the spike extraction threshold was set as 20% of the maximum peak amplitude of each detected spontaneous spike. The cross points of this threshold with the soneV signal determine the onset and offset of the detected spike. If the spike extraction threshold is lower than the baseline of the soneV signal (which may be the case for low amplitude spikes), the minima of the soneV signal is used to determine the onset (the first minima in the left lobe of the soneV signal) and the offset (the first minima in the right lobe of the soneV signal) of the spontaneous spike. The minima can be determined by the first zero crossing of the first order differentiation of the soneV signal.
Step6: Exaction of spontaneous spikes and database construction
The temporal information obtained in step 4 and step 5 is used to extract multi-channel waveforms from the electrode array EMG recordings. This is the last step of our spike detection algorithm. The final output is a database of individual detected spontaneous spikes, as well as the temporal information for each spike. It is noted that although each spike has its own duration, they are all stored with the same length, padded with zero when necessary.
RESULTS
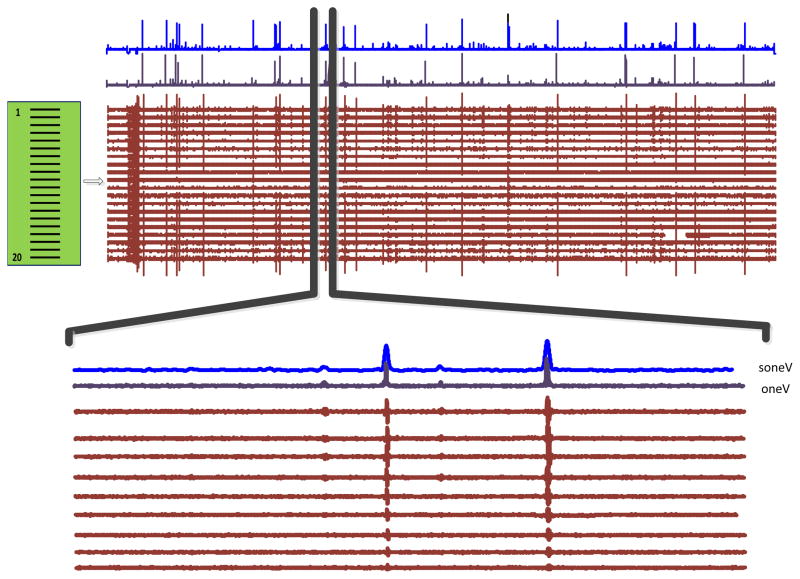
Figure 2 shows an example of an overall view of a 100 s spontaneous HDS EMG signal recorded from the BB muscle of an ALS subject, together with the converted one-dimensional signal, oneV, and its smoothed version, soneV. The bottom of the figure shows an enlarged version of a selected segment (only the first 11 channels are presented), in which four spontaneous spikes with different amplitude and duration are observed.
Figure 2.
An overview of 100 s spontaneous surface EMG signals recorded with the linear electrode array, and the oneV and soneV signals. An enlarged version of a selected signal segment is also shown (with only 11 channels), in which 4 fasciculation potentials are detected.
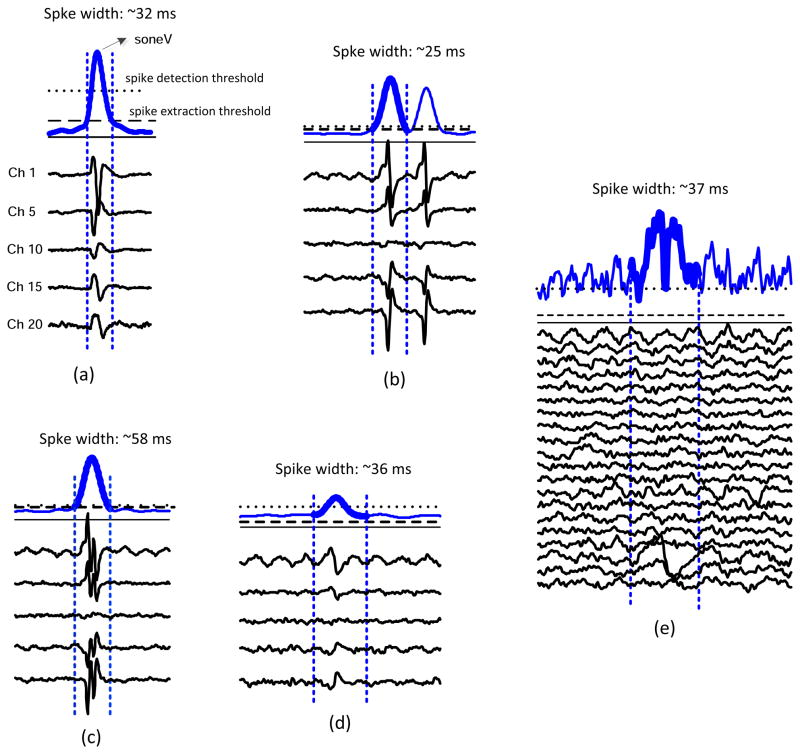
Figure 3 demonstrates examples of spontaneous spike detection in different situations using our simplified method. Figure 3a shows the most typical case of the spike detection, where the segment of soneV signal is plotted with the spike detection threshold. The spike detection and extraction thresholds are marked as dotted and dashed horizontal lines, respectively. The onset and offset of the detected spikes are shown by the two vertical dashed lines. Beneath the soneV signal, the corresponding EMG data of selected channels are plotted. The duration of the detected spike is recorded on the top of the soneV signal.
Figure 3.
Demonstration of different situations of spontaneous spike detection.
(a) the most typical case; (b) detection of two close spontaneous spikes; (c) detection of a complex spontaneous spike; (d) detection of a low amplitude spontaneous spike; (e) a false detection from the soneV signal which can be corrected by examining the raw signals of all the channels.
Figure 3b shows a similar example of two close spontaneous spikes, which can be detected from the soneV signal. Figure 3c shows an example of detection of a complex spontaneous spike. Figure 3d demonstrates that when the signal to noise ratio of the signal is low, the soneV can detect low amplitude spontaneous spikes (most likely originated from motor units deeper within the muscle). In this example, comparing the peak amplitude of the spike with the spike detection threshold indicates that the detected spike has low amplitude. In addition, the spike extraction threshold, calculated as 20% of the maximum spike amplitude, is even lower than the soneV signal baseline. Thus, the first minima in the left and right lobes of the soneV signal were used to determine the onset and offset of the spike.
Figure 3e shows a false spike detection due to artifact that appeared on a specific channel of the electrode array (channel 18 in this example). Such false detection can be easily excluded by examining the soneV signal, together with the EMG signals on all the channels of the array: this is a function provided by our program.
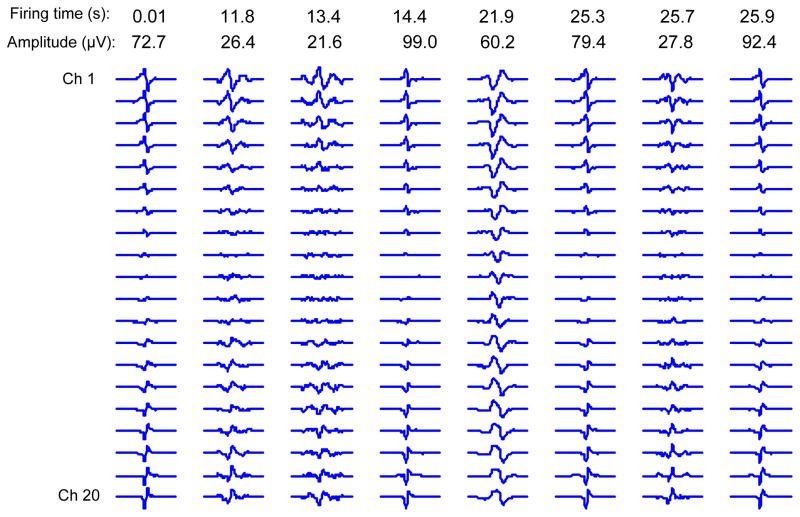
Figure 4 shows an example of the final spontaneous spike database. Nine spikes out of more than 300 spontaneous spikes are present. In this figure each spontaneous spike is plotted in its own scale because of the large range in amplitude variation. Plotting all of the spontaneous spikes using the same scale would not lead to a comprehensive plot. It is worth noting the polarity changes across the channels, due to the common feedback in the recording system montage.
Figure 4.
Examples of the detected spontaneous spikes from the BB muscle of an ALS subject using the linear electrode array. The occurrence time and the maximum peak to peak amplitude are indicated on the top of each spike.
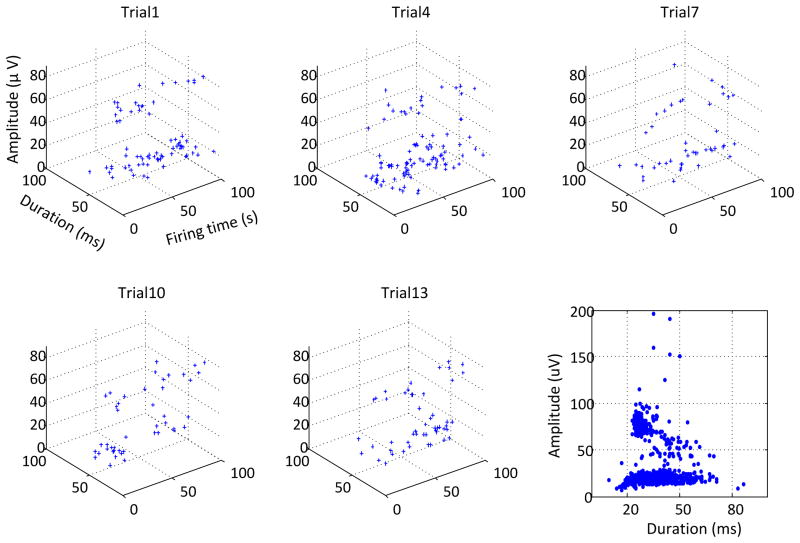
In general, we observed that the detected spontaneous spikes from ALS subjects have a wide range of amplitude and duration. Figure 5 shows an example of the spontaneous spike detection from several 100 s segments selected from a long recording of 1500 s. For each segment, the firing time, amplitude and duration of the detected spontaneous spikes are described in the 3-dimensional plots. A total of 263spontaneous spikes were detected from the entire length of the recording, and their amplitude and duration distribution is presented in the right bottom panel of the figure. It is noted that the detected spikes may include slow and random fasciculation potentials, as well as some tonic spontaneous spikes with regular firing patterns.
Figure 5.
A demonstration of the firing time, duration and amplitude of the detected spontaneous spikes in several 100 s signal segments selected from a 1500 s recording. The bottom right panel shows the amplitude and duration of all the spikes from the entire recording.
DISCUSSION
Since 1957, EMG examination has been routinely used as the primary electrodiagnostic and confirmatory tool for identifying ALS (Lambert and Mulder, 1957). Concentric needle EMG has been applied systematically and prospectively in diagnosing and evaluating ALS. HDS EMG has been emerging as a promising tool to offer additional investigative and diagnostic information (e.g., muscle fiber conduction velocity, motor unit territory, innervation zone localization) in the evaluation of neuromuscular disorders (Masuda and Sadoyama 1987; Sun et al 1999; Zwarts and Stegeman 2003; Merletti et al. 2003; Rau et al. 2004; Merletti et al. 2008). To date it has seen relatively limited use as a clinical tool (Drost et al., 2006).
One major reason may be the complexity of the multiple channel processing imposed by the electrode montage. HDS EMG recording produces a large data set, causing inconvenience in data analysis in terms of memory space and time efficiency, thus constraining its clinical application even when recording from relaxed muscles. Although amplitude threshold based algorithms are often used for spike detection, application of such methods to HDS EMG is inconvenient. For example, thresholding using a specific channel of the array would have missed the spontaneous action potentials on other channels. Because of action potential propagation, the temporal information obtained in a specific channel may not be applicable to other channels. An alternative way is to apply thresholding to all the channels and assign those potentials with close timings to be of the same origin. For a HDS EMG recording this method is not efficient as one would need to repeat the detection process for all the channels.
To promote clinical application of HDS EMG, this study presents a convenient and fast approach for automatic detection and analysis of spontaneous action potential spikes from electrode array recordings in ALS patients. The primary feature of the study was to handle HDS EMG recordings in a simplified manner while preserving the advantage of multiple channel recordings. This was accomplished by transferring the multi-channel data matrix to single dimensional data via calculating the maximum differences across channels of the electrode array. For a differential recording which usually demonstrates polarity changes among the electrodes (as demonstrated in our data because of the common feedback subtraction of the average of all the recording channels), this can emphasize the occurrence of spontaneous spikes. The temporal difference due to action potential propagation along muscle fibers can also be reflected in the constructed one dimensional signal. By this means, our method takes advantage of the electrode array while avoiding computational burden and complexity imposed by multi-channel recordings. From the one-dimensional data, a spike detection threshold can be set to identify firing times of each spontaneous spike while a spike extraction threshold can be used to define the onset and offset of the spikes. Such information is sufficient to extract the spontaneous spike waveforms from HDS EMG.
To facilitate clinical application, our program also provides convenient user-computer interaction. For example, at the signal preprocessing stage, a user is able to review the overall EMG segment, and exclude any segments with voluntary EMG activity or severe noise contamination. A user can set different threshold levels, according to the specific spike amplitude level of interest. At each step of the spike detection process, the program also provides plots allowing the user to view the results. At the end of spike detection from the last segment of a trial, the plot of final residual signal is provided by setting the detected spikes to zero. Before storing the spikes in the final database, a user can review the soneV signal together with the raw EMG signals on different channels to ascertain that the spontaneous spikes consistently occur on these channels rather than on a specific channel (as typically in the case of artifacts).
The output of our algorithm is a database of extracted multi-channel spikes along with their firing times. In parallel to the needle EMG examination, our algorithm detects the occurrence of spontaneous action potential spikes regardless of their motor unit origins since these would have the same diagnostic significance. The goal in this project was not to develop novel or advanced methods for classifying spontaneous spike waveforms. Instead, we wanted to develop a clinically applicable method to apply HDS EMG. Such a method would promote the clinical utility of HDS EMG. Although classification of action potentials or separation of superimposed waveforms is beyond the scope of this work, the database obtained from this study could be used as the first step for such a purpose. The developed spike detection method can also be applied to voluntary EMG to acquire candidate MUAPs for signal decomposition. The data presented in this study are from spontaneous muscle recordings from ALS subjects. Nevertheless, the spike detection algorithm can also be applied to examine spontaneous EMG activity from other patient populations (such as hemiparetic stroke or spinal cord injury).
Finally, although this study used a long recording time to test our method, such a long recording time is usually not required in routine clinical application. With clear conventional evidence of denervation (i.e., fibrillation potentials) in a muscle, detection of a small number of fasciculation potentials may be sufficient to further support the possibility of ALS. Conversely, when clinical and conventional EMG abnormality is limited, a longer duration recording time may be necessary. Thus, the recording time for detecting fasciculation potentials depends on the context of the clinical situation (Mills 2011; Zhou et al. 2012).
Acknowledgments
This study was supported by the National Institute on Disability and Rehabilitation Research (NIDRR) of the U.S. Department of Education (H133G090093), and the National Institutes of Health (2R24HD050821).
References
- Barkhaus PE, Nandedkar SD. Quan D, Lorenzo NY, Lutsep HL, editors. EMG Evaluation of the Motor Unit: “The Electrophysiologic Biopsy”. eMedicine Journal (Neurology) 2005 [serial online]. Available http://www.emedicine.com/neuro/topic610.htm.
- Benatar M, Tandan R. The Awaji criteria for the diagnosis of amyotrophic lateral sclerosis: have we put the cart before the horse? Muscle Nerve. 2011;43:461–3. doi: 10.1002/mus.21942. [DOI] [PubMed] [Google Scholar]
- Brooks BR, Miller RG, Swash M, et al. for the World Federation of Neurology Group on Motor Neuron Diseases. El Escorial revisited: Revised criteria for the diagnosis of amyotrophic lateral sclerosis. Amyotroph Lateral Scler Other Motor Neuron Disord. 2000;1:293–9. doi: 10.1080/146608200300079536. [DOI] [PubMed] [Google Scholar]
- de Carvalho M. Pathophysiological significance of fasciculations in the early diagnosis of ALS. Amyotroph Lateral Scler Other Motor Neuron Disord Suppl. 2000;1:S43–6. doi: 10.1080/14660820050515539. [DOI] [PubMed] [Google Scholar]
- de Carvalho M, Dengler R, Eisen A, England JD, Kaji R, Kimura J, Mills K, Mitsumoto H, Nodera H, Shefner J, Swash M. Electrodiagnostic criteria for diagnosis of ALS. Clin Neurophysiol. 2008;119(3):497–503. doi: 10.1016/j.clinph.2007.09.143. [DOI] [PubMed] [Google Scholar]
- de Carvalho M, Swash M. Fasciculation potentials: a study of amyotrophic lateral sclerosis and other neurogenic disorders. Muscle Nerve. 1998;21(3):336–44. doi: 10.1002/(sici)1097-4598(199803)21:3<336::aid-mus7>3.0.co;2-b. [DOI] [PubMed] [Google Scholar]
- Drost G, Kleine BU, Stegeman DF, van Engelen BG, Zwarts MJ. Fasciculation potentials in high-density surface EMG. J Clin Neurophysiol. 2007;24(3):301–7. doi: 10.1097/WNP.0b013e31803bba04. [DOI] [PubMed] [Google Scholar]
- Drost G, Stegeman DF, van Engelen BG, Zwarts MJ. Clinical applications of high-density surface EMG: a systematic review. J Electromyogr Kinesiol. 2006;16(6):586–602. doi: 10.1016/j.jelekin.2006.09.005. [DOI] [PubMed] [Google Scholar]
- Howard RS, Murray NM. Surface EMG in the recording of fasciculations. Muscle Nerve. 1992;15:1240–5. doi: 10.1002/mus.880151104. [DOI] [PubMed] [Google Scholar]
- Kleine BU, Stegeman DF, Schelhaas HJ, Zwarts MJ. Firing pattern of fasciculations in ALS: evidence for axonal and neuronal origin. Neurology. 2008;70(5):353–9. doi: 10.1212/01.wnl.0000300559.14806.2a. [DOI] [PubMed] [Google Scholar]
- Kleine BU, Boekestein WA, Arts IM, Zwarts MJ, Schelhaas HJ, Stegeman DF. Fasciculations and their F-response revisited: high-density surface EMG in ALS and benign fasciculations. Clin Neurophysiol. 2012;123(2):399–405. doi: 10.1016/j.clinph.2011.06.032. [DOI] [PubMed] [Google Scholar]
- Lambert EH, Mulder DW. Electromyographic studies in amyotrophic lateral sclerosis. Proc Staff Meet Mayo Clin. 1957;32(17):441–6. [PubMed] [Google Scholar]
- Lapatki BG, van Dijk JP, Jonas IE, Zwarts MJ, Stegeman DF. A thin, flexible multielectrode grid for high-density surface EMG. J Appl Physiol. 2004;96:327–36. doi: 10.1152/japplphysiol.00521.2003. [DOI] [PubMed] [Google Scholar]
- Masuda T, Sadoyama T. Skeletal muscles from which the propagation of motor unit action potentials is detectable with a surface electrode array. Electroencephalogr Clin Neurophysiol. 1987;67:421–7. doi: 10.1016/0013-4694(87)90005-8. [DOI] [PubMed] [Google Scholar]
- Merletti R, Botter A, Troiano A, Merlo E, Minetto MA. Technology and instrumentation for detection and conditioning of the surface electromyographic signal: State of the art. J Clin Biomech. 2009;24:122–34. doi: 10.1016/j.clinbiomech.2008.08.006. [DOI] [PubMed] [Google Scholar]
- Merletti R, Farina D, Gazzoni M. The linear electrode array: a useful tool with many applications. J Electromyogr Kinesiol. 2003;13(1):37–47. doi: 10.1016/s1050-6411(02)00082-2. [DOI] [PubMed] [Google Scholar]
- Merletti R, Holobar A, Farina D. Analysis of motor units with high-density surface electromyography. J Electromyogr Kinesiol. 2008;18(6):879–90. doi: 10.1016/j.jelekin.2008.09.002. [DOI] [PubMed] [Google Scholar]
- Mills KR. Detecting fasciculations in amyotrophic lateral sclerosis: duration of observation required. J Neurol Neurosurg Psychiatry. 2011;82(5):549–51. doi: 10.1136/jnnp.2009.186833. [DOI] [PubMed] [Google Scholar]
- Noto YI, Misawa S, Kanai K, Shibuya K, Isose S, Nasu S, Sekiguchi Y, Fujimaki Y, Nakagawa M, Kuwabara S. Awaji ALS criteria increase the diagnostic sensitivity in patients with bulbar onset. Clin Neurophysiol. 2012;123(2):382–5. doi: 10.1016/j.clinph.2011.05.030. [DOI] [PubMed] [Google Scholar]
- Pozzo M, Bottin A, Ferrabone R, Merletti R. Sixty-four channel wearable acquisition system for long-term surface electromyogram recording with electrode arrays. Med Biol Eng Comput. 2004;42:455–66. doi: 10.1007/BF02350986. [DOI] [PubMed] [Google Scholar]
- Rau G, Schulte E, Disselhorst-Klug C. From cell to movement: to what answers does EMG really contribute? J Electromyogr Kinesiol. 2004;14:611–7. doi: 10.1016/j.jelekin.2004.02.001. [DOI] [PubMed] [Google Scholar]
- Rosenfeld J. Fasciculations without fibrillations: the dilemma of early diagnosis. Amyotroph Lateral Scler Other Motor Neuron Disord Suppl. 2000;1:S53–6. doi: 10.1080/14660820052415916. [DOI] [PubMed] [Google Scholar]
- Swash M. Shortening the time to diagnosis in ALS: the role of electrodiagnostic studies. ALS and Other Motor Neuron Disorders. 2000;(Suppl 1):S67–72. [PubMed] [Google Scholar]
- Sun TY, Lin TS, Chen JJ. Multielectrode surface EMG for noninvasive estimation of motor unit size. Muscle Nerve. 1999;22:1063–70. doi: 10.1002/(sici)1097-4598(199908)22:8<1063::aid-mus9>3.0.co;2-r. [DOI] [PubMed] [Google Scholar]
- Zhou P, Li X, Jahanmiri-Nezhad F, Rymer WZ, Barkhaus PE. Duration of observation required in detecting fasciculation potentials in amyotrophic lateral sclerosis using high-density surface EMG. J Neuroeng Rehabil. 2012;9:78. doi: 10.1186/1743-0003-9-78. [DOI] [PMC free article] [PubMed] [Google Scholar]
- Zwarts MJ, Stegeman DF. Multichannel surface EMG: basic aspects and clinical utility. Muscle Nerve. 2003;28:1–17. doi: 10.1002/mus.10358. [DOI] [PubMed] [Google Scholar]


