Abstract
Background
Previous studies did not draw a consistent conclusion about the effects of marine-derived n-3 polyunsaturated fatty acids (PUFAs) on fasting blood level of C-reactive protein (CRP), interleukin 6 (IL-6) and tumor necrosis factor α (TNF-α).
Methods and Findings
A comprehensive search of Web of Science, PubMed, Embase and Medline (from 1950 to 2013) and bibliographies of relevant articles was undertaken. Sixty-eight RCTs with a total of 4601 subjects were included in the meta-analysis. Marine-derived n-3 PUFAs supplementation showed a lowering effect on Marine-derived n-3 PUFAs supplementation had a significant lowering effect on TNF-α, IL-6 and CRP in three groups of subjects (subjects with chronic non-autoimmune disease, subjects with chronic autoimmune disease and healthy subjects). A significant negative linear relationship between duration and effect size of marine-derived n-3 PUFAs supplementation on fasting blood levels of TNF-α and IL-6 in subjects with chronic non-autoimmune disease was observed, indicating that longer duration of supplementation could lead to a greater lowering effect. A similar linear relationship was also observed for IL-6 levels in healthy subjects. Restricted cubic spline analysis and subgroup analysis showed that the lowering effect of marine-derived n-3 PUFAs on CRP, IL-6 and TNF-α in subjects with chronic non-autoimmune disease became weakened when body mass index was greater than 30 kg/m2. The effect of marine-derived n-3 PUFAs from dietary intake was only assessed in subjects with chronic non-autoimmune disease, and a significant lowering effect was observed on IL-6, but not on CRP and TNF-α.
Conclusions
Marine-derived n-3 PUFAs supplementation had a significant lowering effect on CRP, IL-6 and TNF-α level. The lowering effect was most effective in non-obese subjects and consecutive long-term supplementation was recommended.
Introduction
Previous studies have shown that inflammation plays an important role in numerous chronic diseases, such as cardiovascular disease (CVD), diabetes, obesity-related diseases, and auto-immune diseases (e.g., rheumatoid arthritis) [1]–[4]. The process involves increased production of inflammatory factors, such as C-reactive protein (CRP), tumor necrosis factor α (TNF-α) and interleukin 6 (IL-6). CRP is an acute phase reactant protein that could increase 100 fold within 24 to 48 hours during an inflammatory process, and is synthesized and secreted mainly by hepatocytes [5]. Elevated CRP is an independent risk factor for CVD and diabetes [6], [7]. Previous studies have also shown a significant association between CRP and obesity [8], [9]. IL-6 and TNF-α are two cytokines involved in both acute and chronic inflammatory response, and one of their most important functions is the induction of acute phase reactant protein [10]. Strong evidence has also been provided for the association of IL-6 and TNF-α with obesity, CVD and diabetes [11]–[15].
Intake of n-3 polyunsaturated fatty acids (PUFAs) has been shown to have numerous beneficial effects on CVD, diabetes, and obesity-related diseases [16]–[18]. The protective effect of n-3 PUFAs against these diseases may be attributed to its anti-inflammatory function [19], [20]. However, some other studies found that n-3 PUFAs supplementation had no significant influence on the levels of inflammatory factors [21], [22]. The lack of consistency of results among different studies leads to a poor understanding of the association between n-3 PUFAs and inflammation. Two previous studies viewed the effect of marine-derived n-3 PUFAs on inflammatory makers, but no firm conclusion was drawn due to the contradiction of results from different studies [23], [24]. One previous meta-analysis assessed the effect of fish oil consumption on circulation levels of inflammatory markers, and found a significant lowering effect on CRP and IL-6 [25] in subjects with chronic heart failure. However, the subjects with other chronic diseases and healthy subjects were not included in this study, and the effect of marine-derived n-3 PUFAs from dietary intake was also not assessed. Therefore, we conducted a meta-analysis to systematically review the effect of marine-derived n-3 PUFAs from different sources (supplementation or dietary intake) on fasting blood levels of TNF-α, IL-6 and CRP in three groups of subjects (healthy subjects, subjects with chronic non-autoimmune disease or subjects with chronic autoimmune disease), and to obtain a pooled estimate of effect size.
Methods
The protocol of the study was shown in Checklist S1.
Data Sources and Study Selection
We searched Web of Science, Pubmed, Embase and Medline for the terms n-3 polyunsaturated fatty acid, omega-3 polyunsaturated fatty acid, ω-3 fatty acid, omega-3 fatty acid, polyunsaturated fatty acid, eicosapentaenoic acid (EPA), docosahexaenoic acid (DHA), or fish oil, combined with interleukin 6, interleukin, tumor necrosis factor, tumor necrosis factor alpha, TNF-α, cytokine, C-reactive protein, CRP, or inflammation. The search was restricted to studies published in any language from 1950 to 2013. For inclusion, studies had to fulfill the following criteria: had a randomized placebo controlled design; reported data on fasting blood levels of TNF-α, IL-6, or CRP; had a drop-out rate less than 30% [26]; recruited subjects with chronic disease (chronic autoimmune or non-autoimmune disease) or healthy subjects. Studies were excluded if subjects were diagnosed with acute disease; allocation of participants to the treatments was not randomized; data indispensable for a meta-analysis were not reported and still unavailable after contacting authors; studies reported a crossover design but not reported a wash-out period; the effect of n-3 PUFAs could not be separated from other active ingredients; studies did not have a placebo control group. Hand-searching of the bibliographic sections of all relevant articles and recent reviews was undertaken.
Data Extraction and Quality Assessment
Study selection and data extraction were undertaken independently by two investigators, with discrepancies resolved by consensus. The data collected included the first author’s name, year of publication, sample size, age, BMI sex ratio (male/total subjects) and healthy status of subjects, intervention methods, study design (parallel-group, crossover or factorial), daily dose of n-3 PUFAs, duration of follow-up, data of fasting blood level of TNF-α, IL-6 and CRP, baseline levels of CRP, IL-6 and TNF-α, and mean changes of phospholipid n-3 PUFAs in plasma/serum.
Cochrane criteria was used to assess the quality of studies included in the present meta-analysis, including sequence generation, allocation concealment, blinding of participants, personnel and outcome assessors, incomplete outcome data and selective outcome reporting [27].
Statistical Methods
Our study included studies in subjects with chronic disease and studies in healthy subjects. Considering the difference of pathogenesis between chronic autoimmune disease, which is an inappropriate immune response against substances and tissues normally present in the body, and other chronic disease (we called them chronic non-autoimmune diseases), two independent meta-analyses were conducted for the two types of chronic disease, respectively. Another independent meta-analysis was conducted for healthy subjects. We also separated studies using n-3 PUFAs from supplementation (seafood oils or highly purified n-3 PUFAs) as active treatment with those using n-3 PUFAs from dietary intake (fish intake), and included them into different meta-analyses.
As suggested in the Cochrane handbook for Systematic Reviews of Interventions [27], meta-analysis method is based on the assumption that data are normally distributed. However, many included studies showed that the data for CRP, IL-6 and TNF-α were skewed (expressed as data in log-transformed scale, geometric mean ± standard deviation (SD) or median (range or interquartile range)), and some studies expressed data as mean ± SD without reporting a test for distribution or even when data are skewed. Therefore, to eliminate potential bias induced by skewness of data, we transformed data of all studies into log (e)-transformed scale and then conducted data analysis [28]. If studies reported results as mean ± SD, the method reported by Higgins et al. [27], [29] was used to calculate the mean and SD of log-transformed data. If studies reported results as median and range, we firstly calculated the median and range for log-transformed data by taking the logarithms of median, upper and lower bounds of range for data on raw scale, and then calculated the mean and SD of log-transformed data using the method reported by Hozo et al. [30]. If studies reported result as median (interquartile range), we firstly calculated the median and interquartile range for log-transformed data by taking the logarithms of median, upper and lower bounds of interquartile range for data on raw scale; considering log-transformation can always substantially reduce skew [27], we used the median of log-transformed data to estimate its mean, and used interquratile range of log-transformed data divided by 1.35 to estimate its SD as suggested by Cochrane handbook for Systematic Reviews of Interventions [27].
For studies with a parallel-group or factorial design, mean changes and corresponding SDs from baseline to endpoint were used in data analysis. If SDs of changes were not reported, they were imputed based on SDs at baseline and endpoint by the method in a previous study [31]. For studies with a crossover design, mean difference between the levels of CRP, IL-6 or TNF-α at the end of two intervention periods was used in data analysis, as suggested by Cochrane handbook for Systematic Reviews of Interventions [27]. If a study involved two or more independent comparisons concerning the association between n-3 PUFAs and inflammatory markers (TNF-α, IL-6, or CRP), these comparisons were included in our meta-analysis as if they were from different studies [27]. For studies with two or more intervention groups sharing one control group, we separated the shared control group into two or more groups (the number was the same as intervention groups) and included these comparisons into meta-analysis as if they were from different studies [27]. If studies with a crossover design have two or more intervention periods (or placebo periods), only data of one intervention period (or placebo period) was included in analysis to eliminate unit-of-analysis error [27], but sensitivity analysis was conducted by replacing data from one intervention period (or placebo period) with another.
All data analyses were conducted in Stata/SE 11.0 software (StataCorp, College Station, TX). Weighted mean difference (WMD) was considered as the effect size. A random-effect model was used to pool study-specific effect sizes, and a P value <0.05 was considered to be statistically significant. Percentages of changes in geometric means of CRP, IL-6 and TNF-α from baseline to endpoint were also calculated based on WMDs using the following methods: estimating the ratio of geometric mean at endpoint to that at baseline based on WMD according to one study by Higgins et al. [29]; subtracting 1 from the ratio and multiplying the difference by 100%. Heterogeneity was assessed using the chi-square method. I2>50% indicated significant heterogeneity [32]. Subgroup analysis was undertaken to explore the sources of heterogeneity and their influence on effect size according to the difference in study design, placebo, duration, daily dose of n-3 PUFAs, and age, sex ratio (male/total subjects), baseline and body mass index (BMI) of subjects; the cut-off points for duration, daily dose,baseline and age were their medians; 0.5 was used as the cut-off point for sex ratio; 30 kg/m2 were used as the cut-off points for BMI. For meta-analysis in subjects with chronic diseases, subgroup analysis was also conducted according to difference in types of diseases. Meta-regression was conducted to explore whether subgroup difference was significant, and whether there was significant linear relationship (P for coefficient <0.05) between effect size and continuous confounding variables (duration, daily dose, age, sex ratio and BMI); the adjusted R2 indicated the percentage of between-study heterogeneity that could be explained by the confounding variables. If two or more confounding factors showed significant influence on the effect size (P for subgroup difference or coefficient <0.05), a joint test was conducted to explain heterogeneity caused by these confounding factors by including them into a single meta-regression model simultaneously [33]; the adjusted R2 of the overall model indicated the percentage of between-study heterogeneity that could be explained by these confounding factors [33]. If no significant linear relationship was observed between effect size and continuous confounding variables, restricted cubic spline analysis was used to test potential cubic relationship between them (3 knots) [34]. We also conducted sensitivity analysis to assessing the effect of bias on the pooled effect size by excluding studies having a high risk of bias for two or more validity criteria and then reanalyzing the remaining data. Publication bias was evaluated by funnel plot method. If significant publication bias was observed, trim-and-fill method was used to adjust the pooled effect size.
Results
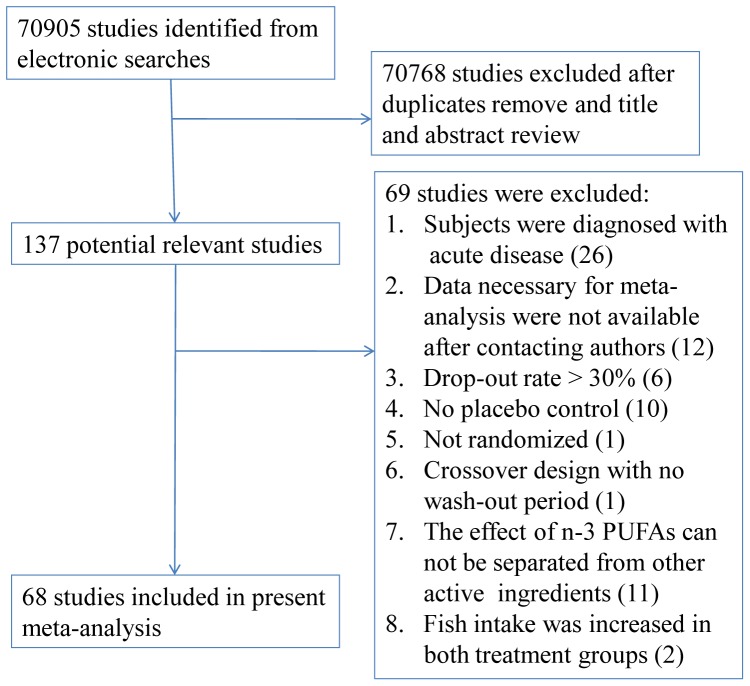
Figure 1 showed the process by which the included studies were identified. The electronic searches identified 70905 studies, of which 68 studies in 4601 subjects were included in our present study [19]–[22], [35]–[98].
Figure 1. Flow chart for identifying eligible studies.
Characteristics of Included Studies
Characteristics of included studies are shown in Table 1 and Table S1. 48 studies including 61 independent comparisons involved patients with chronic non-autoimmune disease as subjects [19]–[21], [35]–[39], [42]–[44], [46]–[48], [50], [52], [53], [56], [58]–[63], [65], [67], [68], [70]–[78], [80], [83], [84], [86], [88], [89], [92], [94]–[98], 2 studies including 2 independent comparisons involved patients with chronic auto-immune disease as subjects [57], [93], and 17 studies including 22 independent comparisons involved healthy people as subjects [22], [40], [41], [49], [51], [54], [55], [64], [66], [69], [79], [81], [82], [85], [87], [90], [91]. In addition, one study including one independent comparison recruited both subjects with chronic non-autoimmune disease and subjects with chronic autoimmune disease [45]. Of the 48 studies in subjects with chronic non-autoimmune disease [19]–[21], [35]–[39], [42]–[44], [46]–[48], [50], [52], [53], [56], [58]–[63], [65], [67], [68], [70]–[78], [80], [83], [84], [86], [88], [89], [92], [94]–[98], 44 studies including 52 independent comparisons used n-3 PUFAs supplementation (seafood oil or highly purified n-3 PUFAs) as active treatment [19]–[21], [35]–[39], [42]–[44], [46]–[48], [50], [52], [53], [56], [58]–[63], [65], [67], [68], [70]–[78], [80], [83], [84], [86], [88], [89], [92], [97], and 5 studies including 11 independent comparisons used n-3 PUFAs from dietary intake (fish intake) as active treatment [94]–[98]. Studies in subjects with chronic auto-immune disease and in healthy subjects all used n-3 PUFAs supplementation as active treatment.
Table 1. Characteristics of included studies.
| Study | T | C | Biomarkers | Duration | Design | EPA(g) | DHA (g) | Total n-3 (g) | No. of subjects | Age (yr) | Sex ratio (male/total) | BMI (kg/m2) | Disease |
| Barbosa et al.2003 [35] | Fish oil | Soy oil | CRP | 2 mon | CO | 2.7 | 1.8 | 4.5 | 9 | 40 | 0.22 | UN | Ulcerative colitis |
| Bent et al.2011 [36] | Pudding fortified by fish oil | Pudding enriched in saff/ower oil | IL-6, TNF-α | 12wk | P | 0.7 | 0.46 | 1.3 | 25 | 70 | 0.89 | UN | Autism spectrum disorder |
| Bowden et al.2009 [19] | Fish oil | Corn oil | CRP | 6 mon | P | 0.96 | 0.6 | 1.56 | 33 | 60.4 | 0.58 | UN | End-stage renal disease |
| Bragt et al.2012 [37] | Fish oil | Cellulose and high-oleic sunflower oil | CRP, IL-6, TNF-α | 6 wk | CO | 1.7 | 1.2 | 3.7 | 10 | 52 | 0.5 | 33 | Overweight and obesity |
| Browning et al.2007 A [38] | Fish oil | Oil rich in LA and oleic acid (2∶1) | CRP, IL-6 | 12 wk | CO | 1.3 | 2.9 | 4.2 | 12 | UN | 0 | 32.8 | Overweight |
| Browning et al.2007 B [38] | Fish oil | Oil rich in LA and oleic acid (2∶1) | CRP, IL-6 | 12 wk | CO | 1.3 | 2.9 | 4.2 | 17 | UN | 0 | 28.7 | Overweight |
| Chan et al.2002 [39] | Fish oil | Corn oil | CRP, IL-6, TNF-α | 6 wk | P | 1.8 | 1.56 | 3.36 | 24 | 53.5 | 1 | 33.6 | Visceral obesity |
| Chiang et al.2012 [94] | Fatty fish diet | Control diet | CRP, IL-6, TNF-α | 4 wk | CO | 0.17 | 0.61 | 0.78 | 25 | 33 | 0.56 | 24.8 | Normal to hyperlipidem-ia |
| De Mello et al.2009 A [95] | Fatty fish | Lean meat or skinless chicken | CRP, IL-6, TNF-α | 8 wk | P | UN | UN | 0.89 | 13 | 61.9 | UN | 26.9 | Coronary heart disease |
| De Mello et al.2009 B [95] | Lean fish | Lean meat or skinless chicken | CRP, IL-6, TNF-α | 8 wk | P | UN | UN | 0.43 | 14 | 60.3 | UN | 27.5 | Coronary heart disease |
| Derosa et al.2009 [44] | Fish oil | Sucrose, mannitol, and mineral salts | CRP | 6 mon | P | 1.64 | 1.36 | 3 | 326 | 51 | 0.49 | 26.1 | Dyslipidemia |
| Derosa et al.2012 [43] | Fish oil | Sucrose, mannitol, and mineral salts | CRP, IL-6, TNF-α | 6 mon | P | 1.2 | 1.35 | 2.55 | 157 | 47 | 0.49 | 26.6 | Dyslipidemia |
| Engler et al.2004 [46] | Algal oil | Soy/corn oil | CRP | 6 wk | CO | NA | 1.2 | 1.2 | 20 | 14 | UN | 21 | Hyperlipide-mia |
| Faghihi et al.2012 [47] | Fish oil | Placebo | CRP | 6 wk | P | UN | UN | 0.6 | 41 | 33.92 | 0.76 | 24.7 | Psychiatric disease |
| Faxen Irving et al. 2009 [48] | Fish oil | Corn oil | CRP, IL-6 | 6 mon | P | 0.6 | 1.7 | 2.3 | 174 | 72.7 | 0.48 | 24.3 | Alzheimer’s disease |
| Freund-Levi et al.2009 [21] | Fish oil | Corn oil | CRP, IL-6, TNF-α | 6 mon | P | 0.6 | 1.72 | 2.32 | 35 | 70.3 | 0.6 | 24.8 | Alzheimer’s disease |
| Jones et al.2007 [52] | Fish oil | Sunflower oil (OA:LA = 1.1∶1) or olive oil | CRP, IL-6, TNF-α | 4 wk | CO | 1.7 | 3.7 | 5.4 | 21 | 54.19 | 0.46 | 25.93 | Hypercholest-erolemia |
| Gammelmark et al. 2012 [50] | Fish oil | Olive oil | CRP, IL-6, TNF-α | 6 wk | P | 0.64 | 0.48 | 1.12 | 50 | 56.7 | 0.48 | 30.2 | Overweight |
| Kabir et al.2007 [53] | Fish oil | Paraffin oil | IL-6, TNF-α | 2 mon | P | 1.08 | 0.72 | 1.8 | 26 | 55 | 0 | 30 | Type 2 diabetes |
| Koh et al.2012 [56] | Fish oil | Placebo | CRP | 2 mon | P | UN | UN | 2 | 99 | 54.5 | 0.58 | 25.3 | Hypertriglyc-eridemia |
| Kooshki et al.2011 [58] | Fish oil | Medium-chain triglyceride oils | CRP, IL-6, TNF-α | 10 wk | P | 1.24 | 0.84 | 2.08 | 34 | 50 | 0.62 | 19.8 | Hemodialysis |
| Krebs et al.2006 [59] | Fish oil | Oil rich in LA and OA (2∶1) | CRP, IL-6, TNF-α | 24 wk | P | 1.3 | 2.9 | 4.2 | 67 | 44.7 | 0 | 35 | Overweight |
| Krysiak et al.2011 a [60] | Fish oil | Placebo | CRP | 12 wk | P | 0.93 | 0.75 | 1.68 | 66 | 52.8 | 0.65 | 28.5 | Hypertriglyc-eridemia |
| Krysiak et al.2011 b [61] | Fish oil | Placebo | CRP | 90 d | P | 0.93 | 0.75 | 1.68 | 54 | 53 | 0.63 | 28.5 | Hypertriglyc-eridemia |
| Krysiak et al.2012 a [62] | Fish oil | Placebo | CRP | 90 d | P | 1.86 | 1.5 | 3.36 | 46 | 45 | UN | UN | Hypertriglyc-eridemia |
| Krysiak et al.2012 b [63] | Fish oil | Placebo | CRP | 12 wk | P | 1.86 | 1.5 | 3.36 | 53 | 55 | UN | UN | Hypertriglyc-eridemia |
| Lindqvist et al.2007 [96] | Herring | Pork/chicken | CRP | 4 wk | CO | UN | UN | 3.6 | 13 | 50.5 | UN | 32.6 | Overweight and obesity |
| Mackay et al.2012 A [65] | Fish oil | Palm and soybean oils (80∶20) | CRP, IL-6 | 6 wk | CO | UN | UN | 0.87 | 77 | 68.5 | 0.69 | UN | Peripheral arterial disease |
| Mackay et al.2012 B [65] | Fish oil | Palm and soybean oils (80∶20) | CRP, IL-6 | 6 wk | CO | UN | UN | 0.87 | 73 | 68.5 | 0.69 | UN | Peripheral arterial disease |
| Madsen et al.2007 A [67] | Fish oil | Olive oil | CRP | 8 wk | P | 1.2 | 0.84 | 2.4 | 23 | 59 | 0.65 | 28 | Chronic renal failure |
| Madsen et al.2007 B [67] | Fish oil | Olive oil | CRP | 8 wk | P | 1.2 | 0.84 | 2.4 | 23 | 59 | 0.65 | 28 | Chronic renal failure |
| Malekshahi et al. 2012 [68] | Fish oil | High-linoleic sunflower oil | CRP, TNF-α | 8 wk | P | 1.56 | 0.83 | 2.73 | 84 | 54.2 | 0.5 | 27.6 | Type 2 diabetes |
| Moertl et al.2011 A [71] | Fish oil | Gelatine | IL-6, TNF-α | 3 mon | P | 1.86 | 1.5 | 3.36 | 21 | 59.3 | 0.9 | 27.9 | Chronic heart failure |
| Moertl et al.2011 B [71] | Fish oil | Gelatine | IL-6, TNF-α | 3 mon | P | 0.465 | 0.375 | 0.84 | 22 | 57.3 | 0.82 | 27.4 | Chronic heart failure |
| Mohammadi et al. 2012 [72] | Fish oil | Liquid paraffin | CRP | 8 wk | P | 0.72 | 0.48 | 1.2 | 61 | 27.5 | UN | 28.8 | Polycystic ovary syndrome |
| Mori et al.2003 A [74] | DHA | Olive oil | CRP, IL-6, TNF-α | 6 wk | P | NA | 4 | 4 | 25 | 61.2 | 0.74 | 30.3 | Type 2 diabetes |
| Mori et al.2003 B [74] | EPA | Olive oil | CRP, IL-6, TNF-α | 6 wk | P | 4 | NA | 4 | 25 | 61.3 | 0.79 | 28.9 | Type 2 diabetes |
| Mori et al.2009 [73] | Fish oil | Olive oil | CRP | 8 wk | P | 1.84 | 1.52 | 3.51 | 35 | 55.6 | 0.57 | 27.1 | Chronic renal impairment |
| Munro et al.2012 [75] | Fish oil | Sunola oil | CRP, IL-6, TNF-α | 14 wk | P | 0.42 | 1.62 | 2.04 | 29 | 41.3 | UN | 32.8 | Obesity |
| Murphy et al.2007 [76] | Food enriched in fish oil | Non-fortified food | CRP | 6 mon | P | UN | UN | 1 | 74 | 50.3 | 0.48 | 31.9 | Overweight |
| Nodari et al.2009 [77] | Fish oil | Olive oil | IL-6, TNF-α | 6 mon | P | 0.54 | 0.9 | 1.44 | 44 | 63 | 0.91 | UN | Idiopathic dilated cardiomyopa-thy |
| Nodari et al.2011 [78] | Fish oil | Olive oil | IL-6, TNF-α | 12 mon | P | UN | UN | 1.95 | 133 | 62.5 | 0.9 | 25.8 | Chronic heart failure |
| Pooya et al.2010 [80] | Fish oil | High linoleic sunflower oil | CRP | 2 mon | P | 1.548 | 0.828 | 2.714 | 35 | 54.52 | UN | 26.89 | Type 2 diabetes |
| Ramel et al.2010 AF [97] | Salmon | High oleic-sunflower oil | CRP, IL-6 | 8 wk | P | UN | UN | 2.1 | 66 | 31.2 | 0 | 30.2 | Overweight |
| Ramel et al.2010 AM [97] | Salmon | High oleic-sunflower oil | CRP, IL-6 | 8 wk | P | UN | UN | 2.1 | 58 | 31.9 | 1 | 30.4 | Overweight |
| Ramel et al.2010 BF [97] | Cod | High oleic-sunflower oil | CRP, IL-6 | 8 wk | P | UN | UN | 0.3 | 69 | 30.9 | 0 | 30.2 | Overweight |
| Ramel et al.2010 BM [97] | Cod | High oleic-sunflower oil | CRP, IL-6 | 8 wk | P | UN | UN | 0.3 | 51 | 32.5 | 1 | 30.2 | Overweight |
| Ramel et al.2010 CF [97] | Fish oil | High oleic-sunflower oil | CRP, IL-6 | 8 wk | P | UN | UN | 1.3 | 99 | 31.3 | 0 | 30 | Overweight |
| Ramel et al.2010 CM [97] | Fish oil | High oleic-sunflower oil | CRP, IL-6 | 8 wk | P | UN | UN | 1.3 | 61 | 31.8 | 1 | 29.8 | Overweight |
| Sabour et al.2012 [83] | Fish oil | Placebo | IL-6, TNF-α | 4 mon | P | 0.07 | 0.44 | 0.51 | 75 | 39.3 | 0.83 | 19.7 | Spinal cord injury |
| Saifullah et al.2007 [84] | Fish oil | Soybean/corn oil | CRP | 8 wk | P | 0.68 | 0.34 | 1.02 | 23 | 57.7 | 0.78 | UN | Hemodialysis |
| Skulas-Ray et al. 2011 [86] | Fish oil | Corn oil | CRP, IL-6, TNF-α | 8 wk | CO | 2.04 | 1.36 | 3.4 | 26 | 44.3 | 0.88 | 29 | Moderate hypertriglyce-ridemia |
| Thusgaard et al. 2009 [88] | Fish oil | Corn oil | CRP | 12 wk | P | 1.84 | 1.52 | 3.36 | 48 | 45 | 0.78 | 24.7 | HIV infected |
| Tierney et al.2011 [89] | Fish oil | High oleic-sunflower oil | CRP, IL-6, TNF-α | 12 wk | P | UN | UN | 1.24 | 206 | 54.7 | UN | 32.5 | Metabolic syndrome |
| Wong et al.2010 [92] | Fish oil | Olive oil | CRP | 12 wk | P | 1.68 | 1 | 2.68 | 97 | 60.1 | 0.44 | 25.8 | Type 2 diabetes |
| Daud et al.2012 [42] | Fish oil | Olive oil | CRP | 6 mon | P | 1.8 | 0.6 | 2.4 | 55 | 58.5 | 0.51 | 27.6 | Hemodialysis |
| Zhang et al.2012 A [98] | Salmon | Pork/beef/chicken/fish | CRP, IL-6, TNF-α | 8 wk | P | 0.61 | 1.07 | 1.69 | 43 | 55.3 | 0 | 26.3 | Dyslipidaem-ia |
| Zhang et al.2012 B [98] | Herring | Pork/beef/chicken/fish | CRP, IL-6, TNF-α | 8 wk | P | 0.7 | 0.97 | 1.67 | 39 | 55.8 | 0 | 27.3 | Dyslipidaem-ia |
| Zhang et al.2012 C [98] | Pompano | Pork/beef/chicken/fish | CRP, IL-6, TNF-α | 8 wk | P | 0.14 | 0.94 | 1.07 | 44 | 56.5 | 0 | 26.5 | Dyslipidaem-ia |
| Zhao et al.2009 [20] | Fish oil | Placebo | CRP, IL-6, TNF-α | 3 mon | P | 0.36 | 0.24 | 0.6 | 75 | 72.5 | 0.73 | 24.4 | Chronic heart failure |
| Mocking et al.2012 [70] | EPA | Rapeseed oil and medium chain triglyceride | CRP, IL-6, TNF-α | 12 wk | P | 0.9 | 0 | 0.9 | 24 | 54 | 0.48 | UN | Diabetes mellitus and co-morbid depression |
| Deutsch et al.2007 [45] | Krill oil | Microcrystalli-ne cellulose | CRP | 30 d | P | 0.05 | 0.03 | 0.08 | 87 | 54.95 | 0.34 | UN | CVD or arthritis |
| Kolahi et al.2010 [57] | Fish oil | Placebo | CRP, TNF-α | 3 mon | P | 0.18 | 0.12 | 0.3 | 83 | 50 | 0 | 25.4 | Rheumatoid arthritis |
| Wright et al.2008 [93] | Fish oil | Olive oil | CRP | 24 wk | P | 1.8 | 1.2 | 3 | 60 | 48.1 | 0.07 | 25.6 | Systemic lupus erythematosus |
| Fujioka et al.2006 [49] | Drinks enriched in fish oil | Drinks enriched in olive oil | CRP | 12 wk | P | 0.6 | 0.26 | 0.86 | 141 | 37.9 | 0.42 | 22.1 | Healthy |
| Lenn et al.2002 [64] | Fish oil | Western fat blend and or wheat flour | IL-6, TNF-α | 30 d | P | UN | UN | 1.8 | 10 | 21.9 | 0.77 | 24 | Healthy |
| Madsen et al.2003 A [66] | Fish oil | Olive oil | CRP | 12 wk | P | 3 | 2.9 | 6.6 | 30 | 38.3 | 0.57 | 24.4 | Healthy |
| Madsen et al.2003 B [66] | Fish oil | Olive oil | CRP | 12 wk | P | 0.9 | 0.8 | 2 | 30 | 37.7 | 0.6 | 24.7 | Healthy |
| Mann et al.2010 A [69] | Fish oil | Sunola oil | CRP | 14 d | P | 0.21 | 0.81 | 1.05 | 14 | 29.7 | 0.44 | UN | Healthy |
| Mann et al.2010 B [69] | Seal oil | Sunola oil | CRP | 14 d | P | 0.34 | 0.45 | 1.02 | 13 | 30.5 | 0.22 | UN | Healthy |
| Ottestad et al.2012 [79] | Fish oil | High-oleic sunflower oil | CRP | 7 wk | P | 0.72 | 0.89 | 1.76 | 34 | 25 | 0.28 | 22.8 | Healthy |
| Pot et al.2009 [81] | Fish oil | High-oleic sunflower oil | IL-6, TNF-α | 12 wk | P | 0.7 | 0.56 | 1.52 | 77 | 58.7 | 0.51 | 26.5 | Healthy |
| Rizza et al.2009 [82] | Fish oil | Olive oil | CRP, IL-6, TNF-α | 12 wk | P | 1.09 | 0.91 | 2 | 50 | 31.1 | 0.5 | 26.2 | Healthy |
| Sanders et al.2006 [22] | Algal oil | Olive oil | CRP | 4 wk | P | 0 | 1.5 | 2.1 | 79 | 32.5 | 0.51 | 23.8 | Healthy |
| Shahbakhti et al. 2004 [85] | EPA | Oleic acid | IL-6, TNF-α | 3 mon | P | 4 | 0 | 4 | 14 | 47.5 | 0 | UN | Healthy |
| Theobald et al.2007 [87] | Algal oil | Olive oil | CRP, IL-6 | 3 mon | CO | 0 | 0.7 | 0.7 | 38 | 48.7 | 0.5 | 24 | Healthy |
| Vega-Lopez et al. 2004 [90] | Fish oil | Placebo | CRP | 12 wk | P | 0.6 | 0.9 | 1.5 | 40 | 31.5 | UN | 26.1 | Healthy |
| Watanabe et al.2009 [91] | Fish oil | Olive oil | CRP | 4 wk | CO | 1.26 | 0.54 | 1.8 | 17 | 50.1 | 1 | 24.3 | Healthy |
| Geelen et al.2004 [51] | Fish oil | High-oleic sunflower oil | CRP | 12 wk | P | 0.7 | 0.56 | 1.52 | 83 | 60 | 0.51 | UN | Healthy |
| Kiecolt-Glaser et al. 2012 A [55] | Fish oil | Mixture of palm, olive, soy, canola, and coco butter oils | IL-6, TNF-α | 4 mon | P | 2.09 | 0.35 | 2.5 | 69 | 51 | 0.32 | UN | Healthy |
| Kiecolt-Glaser et al. 2012 B [55] | Fish oil | Mixture of palm, olive, soy, canola, and coco butter oils | IL-6, TNF-α | 4 mon | P | 1.04 | 0.17 | 1.25 | 69 | 51.1 | 0.33 | UN | Healthy |
| Ciubotaru et al.2003 A [40] | Fish oil | Safflower oil | CRP, IL-6 | 5 wk | P | 1.18 | 1 | 2.33 | 11 | 60 | 0 | 25 | Healthy |
| Ciubotaru et al.2003 B [40] | Fish oil | Safflower oil | CRP, IL-6 | 5 wk | P | 0.59 | 0.5 | 1.22 | 15 | 60 | 0 | 17.1 | Healthy |
| Kiecolt-Glaser et al. 2011 [54] | Fish oil | Mixture of palm, olive, soy, canola, and coco butter oils | IL-6, TNF-α | 12 wk | P | 2.09 | 0.35 | 2.5 | 68 | 23.7 | 0.56 | UN | Healthy |
| Damsgaard et al. 2008 A [41] | Fish oil | Olive oil | CRP, IL-6 | 8 wk | F | 1.8 | 1.1 | 3.1 | 33 | 25.6 | 1 | 22.5 | Healthy |
| Damsgaard et al. 2008 B 28 [41] | Fish oil | Olive oil | CRP, IL-6 | 8 wk | F | 1.8 | 1.1 | 3.1 | 29 | 25.2 | 1 | 23.1 | Healthy |
T, intervention in treatment group; C, intervention in control group; P, parallel group design; CO, crossover design; F, factorial design; UN, unclear.
Studies marked with different capital letters were independent comparisons from the same study; studies marked with different minuscules were different studies with the same first author and published in the same year.
Quality Assessment
Incomplete outcome data (attrition bias) and blinding of participants and personnel (performance bias) were the major potential sources of bias (Figure S1). In many trails, it was unclear whether randomized sequence could be foreseen by participants and trialists (allocation concealment) and whether assessors were blinded to intervention assignment (detection bias) (Figure S1). Twenty-six studies have a risk of bias in one category [19], [20], [37], [38], [43], [44], [48], [52], [53], [56], [60], [61], [70], [73], [75], [79], [80], [83], [84], [86], [88], [89], [94], [96]–[98], and one study [95] has a risk of bias in two categories (Figure S2).
Effects of Marine-Derived N-3 PUFAs Supplementation on CRP, IL-6 and TNF-α in Subjects with Chronic Non-Autoimmune Disease
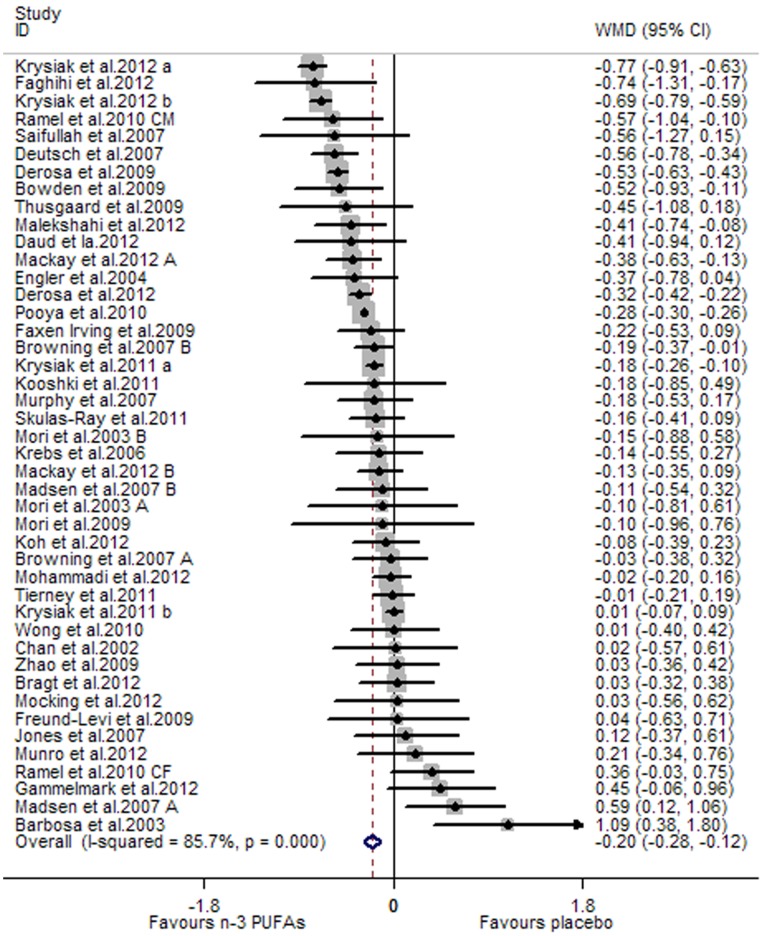
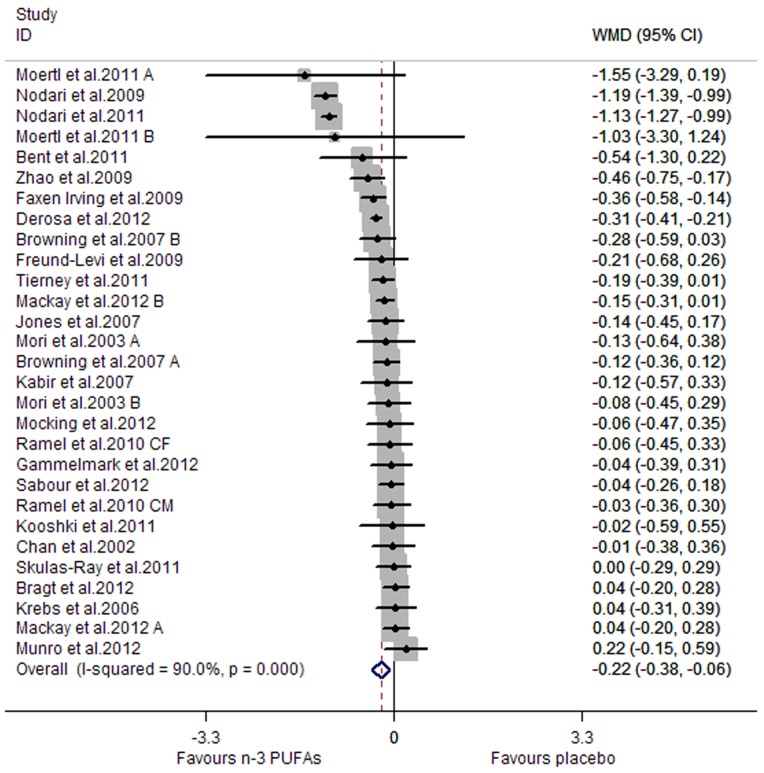
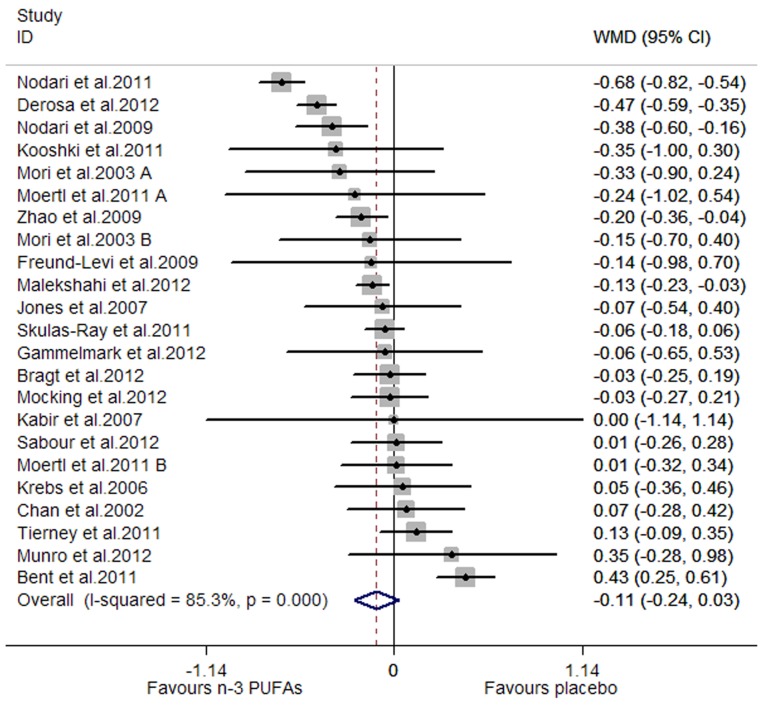
A significant lowering effect of marine-derived n-3 PUFA supplementation on CRP and IL-6 was observed: the pooled effect sizes were −0.20 (95% CI, −0.28 to −0.12; P = 0.000) (Figure 2) and −0.22 (95% CI, −0.38 to −0.06; P = 0.008) (Figure 3), respectively. The overall percentages of changes (in geometric mean) were −18.13% (95% CI, −24.42% to −11.31%) and −19.75% (95% CI, −31.61% to −5.82%), respectively. The pooled effect size for TNF-α was not significant (Figure 4). Significant heterogeneity was observed among the three groups of studies: the I2 values were 85.7%, 90.0% and 85.3%, respectively. One study assessing the effect on CRP recruited both subjects with chronic non-autoimmune disease and subjects with chronic autoimmune disease [45], and after excluding this study the result concerning CRP did not change significantly. One study assessing the effect on CRP, IL-6 and TNF-α used two kinds of placebo (sunflower oil and olive oil) [52], and when we replaced data from one kind of placebo with data from the other the result concerning the three inflammatory markers did not change significantly.
Figure 2. Pooled effect size of n-3 PUFAs supplementation on CRP in chronic non-autoimmune disease.
WMD, weighted mean difference.
Figure 3. Pooled effect size of n-3 PUFAs supplementation on IL-6 in chronic non-autoimmune disease.
WMD, weighted mean difference.
Figure 4. Pooled effect size of n-3 PUFAs supplementation on TNF-α in chronic non-autoimmune disease.
WMD, weighted mean difference.
Results of subgroup analysis were shown in Table 2. Fatty acid composition of placebo and BMI of subjects had a significant influence on the effect size on CRP: significant lowering effect on CRP was observed only when oils mainly comprised of linoleic acid (LA) were used as placebo or subjects had a BMI less than 30 kg/m2 (P for subgroup difference were 0.033 and 0.014, respectively); the overall percentages of changes (in geometric mean) in the two subgroups were −19.75% (95% CI, −28.11% to −10.42%) and −18.13% (95% CI −24.42% to −10.42%), respectively; joint test for the two covariates (as categorical variables) showed that their variation could help explain 45.37% heterogeneity. Duration, age and baseline level of IL-6 had a significant influence on the effect size on IL-6: significant lowering effect was observed only when studies had a longer duration (≥ median), or recruited older subjects (age ≥ median) (P for subgroup difference were 0.022 and 0.014, respectively), and the overall percentages of changes (in geometric mean) in the two subgroups were −30.23% (95% CI, −45.66% to −11.31%) and −33.63% (95% CI, −50.84% to −10.42%), respectively; the lowering effect on IL-6 was significantly greater in subjects with a higher baseline level (≥ median) than those with a lower one (< median) (P for subgroup difference was 0.049), and the overall percentages of changes (in geometric mean) in the two subgroups were −32.29% (95% CI, −50.34% to −6.76%) and −12.19% (95% CI, −20.55% to −1.98%), respectively; joint test for duration, age and baseline of IL-6 (as categorical variables) showed that their variation could help explain 46.56% heterogeneity. BMI of subjects had a significant influence on the effect size on TNF-α: significant lowering effect of marine-derived n-3 PUFAs on TNF-α was only observed in subjects with a BMI <30 kg/m2 (P value for subgroup difference was 0.049), and its variation (as categorical variable) could help explain 23.54% heterogeneity; the overall percentage of changes (in geometric mean) in this subgroup was −19.75% (95% CI, −31.61% to −5.82%).
Table 2. The effect of marine-derived n-3 PUFAs supplementation on CRP, IL-6 and TNF-α in subjects with chronic no-autoimmune disease (data were log-transformed before analysis).
| CRP | IL-6 | TNF-α | ||||||||||
| Subgroup analysis | N | WMD (95% CI) | I2 (%) | P | N | WMD (95% CI) | I2 (%) | P | N | WMD (95% CI) | I2 (%) | P |
| Overall | 44 | −0.20 (−0.28, −0.12) | 85.7 | 0.000 | 29 | −0.22 (−0.38, −0.06) | 90.0 | 0.008 | 23 | −0.11 (−0.24, 0.03) | 85.3 | 0.121 |
| Study design | ||||||||||||
| Parallel | 35 | −0.22 (−0.32, −0.13) | 87.6 | 0.000 | 22 | −0.27 (−0.47, −0.06) | 91.0 | 0.011 | 20 | −0.11 (−0.27, 0.04) | 86.7 | 0.156 |
| Crossover | 9 | −0.11 (−0.26, 0.05) | 57.8 | 0.190 | 7 | −0.09 (−0.18, 0.00) | 0.0 | 0.053 | 3 | −0.05 (−0.15, 0.05) | 0.0 | 0.295 |
| Major fatty acid in placebo | ||||||||||||
| Linoleic acid | 14 | −0.22 (−0.33, −0.11) | 44.9 | 0.000 | 8 | −0.17 (−0.29, −0.05) | 11.5 | 0.005 | 6 | 0.06 (−0.15, 0.26) | 83.7 | 0.599 |
| Oleic acid | 13 | 0.03 (−0.13, 0.20) | 43.2 | 0.704 | 10 | −0.27 (−0.65, 0.11) | 95.4 | 0.011 | 8 | −0.17 (−0.46, 0.12) | 87.5 | 0.243 |
| Others | 10 | −0.27 (−0.41, −0.12) | 77.9 | 0.000 | 9 | −0.16 (−0.29, −0.04) | 38.0 | 0.257 | 7 | −0.19 (−0.42, 0.05) | 65.2 | 0.122 |
| Not reported | 7 | −0.34 (−0.62, −0.06) | 96.7 | 0.017 | 2 | −0.24 (−0.65, 0.17) | 80.4 | 0.003 | 2 | −0.13 (−0.32, 0.07) | 41.0 | 0.207 |
| Healthy status of subjects# | ||||||||||||
| Presence or high risk of CVD | 31 | −0.22 (−0.30, −0.13) | 88.4 | 0.000 | 24 | −0.22 (−0.40, −0.03) | 91.5 | 0.021 | 19 | −0.15 (−0.28, −0.02) | 81.8 | 0.024 |
| Chronic renal disease | 7 | −0.17 (−0.50, 0.15) | 59.6 | 0.300 | 1 | −0.02 (−0.59, 0.55) | NA | 0.945 | 1 | −0.35 (−1.00, 0.30) | NA | 0.289 |
| Psychiatric disease | 4 | −0.24 (−0.54, 0.07) | 33.0 | 0.134 | 4 | −0.30 (−0.47, −0.12) | 0.0 | 0.001 | 3 | 0.15 (−0.24, 0.55) | 80.5 | 0.444 |
| Other chronic diseases | 3 | 0.17 (−0.51, 0.85) | 82.1 | 0.631 | 1 | −0.04 (−0.26, 0.18) | NA | 0.716 | 1 | 0.01 (−0.26, 0.28) | NA | 0.943 |
| Duration (week) | ||||||||||||
| < median | 17 | −0.16 (−0.27, −0.05) | 66.9 | 0.004 | 13 | −0.06 (−0.14, 0.02) | 0.0 | 0.154 | 10 | −0.09 (−0.16, −0.03) | 0.0 | 0.006 |
| ≥ median | 18 | −0.21 (−0.35, −0.07) | 91.1 | 0.004 | 16 | −0.36 (−0.61, −0.12) | 93.0 | 0.003 | 13 | −0.10 (−0.32, 0.12) | 91.2 | 0.356 |
| Daily dose of total n-3 PUFAs (g) | ||||||||||||
| < median | 23 | −0.16 (−0.25, −0.06) | 65.4 | 0.001 | 14 | −0.32 (−0.61, −0.03) | 94.1 | 0.033 | 11 | −0.06 (−0.31, 0.20) | 91.4 | 0.657 |
| ≥ median | 21 | −0.23 (−0.36, −0.11) | 88.6 | 0.000 | 15 | −0.13 (−0.24, −0.03) | 42.6 | 0.012 | 12 | −0.15 (−0.29, −0.01) | 67.8 | 0.032 |
| Daily dose of EPA (g) | ||||||||||||
| < median | 18 | −0.13 (−0.25, −0.01) | 74.9 | 0.029 | 11 | −0.30 (−0.61, 0.02) | 89.2 | 0.066 | 10 | −0.03 (−0.24, 0.18) | 79.3 | 0.769 |
| ≥ median | 18 | −0.25 (−0.39, −0.12) | 89.5 | 0.000 | 12 | −0.13 (−0.24, −0.02) | 36.8 | 0.022 | 11 | −0.14 (−0.28, 0.00) | 70.5 | 0.058 |
| Not reported | 8 | −0.17 (−0.36, 0.01) | 63.2 | 0.059 | 6 | −0.26 (−0.71, 0.19) | 96.5 | 0.259 | 2 | −0.28 (−1.07, 0.51) | 97.4 | 0.490 |
| Daily dose of DHA (g) | ||||||||||||
| < median | 18 | −0.16 (−0.27, −0.05) | 82.4 | 0.004 | 11 | −0.27 (−0.60, 0.07) | 89.9 | 0.116 | 10 | −0.02 (−0.19, 0.15) | 74.8 | 0.816 |
| ≥ median | 18 | −0.21 (−0.37, −0.06) | 85.7 | 0.006 | 12 | −0.16 (−0.28, −0.05) | 42.4 | 0.005 | 11 | −0.14 (−0.31, 0.02) | 73.4 | 0.094 |
| Not reported | 8 | −0.17 (−0.36, −0.01) | 63.2 | 0.059 | 6 | −0.26 (−0.71, 0.19) | 96.5 | 0.259 | 2 | −0.28 (−1.07, 0.51) | 97.4 | 0.490 |
| Mean age (year) | ||||||||||||
| < median | 21 | −0.17 (−0.31, −0.03) | 88.8 | 0.016 | 13 | −0.08 (−0.18, 0.02) | 43.8 | 0.123 | 11 | −0.09 (−0.23, 0.04) | 74.7 | 0.174 |
| ≥ median | 21 | −0.21 (−0.34, −0.08) | 82.5 | 0.001 | 14 | −0.41 (−0.71, −0.11) | 93.0 | 0.008 | 12 | −0.14 (−0.40, 0.13) | 90.0 | 0.315 |
| Not reported | 2 | −0.16 (−0.32, −0.00) | 0.0 | 0.050 | 2 | −0.18 (−0.37, 0.11) | 0.0 | 0.064 | 0 | NA | NA | NA |
| Sex ratio (male/total subjects) | ||||||||||||
| <0.5 | 14 | −0.11 (−0.27, 0.06) | 81.8 | 0.199 | 10 | −0.22 (−0.31, −0.14) | 10.6 | 0.000 | 5 | −0.15 (−0.31, 0.01) | 68.7 | 0.069 |
| ≥0.5 | 23 | −0.17 (−0.27, −0.07) | 52.0 | 0.001 | 17 | −0.30 (−0.58, −0.02) | 93.4 | 0.036 | 13 | −0.13 (−0.36, 0.10) | 90.9 | 0.261 |
| Not reported | 7 | −0.31 (−0.54, −0.09) | 95.4 | 0.006 | 2 | −0.02 (−0.41, 0.38) | 72.6 | 0.934 | 2 | 0.15 (−0.05, 0.36) | 0.0 | 0.141 |
| Mean BMI | ||||||||||||
| <30 kg/m2 | 25 | −0.20 (−0.28, −0.11) | 80.0 | 0.000 | 14 | −0.30 (−0.54, −0.06) | 91.0 | 0.016 | 12 | −0.22 (−0.38, −0.06) | 85.1 | 0.007 |
| ≥30 kg/m2 | 10 | 0.03 (−0.09, 0.14) | 0.0 | 0.634 | 10 | −0.06 (−0.16, 0.04) | 0.0 | 0.230 | 8 | 0.04 (−0.08, 0.16) | 0.0 | 0.515 |
| Not reported | 9 | −0.38 (−0.60, −0.17) | 47.1 | 0.001 | 5 | −0.38 (−0.92, 0.17) | 85.5 | 0.175 | 3 | 0.01 (−0.48, 0.50) | 94.0 | 0.969 |
| Baseline (log-transformed) | ||||||||||||
| < median | 21 | −0.15 (−0.31, 0.01) | 86.9 | 0.059 | 13 | −0.13 (−0.23, −0.02) | 47.4 | 0.015 | 10 | −0.01 (−0.09, 0.08) | 0.0 | 0.894 |
| ≥ median | 21 | −0.23 (−0.33, −0.13) | 84.0 | 0.000 | 14 | −0.39 (−0.70, −0.07) | 92.8 | 0.015 | 11 | −0.22 (−0.43, −0.00) | 91.6 | 0.047 |
| Not reported | 2 | 0.06 (−0.23, 0.35) | 0.0 | 0.678 | 2 | −0.02 (−0.21, 0.16) | 0.0 | 0.796 | 2 | −0.04 (−0.23, 0.16) | 0.0 | 0.712 |
N, number of included studies (or comparisons); NA, not associated with this item; CVD, cardiovascular disease.
Subjects with high risk of CVD included overweight (or obese) subjects, subjects with dislipidemia, subjects with diabetes, and subjects with metabolic syndrome; subjects in the study by Mocking et al. in 2012 were diagnosed with both diabetes mellitus and depression simulaneously, so this study was included in both subgroup “presence or high risk of CVD” and subgroup “psychiatric disease” without calculating the overall effect size for all the studies.
Unit for CRP: mg/L; unit for IL-6 and TNF-α: pg/mL.
Data expressed in bold indicated that subgroup difference was significant (P for subgroup difference <0.05), and subgroup “not reported” was not included in the significance test for subgroup difference.
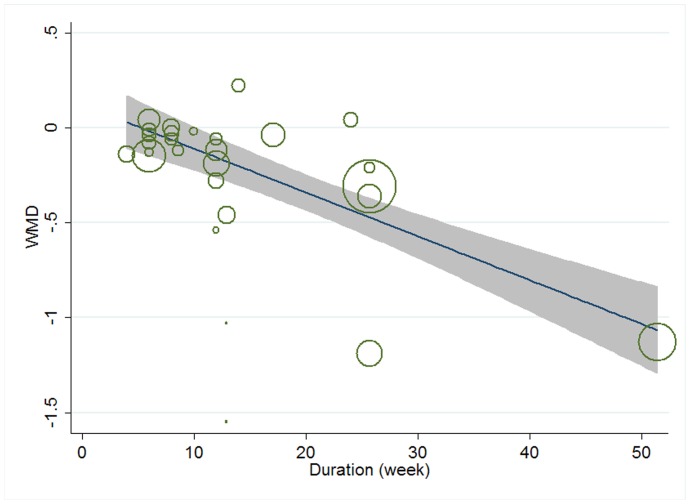
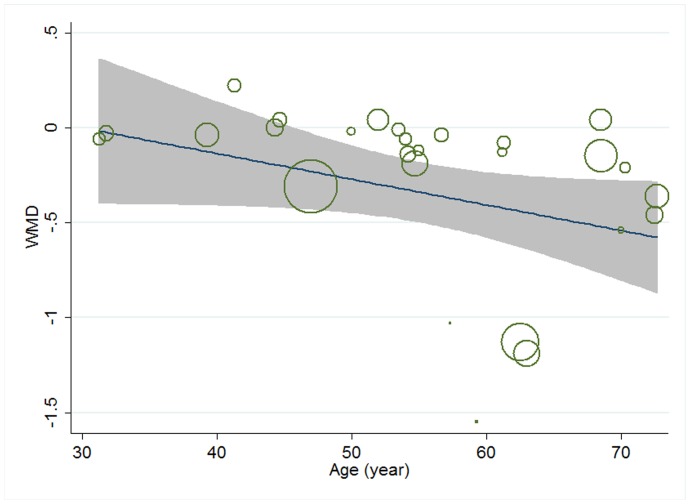
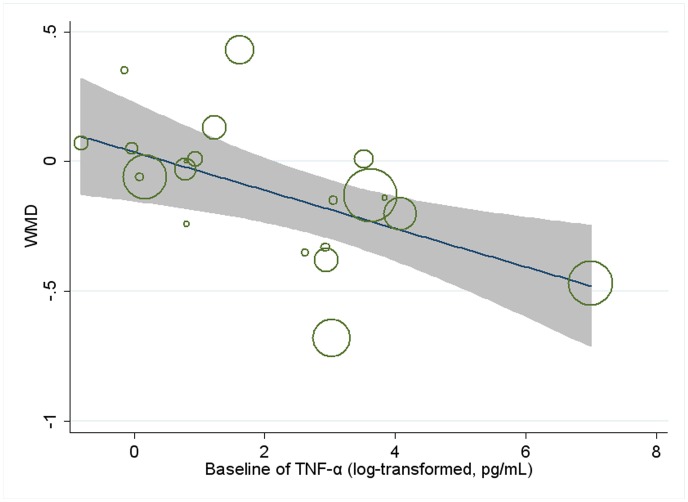
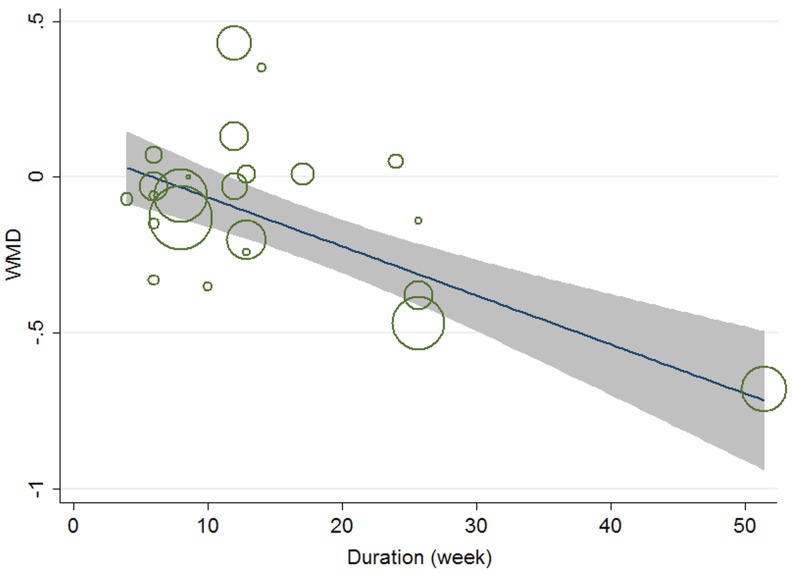
Meta-regression was conducted to assess the potential linear relationship between effect size and continuous covariates (baseline, duration, age, sex ratio (male/total subjects), BMI, and daily dose of EPA, DHA and total n-3 PUFAs). No significant result was observed for CRP. A significant linear relationship was observed between effect size on IL-6 and duration as well as age, and the coefficients were −0.023 (95% CI, −0.032 to −0.014; P = 0.000) (Figure 5) and −0.013 (95% CI, −0.025 to −0.000; P = 0.042) (Figure 6), respectively, indicating that the lowering effect was more effective when a longer duration was used or older subjects were recruited; the percentages of changes (in geometric mean) with 1 unit increase of duration (week) and age (year) were −2.27% (95% CI, −3.15% to −1.39%) and −1.29% (−2.47% to −0.0%); joint test for duration and age (as continuous variables) showed that their variation could help explain 67.08% heterogeneity; no significant linear relationship was observed between effect size on IL-6 and other continuous confounding variables. A significant linear relationship was observed between effect size on TNF-α and baseline level of TNF-α as well as duration, and the coefficients were −0.081 (95% CI, −0.145 to −0.017; P = 0.016) (Figure 7) and −0.015 (95% CI, −0.024 to −0.007; P = 0.001) (Figure 8), indicating that a higher baseline level of TNF-α or a longer duration could lead to a greater lowering effect; the percentages of changes (in geometric mean) with 1 unit increase of baseline level (log-transformed, pg/mL) and duration (week) were −7.78% (95% CI, −13.50% to −1.69%) and −1.49% (−2.37% to −0.70%); joint test for baseline of TNF-α and duration (as continuous variable) could help explain 63.21% heterogeneity; the significant linear relationship between duration and effect size demonstrated that marine-derived n-3 PUFAs supplementation had a significant lowering effect on TNF-α in subjects with chronic non-autoimmune disease although the pooled effect size was not significant; no significant linear relationship was observed between effect size on TNF-α and other continuous confounding variables.
Figure 5. Meta-regression for duration and effect size (n-3 PUFAs supplementation on IL-6 in chronic non-autoimmune disease).
WMD, weighted mean difference.
Figure 6. Meta-regression for age and effect size (n-3 PUFAs supplementation on IL-6 in chronic non-autoimmune disease).
WMD, weighted mean difference.
Figure 7. Meta-regression for baseline of TNF-α and effect size (n-3 PUFAs supplementation on TNF-α in chronic non-autoimmune disease).
WMD, weighted mean difference.
Figure 8. Meta-regression for duration and effect size (n-3 PUFAs supplementation on TNF-α in chronic non-autoimmune disease).
WMD, weighted mean difference.
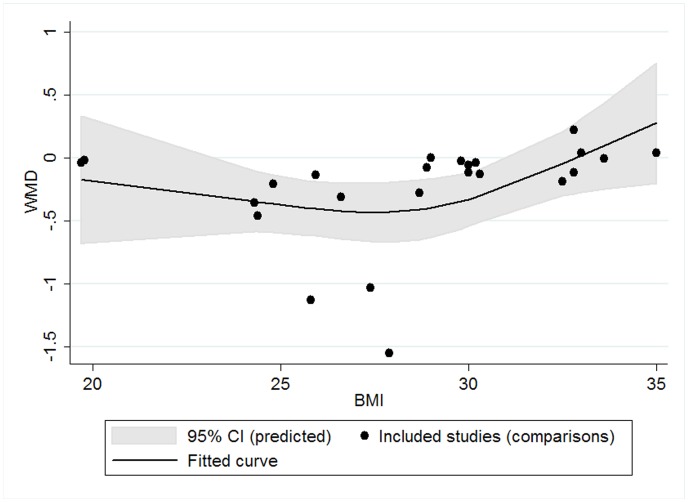
Restricted cubic spline analysis was used to assess potential cubic relationship between effect size and continuous covariates (as mentioned above). No significant result was observed for CRP and TNF-α. We found a significant cubic relationship between BMI of subjects and effect size on IL-6 (P for linearity = 0.047): the lowering effect did not change significantly with BMI when BMI was less than 30 kg/m2; however, when BMI was greater than 30 kg/m2, the lowering effect tended to become weaker with the increase of BMI (Figure 9). No significant cubic relationship was observed between effect size on IL-6 and other continuous confounding variables.
Figure 9. Cubic relationship between BMI and effect size (n-3 PUFAs supplementation on IL-6 in chronic non-autoimmune disease).
WMD, weighted mean difference.
Effect of Marine-Derived N-3 PUFAs from Dietary Intake (Fish Intake) on CRP, IL-6 and TNF-α in Subjects with Chronic Non-Autoimmune Disease
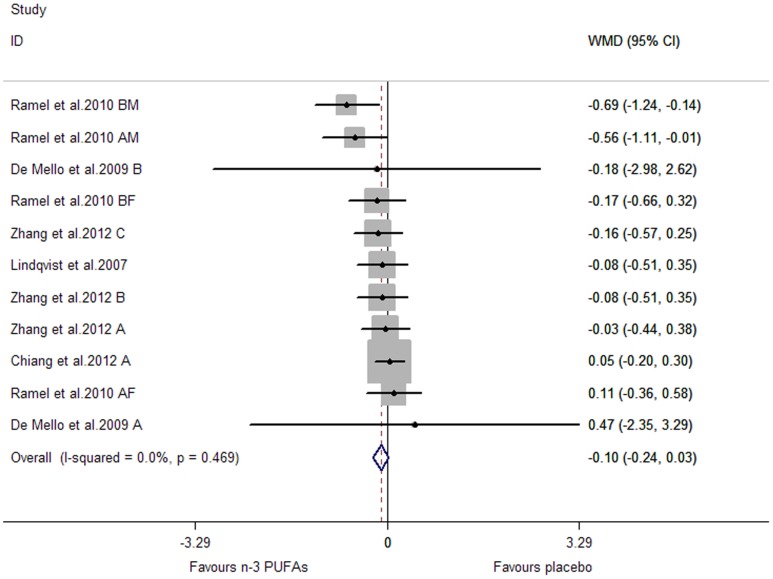
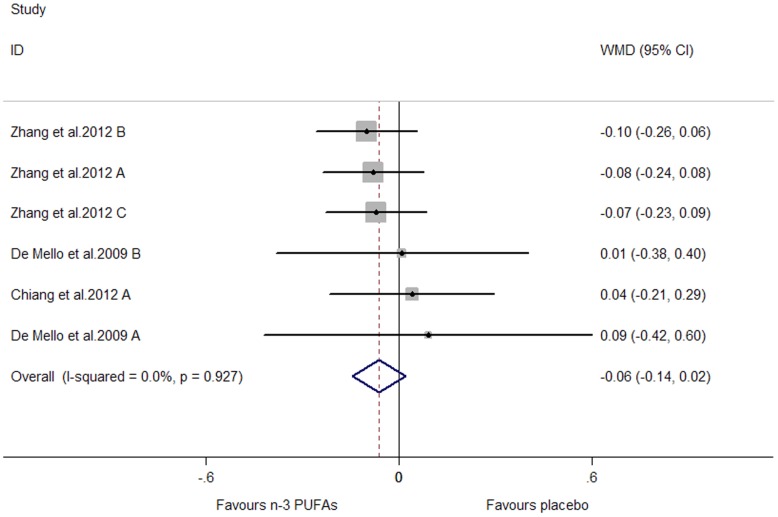
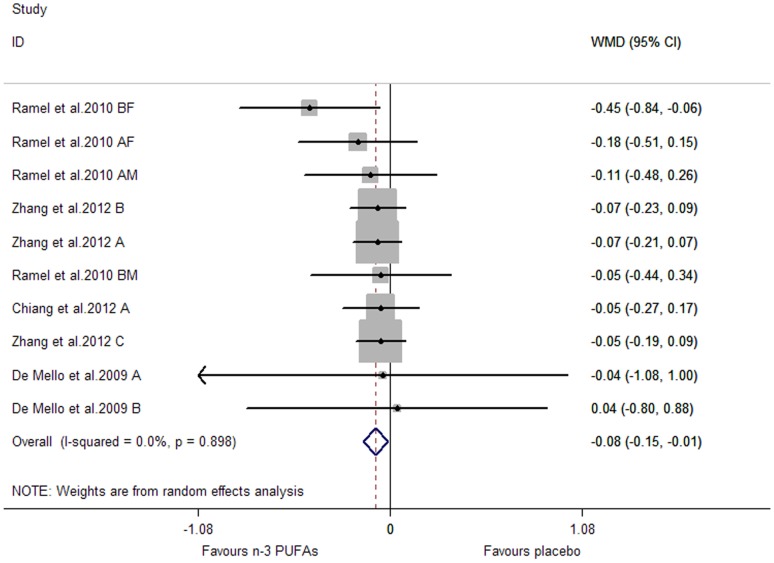
Subjects of all included studies had a high risk of or had been diagnosed with cardiovascular disease. The pooled effect sizes for CRP and TNF-α were not significant (P were 0.134 and 0.141, respectively) (Figure 10, Figure 11). A significant lowering effect on IL-6 was observed (WMD, −0.08; 95% CI, −0.15 to −0.01; P = 0.027) (Figure 12), and the overall percentage of change (in geometric mean) was −7.69% (95% CI, −13.93% to −1.00%). No heterogeneity was observed among the three groups of studies (I2 = 0.0%).
Figure 10. Pooled effect size of n-3 PUFAs from dietary intake on CRP in chronic non-autoimmune disease.
WMD, weighted mean difference.
Figure 11. Pooled effect size of n-3 PUFAs from dietary intake on TNF-α in chronic non-autoimmune disease.
WMD, weighted mean difference.
Figure 12. Pooled effect size of n-3 PUFAs from dietary intake on IL-6 in chronic non-autoimmune disease.
WMD, weighted mean difference.
Subgroup analysis was conducted by the same methods used for marine-derived n-3 PUFAs supplementation (as were shown in Table 2). No significant subgroup difference was observed for CRP and IL-6 (P for subgroup difference >0.05). Subgroup analysis was not conducted for TNF-α, considering less than 10 studies (or comparisons) were included.
Meta-regression and restricted cubic spline analysis did not find any linear (P for coefficient >0.05) or cubic relationship (P for linearity >0.05) between effect size on CRP/IL-6 and continuous variables (as were mentioned in the results for marine-derived n-3 PUFAs supplementation). Meta-regression and restricted cubic spline analysis were not conducted for TNF-α, considering less than 10 studies (or comparisons) were included.
One study (two independent comparisons) assessing the effect on CRP had a risk of bias in two categories [95]. When we excluded it, the pooled effect size for CRP still remained non-significant.
Effects of Marine-Derived N-3 PUFAs Supplementation on CRP, IL-6 and TNF-α in Subjects with Chronic Autoimmune Disease
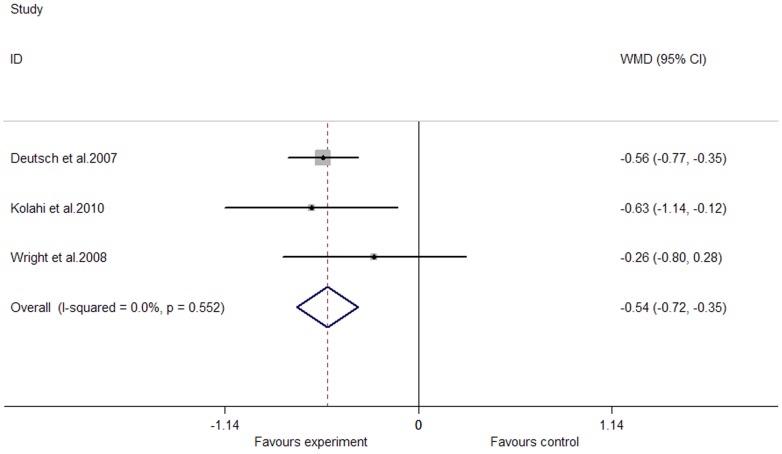
We observed a significant lowering effect of marine-derived n-3 PUFAs supplementation on fasting blood level of CRP; the pooled effect size was −0.54 (95% CI, −0.72 to −0.35; P = 0.000) (Figure 13), and the percentage of change (in geometric mean) was −41.73% (95% CI, −51.32% to −29.53%); no heterogeneity was observed in these studies (I2 = 0.0%); one study recruited both subjects with chronic non-autoimmune disease and subjects with chronic autoimmune disease [45], and after excluding this study the pooled effect size still remain significant. Only one study assessed the effect of marine-derived n-3 PUFAs supplementation on TNF-α [57], and a marginally significant lowering effect was observed (WMD, −0.28; 95% CI, −0.57 to 0.01; P = 0.061); the percentage of change (in geometric mean) was −24.42% (95% CI, −43.45% to 1.01%). No studies assessed the effect of marine-derived n-3 PUFAs supplementation on IL-6. Subgroup analysis, meta-regression and restricted cubic spline analysis were not conducted because the number of included studies was less than 10.
Figure 13. Pooled effect size of n-3 PUFAs supplementation on CRP in chronic autoimmune disease.
WMD, weighted mean difference.
Effects of Marine-Derived N-3 PUFAs Supplementation on CRP, IL-6 and TNF-α in Healthy Subjects
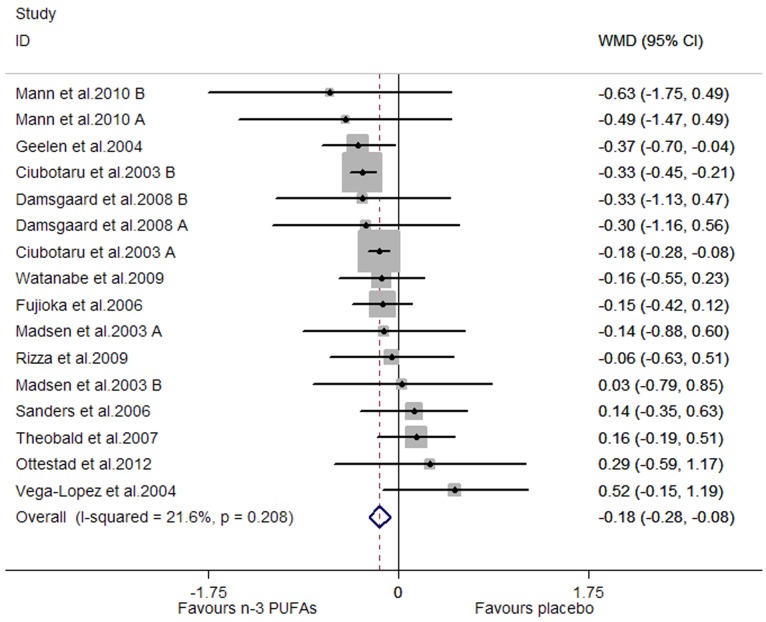
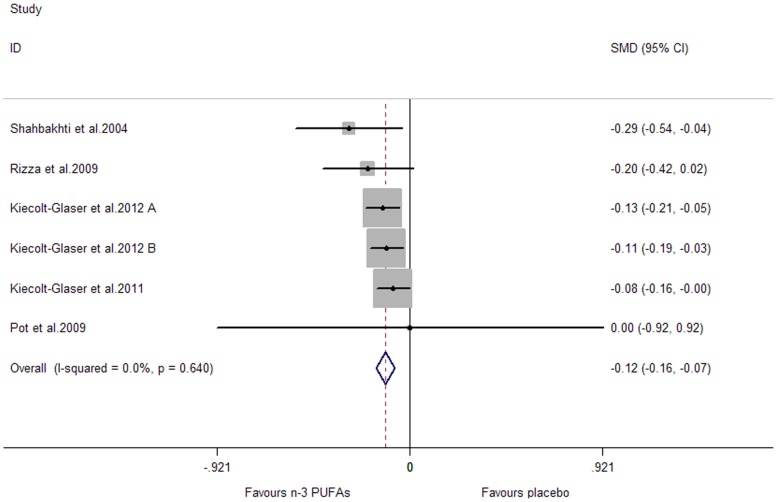
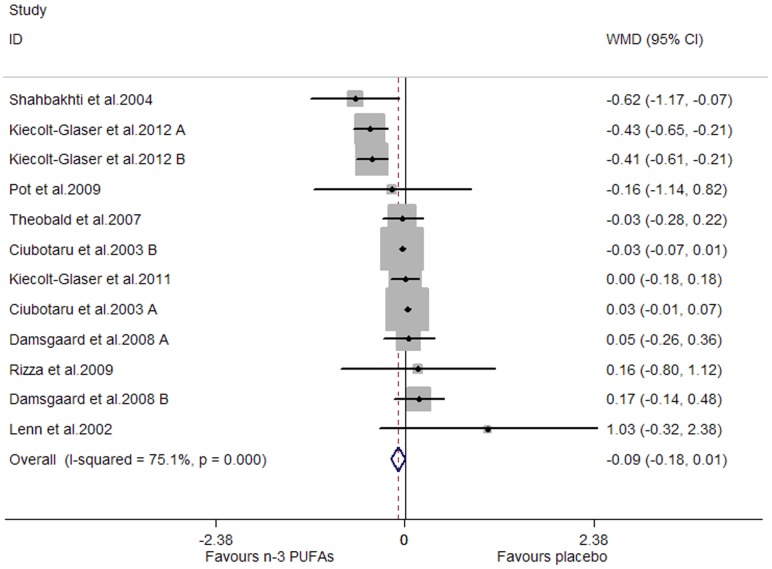
A significant lowering effect on CRP and TNF-α was observed, and the pooled effect sizes were -0.18 (95% CI, −0.28 to −0.08; P = 0.001) (Figure 14) and −0.12 (95% CI, −0.16 to −0.07; P = 0.000) (Figure 15), respectively; the percentages of changes (in geometric mean) were −16.47% (95% CI, −24.42% to −7.69%) and −11.31% (95% CI, −14.79% to −6.76%), respectively; no heterogeneity was observed for the two groups of studies (I2 values were 21.6% and 0.0%, respectively). A marginally significant lowering effect on IL-6 was observed (WMD, −0.09; 95% CI, −0.18 to 0.01; P = 0.065) (Figure 16), and the percentage of change (in geometric mean) was −8.61% (95% CI, −16.47% to 1.01%); significant heterogeneity was observed for studies assessing the effect on IL-6 (I2 = 75.1%).
Figure 14. Pooled effect size of n-3 PUFAs supplementation on CRP in healthy subjects.
WMD, weighted mean difference.
Figure 15. Pooled effect size of n-3 PUFAs supplementation on TNF-α in healthy subjects.
WMD, weighted mean difference.
Figure 16. Pooled effect size of n-3 PUFAs supplementation on IL-6 in healthy subjects.
WMD, weighted mean difference.
Results of subgroup analysis for CRP and IL-6 were shown in Table 3. No significant subgroup difference was observed for CRP (P for subgroup difference >0.05). Length of duration had a significant influence on effect size for IL-6: significant lowering effect was observed only when duration was longer than median, and the pooled effect size for this subgroup was −0.24 (95% CI, −0.44 to −0.03; P = 0.022) (P for subgroup difference was 0.037); the variation of duration (as categorical variable) could help explain 45.44% heterogeneity. Subgroup analysis was not conducted for TNF-α, considering the number of included studies (comparisons) was less than 10.
Table 3. The effect of marine-derived n-3 PUFAs supplementation on CRP, IL-6 in healthy subjects (data were log-transformed before analysis).
| CRP | IL-6 | ||||||||
| Subgroup analysis | N | WMD (95% CI) | I2 (%) | P | N | WMD (95% CI) | I2 (%) | P | |
| Overall | 16 | −0.18 (−0.28, −0.08) | 21.6 | 0.001 | 12 | −0.09 (−0.18, 0.01) | 75.1 | 0.065 | |
| Study design | |||||||||
| Parallel | 12 | −0.20 (−0.31, −0.09) | 24.8 | 0.000 | 9 | −0.13 (−0.24, −0.02) | 81.2 | 0.021 | |
| Crossover | 2 | −0.01 (−0.30, 0.32) | 29.3 | 0.941 | 1 | −0.03 (−0.28, 0.22) | NA | 0.817 | |
| Factorial | 2 | −0.32 (−0.90, 0.27) | 0.0 | 0.292 | 2 | 0.11 (−0.11, 0.33) | 0.0 | 0.331 | |
| Major fatty acid in placebo | |||||||||
| Linoleic acid | 2 | −0.25 (−0.40, −0.10) | 72.9 | 0.001 | 2 | 0.00 (−0.06, 0.06) | 77.8 | 1.000 | |
| Oleic acid | 13 | −0.12 (−0.26, 0.02) | 0.0 | 0.084 | 6 | −0.02 (−0.21, 0.17) | 21.7 | 0.845 | |
| Others or not reported | 1 | 0.52 (−0.15, 1.19) | NA | 0.126 | 4 | −0.22 (−0.52, 0.09) | 81.7 | 0.160 | |
| Duration (week) | |||||||||
| < median | 7 | −0.22 (−0.34, −0.11) | 26.7 | 0.000 | 5 | 0.01 (−0.05, 0.07) | 49.6 | 0.760 | |
| ≥ median | 9 | −0.09 (−0.26, 0.07) | 8.1 | 0.266 | 7 | −0.24 (−0.44, −0.03) | 66.7 | 0.022 | |
| Daily dose of total n-3 PUFAs (g) | |||||||||
| < median | 8 | −0.12 (−0.29, 0.05) | 36.2 | 0.162 | 6 | −0.08 (−0.33, 0.17) | 76.3 | 0.543 | |
| ≥ median | 8 | −0.28 (−0.38, −0.17) | 0.0 | 0.000 | 6 | −0.10 (−0.26, 0.07) | 74.2 | 0.236 | |
| Daily dose of EPA (g) | |||||||||
| < median | 8 | −0.11 (−0.27, 0.05) | 38.5 | 0.192 | 5 | −0.11 (−0.36, 0.14) | 78.9 | 0.369 | |
| ≥ median | 8 | −0.29 (−0.39, −0.18) | 0.0 | 0.000 | 6 | −0.10 (−0.26, 0.07) | 74.2 | 0.236 | |
| Not reported | 0 | NA | NA | NA | 1 | 1.03 (−0.32, 2.38) | NA | 0.136 | |
| Daily dose of DHA (g) | |||||||||
| < median | 8 | −0.17 (−0.26, −0.09) | 0.0 | 0.000 | 5 | −0.24 (−0.48, 0.00) | 89.8 | 0.052 | |
| ≥ median | 8 | −0.09 (−0.33, 0.15) | 38.0 | 0.478 | 6 | −0.03 (−0.06, 0.01) | 0.0 | 0.185 | |
| Not reported | 0 | NA | NA | NA | 1 | 1.03 (−0.32, 2.38) | NA | 0.136 | |
| Mean age (year) | |||||||||
| < median | 8 | 0.00 (−0.25, 0.25) | 0.0 | 0.995 | 6 | 0.01 (−0.20, 0.22) | 40.5 | 0.913 | |
| ≥ median | 8 | −0.21 (−0.31, −0.10) | 29.8 | 0.000 | 6 | −0.13 (−0.24, −0.02) | 85.9 | 0.022 | |
| Sex ratio (male/total subjects) | |||||||||
| <0.5 | 6 | −0.24 (−0.33, −0.14) | 19.2 | 0.000 | 5 | −0.17 (−0.30, −0.05) | 90.0 | 0.007 | |
| ≥0.5 | 9 | −0.10 (−0.27, 0.06) | 0.0 | 0.219 | 7 | 0.03 (−0.09, 0.15) | 0.0 | 0.584 | |
| Not reported | 1 | 0.52 (−0.15, 1.19) | NA | 0.126 | 0 | NA | NA | NA | |
| Baseline (log-transformed) | |||||||||
| < median | 8 | −0.07 (−0.24, 0.10) | 0.0 | 0.410 | 5 | 0.00 (−0.07, 0.07) | 62.4 | 0.995 | |
| ≥ median | 8 | −0.21 (−0.35, −0.07) | 44.5 | 0.004 | 6 | −0.23 (−0.47, 0.01) | 56.9 | 0.060 | |
| Not reported | 0 | NA | NA | NA | 1 | 0.00 (−0.18, 0.18) | NA | 1.000 | |
N, number of included studies (or comparisons); NA, not associated with this item.
Unit for CRP: mg/L; unit for IL-6: pg/mL.
Data expressed in bold indicated that subgroup difference was significant (P for subgroup difference <0.05), and subgroup “not reported” was not included in the significance test for subgroup difference.
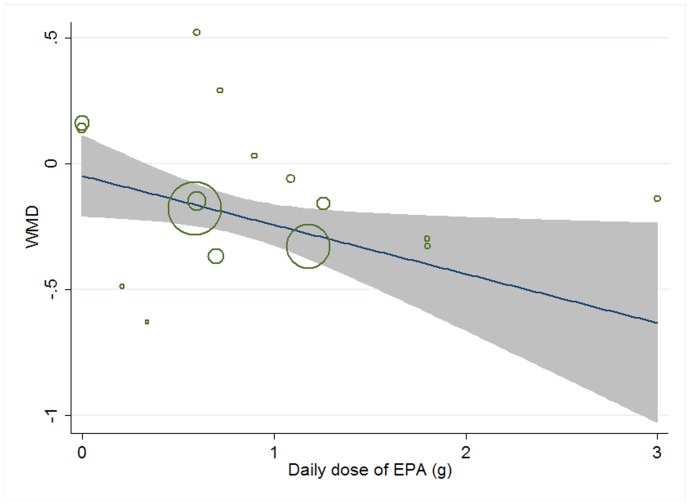
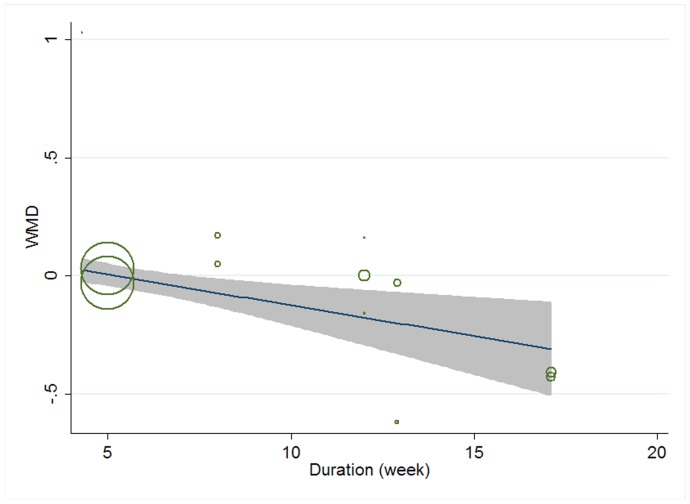
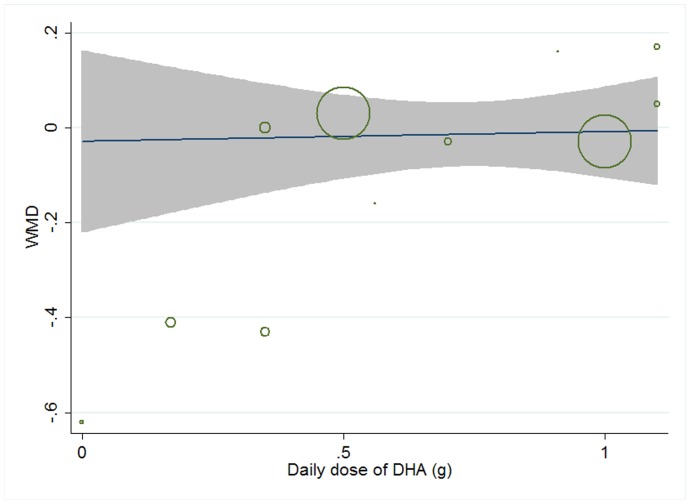
Meta-regression was conducted to explore potential linear relationship between effect size and continuous confounding factors (baseline, duration, age, sex ratio (male/total subjects), and daily dose of EPA, DHA, and total n-3 PUFAs). A significant linear relationship was observed between effect size on CRP and daily dose of EPA, and the coefficient was −0.195 (95% CI, −0.374 to −0.016; P = 0.035) (Figure 17), indicating that higher doses of EPA could lead to a greater lowering effect, and the percentage of change (in geometric mean) with one unit increase of EPA dose (g/d) was −17.72% (95% CI, −31.20% to −1.59%); no significant linear relationship was observed between effect size on CRP and other continuous confounding variables. A significant linear relationship was observed between effect size on IL-6 and duration as well as daily dose of DHA, and the correlations were −0.032 (95% CI, −0.054 to −0.011; P = 0.007) (Figure 18) and 0.450 (95% CI, 0.055 to 0.845; P = 0.030) (Figure 19), respectively, indicating that longer duration and lower daily dose of DHA could lead to a greater lowering effect; the percentages of changes (in geometric mean) with one unit increase of duration (week) and DHA dose (g/d) were −3.15% (95% CI, −5.26% to −1.09%) and 56.83% (95% CI, 5.65% to 132.80%), respectively; joint test for the two covariates above (as continuous variables) showed that their variation could help explain 57.69% heterogeneity; no significant linear relationship was observed between effect size on IL-6 and other continuous confounding variables. The significant linear relationship between duration and effect size demonstrated that marine-derived n-3 PUFAs supplementation also had a significant lowering effect on IL-6 in healthy subjects although the pooled effect size was only marginally significant. Meta-regression was not conducted for TNF-α, considering the number of included studies (comparisons) was less than 10.
Figure 17. Meta-regression for daily dose of EPA and effect size (n-3 PUFAs supplementation on CRP in healthy subjects).
WMD, weighted mean difference.
Figure 18. Meta-regression for duration and effect size (n-3 PUFAs supplementation on IL-6 in healthy subjects).
WMD, weighted mean difference.
Figure 19. Meta-regression for daily dose of DHA and effect size (n-3 PUFAs supplementation on IL-6 in healthy subjects).
WMD, weighted mean difference.
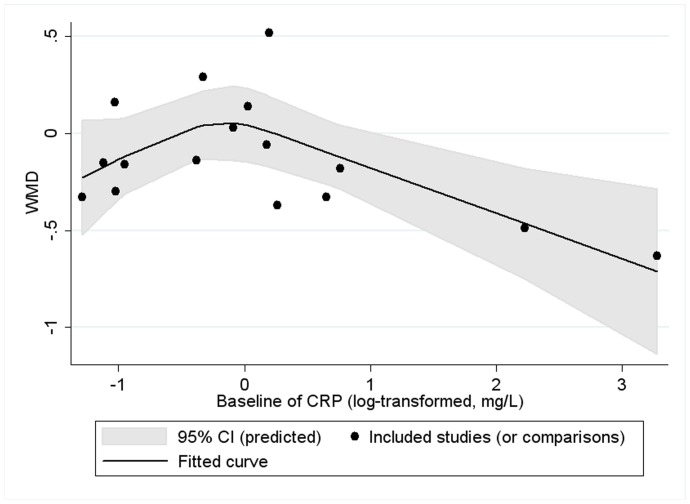
Restricted cubic spline analysis for IL-6 showed no significant cubic relationship between effect size on the two inflammatory factors and continuous confounding factors (as were mentioned in the paragraph above) (P for linearity >0.05). We found a significant cubic relationship between baseline of CRP and effect size on CRP (P for linearity = 0.021) (Figure 20): the lowering effect was slightly weakened with the increase of baseline (log-transformed, mg/L) when baseline (log-transformed) was less than 0; however, when baseline (log-transformed, mg/L) was greater than 0, the lowering effect became significantly greater with the increase of baseline. Restricted cubic spline analysis was not conducted for TNF-α, considering the number of included studies (comparisons) was less than 10.
Figure 20. Cubic relationship between baseline of CRP and effect size (n-3 PUFAs supplementation on CRP in healthy subjects).
WMD, weighted mean difference.
Mean Changes of Phospholipid N-3 PUFAs in Plasma/Serum and the Effect Size of Marine-Derived N-3 PUFAs
Data of mean changes for phospholipid EPA, DHA and total n-3 PUFAs were shown in Table S1. Subgroup, meta-regression and restricted cubic spline analyses were conducted to explore the association between changes of phospholipid EPA, DHA and total n-3 PUFAs in plasma/serum and the effect size of marine-derived n-3 PUFAs. We chose changes of phospholipid EPA, DHA and total n-3 PUFAs in plasma/serum because only a small part of included studies reported changes of n-3 PUFAs in tissue and most of them presented n-3 PUFAs changes in tissue as changes of phospholipid EPA, DHA and total n-3 PUFAs in plasma/serum. Considering that the three types of analyses cannot obtain enough power unless the number of included studies was at least 10, we included studies used marine-derived n-3 PUFA from different sources (supplementation or dietary intake) and studies recruited subjects with different healthy status (subjects with chronic non-autoimmune disease, chronic auto-immune disease and healthy subjects) into these analyses simultaneously. Subgroup, meta-regression and restricted cubic spline analyses all showed no significant results for CRP and IL-6. The three types of analysis were not conducted for TNF-α, because less than 10 studies reported the association between the effect size on TNF-α and changes of phospholipid EPA, DHA or total n-3 PUFAs in plasma/serum.
Publication Bias
The funnel plot for studies assessing the effect of marine-derived n-3 PUFAs supplementation on IL-6 in subjects with chronic non-autoimmune disease showed a slight asymmetry, indicating that considerable publication bias existed (Figure S3); trim-and-fill test suggested that 7 studies needed to be trimmed to make the funnel symmetric, and after the addition of 7 studies, the pooled effect size on IL-6 became −0.35 (95% CI, −0.49 to −0.20) and still remained significant (p = 0.000); the corresponding percentage of change (in geometric mean) for IL-6 was −29.53% (95% CI, −38.74% to −18.13%). Other funnel plots for meta-analyses including at least 10 studies did not show any significant asymmetry, indicating that no significant publication bias existed among these groups of studies (Figure S3–S9). Funnel plot analysis for meta-analysis including less than 10 studies was not conducted considering that this method cannot obtain enough power when the number of included studies is less than 10 (as mentioned in Statistical Methods).
Discussion
The present meta-analysis provided consistent evidence that marine-derived n-3 PUFAs supplementation had a significant lowering effect on fasting blood levels of CRP, IL-6 and TNF-α in subjects with chronic non-autoimmune disease and healthy subjects. Marine-derived n-3 PUFAs supplementation had a significant lowering effect on fasting blood level of CRP and a marginally significant lowering effect on TNF-α in subjects with chronic autoimmune disease; no included studies assessed the effect on IL-6 in subjects with chronic autoimmune disease. The effect of marine-derived n-3 PUFAs from dietary intake on CRP, IL-6 and TNF-α was only assessed in subjects with chronic non-autoimmune disease, and significant lowering effect was only observed on IL-6, but not on CRP and TNF-α.
The lowering effect of n-3 PUFAs on CRP, IL-6 and TNF-α has a biological basis. The mechanism may involve both nuclear factor кB (NF-кB) and peroxisome proliferator agonist receptors (PPAR). N-3 PUFAs has been found to be a natural ligand of PPAR [99]. PPAR was a ligand-activated transcription factor. The heterodimeric complex comprised of PPAR and its ligand can bind to peroxisome proliferator response elements on DNA to regulate gene expression [100]. A previous study showed that PPAR inhibited the activation of NF-кB [101], which can initiate genes encoding for inflammatory factors, such as TNF-α and IL-6 [102]. Moreover, TNF-α also plays a role in the activation of NF-кB by leading to phosphorylation of IкBa, an inhibitor of NF-кB [103]. Phosphorylation of IкBa can cause the dissociation of IкBa from NF-кB, and further the proteolysis of IкBa due to the exposure of a previously masked proteolytic cleavage site [103]. Therefore, the down-regulation effect of n-3 PUFAs on TNF-α by PPAR and NF-кB signal pathways may in turn interfere with the activation of NF-кB, leading to a further reduction in the levels of TNF-α and IL-6. In addition, TNF-α and IL-6 play an important role in acute phase inflammatory response, including induction of acute phase reactant protein production (e.g., CRP) [10]. In addition, one previous study showed that high oxidative stress can led to the activation of NF-кB [104]. A review by Mori et al. found that EPA and DHA had a significant lowering effect on oxidative stress [105]. As suggested above, NF-кB can initiate genes encoding for inflammatory factors, such as TNF-α and IL-6, and thus increase the level of CRP. Therefore, the antioxidative effect of n-3 PUFAs may also help explain its lowering effect on TNF-α, IL-6 and CRP.
By subgroup analysis, we found that fatty acid compositions of placebo had a significant influence on the effect size of marine-derived n-3 PUFAs supplementation on CRP in subjects with chronic non-autoimmune disease, the significant lowering effect of marine-derived n-3 PUFAs was observed when oils mainly comprised of linoleic acid (n-6 fatty acid) rather than oleic acid (monosaturated fatty acid) were used as placebo (p for subgroup difference <0.05). A similar result was also observed in healthy subjects: although the subgroup difference was not significant (p for subgroup difference >0.05), significant result was observed only in subgroup using oils mainly comprised of linoleic acid (n-6 fatty acid) rather than oleic acid (monounsaturated fatty acid). Reasons for this difference induced by placebo might be explained by the role different fatty acid play in the immune system. Previous studies have demonstrated that n-6 polyunsaturated fatty acid play an opposing role with n-3 polyunsaturated fatty acid in the process of inflammation [106], [107]: n-6 polyunsaturated fatty acid can initiate the activation of NF-кB by arachidonic acid, an intermediate product of n-6 fatty acid during metabolism, and thus increase the level of TNF-α, IL-6 and CRP as suggested in the paragraph above. However, oleic acid has an anti-inflammatory property by suppressing lymphocyte proliferation, inhibiting cytokine production and reducing activity of NK cells [108]. The opposing role of linoleic acid (n-6 polyunsaturated fatty acid) and oleic acid (monounsaturated fatty acid) in inflammation may help explain the difference in effect size caused by placebo.
By meta-regression, we observed a significant negative linear relationship between duration and effect size of marine-derived n-3 PUFAs supplementation on IL-6 and TNF-α in subjects with chronic non-autoimmune disease, indicating that longer duration of use could lead to a greater lowering effect. Similar linear relationship was also observed between duration and effect size of marine-derived n-3 PUFAs supplementation on IL-6 in healthy subjects. The relationship between duration and effect size was easy to understand if we take into consideration that changing fatty acid composition of cell membrane and tissues by n-3 PUFAs intake needs a relatively long term. One previous controlled study by Katan et al. assessed the effect of fish oil intake on changes of fatty acid composition in serum cholesteryl esters, erythrocyte membranes and adipose tissue during an 18-month follow-up [109]. The results showed that EPA plateaued only after 4–8 weeks in serum cholesteryl esters. However, the steady period for EPA in erythrocyte membrane and gluteal fat tissue did not come until supplementation consisted for 6 months and 12 months, respectively, and the content of EPA in abdominal fat tissue still remain a trend to increase after supplementation for 12 months. Therefore, the result observed in our present study that the lowering effect size of marine-derived n-3 PUFAs supplementation on inflammatory factors is greater with the extension of duration when duration was shorter than 12 months, is consistent with the study by Katan et al. [109] and is plausible.
We observed a significant cubic relationship between BMI of subjects and the effect size of marine-derived n-3 PUFAs supplementation on fasting blood level of IL-6 in subjects with chronic non-autoimmune disease in studies with a parallel group design. From the fitted curve, we found that the lowering effect of marine-derived n-3 PUFAs supplementation on IL-6 became weakened when BMI was greater than 30 kg/m2. Although cubic relationships between BMI and the effect sizes of marine-derived n-3 PUFAs supplementation on the level of CRP and TNF-α in subjects with chronic non-autoimmune disease were not significant, subgroup analysis found a similar result: marine-derived n-3 PUFAs supplementation had a significant lowering effect on CRP and TNF-α in subjects with a BMI less than 30 kg/m2 but not in subjects with a BMI ≥30 kg/m2, and the subgroup difference was significant. One possible reason for the lack of correlation in obese subjects may be explained by the association between fatty acid composition in tissue and obesity. A previous study found that the total n-6 PUFAs and arachidonic acid in adipose tissues all increased with BMI in obese subjects [110]. As we know, arachidonic acid can produce several pro-inflammatory eicosanoids through cyclooxygenase (COX) and 5-lipoxygenase (5-LOX) pathways. One important mechanism for the anti-inflammatory effect of n-3 PUFAs can be attributed to its competing role with arachidonic acid in eicosanoids metabolism: n-3 PUFAs can inhibit the oxidation of arachidonic acid by cyclooxygenase (COX) enzymes, and thus reducing the production of pro-inflammatory eicosanoids, such as prostaglandin E2 (PGE2) and thromboxane A2 (TXA2); n-3 PUFAs are also substrates for COX and 5-LOX; n-3 PUFAs can be incorporated into membrane phospholipids at the expense of arachidonic acid, and thus reduce the production of eicosanoids from arachidonic acid [111]. Arachidonic acid-derived eicosanoids also play an important role in regulating the production of several cytokines, such as TNF-α and IL-6 [112] and further regulating the production of other inflammatory markers such as CRP. Therefore, higher n-6 PUFAs and arachidonic acid level in tissue of obese subjects may needs a higher dosage of n-3 PUFAs than non-obese subjects to reduce the production of arachidonic acid-derived eicosanoids, CRP, IL-6 and TNF-α. This was demonstrated by one study which indicated that a high dose of n-3 PUFA (4.2g/d) supplementation significantly reduced CRP and IL-6 levels [38]. However, most included studies in our present meta-analysis which recruited obese subjects used a much lower dose than that. This may be the reason why we did not observe a lowering effect of marine-derived n-3 PUFAs on CRP, IL-6 and TNF-α in obese subjects. In addition, other medicine use and difference in compliance may also be the potential factors that led to the non-significant results in obese subjects. However, most included studies recruiting obese subjects excluded subjects taking medicine with a potential influence on inflammatory response and reported a high degree of compliance assessed by capsules count or determination of fatty acid changes in tissue. Therefore, other medicine use and difference in compliance seems not to be the reasons for the difference of effect size caused by BMI in our present meta-analysis.
A significant negative linear relationship between age and the effect size of marine-derived n-3 PUFAs supplementation on fasting blood level of IL-6 was observed in subjects with chronic non-autoimmune disease, indicating that the lowering effect was stronger in older subjects. Subgroup analysis also found a consistent result. One previous study by Rodrigo et al. also found that older subjects showed a better antioxidant response to n-3 PUFAs supplementation [113]. As suggested in the second paragraph of this discussion, one possible mechanism for the anti-inflammatory effect of n-3 PUFAs might be attributed to its antioxidant effect. Therefore, our result concerning the effect of age on the association between marine-derived n-3 PUFAs supplementation and IL-6 was consistent with the study by Rodrigo et al. [113]. One study by Rees et al. found that older subjects incorporated long-chain n-3 PUFAs into plasma and mononuclear cells more readily than younger ones [114]. Similar results were also found in the study by Meydani et al. [115]. These results were consistent with one cross-sectional study which found that long-chain n-3 PUFAs in adipose tissue increased with age [116]. This may be one reason why the lowering effect of marine-derived n-3 PUFAs supplementation on IL-6 was more effective in older subjects. In addition, one study by Cartier et al. found that CRP, IL-6 and TNF-α level increased with age in men [117]. Our present study showed that higher baseline level was associated with a greater lowering effect (Table 2, Figure 7 and Figure 20). This may also help explain the difference in effect size caused by age.
We also observed a significant negative linear relationship between daily dose of EPA and the effect size on fasting blood level of CRP in healthy subjects, indicating that higher dose of EPA might lead to a greater lowering effect on CRP. But similar relationship was not observed for daily dose of total n-3 PUFAs or DHA. This provided some evidence that EPA might be at least more effective than DHA on lowering fasting blood level CRP. We also observed a significant positive linear relationship between daily dose of DHA and the effect size on fasting blood level of IL-6 in healthy subjects. This result was consistent with the negative relationship between daily dose of EPA and the effect size on fasting blood level of CRP if we take into consideration that marine-derived n-3 PUFA supplementation (mainly fish oil) is mainly comprised of EPA and DHA, and that higher dose of DHA might lead to a lower proportion of EPA. One previous studies in mice showed that the lowering effect on cytokines production by thioglycollate-induced macrophages were only significant in the group fed by diet with the highest EPA/DHA ratio [118]. These results came to a consistence with those of our present meta-analysis. The mechanism behind this phenomenon may involve the competing role of n-3 PUFAs (mainly EPA) with arachidonic acid in eicosanoids metabolism which has been described in detail in the fifth paragraph of discussion. Briefly, EPA reduces the production of arachidonic acid-derived eicosanoids by inhibiting the oxidation of arachidonic acid by COX, acting as competing substrates of COX and 5-LOX, and incorporating into cell membrane phospholipids at the expense of arachidonic acid, and thus reduces the production of cytokines (such as IL-6 and TNF-α) and other inflammatory factors (such as CRP). Although previous studies have shown that DHA can be retroconverted to EPA, the retroconversion ratios were low (about 7.4% and 11.4% in young adult omnivores and vegetarians, respectively) [119]. In addition, one previous study in mice showed that diet high in EPA rather than diet high in DHA significantly increased IL-10 production by macrophages and lymphocytes; two diets all led to a similar increase of DHA in tissue, but significant EPA increase was only observed after EPA diet intake [120]. As we know, one important function of IL-10 is to inhibit cytokine production [121]. Interestingly, one study found that DHA can even induce T helper cell type 1-like immune response by increase the ratio of interferon-γ to IL-10 but not for EPA [122]. These points above might help explain why EPA and DHA showed different effect in regulating the process of inflammatory response.
However, our present meta-analysis showed that changes of phospholipid EPA, DHA and total n-3 PUFAs in plasma/serum did not show any significant influence on their effect size concerning CRP, IL-6 and TNF-α. As mentioned in the fourth paragraph of discussion, EPA in serum cholesteryl esters, erythrocyte membrane and gluteal fat tissue plateaued after 4–8 weeks, 6 months and 12 months, respectively, and the content of EPA in abdominal fat tissue still remain a trend to increase after supplementation for 12 months [109]. However, the duration of most included studies in our present meta-analysis ranged from 6 weeks to 4 months. Therefore, the change of phospholipid fatty acid in plasma/serum cannot absolutely represent that in cell membrane or fat tissue, that is, studies with a longer duration may have a similar fatty acid fatty acid in plasma/serum but differ in that of cell membrane or fat tissue. However, the effects of these changes on effect size were not analyzed in the present meta-analysis because only few included studies reported fatty acid changes in cell membrane or fat tissue. In addition, one limit for the analyses (subgroup, meta-regression and restricted cubic analyses) on the association between changes of phospholipid fatty acid in plasma/serum and effect size was that we included studies using marine-derived n-3 PUFAs from different sources (supplementation or dietary intake) and studies recruited subjects with different healthy status (subjects with chronic disease or healthy subjects) into these analyses simultaneously. We did so because these analyses cannot obtain enough power unless the number of included studies was at least 10. However, this makes sources of marine-derived n-3 PUFAs and healthy status of subjects become potential confounding factors which might influence the final results.
One previous study reviewed the effect of marine-derived n-3 PUFAs on inflammatory markers in randomized controlled trials, and found that only few studies showed a significant lowering effect on CRP, IL-6 and TNF-α in healthy subjects, and that the lowering effect of marine-derived n-3 PUFAs was significant on CRP and IL-6 in subjects with a presence or high risk of cardiovascular disease [23]. The effect on TNF-α in subjects with a presence or high risk of cardiovascular disease was significant in only a few studies [23]. Another review also found that the lowering effect of marine-derived n-3 PUFAs on CRP was associated with the decreased level of IL-6 [24]. This was consistent with the results in our present study. However, because the results from different studies were contradictory, both reviews did not draw a firm conclusion about the association between n-3 PUFAs and inflammatory factors. Xin et al. conducted a meta-analysis for the association between fish oil supplementation and inflammatory markers in subjects with chronic heart failure [25]. The study found a significant lowering effect of fish oil on circulating level of IL-6 and TNF-α, and subgroup analysis indicated that the lowering effect on IL-6 and TNF-α was greater in studies with a longer duration (>4 months) than studies with a shorter duration (≤4 months) [25]. This result was consistent with our present findings concerning the effect of marine-derived n-3 PUFAs supplementation in subjects with chronic non-autoimmune diseases. However, the meta-analysis by Xin et al. founds a significant association between circulating level of CRP and fish oil supplementation. There were several different points in study design between the study by Xin et al. and our present meta-analysis. Firstly, our present meta-analysis combined the results from studies assessing the effect of marine-derived n-3 PUFAs supplementations in subjects with all kinds of chronic non-autoimmune diseases into a single meta-analysis, and thus incorporated much more subjects than the meta-analysis by Xin et al., and subgroup analysis according to types of diseases did not show any significant subgroup difference. Secondly, both the meta-analysis by Xin et al. and our present meta-analysis included skewed data (such as results expressed as log-transformed data or median). The study by Xin et al. transformed skewed data into mean ± SD, and combined these data on raw scale. However, considering that meta-analysis is based on the assumption that data are normally distributed, we transformed all of the data into log-transformed scale, which can substantially reduce skew, and then conducted the data analysis [27], [29]. By data transformation, the bias caused by skew of data on raw scale was eliminated in our present study. Thirdly, of the 7 studies [20], [71], [77], [78], [123]–[125] included in the meta-analysis by Xin et al., 3 studies were not included into our present study [123]–[125]. Reasons for exclusion were as follows. One study supplemented subjects with fish oil and assessed changes of cytokines production by ex vivo mononuclear cells before and after supplementation [124]. This study was excluded considering there was considerable heterogeneity between cytokines production by ex vivo mononuclear cells and fasting blood levels of cytokines in vivo. Another study used a crossover design to assess the effect of fish oil on fasting blood level of CRP, IL-6 and TNF-α [125]. However, it did not report a wash-out period. Considering the carry-over effect might be significant without a wash-out period, this study was also excluded. The third study was excluded because the reported data cannot be transformed into log-scale by the methods suggested in “Statistical Methods” and log-transformed data was still unavailable after contacting the author [123].
Several strengths can be observed in the present study. Firstly, we conducted meta-analysis based on log-transformed data, and this transformation eliminated potential bias caused by skew of data in some included studies. Secondly, our present study showed that the effect of marine-derived n-3 PUFAs supplementation had a lowering effect on all the three inflammatory factors (CRP, IL-6 and TNF-α). Considering the up-regulation effect of TNF-α on IL-6 and up-regulation effect of IL-6 on CRP (discussed in the second paragraph of discussion), the similarity of results concerning CRP, IL-6 and TNF-α strengthened the persuasion of our study. In addition, the large number of included studies and large sample size also make our results more plausible.
Our study also had several limitations. Firstly, a risk of bias was observed in several studies included in the present meta-analysis. But results from our sensitivity analysis showed that these biases did not have a significant influence on the pooled effect size. Secondly, a significant heterogeneity was observed in the three meta-analyses assessing the effect of marine-derived n-3 PUFAs supplementation on CRP, IL-6 and TNF-α in subjects with chronic non-autoimmune disease as well as the meta-analysis evaluating the effect of marine-derived n-3 PUFAs supplementation on IL-6 in healthy subjects. However, the sources of heterogeneity and their influence on the effect size were well explained by subgroup meta-analysis, meta-regression and restricted cubic spline analysis.
Our findings provide a scientific guide for nutritional therapy of inflammation-related chronic diseases. Consecutive long-term supplementation of marine-derived n-3 PUFAs is recommended. Our present studies also suggest that marine-derived n-3 PUFAs supplementation can effectively prevent inflammation-related chronic diseases considering its significant lowering effect on CRP, IL-6 and TNF-α in healthy subjects. The anti-inflammatory effect tends to be the most effective in non-obese subjects.
In conclusion, marine-derived n-3 PUFAs supplementation has a significant lowering effect on fasting blood level of TNF-α, IL-6 and CRP.
Supporting Information
Judgements about each risk of bias item presented as percentages across all included studies.
(PDF)
Judgements about each risk of bias item for each included study. Red ball, high risk of bias; yellow ball, unclear risk of bias; green ball, no risk of bias.
(PDF)
Funnel plot for publication bias (n-3 PUFAs supplementation and IL-6 in chronic non-autoimmune disease). SE, standard error; WMD, weighted mean difference.
(TIF)
Funnel plot for publication bias (n-3 PUFAs supplementation and CRP in chronic non-autoimmune disease). SE, standard error; WMD, weighted mean difference.
(TIF)
Funnel plot for publication bias (n-3 PUFAs supplementation and TNF-α in chronic non-autoimmune disease). SE, standard error; WMD, weighted mean difference.
(TIF)
Funnel plot for publication bias (n-3 PUFAs from dietary intake and CRP in chronic non-autoimmune disease). SE, standard error; WMD, weighted mean difference.
(TIF)
Funnel plot for publication bias (n-3 PUFAs from dietary intake and IL-6 in chronic non-autoimmune disease). SE, standard error; WMD, weighted mean difference.
(TIF)
Funnel plot for publication bias (n-3 PUFAs supplementation and CRP in healthy subjects). SE, standard error; WMD, weighted mean difference.
(TIF)
Funnel plot for publication bias (n-3 PUFAs supplementation and IL-6 in healthy subjects). SE, standard error; WMD, weighted mean difference.
(TIF)
Baseline of inflammatory markers (log-transformed) and mean changes of phospholipid n-3 PUFAs in plasma/serum.
(DOC)
PRISMA checklist.
(DOC)
Protocol for meta-analysis to assess the effect of marine-derived n-3 polyunsaturated fatty acids on CRP, IL-6 and TNF-α.
(DOC)
Funding Statement
The study was supported by a grant from National High Technology Research and Development Program of China (No. N20080753), the National Natural Science Foundation of China (No. 30972464) and the Ph.D. Programs Foundation of Ministry of Education of China (No. 20070335025). The funders had no role in study design, data collection and analysis, decision to publish, or preparation of the manuscript.
References
- 1. Libby P (2006) Inflammation and cardiovascular disease mechanisms. Am J Clin Nutr 83: 456S–460S. [DOI] [PubMed] [Google Scholar]
- 2.Lobner K, Fuchtenbusch M (2004) Inflammation and diabetes. MMW Fortschr Med 146: 32–33, 35–36. [PubMed]
- 3. Lee YH, Pratley RE (2005) The evolving role of inflammation in obesity and the metabolic syndrome. Curr Diab Rep 5: 70–75. [DOI] [PubMed] [Google Scholar]
- 4. Firestein GS (2003) Evolving concepts of rheumatoid arthritis. Nature 423: 356–361. [DOI] [PubMed] [Google Scholar]
- 5. Yeh ET, Anderson HV, Pasceri V, Willerson JT (2001) C-reactive protein: linking inflammation to cardiovascular complications. Circulation 104: 974–975. [DOI] [PubMed] [Google Scholar]
- 6. Ridker PM, Buring JE, Shih J, Matias M, Hennekens CH (1998) Prospective study of C-reactive protein and the risk of future cardiovascular events among apparently healthy women. Circulation 98: 731–733. [DOI] [PubMed] [Google Scholar]
- 7. Freeman DJ, Norrie J, Caslake MJ, Gaw A, Ford I, et al. (2002) C-reactive protein is an independent predictor of risk for the development of diabetes in the West of Scotland Coronary Prevention Study. Diabetes 51: 1596–1600. [DOI] [PubMed] [Google Scholar]
- 8. Wee CC, Mukamal KJ, Huang A, Davis RB, McCarthy EP, et al. (2008) Obesity and C-reactive protein levels among white, black, and hispanic US adults. Obesity 16: 875–880. [DOI] [PMC free article] [PubMed] [Google Scholar]
- 9. Yudkin JS, Stehouwer CD, Emeis JJ, Coppack SW (1999) C-reactive protein in healthy subjects: associations with obesity, insulin resistance, and endothelial dysfunction: a potential role for cytokines originating from adipose tissue? Arterioscler Thromb Vasc Biol 19: 972–978. [DOI] [PubMed] [Google Scholar]
- 10. Feghali CA, Wright TM (1997) Cytokines in acute and chronic inflammation. Front Biosci 2: d12–26. [DOI] [PubMed] [Google Scholar]
- 11. Ferrari R (1999) The role of TNF in cardiovascular disease. Pharmacol Res 40: 97–105. [DOI] [PubMed] [Google Scholar]
- 12. Liu Y, Berthier-Schaad Y, Fallin MD, Fink NE, Tracy RP, et al. (2006) IL-6 haplotypes, inflammation, and risk for cardiovascular disease in a multiethnic dialysis cohort. J Am Soc Nephrol 17: 863–870. [DOI] [PubMed] [Google Scholar]
- 13. Kern PA, Saghizadeh M, Ong JM, Bosch RJ, Deem R, et al. (1995) The expression of tumor necrosis factor in human adipose tissue. Regulation by obesity, weight loss, and relationship to lipoprotein lipase. J Clin Invest 95: 2111–2119. [DOI] [PMC free article] [PubMed] [Google Scholar]
- 14. Park EJ, Lee JH, Yu GY, He G, Ali SR, et al. (2010) Dietary and genetic obesity promote liver inflammation and tumorigenesis by enhancing IL-6 and TNF expression. Cell 140: 197–208. [DOI] [PMC free article] [PubMed] [Google Scholar]
- 15. Pickup JC, Chusney GD, Thomas SM, Burt D (2000) Plasma interleukin-6, tumour necrosis factor alpha and blood cytokine production in type 2 diabetes. Life Sci 67: 291–300. [DOI] [PubMed] [Google Scholar]
- 16. Bucher HC, Hengstler P, Schindler C, Meier G (2002) N-3 polyunsaturated fatty acids in coronary heart disease: a meta-analysis of randomized controlled trials. Am J Med 112: 298–304. [DOI] [PubMed] [Google Scholar]
- 17. Villegas R, Xiang Y-B, Elasy T, Li H-L, Yang G, et al. (2011) Fish, shellfish, and long-chain n-3 fatty acid consumption and risk of incident type 2 diabetes in middle-aged Chinese men and women. Am J Clin Nutr 94: 543–551. [DOI] [PMC free article] [PubMed] [Google Scholar]
- 18. Browning LM (2003) n-3 Polyunsaturated fatty acids, inflammation and obesity-related disease. Proc Nutr Soc 62: 447–453. [DOI] [PubMed] [Google Scholar]
- 19. Bowden RG, Wilson RL, Deike E, Gentile M (2009) Fish oil supplementation lowers C-reactive protein levels independent of triglyceride reduction in patients with end-stage renal disease. Nutr Clin Pract 24: 508–512. [DOI] [PubMed] [Google Scholar]
- 20. Zhao YT, Shao L, Teng LL, Hu B, Luo Y, et al. (2009) Effects of n-3 polyunsaturated fatty acid therapy on plasma inflammatory markers and N-terminal pro-brain natriuretic peptide in elderly patients with chronic heart failure. J Int Med Res 37: 1831–1841. [DOI] [PubMed] [Google Scholar]
- 21. Freund-Levi Y, Hjorth E, Lindberg C, Cederholm T, Faxen-Irving G, et al. (2009) Effects of omega-3 fatty acids on inflammatory markers in cerebrospinal fluid and plasma in Alzheimer’s disease: the OmegAD study. Dement Geriatr Cogn Disord 27: 481–490. [DOI] [PubMed] [Google Scholar]
- 22. Sanders TA, Gleason K, Griffin B, Miller GJ (2006) Influence of an algal triacylglycerol containing docosahexaenoic acid (22 : 6n-3) and docosapentaenoic acid (22 : 5n-6) on cardiovascular risk factors in healthy men and women. Br J Nutr 95: 525–531. [DOI] [PubMed] [Google Scholar]
- 23. Rangel-Huerta OD, Aguilera CM, Mesa MD, Gil A (2012) Omega-3 long-chain polyunsaturated fatty acids supplementation on inflammatory biomakers: a systematic review of randomised clinical trials. Br J Nutr 107: S159–S170. [DOI] [PubMed] [Google Scholar]
- 24. Myhrstad MC, Retterstøl K, Telle-Hansen VH, Ottestad I, Halvorsen B, et al. (2011) Effect of marine n-3 fatty acids on circulating inflammatory markers in healthy subjects and subjects with cardiovascular risk factors. Inflamm Res 60: 309–319. [DOI] [PMC free article] [PubMed] [Google Scholar]
- 25. Xin W, Wei W, Li X (2012) Effects of fish oil supplementation on inflammatory markers in chronic heart failure: a meta-analysis of randomized controlled trials. BMC Cardiovasc Disord 12: 77. [DOI] [PMC free article] [PubMed] [Google Scholar]
- 26. Ougrin D (2011) Efficacy of exposure versus cognitive therapy in anxiety disorders: systematic review and meta-analysis. BMC Psychiatry 11: 200. [DOI] [PMC free article] [PubMed] [Google Scholar]
- 27.Higgins JPT, Green S (2011) Cochrane Handbook for Systematic Reviews of Interventions Version 5.1.0 [updated March 2011]. Available: http://www.cochrane-handbook.org. Accessed 5 May 2012.
- 28. Jones RM, Arlidge J, Gillham R, Reagu S, van den Bree M, et al. (2011) Efficacy of mood stabilisers in the treatment of impulsive or repetitive aggression: systematic review and meta-analysis. Br J Psychiatry 198: 93–98. [DOI] [PubMed] [Google Scholar]
- 29. Higgins J, White IR, Anzures-Cabrera J (2008) Meta-analysis of skewed data: Combining results reported on log-transformed or raw scales. Stat Med 27: 6072–6092. [DOI] [PMC free article] [PubMed] [Google Scholar]
- 30. Hozo SP, Djulbegovic B, Hozo I (2005) Estimating the mean and variance from the median, range, and the size of a sample. BMC Med Res Methodol 5: 13. [DOI] [PMC free article] [PubMed] [Google Scholar]
- 31. Cappuccio FP, Kerry SM, Forbes L, Donald A (2004) Blood pressure control by home monitoring: meta-analysis of randomised trials. BMJ 329: 145. [DOI] [PMC free article] [PubMed] [Google Scholar]
- 32. Hooper L, Summerbell CD, Thompson R, Sills D, Roberts FG, et al. (2012) Reduced or modified dietary fat for preventing cardiovascular disease. Cochrane Database Syst Rev 5: CD002137. [DOI] [PMC free article] [PubMed] [Google Scholar]
- 33. Harbord RM, Higgins JP (2008) Meta-regression in Stata. Meta 8: 493–519. [Google Scholar]
- 34. Zheng J-S, Hu X-J, Zhao Y-M, Yang J, Li D (2013) Intake of fish and marine n-3 polyunsaturated fatty acids and risk of breast cancer: meta-analysis of data from 21 independent prospective cohort studies. BMJ 346: f3706. [DOI] [PubMed] [Google Scholar]
- 35. Barbosa DS, Cecchini R, El Kadri MZ, Rodriguez MA, Burini RC, et al. (2003) Decreased oxidative stress in patients with ulcerative colitis supplemented with fish oil omega-3 fatty acids. Nutrition 19: 837–842. [DOI] [PubMed] [Google Scholar]
- 36. Bent S, Bertoglio K, Ashwood P, Bostrom A, Hendren RL (2011) A pilot randomized controlled trial of omega-3 fatty acids for autism spectrum disorder. J Autism Dev Disord 41: 545–554. [DOI] [PMC free article] [PubMed] [Google Scholar]
- 37. Bragt MCE, Mensink RP (2012) Comparison of the effects of n-3 long chain polyunsaturated fatty acids and fenofibrate on markers of inflammation and vascular function, and on the serum lipoprotein profile in overweight and obese subjects. Nutr Metab Cardiovasc Dis 22: 966–973. [DOI] [PubMed] [Google Scholar]
- 38. Browning LM, Krebs JD, Moore CS, Mishra GD, O’Connell MA, et al. (2007) The impact of long chain n-3 polyunsaturated fatty acid supplementation on inflammation, insulin sensitivity and CVD risk in a group of overweight women with an inflammatory phenotype. Diabetes Obes Metab 9: 70–80. [DOI] [PubMed] [Google Scholar]
- 39. Chan DC, Watts GF, Barrett PHR, Beilin LJ, Mori TA (2002) Effect of atorvastatin and fish oil on plasma high-sensitivity C-reactive protein concentrations in individuals with visceral obesity. Clin Chem 48: 877–883. [PubMed] [Google Scholar]
- 40. Ciubotaru I, Lee Y-S, Wander RC (2003) Dietary fish oil decreases C-reactive protein, interleukin-6, and triacylglycerol to HDL-cholesterol ratio in postmenopausal women on HRT. J Nutr Biochem 14: 513–521. [DOI] [PubMed] [Google Scholar]
- 41. Damsgaard CT, Frokiaer H, Andersen AD, Lauritzen L (2008) Fish oil in combination with high or low intakes of linoleic acid lowers plasma triacylglycerols but does not affect other cardiovascular risk markers in healthy men. J Nutr 138: 1061–1066. [DOI] [PubMed] [Google Scholar]
- 42. Daud ZA, Tubie B, Adams J, Quainton T, Osia R, et al. (2012) Effects of protein and omega-3 supplementation, provided during regular dialysis sessions, on nutritional and inflammatory indices in hemodialysis patients. Vasc Health Risk Manag 8: 187–195. [DOI] [PMC free article] [PubMed] [Google Scholar]
- 43. Derosa G, Cicero AFG, Fogari E, D’Angelo A, Bonaventura A, et al. (2012) Effects of n-3 PUFAs on postprandial variation of metalloproteinases, and inflammatory and insulin resistance parameters in dyslipidemic patients: Evaluation with euglycemic clamp and oral fat load. J Clin Lipidol 6: 553–564. [DOI] [PubMed] [Google Scholar]
- 44. Derosa G, Maffioli P, D’Angelo A, Salvadeo SAT, Ferrari I, et al. (2009) Effects of long chain (omega)-3 fatty acids on metalloproteinases and their inhibitors in combined dyslipidemia patients. Expert Opin Pharmacother 10: 1239–1247. [DOI] [PubMed] [Google Scholar]
- 45. Deutsch L (2007) Evaluation of the effect of Neptune Krill Oil on chronic inflammation and arthritic symptoms. J Am Coll Nutr 26: 39–48. [DOI] [PubMed] [Google Scholar]
- 46. Engler MM, Engler MB, Malloy M, Chiu E, Besio D, et al. (2004) Docosahexaenoic acid restores endothelial function in children with hyperlipidemia: results from the EARLY study. Int J Clin Pharmacol Ther 42: 672–679. [DOI] [PubMed] [Google Scholar]
- 47. Faghihi T, Jahed A, Mahmoudi-Gharaei J, Sharifi V, Akhondzadeh S, et al. (2012) Role of Omega-3 fatty acids in preventing metabolic disturbances in patients on olanzapine plus either sodium valproate or lithium: A randomized double-blind placebo-controlled trial. DARU 20: 43. [DOI] [PMC free article] [PubMed] [Google Scholar]
- 48. Faxen Irving G, Freund-Levi Y, Eriksdotter-Jonhagen M, Basun H, Brismar K, et al. (2009) Omega-3 fatty acid supplementation effects on weight and appetite in patients with Alzheimer’s disease: The omega-3 Alzheimer’s disease study. J Am Geriatr Soc 57: 11–17. [DOI] [PubMed] [Google Scholar]
- 49. Fujioka S, Hamazaki K, Itomura M, Huan M, Nishizawa H, et al. (2006) The effects of eicosapentaenoic acid-fortified food on inflammatory markers in healthy subjects–A randomized, placebo-controlled, double-blind study. J Nutr Sci Vitaminol 52: 261–265. [DOI] [PubMed] [Google Scholar]
- 50. Gammelmark A, Madsen T, Varming K, Lundbye-Christensen S, Schmidt EB (2012) Low-dose fish oil supplementation increases serum adiponectin without affecting inflammatory markers in overweight subjects. Nutr Res 32: 15–23. [DOI] [PubMed] [Google Scholar]
- 51. Geelen A, Brouwer IA, Schouten EG, Kluft C, Katan MB, et al. (2004) Intake of n-3 fatty acids from fish does not lower serum concentrations of C-reactive protein in healthy subjects. Eur J Clin Nutr 58: 1440–1442. [DOI] [PubMed] [Google Scholar]
- 52. Jones PJH, Demonty I, Chan YM, Herzog Y, Pelled D (2007) Fish-oil esters of plant sterols differ from vegetable-oil sterol esters in triglycerides lowering, carotenoid bioavailability and impact on plasminogen activator inhibitor-1 (PAI-1) concentrations in hypercholesterolemic subjects. Lipids Health Dis 6: 28. [DOI] [PMC free article] [PubMed] [Google Scholar]
- 53. Kabir M, Skurnik G, Naour N, Pechtner V, Meugnier E, et al. (2007) Treatment for 2 mo with n− 3 polyunsaturated fatty acids reduces adiposity and some atherogenic factors but does not improve insulin sensitivity in women with type 2 diabetes: a randomized controlled study. Am J Clin Nutr 86: 1670–1679. [DOI] [PubMed] [Google Scholar]
- 54. Kiecolt-Glaser JK, Belury MA, Andridge R, Malarkey WB, Glaser R (2011) Omega-3 supplementation lowers inflammation and anxiety in medical students: a randomized controlled trial. Brain Behav Immun 25: 1725–1734. [DOI] [PMC free article] [PubMed] [Google Scholar]
- 55. Kiecolt-Glaser JK, Belury MA, Andridge R, Malarkey WB, Hwang BS, et al. (2012) Omega-3 supplementation lowers inflammation in healthy middle-aged and older adults: a randomized controlled trial. Brain Behav Immun 26: 988–995. [DOI] [PMC free article] [PubMed] [Google Scholar]
- 56. Koh KK, Quon MJ, Shin KC, Lim S, Lee Y, et al. (2012) Significant differential effects of omega-3 fatty acids and fenofibrate in patients with hypertriglyceridemia. Atherosclerosis 220: 537–544. [DOI] [PubMed] [Google Scholar]
- 57. Kolahi S, Ghorbanihaghjo A, Alizadeh S, Rashtchizadeh N, Argani H, et al. (2010) Fish oil supplementation decreases serum soluble receptor activator of nuclear factor-kappa B ligand/osteoprotegerin ratio in female patients with rheumatoid arthritis. Clin Biochem 43: 576–580. [DOI] [PubMed] [Google Scholar]
- 58. Kooshki A, Taleban FA, Tabibi H, Hedayati M (2011) Effects of marine omega-3 fatty acids on serum systemic and vascular inflammation markers and oxidative stress in hemodialysis patients. Ann Nutr Metab 58: 197–202. [DOI] [PubMed] [Google Scholar]
- 59. Krebs JD, Browning LM, McLean NK, Rothwell JL, Mishra GD, et al. (2006) Additive benefits of long-chain n-3 polyunsaturated fatty acids and weight-loss in the management of cardiovascular disease risk in overweight hyperinsulinaemic women. Int J Obes 30: 1535–1544. [DOI] [PubMed] [Google Scholar]
- 60. Krysiak R, Gdula-Dymek A, Okopien B (2011) The effect of bezafibrate and omega-3 fatty acids on lymphocyte cytokine release and systemic inflammation in patients with isolated hypertriglyceridemia. Eur J Clin Pharmacol 67: 1109–1117. [DOI] [PMC free article] [PubMed] [Google Scholar]
- 61. Krysiak R, Gdula-Dymek A, Okopien B (2011) Monocyte-suppressing effect of bezafibrate but not omega-3 fatty acids in patients with isolated hypertriglyceridaemia. Basic Clin Pharmacol Toxicol 109: 23–29. [DOI] [PubMed] [Google Scholar]
- 62. Krysiak R, Gdula-Dymek A, Okopien B (2012) Omega-3 fatty acids enhance monocyte-suppressing effect of bezafibrate in patients with isolated hypertriglyceridemia. Eur J Intern Med 23: e171–172. [DOI] [PubMed] [Google Scholar]
- 63. Krysiak R, Gdula-Dymek A, Okopien B (2012) Lymphocyte-suppressing effects of omega-3 fatty acids in bezafibrate-treated patients with isolated hypertriglyceridemia. Eur J Intern Med 23: e166–167. [DOI] [PubMed] [Google Scholar]
- 64. Lenn J, Uhl T, Mattacola C, Boissonneault G, Yates J, et al. (2002) The effects of fish oil and isoflavones on delayed onset muscle soreness. Med Sci Sports Exerc 34: 1605–1613. [DOI] [PubMed] [Google Scholar]
- 65. Mackay I, Ford I, Thies F, Fielding S, Bachoo P, et al. (2012) Effect of Omega-3 fatty acid supplementation on markers of platelet and endothelial function in patients with peripheral arterial disease. Atherosclerosis 221: 514–520. [DOI] [PubMed] [Google Scholar]
- 66. Madsen T, Christensen JH, Blom M, Schmidt EB (2003) The effect of dietary n-3 fatty acids on serum concentrations of C-reactive protein: A dose-response study. Br J Nutr 89: 517–522. [DOI] [PubMed] [Google Scholar]
- 67. Madsen T, Schmidt EB, Christensen JH (2007) The effect of n-3 fatty acids on C-reactive protein levels in patients with chronic renal failure. J Ren Nutr 17: 258–263. [DOI] [PubMed] [Google Scholar]
- 68. Malekshahi Moghadam A, Saedisomeolia A, Djalali M, Djazayery A, Pooya S, et al. (2012) Efficacy of omega-3 fatty acid supplementation on serum levels of tumour necrosis factor-alpha, C-reactive protein and interleukin-2 in type 2 diabetes mellitus patients. Singapore Med J 53: 615–619. [PubMed] [Google Scholar]
- 69. Mann NJ, O’Connell SL, Baldwin KM, Singh I, Meyer BJ (2010) Effects of seal oil and tuna-fish oil on platelet parameters and plasma lipid levels in healthy subjects. Lipids 45: 669–681. [DOI] [PubMed] [Google Scholar]
- 70. Mocking RJT, Assies J, Bot M, Jansen EHJM, Schene AH, et al. (2012) Biological Effects of Add-On Eicosapentaenoic Acid Supplementation in Diabetes Mellitus and Co-Morbid Depression: A Randomized Controlled Trial. Plos One 7: e49431. [DOI] [PMC free article] [PubMed] [Google Scholar]
- 71. Moertl D, Hammer A, Steiner S, Hutuleac R, Vonbank K, et al. (2011) Dose-dependent effects of omega-3-polyunsaturated fatty acids on systolic left ventricular function, endothelial function, and markers of inflammation in chronic heart failure of nonischemic origin: a double-blind, placebo-controlled, 3-arm study. Am Heart J 161 915: e1–9. [DOI] [PubMed] [Google Scholar]
- 72. Mohammadi E, Rafraf M, Farzadi L, Asghari-Jafarabadi M, Sabour S (2012) Effects of omega-3 fatty acids supplementation on serum adiponectin levels and some metabolic risk factors in women with polycystic ovary syndrome. Asia Pac J Clin Nutr 21: 511–518. [PubMed] [Google Scholar]
- 73. Mori TA, Burke V, Puddey I, Irish A, Cowpland CA, et al. (2009) The effects of [omega]3 fatty acids and coenzyme Q10 on blood pressure and heart rate in chronic kidney disease: a randomized controlled trial. J Hypertens 27: 1863–1872. [DOI] [PubMed] [Google Scholar]
- 74. Mori TA, Woodman RJ, Burke V, Puddey IB, Croft KD, et al. (2003) Effect of eicosapentaenoic acid and docosahexaenoic acid on oxidative stress and inflammatory markers in treated-hypertensive type 2 diabetic subjects. Free Radic Biol Med 35: 772–781. [DOI] [PubMed] [Google Scholar]
- 75. Munro IA, Garg ML (2012) Dietary supplementation with n-3 PUFA does not promote weight loss when combined with a very-low-energy diet. Br J Nutr 108: 1466–1474. [DOI] [PubMed] [Google Scholar]
- 76. Murphy KJ, Meyer BJ, Mori TA, Burke V, Mansour J, et al. (2007) Impact of foods enriched with n-3 long-chain polyunsaturated fatty acids on erythrocyte n-3 levels and cardiovascular risk factors. Br J Nutr 97: 749–757. [DOI] [PubMed] [Google Scholar]
- 77. Nodari S, Metra M, Milesi G, Manerba A, Cesana BM, et al. (2009) The role of n-3 PUFAs in preventing the arrhythmic risk in patients with idiopathic dilated cardiomyopathy. Cardiovasc Drugs Ther 23: 5–15. [DOI] [PubMed] [Google Scholar]
- 78. Nodari S, Triggiani M, Campia U, Manerba A, Milesi G, et al. (2011) Effects of n-3 polyunsaturated fatty acids on left ventricular function and functional capacity in patients with dilated cardiomyopathy. J Am Coll Cardiol 57: 870–879. [DOI] [PubMed] [Google Scholar]
- 79. Ottestad I, Vogt G, Retterstol K, Myhrstad MC, Haugen JE, et al. (2012) Oxidised fish oil does not influence established markers of oxidative stress in healthy human subjects: A randomised controlled trial. Br J Nutr 108: 315–326. [DOI] [PubMed] [Google Scholar]
- 80. Pooya S, Jalali MD, Jazayery AD, Saedisomeolia A, Eshraghian MR, et al. (2010) The efficacy of omega-3 fatty acid supplementation on plasma homocysteine and malondialdehyde levels of type 2 diabetic patients. Nutr Metab Cardiovasc Dis 20: 326–331. [DOI] [PubMed] [Google Scholar]
- 81. Pot GK, Brouwer IA, Enneman A, Rijkers GT, Kampman E, et al. (2009) No effect of fish oil supplementation on serum inflammatory markers and their interrelationships: a randomized controlled trial in healthy, middle-aged individuals. Eur J Clin Nutr 63: 1353–1359. [DOI] [PubMed] [Google Scholar]
- 82. Rizza S, Tesauro M, Cardillo C, Galli A, Iantorno M, et al. (2009) Fish oil supplementation improves endothelial function in normoglycemic offspring of patients with type 2 diabetes. Atherosclerosis 206: 569–574. [DOI] [PMC free article] [PubMed] [Google Scholar]
- 83. Sabour H, Larijani B, Vafa MR, Hadian MR, Heshmat R, et al. (2012) The effects of n-3 fatty acids on inflammatory cytokines in osteoporotic spinal cord injured patients: A randomized clinical trial. J Res Med Sci 17: 322–327. [PMC free article] [PubMed] [Google Scholar]
- 84. Saifullah A, Watkins BA, Saha C, Li Y, Moe SM, et al. (2007) Oral fish oil supplementation raises blood omega-3 levels and lowers C-reactive protein in haemodialysis patients–a pilot study. Nephrol Dial Transplant 22: 3561–3567. [DOI] [PubMed] [Google Scholar]
- 85. Shahbakhti H, Watson RE, Azurdia RM, Ferreira CZ, Garmyn M, et al. (2004) Influence of eicosapentaenoic acid, an omega-3 fatty acid, on ultraviolet-B generation of prostaglandin-E2 and proinflammatory cytokines interleukin-1 beta, tumor necrosis factor-alpha, interleukin-6 and interleukin-8 in human skin in vivo. Photochem Photobiol 80: 231–235. [DOI] [PubMed] [Google Scholar]
- 86. Skulas-Ray AC, Kris-Etherton PM, Harris WS, Vanden Heuvel JP, Wagner PR, et al. (2011) Dose-response effects of omega-3 fatty acids on triglycerides, inflammation, and endothelial function in healthy persons with moderate hypertriglyceridemia. Am J Clin Nutr 93: 243–252. [DOI] [PMC free article] [PubMed] [Google Scholar]
- 87. Theobald HE, Goodall AH, Sattar N, Talbot DC, Chowienczyk PJ, et al. (2007) Low-dose docosahexaenoic acid lowers diastolic blood pressure in middle-aged men and women. J Nutr 137: 973–978. [DOI] [PubMed] [Google Scholar]
- 88. Thusgaard M, Christensen JH, Morn B, Andersen TS, Vige R, et al. (2009) Effect of fish oil (n-3 polyunsaturated fatty acids) on plasma lipids, lipoproteins and inflammatory markers in HIV-infected patients treated with antiretroviral therapy: A randomized, double-blind, placebo-controlled study. Scand J Infect Dis 41: 760–766. [DOI] [PubMed] [Google Scholar]
- 89. Tierney AC, McMonagle J, Shaw DI, Gulseth HL, Helal O, et al. (2011) Effects of dietary fat modification on insulin sensitivity and on other risk factors of the metabolic syndrome–LIPGENE: a European randomized dietary intervention study. Int J Obes 35: 800–809. [DOI] [PubMed] [Google Scholar]
- 90. Vega-Lopez S, Kaul N, Devaraj S, Cai RY, German B, et al. (2004) Supplementation with (omega)3 Polyunsaturated Fatty Acids and all-rac Alpha-Tocopherol Alone and in Combination Failed to Exert an Anti-inflammatory Effect in Human Volunteers. Metabolism 53: 236–240. [DOI] [PubMed] [Google Scholar]
- 91. Watanabe N, Watanabe Y, Kumagai M, Fujimoto K (2009) Administration of dietary fish oil capsules in healthy middle-aged Japanese men with a high level of fish consumption. Int J Food Sci Nutr 60 Suppl 5136–142. [DOI] [PubMed] [Google Scholar]
- 92. Wong CY, Yiu KH, Li SW, Lee S, Tam S, et al. (2010) Fish-oil supplement has neutral effects on vascular and metabolic function but improves renal function in patients with Type 2 diabetes mellitus. Diabet Med 27: 54–60. [DOI] [PubMed] [Google Scholar]
- 93. Wright SA, O’Prey FM, McHenry MT, Leahey WJ, Devine AB, et al. (2008) A randomised interventional trial of omega-3-polyunsaturated fatty acids on endothelial function and disease activity in systemic lupus erythematosus. Ann Rheum Dis 67: 841–848. [DOI] [PubMed] [Google Scholar]
- 94. Chiang YL, Haddad E, Rajaram S, Shavlik D, Sabate J (2012) The effect of dietary walnuts compared to fatty fish on eicosanoids, cytokines, soluble endothelial adhesion molecules and lymphocyte subsets: A randomized, controlled crossover trial. Prostaglandins Leukot Essent Fatty Acids 87: 111–117. [DOI] [PubMed] [Google Scholar]
- 95. De Mello VDF, Erkkila AT, Schwab US, Pulkkinen L, Kolehmainen M, et al. (2009) The effect of fatty or lean fish intake on inflammatory gene expression in peripheral blood mononuclear cells of patients with coronary heart disease. Eur J Nutr 48: 447–455. [DOI] [PubMed] [Google Scholar]
- 96. Lindqvist H, Langkilde AM, Undeland I, Radendal T, Sandberg AS (2007) Herring (Clupea harengus) supplemented diet influences risk factors for CVD in overweight subjects. Eur J Clin Nutr 61: 1106–1113. [DOI] [PubMed] [Google Scholar]
- 97. Ramel A, Martinez JA, Kiely M, Bandarra NM, Thorsdottir I (2010) Effects of weight loss and seafood consumption on inflammation parameters in young, overweight and obese European men and women during 8 weeks of energy restriction. Eur J Clin Nutr 64: 987–993. [DOI] [PubMed] [Google Scholar]
- 98. Zhang J, Wang C, Li L, Man Q, Meng L, et al. (2012) Dietary inclusion of salmon, herring and pompano as oily fish reduces CVD risk markers in dyslipidaemic middle-aged and elderly Chinese women. Br J Nutr 108: 1455–1465. [DOI] [PubMed] [Google Scholar]
- 99. Xu HE, Lambert MH, Montana VG, Parks DJ, Blanchard SG, et al. (1999) Molecular recognition of fatty acids by peroxisome proliferator-activated receptors. Mol Cell 3: 397–403. [DOI] [PubMed] [Google Scholar]
- 100. Houseknecht KL, Cole BM, Steele PJ (2002) Peroxisome proliferator-activated receptor gamma (PPARgamma) and its ligands: a review. Domest Anim Endocrinol 22: 1–23. [DOI] [PubMed] [Google Scholar]
- 101. Rossi A, Kapahi P, Natoli G, Takahashi T, Chen Y, et al. (2000) Anti-inflammatory cyclopentenone prostaglandins are direct inhibitors of IkappaB kinase. Nature 403: 103–108. [DOI] [PubMed] [Google Scholar]
- 102. Robinson LE, Buchholz AC, Mazurak VC (2007) Inflammation, obesity, and fatty acid metabolism: influence of n-3 polyunsaturated fatty acids on factors contributing to metabolic syndrome. Appl Physiol Nutr Metab 32: 1008–1024. [DOI] [PubMed] [Google Scholar]
- 103. Beg AA, Finco TS, Nantermet PV, Baldwin AS Jr (1993) Tumor necrosis factor and interleukin-1 lead to phosphorylation and loss of I kappa B alpha: a mechanism for NF-kappa B activation. Mol Cell Biol 13: 3301–3310. [DOI] [PMC free article] [PubMed] [Google Scholar]
- 104. Mogensen TH, Melchjorsen J, Hollsberg P, Paludan SR (2003) Activation of NF-kappa B in virus-infected macrophages is dependent on mitochondrial oxidative stress and intracellular calcium: Downstream involvement of the kinases TGF-beta-activated kinase 1, mitogen-activated kinase/extracellular signal-regulated kinase kinase 1, and I kappa B kinase. J Immunol 170: 6224–6233. [DOI] [PubMed] [Google Scholar]
- 105. Mori TA, Woodman RJ (2006) The independent effects of eicosapentaenoic acid and docosahexaenoic acid on cardiovascular risk factors in humans. Curr Opin Clin Nutr Metab Care 9: 95–104. [DOI] [PubMed] [Google Scholar]
- 106. Schmitz G, Ecker J (2008) The opposing effects of n-3 and n-6 fatty acids. Prog Lipid Res 47: 147–155. [DOI] [PubMed] [Google Scholar]
- 107. Camandola S, Leonarduzzi G, Musso T, Varesio L, Carini R, et al. (1996) Nuclear factor kB is activated by arachidonic acid but not by eicosapentaenoic acid. Biochem Biophys Res Commun 229: 643–647. [DOI] [PubMed] [Google Scholar]
- 108. Carrillo C, Alonso-Torre S (2011) Role of oleic acid in immune system; mechanism of action; a review. Nutr Hosp 27: 978–990. [DOI] [PubMed] [Google Scholar]
- 109. Katan M, Deslypere J, Van Birgelen A, Penders M, Zegwaard M (1997) Kinetics of the incorporation of dietary fatty acids into serum cholesteryl esters, erythrocyte membranes, and adipose tissue: an 18-month controlled study. J Lipid Res 38: 2012–2022. [PubMed] [Google Scholar]
- 110. Garaulet M, Pérez-Llamas F, Pérez-Ayala M, Martínez P, de Medina FS, et al. (2001) Site-specific differences in the fatty acid composition of abdominal adipose tissue in an obese population from a Mediterranean area: relation with dietary fatty acids, plasma lipid profile, serum insulin, and central obesity. Am J Clin Nutr 74: 585–591. [DOI] [PubMed] [Google Scholar]
- 111. Calder P (2003) Long-chain n-3 fatty acids and inflammation: potential application in surgical and trauma patients. Braz J Med Biol Res 36: 433–446. [DOI] [PubMed] [Google Scholar]
- 112. Calder PC (2006) n−3 polyunsaturated fatty acids, inflammation, and inflammatory diseases. Am J Clin Nutr 83: S1505–1519S. [DOI] [PubMed] [Google Scholar]
- 113. Rodrigo R, Gutiérrez R, Fernández R, Guzmán P (2012) Ageing improves the antioxidant response against postoperative atrial fibrillation: a randomized controlled trial. Interact Cardiovasc Thorac Surg 15: 209–214. [DOI] [PMC free article] [PubMed] [Google Scholar]
- 114. Rees D, Miles EA, Banerjee T, Wells SJ, Roynette CE, et al. (2006) Dose-related effects of eicosapentaenoic acid on innate immune function in healthy humans: a comparison of young and older men. Am J Clin Nutr 83: 331–342. [DOI] [PubMed] [Google Scholar]
- 115. Meydani M, Natiello F, Goldin B, Free N, Woods M, et al. (1991) Effect of long-term fish oil supplementation on vitamin E status and lipid peroxidation in women. J Nutr 121: 484–491. [DOI] [PubMed] [Google Scholar]
- 116. Bolton-Smith C, Woodward M, Tavendale R (1997) Evidence for age-related differences in the fatty acid composition of human adipose tissue, independent of diet. Eur J Clin Nutr 51: 619–624. [DOI] [PubMed] [Google Scholar]
- 117. Cartier A, Côté M, Lemieux I, Pérusse L, Tremblay A, et al. (2009) Age-related differences in inflammatory markers in men: contribution of visceral adiposity. Metabolism 58: 1452–1458. [DOI] [PubMed] [Google Scholar]
- 118. Bhattacharya A, Sun D, Rahman M, Fernandes G (2007) Different ratios of eicosapentaenoic and docosahexaenoic omega-3 fatty acids in commercial fish oils differentially alter pro-inflammatory cytokines in peritoneal macrophages from C57BL/6 female mice. J Nutr Biochem 18: 23–30. [DOI] [PubMed] [Google Scholar]
- 119. Conquer JA, Holub BJ (1997) Dietary docosahexaenoic acid as a source of eicosapentaenoic acid in vegetarians and omnivores. Lipids 32: 341–345. [DOI] [PubMed] [Google Scholar]
- 120. Sierra S, Lara-Villoslada F, Comalada M, Olivares M, Xaus J (2008) Dietary eicosapentaenoic acid and docosahexaenoic acid equally incorporate as decosahexaenoic acid but differ in inflammatory effects. Nutrition 24: 245–254. [DOI] [PubMed] [Google Scholar]
- 121. Feghali CA, Wright TM (1997) Cytokines in acute and chronic inflammation. Front Biosci 2: d12–26. [DOI] [PubMed] [Google Scholar]
- 122. Maes M, Mihaylova I, Kubera M, Bosmans E (2007) Why fish oils may not always be adequate treatments for depression or other inflammatory illnesses: docosahexaenoic acid, an omega-3 polyunsaturated fatty acid, induces a Th-1-like immune response. Neuro Endocrinol Lett 28: 875–880. [PubMed] [Google Scholar]
- 123. Eschen O, Christensen JH, La Rovere M, Romano P, Sala P, et al. (2010) Effects of marine n-3 fatty acids on circulating levels of soluble adhesion molecules in patients with chronic heart failure. Cell Mol Biol 56: 45. [PubMed] [Google Scholar]
- 124. Mehra MR, Lavie CJ, Ventura HO, Milani RV (2006) Fish oils produce anti-inflammatory effects and improve body weight in severe heart failure. J Heart Lung Transplant 25: 834–838. [DOI] [PubMed] [Google Scholar]
- 125. O’Keefe Jr JH, Abuissa H, Sastre A, Steinhaus DM, Harris WS (2006) Effects of omega-3 fatty acids on resting heart rate, heart rate recovery after exercise, and heart rate variability in men with healed myocardial infarctions and depressed ejection fractions. Am J Cardiol 97: 1127–1130. [DOI] [PubMed] [Google Scholar]
Associated Data
This section collects any data citations, data availability statements, or supplementary materials included in this article.
Supplementary Materials
Judgements about each risk of bias item presented as percentages across all included studies.
(PDF)
Judgements about each risk of bias item for each included study. Red ball, high risk of bias; yellow ball, unclear risk of bias; green ball, no risk of bias.
(PDF)
Funnel plot for publication bias (n-3 PUFAs supplementation and IL-6 in chronic non-autoimmune disease). SE, standard error; WMD, weighted mean difference.
(TIF)
Funnel plot for publication bias (n-3 PUFAs supplementation and CRP in chronic non-autoimmune disease). SE, standard error; WMD, weighted mean difference.
(TIF)
Funnel plot for publication bias (n-3 PUFAs supplementation and TNF-α in chronic non-autoimmune disease). SE, standard error; WMD, weighted mean difference.
(TIF)
Funnel plot for publication bias (n-3 PUFAs from dietary intake and CRP in chronic non-autoimmune disease). SE, standard error; WMD, weighted mean difference.
(TIF)
Funnel plot for publication bias (n-3 PUFAs from dietary intake and IL-6 in chronic non-autoimmune disease). SE, standard error; WMD, weighted mean difference.
(TIF)
Funnel plot for publication bias (n-3 PUFAs supplementation and CRP in healthy subjects). SE, standard error; WMD, weighted mean difference.
(TIF)
Funnel plot for publication bias (n-3 PUFAs supplementation and IL-6 in healthy subjects). SE, standard error; WMD, weighted mean difference.
(TIF)
Baseline of inflammatory markers (log-transformed) and mean changes of phospholipid n-3 PUFAs in plasma/serum.
(DOC)
PRISMA checklist.
(DOC)
Protocol for meta-analysis to assess the effect of marine-derived n-3 polyunsaturated fatty acids on CRP, IL-6 and TNF-α.
(DOC)


