Abstract
We describe a nitrogenase gene sequence database that facilitates analysis of the evolution and ecology of nitrogen-fixing organisms. The database contains 32 954 aligned nitrogenase nifH sequences linked to phylogenetic trees and associated sequence metadata. The database includes 185 linked multigene entries including full-length nifH, nifD, nifK and 16S ribosomal RNA (rRNA) gene sequences. Evolutionary analyses enabled by the multigene entries support an ancient horizontal transfer of nitrogenase genes between Archaea and Bacteria and provide evidence that nifH has a different history of horizontal gene transfer from the nifDK enzyme core. Further analyses show that lineages in nitrogenase cluster I and cluster III have different rates of substitution within nifD, suggesting that nifD is under different selection pressure in these two lineages. Finally, we find that that the genetic divergence of nifH and 16S rRNA genes does not correlate well at sequence dissimilarity values used commonly to define microbial species, as stains having <3% sequence dissimilarity in their 16S rRNA genes can have up to 23% dissimilarity in nifH. The nifH database has a number of uses including phylogenetic and evolutionary analyses, the design and assessment of primers/probes and the evaluation of nitrogenase sequence diversity.
Database URL: http://www.css.cornell.edu/faculty/buckley/nifh.htm
Introduction
Biological nitrogen fixation contributes around half of annual nitrogen inputs into the biosphere (1) and is an important source of nitrogen in natural ecosystems (2) and also in agricultural systems (3, 4). Biological nitrogen fixation is catalyzed by nitrogenase, a complex enzyme that has two components, a heterotetrameric core encoded by nifD and nifK, and a dinitrogenase reductase subunit encoded by nifH (5). Dinitrogenase reductase transfers reducing equivalents to the core enzyme complex where those reducing equivalents are used to convert N2 into NH3 equivalents. The nifH gene is the biomarker most widely used to study the ecology and evolution of nitrogen-fixing bacteria (6). Surveys of nifH diversity have been conducted in a wide range of environments including various marine (7–9), terrestrial (10–12) and hydrothermal sites (13) among others. The diversity of nitrogen-fixing organisms varies dramatically across habitats with different habitats selecting for different groups of nitrogen-fixing organisms (14, 15).
Homologs of the nifH gene can be divided into five main phylogenetic clusters (16). Cluster I contains a diverse group of nifH genes primarily from aerobic and facultatively anaerobic organisms that belong to phyla including Proteobacteria, Cyanobacteria, Firmicutes and Actinobacteria. Cluster III contains nifH genes that are almost exclusively found in obligate anaerobes including methanogenic Archaea, Treponema, Clostridium and sulfate-reducing and sulfur-reducing species of Deltaproteobacteria. Cluster II contains anfH, alternative nitrogenases that are paralogs of nifH and use an Fe–Fe cofactor in place of the Fe–Mo cofactor used by nifH (17). There also exist V–Fe alternative nitrogenases encoded by vnfH. The alternative nitrogenases appear to be found only in the genomes of organisms that also contain nif genes (17). Clusters IV and V contain paralogous genes that do not participate in nitrogen fixation (6, 18–21).
Analyses of microbial gene sequences that serve as functional biomarkers are facilitated by the availability of annotated databases of aligned sequences. Aligned sequences are required for phylogenetic analyses [e.g. (6, 22–24)], diversity analyses [e.g. (15)] and the design and evaluation of polymerase chain reaction (PCR) primers and probes [e.g. (25, 26)]. Universal and group-specific PCR primers are used in quantitative real-time PCR for the quantification of gene copy numbers in the environment [e.g. (27–29)], for expression studies (30) or for tracking organisms [e.g. (27, 31)]. Hence, many contemporary techniques in molecular microbial ecology require PCR and specific primers, which must be designed and evaluated using annotated sequence databases.
There is strong demand for the creation of a centralized, well-described, aligned and vetted nifH database. Similar databases of 16S ribosomal RNA (rRNA) gene sequences have been of great utility in the field of microbial ecology (32–34). In this work, we describe a comprehensive nifH database, a multipurpose tool to facilitate the work of researchers who use sequence-based techniques to study nitrogen-fixing bacteria. The database is implemented in the ARB software package (35) that allows for the compilation and association of aligned sequence data, sequence metadata and phylogenetic trees. Phylogenetic trees can be used to navigate the sequences and to explore phylogenetic patterns found in associated metadata. Preliminary versions of this nifH database, one containing 16 989 and another 23 843 sequences, were used to evaluate the diversity of nifH genes in different environments (15) and to evaluate PCR primers used in environmental surveys of nifH diversity (25). Here we release an updated nifH database containing 32 954 aligned nifH sequences and homologs along with guide trees. The new release also incorporates nifD, nifK and 16S rRNA genes from 185 sequenced genomes. These new data layers facilitate improved evolutionary analysis and enable assessment of ancestral patterns of horizontal gene exchange. In addition, the availability of full-length multigene sequence entries in the database, organized in a phylogenetic framework, will be of utility for the analysis of nitrogenase gene sequences recovered from metagenomic studies. The database and its associated description will be useful for studying the evolution, phylogeny and diversity of nitrogen-fixing bacteria.
Database construction and analysis
The database comprises all nifH sequences available in the Genbank nucleotide database as of 16 May 2012. The majority of sequences are derived from environmental surveys of nifH, although the database also contains sequences obtained from a range of isolates. Sequence alignment was performed using the ARB integrated aligner used through an iterative process to generate a nucleotide alignment consistent with the Pfam (36) Fer4_NifH amino acid alignment. The Pfam Fer4_NifH (PF00142) alignment was used as an alignment template, reverse translated and imported into the ARB environment. This alignment template was used to generate a seed alignment consisting of a wide phylogenetic diversity of full-length and near full-length nifH nucleotide sequences from Genbank. The reverse-translated sequences were then deleted from the database, the seed alignment was manually vetted and then this seed alignment was used to complete the alignment of all remaining sequences with the ARB-integrated aligner. The final alignment was vetted manually, and low-quality sequences were removed.
Multigene database entries for nifH, nifD, nifK and 16S rRNA genes were generated using data from sequenced genomes. Aligned nucleic acid sequences were imported into ARB and merged as separate alignments linked to their corresponding nifH records. For import of the 16S rRNA gene sequences, we used the Greengenes (34) alignment, which allowed us to import the 16S rRNA helix data from the Greengenes ARB database. Alignments for NifD and NifK were generated using Clustal (37). The database may be downloaded in ARB database format at (http://www.css.cornell.edu/faculty/buckley/nifH_database_2012.arb), and a flat text version of the database that contains only aligned nifH sequences is also available (http://www.css.cornell.edu/faculty/buckley/nifH_database_2012.fasta).
Analyses of sequence characteristics and metadata were performed in ARB. Sequence lengths and G + C content were calculated using the ARB Node Display Setup. The start and end positions of sequences were calculated using the nifH gene of Azotobacter vinelandii (Genbank ACCN number M20568) as the reference sequence to provide sequence position. Sequence metadata was analyzed using the search and query function of ARB. Environmental categories were defined by the isolation source for specific sequences. Sequences belonging to the individual environmental categories are saved as configurations in the ARB nifH database and can be evaluated with respect to sequence phylogeny. There were 4759 sequences that lacked metadata relating to isolation source.
Evolutionary distances (Ed) were calculated in ARB without distance correction or weighting. A column filter was developed to mask nucleotides for which position homology could not be determined, and this filter is available within the nifH database. Phylogenetic trees were constructed by neighbor-joining analysis of nucleotide alignments using Jukes–Cantor distance correction and a column filter to remove positions of uncertain homology. All trees are available in the nifH database. The database contains a large phylogenetic tree for the purpose of database navigation and sequence selection. This guide tree contains nonoverlapping sequences, and it was generated by first constructing a neighbor-joining tree using all available overlapping sequences and then inserting partial sequences using the quick add by parsimony feature of ARB. All statistical analyses were performed using The R Project for Statistical Computing (38).
Analysis of database content
The database consists of 32 954 aligned sequences, the majority of which are nifH, although we have included some paralogous sequences for reference purposes. The nifH gene is one of the most heavily sequenced functional genes (Supplementary Figure S1) and >90% of nifH sequences in the database have been deposited since 2005 (Supplementary Figure S2). There are 375 full-length nifH genes in the database including 245 from sequenced genomes. The full-length nifH sequences represent 294 different strains and 222 different species. The majority of sequences have been determined from amplified fragments of the nifH gene, although the database also contains shotgun metagenome reads deposited in the Genbank nucleotide database.
The main phylogenetic tree associated with the database contains 32 931 sequences. There are 7030 sequences (21.35% of the total database) in nifH cluster III and subcluster IA (Supplementary Figure S6), the clusters that contain primarily obligate anaerobes. There are 24 799 sequences (75.31%) in nifH cluster I, which contains primarily aerobes and facultative anaerobes. The database also contains 578 sequences (1.76%) in nifH cluster II that comprises the iron-dependent alternative nitrogenase cluster, and 524 sequences in cluster IV that contains genes not functionally associated with nitrogenase.
Sequences in the database are derived from 1211 studies (Supplementary Figure S3), each contributing between 1 and 1299 sequences to the database. There are 584 studies that contributed only 1 sequence (48% of the total number of studies and 1.8% of the sequences in the database), and these represent sequences that originate from isolated strains. There are two studies contributing 1299 and 1297 sequences that originate from an analysis of nitrogen-fixing organisms associated with maize (10), while a study with 1257 sequences focused on coastal microbial mats (39). The 10 studies that contributed the most sequences account for 8516 sequences in total (26% of all sequences in the database), and the top 35 studies contributed 50% of all sequences.
These diverse studies have used a range of PCR primers to amplify nifH from environmental samples, and as a consequence, the nifH sequences in the database have a wide range of lengths. The mode fragment length for nifH gene sequences in the database is 324 bases (Figure 1). We have identified the frequency of different sequence start and end positions within the database. The most common start position for nifH primers is at ∼114 bases from the start codon, and the most common stop position at ∼459 bases from the start codon (Figure 2). The distance between the two most abundant start positions as well as stop positions (Figure 2) is 18 and 17 bases, which corresponds to the length of a primer, suggesting that in many cases primer sequences have not been trimmed from deposited sequences.
Figure 1.
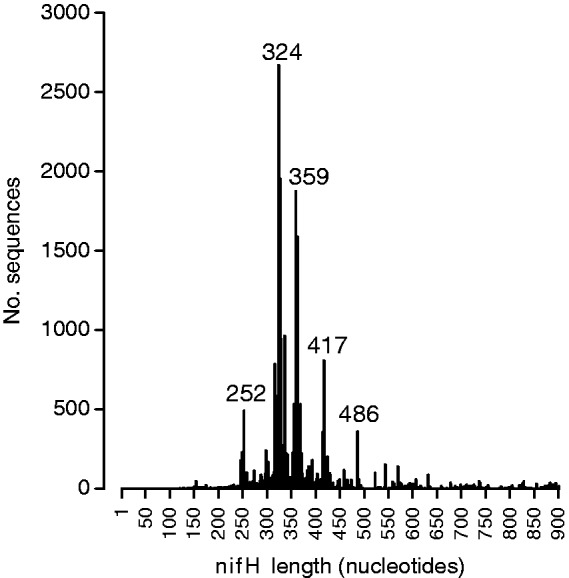
Number of nifH sequences in the database as a function of their length. The values of sequence length that are most frequent are labeled in the figure.
Figure 2.
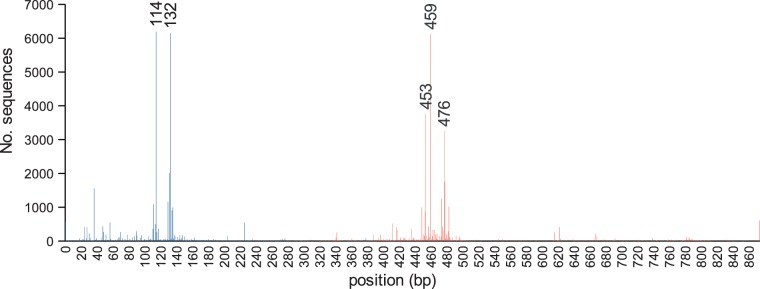
Count of start (blue) and stop (red) positions for the nifH sequences in the database. Nucleotide positions are numbered relative to the A. vinelandii nifH gene (Genbank ACCN number M20568).
The nifH sequence representation varies greatly with respect to environmental origin (Supplementary Table S1). The environments represented by the most sequences are terrestrial (17 340) and marine (5958). Sequences from agricultural systems (7308) are represented heavily in the database. A total of 3082 nifH sequences have been reported from soils used for cultivation of maize, whereas 854 have been reported from soils used for cultivation of rice. Other terrestrial environments that have been sampled for nifH sequences include forests (2534 sequences) and grasslands (416 sequences). In addition, 978 nifH sequences are reported from freshwater environments such as lakes and rivers. Major anoxic environments from which nifH sequences have been sampled include microbial mats, flooded rice paddy soils, wetlands, sediments and termite guts. There are 19 445 sequence records (59% of the 32 954 total sequences) that document country of origin. It is clear that current sampling efforts underrepresent Africa and Oceana relative to other regions (Supplementary Figure S4A). Two studies of Brazilian maize (12) account for 79% of the sequences from South America. Of the top 10 countries for which sequences are available, the Netherlands (3502) and Brazil (3261) are most highly represented (Supplementary Figure S4B).
The mean G + C content for all nifH gene sequences in the database is 56.8%; however, the G + C content distribution of the nifH gene fragments is bimodal (Supplementary Figure S5). The number of sequences in the lower part of the distribution (G + C content of ≤53%) is 9543 and represents 29% of the nifH sequences in the database (Supplementary Figure S6). The low G + C content sequences primarily comprise Cyanobacteria (5157 sequences) and Firmicutes (887 sequences). Both of these phylogenetic groups are well known to contain organisms with low genome G + C content. The low G + C sequences also include some Proteobacteria (1361 sequences), cluster II sequences (330 sequences) and cluster IV sequences (254 sequences).
Analysis of multigene entries
Comparative analyses of nifH, nifD and nifK
The database contains 185 multigene entries composed of nifH, nifD, nifK and 16S rRNA genes. These multigene database entries were used to analyze the G + C content and Ed for nif genes. A linear relationship was observed between genome G + C content and nif gene G + C content (Figure 3; the R2 is 0.93, 0.92 and 0.90 for nifH, nifD and nifK, respectively), and outliers indicative of recent horizontal gene transfer were not observed (Figure 3).
Figure 3.
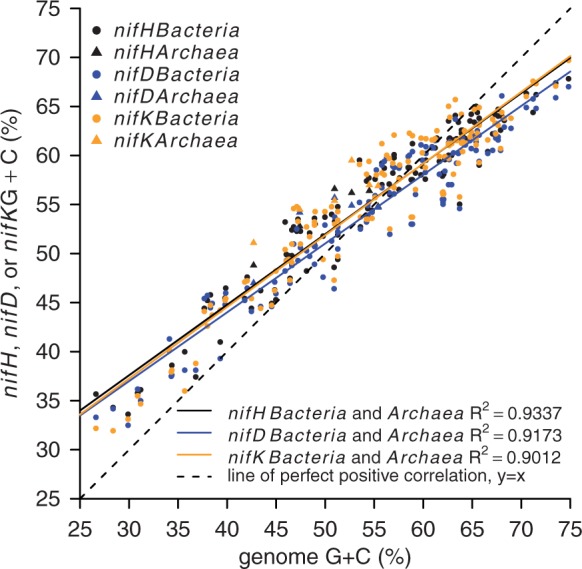
Sequence G + C content for complete genomes and the G + C content of corresponding nifH, nifD and nifK genes for 6 Archaea and 131 Bacteria. Colors represent different genes, and symbols indicate Bacteria and Archaea as shown in the figure legend.
Ed values for the nifHDK genes from the 185 genomes were determined (Figure 4). Divergent patterns of Ed provide evidence for horizontal transfer and mutation rate variation between genes (40). The inter-cluster (cluster I relative to cluster III) divergence of nifH was less than expected relative to the pattern of intracluster divergence for either nifD (Figure 4A) or nifK (Figure 4B). In contrast, inter-cluster divergence of nifD and nifK corresponded well with intra-cluster patterns of divergence (Figure 4C). These data suggest the presence of an ancient horizontal gene transfer of nifH between cluster I and cluster III diazotrophs (Figure 4A and B), which did not involve transfer of nifDK.
Figure 4.
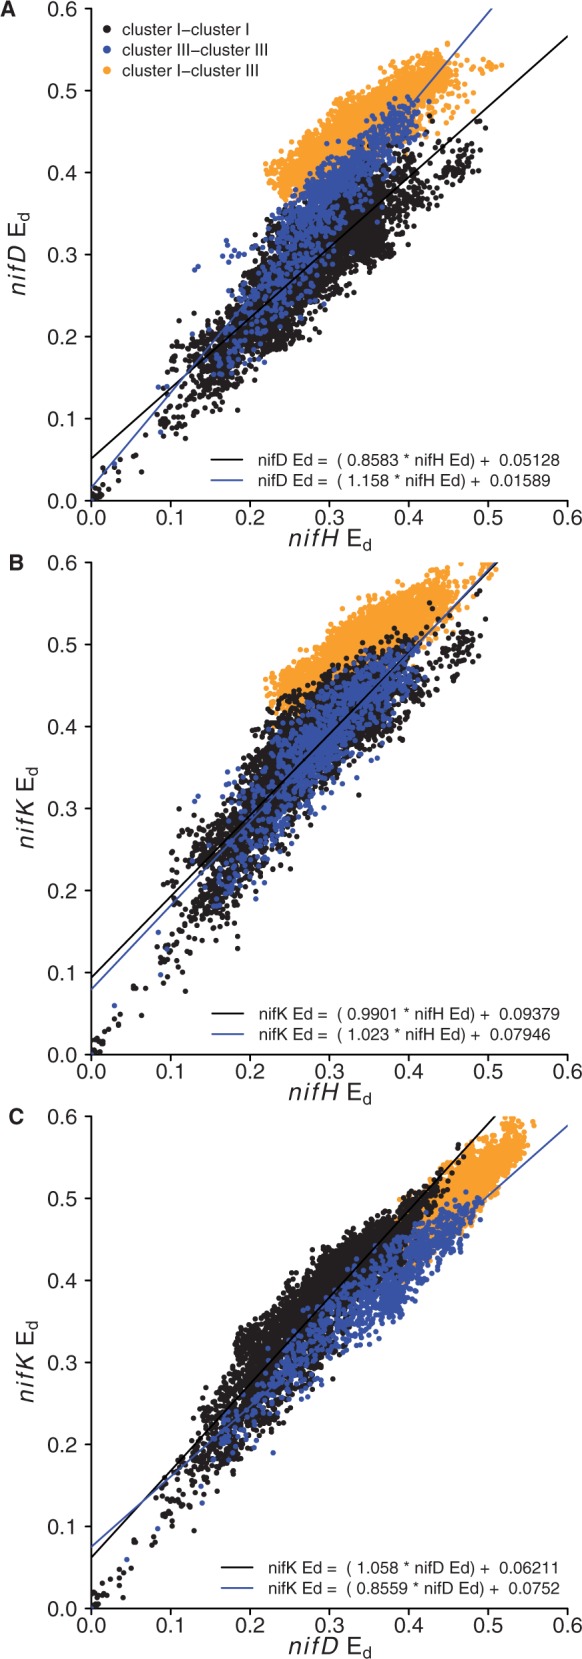
Comparison of relative Ed for nifH and nifD (A), nifH and nifK (B), nifD and nifK (C). The equation for the regression lines are labeled in each panel. Intra-cluster and inter-cluster comparisons are indicated with different colors as defined in the legend.
The data also reveal nifD substitution rate variation between cluster I and cluster III diazotrophs (Figure 4). The rate variation is revealed on Ed plots by differences in the intracluster divergence of nifD relative to nifH and nifK (Figure 4A and C). The slope for the divergence of nifD relative to nifH is lower in cluster I than in cluster III, and this difference is significant (f = 294.3, P < 2 × 10⁻¹⁶, Figure 4A). Likewise, the slope for the divergence of nifD relative to nifK is lower in cluster I than in cluster III and this difference is also significant (f = 328.4, P < 2 × 10⁻¹⁶, Figure 4C). In contrast, there is no difference between cluster I and cluster III diazotrophs with respect to the slope of divergence for nifH and nifK (f = 3.451, P = 0.0633; Figure 4B). These results indicate that nifD is accumulating substitutions more slowly in cluster I diazotrophs than in cluster III diazotrophs.
Comparative analysis of nif genes and 16S rRNA genes
Ed were calculated by pairwise comparison of 16S rRNA and nif genes from the 185 genomes (Figure 5). There is clear evidence for horizontal gene transfer of nif genes between Bacteria and Archaea (Figure 5). Archaea–Bacteria comparisons clearly partition from comparisons made within domains, and this can only occur as the result of nif genes horizontal transfer between Bacteria and Archaea.
Figure 5.
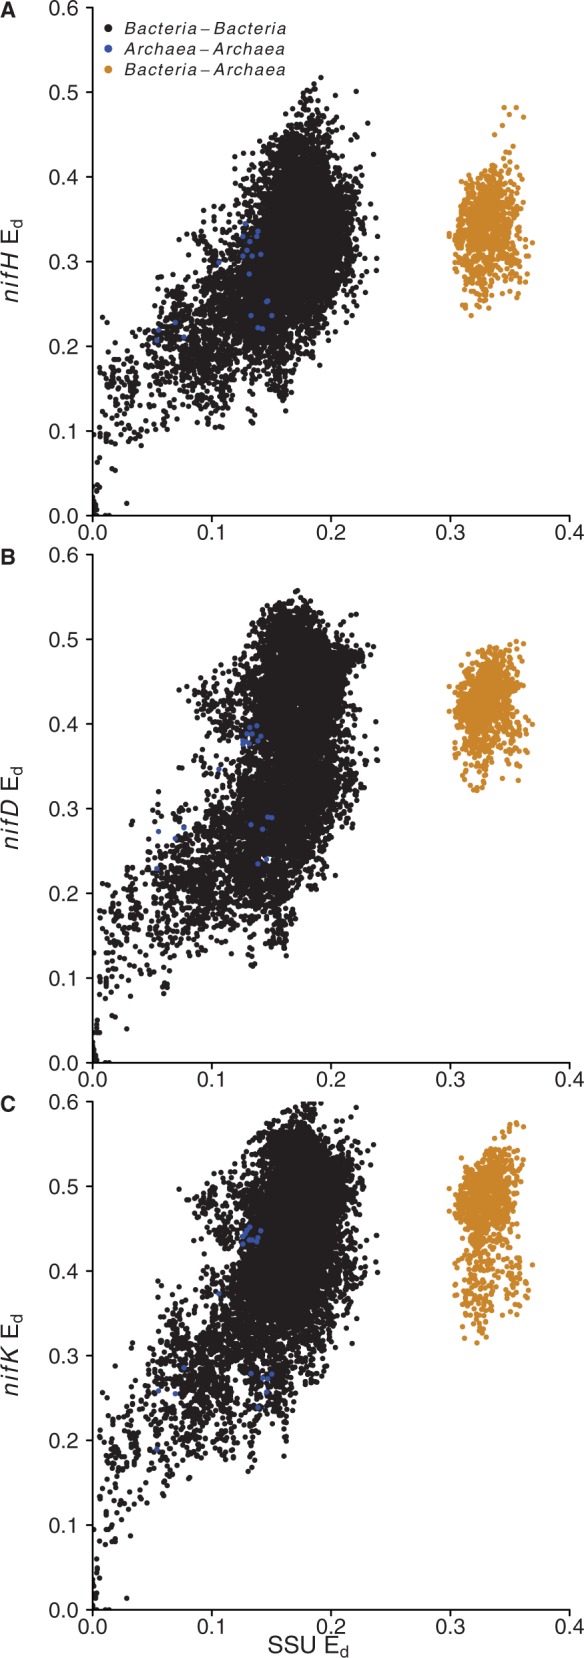
Comparison of relative Ed between 16S rRNA genes and nifH (A), nifD (B) and nifK (C). Colors indicate intra-domain and inter-domain comparisons for each set of genes as indicated in the figure legend.
We also evaluated nifH sequence divergence among genomes that share >97% 16S rRNA sequence similarity (Figure 6). Microbial species are often delineated using a 97% 16S rRNA gene sequence similarity threshold (41). We observe that genomes that have >97% similarity in 16S rRNA genes can have up to 23% dissimilarity in their nifH sequences.
Figure 6.
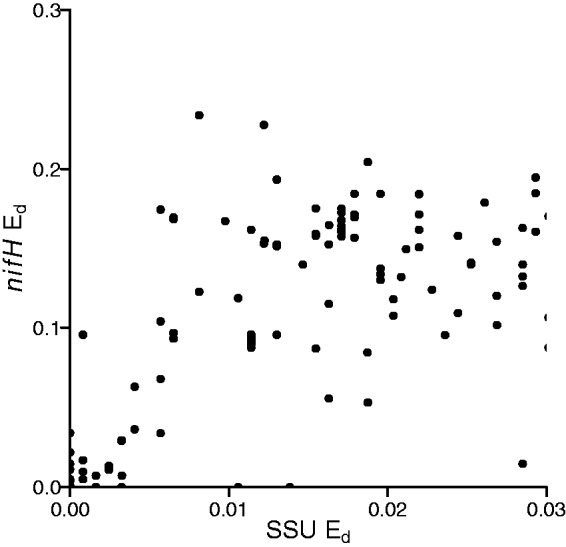
Comparison of Ed between 16S rRNA and nifH genes from sequenced genomes indicating levels of nifH divergence found among 16S rRNA gene sequences that have <3% sequence identity.
Discussion
The multigene entries in the updated nifH database facilitate the evolutionary analysis of nitrogenase genes. We used the database to compare the Ed of nifHDK genes relative to each other and to 16S rRNA genes. This approach can demonstrate cases where horizontal gene transfer has occurred (40), evident as discontinuity on a plot of Ed values between a control and experimental gene. We observe partitioning between intra-domain and inter-domain (Archaea to Bacteria) comparisons of nifH, nifD, nifK relative to 16S rRNA genes (Figure 5). Such partitioning indicates horizontal gene transfer of the nitrogen-fixation genes between Bacteria and Archaea. This observation is consistent with previous evidence of such a transfer event (6, 16, 42).
We also compared Ed among nif genes to examine incongruence among the two principal nif clusters, cluster I and cluster III. There is partitioning of Ed values between nif genes from cluster I and cluster III (Figure 4). The Ed comparison for nifD and nifK (Figure 4C) shows a consistent accumulation of substitutions over evolutionary time. Ed comparisons that include nifH (Figure 4A and B) indicate discontinuity in the accumulation of mutations between cluster I and cluster III with respect to nifH. This discontinuity indicates that nifH has a distinct evolutionary history from nifD and nifK, having been horizontally transferred between clusters I and III at a point after nifK emerged from an ancient nifD (43).
Analysis of Ed values also indicated that the substitution rate in nifD is lower in cluster I than in cluster III (Figure 4A and C). In contrast, the substitution rate in nifH and nifK did not differ between clusters I and III. Differences in the substitution rate between gene sequence clusters indicate a difference in the evolutionary forces that shape protein evolution and are expected for proteins under different functional constraints. Models of nitrogenase protein structure indicate that the cluster III type nitrogenase interacts with a FeMo co-factor as would be expected if these genes are orthologous with cluster I type FeMo nitrogenase (nif) rather than either of the FeFe (anf) or FeV (vnf) alternative nitrogenases (44). In nifD, the active site where cofactor binding occurs displays sequence conservation according to the type of metal cofactor bound, with clusters I and III showing similar residues, although cluster III harbors an internal amino acid extension, which distinguishes it structurally from cluster I and the alternative nitrogenases (44). Another major distinguishing feature of cluster III versus cluster I is that cluster III contains strict anaerobes exclusively, whereas cluster I contains both aerobic organisms and facultative anaerobes. In addition, cluster III Fe–Mo nitrogenases are likely ancestral to both cluster I Fe–Mo nitrogenase and the alternative Fe–Fe and V–Fe nitrogenases (42). That mutations accumulate at different rates in the cluster III and cluster I type nitrogenases suggests that NifD is under different evolutionary constraints in these two groups. Further work is needed to determine the functional significance of NifD residues that differ between the cluster I and cluster III type nitrogenases and to identify functional constraints on nitrogenase evolution.
Our examination of Ed in nifH also has consequences for diversity analyses that use nifH as a marker gene. Sequence-based assessments of microbial diversity often use a similarity cutoff to delineate operational taxonomic units (OTUs) that are thought to correspond to species. A 97% identity cutoff is often applied to the 16S rRNA gene to define species level OTUs (45). In addition, genome sequence analysis has suggested that species level OTUs can be defined using a 95% identity cut-off for conserved protein encoding genes (46). However, ∼80% of nitrogen-fixing strains that share 97% 16S rRNA identity have <95% nifH identity and 43% have <85% identity (Figure 6). One pair of strains had >99% 16S rRNA identity but had nifH genes that differed in 23% of their nucleotide positions. Hence, measures of diversity based on nifH are not likely to be directly comparable with measures of diversity made with 16S rRNA genes. Furthermore, although it can be informative to discuss sequence diversity in nifH, it is not possible to use nifH sequence diversity as an estimate of species diversity.
There are two other collections of aligned nifH sequences that are publicly available. The Functional Gene Pipeline/Repository, known as FunGene, (33) provides an aligned collection of nifH sequences. The sequences in FunGene are pulled from public databases and aligned using HMMer. The FunGene sequence compilations are not in ARB database format, and these data are not incorporated into a phylogenetic context and lack sequence-associated metadata. A second nifH sequence collection is available from the Zehr research group (http://pmc.ucsc.edu/∼wwwzehr/research/database/) in ARB database format. This database is compiled using a set of representative NifH protein sequences using BLAST to identify NifH in public repositories. A major difference with the database we describe is the availability of linked nifH, nifD, nifK and 16S rRNA gene records from sequenced genomes. The database described herein also includes a comprehensive annotated phylogenetic tree of all nifH sequences and trees of the full-length sequences for nifH, nifD, nifK and 16S rRNA genes. These trees can be used to organize and navigate sequence data.
Conclusions
The database we describe includes all nifH sequences present in the Genbank nucleotide database as of 16 May 2012 and includes associated metadata in a searchable framework. The nifH sequences are organized into phylogenetic trees that can be navigated readily in analyses of nitrogenase diversity and evolution and in the evaluation of nifH PCR primers. We demonstrate an application of the multigene functionality of the database to conduct evolutionary analysis of nitrogenase revealing evidence for horizontal gene transfer and substitution rate variation between the major phylogenetic clusters of nitrogenase. The database has utility for analysis of nifH genes generated as amplicons or shotgun fragments from metagenomic studies. The database is available in ARB format, a sequence database management tool used widely in microbial ecology, allowing for point-and-click access to sequence record importation and exportation, searching, alignment editing, primer design and matching and phylogenetic tree construction (35).
Supplementary Data
Supplementary data are available at Database Online.
Acknowledgements
The authors thank Dr Stephen Zinder for comments on the manuscript.
Funding
This research and its publication has been supported by grants from the National Science Foundation Microbial Observatories Program [grant # MCB-0447586] and the Soil Processes Program of the National Research Initiative of the USDA Cooperative State Research, Education and Extension Service [grant # 2005-35107-15266].
Conflict of interest. None declared.
References
- 1.Vitousek PM, Aber JD, Howarth RW, et al. Human alteration of the global nitrogen cycle: sources and consequences. Ecol. Appl. 1997;7:737–750. [Google Scholar]
- 2.Cleveland CC, Townsend AR, Schimel DS, et al. Global patterns of terrestrial biological nitrogen (N2) fixation in natural ecosystems. Global Biogeochem. Cycles. 1999;13:623–645. [Google Scholar]
- 3.Peoples MB, Craswell ET. Biological nitrogen fixation: investments, expectations and actual contributions to agriculture. Plant Soil. 1992;141:13–39. [Google Scholar]
- 4.Kennedy IR, Islam N. The current and potential contribution of asymbiotic nitrogen fixation to nitrogen requirements on farms: a review. Aust. J. Exp. Agric. 2001;41:447–457. [Google Scholar]
- 5.Stacey G, Burris RH, Evans HJ. Biological Nitrogen Fixation. New York: Chapman and Hall; 1992. [Google Scholar]
- 6.Raymond J, Siefert JL, Staples CR, et al. The natural history of nitrogen fixation. Mol. Biol. Evol. 2004;21:541–554. doi: 10.1093/molbev/msh047. [DOI] [PubMed] [Google Scholar]
- 7.Farnelid H, Andersson AF, Bertilsson S, et al. Nitrogenase gene amplicons from global marine surface waters are dominated by genes of non-cyanobacteria. Plos One. 2011;6:e19223. doi: 10.1371/journal.pone.0019223. [DOI] [PMC free article] [PubMed] [Google Scholar]
- 8.Langlois RJ, LaRoche J, Raab PA. Diazotrophic diversity and distribution in the tropical and subtropical Atlantic ocean. Appl. Environ. Microbiol. 2005;71:7910–7919. doi: 10.1128/AEM.71.12.7910-7919.2005. [DOI] [PMC free article] [PubMed] [Google Scholar]
- 9.Zehr JP, Mellon MT, Zani S. New nitrogen-fixing microorganisms detected in oligotrophic oceans by amplification of nitrogenase (nifH) genes. Appl. Environ. Microbiol. 1998;64:3444–3450. doi: 10.1128/aem.64.9.3444-3450.1998. [DOI] [PMC free article] [PubMed] [Google Scholar]
- 10.Roesch LFW, Camargo FAO, Bento FM, et al. Biodiversity of diazotrophic bacteria within the soil, root and stem of field-grown maize. Plant Soil. 2008;302:91–104. [Google Scholar]
- 11.Izquierdo JA, Nusslein K. Distribution of extensive nifH gene diversity across physical soil microenvironments. Microb. Ecol. 2006;51:441–452. doi: 10.1007/s00248-006-9044-x. [DOI] [PubMed] [Google Scholar]
- 12.Rosch C, Mergel A, Bothe H. Biodiversity of denitrifying and dinitrogen-fixing bacteria in an acid forest soil. Appl. Environ. Microbiol. 2002;68:3818–3829. doi: 10.1128/AEM.68.8.3818-3829.2002. [DOI] [PMC free article] [PubMed] [Google Scholar]
- 13.Mehta MP, Butterfield DA, Baross JA. Phylogenetic diversity of nitrogenase (nifH) genes in deep-sea and hydrothermal vent environments of the Juan de Fuca ridge. Appl. Environ. Microbiol. 2003;69:960–970. doi: 10.1128/AEM.69.2.960-970.2003. [DOI] [PMC free article] [PubMed] [Google Scholar]
- 14.Zehr JP, Jenkins BD, Short SM, et al. Nitrogenase gene diversity and microbial community structure: a cross-system comparison. Environ. Microbiol. 2003;5:539–554. doi: 10.1046/j.1462-2920.2003.00451.x. [DOI] [PubMed] [Google Scholar]
- 15.Gaby JC, Buckley DH. A global census of nitrogenase diversity. Environ. Microbiol. 2011;13:1790–1799. doi: 10.1111/j.1462-2920.2011.02488.x. [DOI] [PubMed] [Google Scholar]
- 16.Chien YT, Zinder SH. Cloning, DNA-sequencing, and characterization of a nifD-homologous gene from the archaeon methanosarcina barkeri-227 which resembles nifD from the eubacterium clostridium pasteurianum. J. Bacteriol. 1994;176:6590–6598. doi: 10.1128/jb.176.21.6590-6598.1994. [DOI] [PMC free article] [PubMed] [Google Scholar]
- 17.Masepohl B, Schneider K, Drepper T, et al. Alternative nitrogenases. In: Leigh GJ, editor. Elsevier Science B.V., Nitrogen Fixation at the Millennium. Amsterdam, Netherlands: Elsevier Science B.V.; 2002. pp. 191–222. [Google Scholar]
- 18.Souillard N, Magot M, Possot O, et al. Nucleotide sequence of regions homologous to nifH (nitrogenase fe protein) from the nitrogen-fixing archaebacteria Methanococcus thermolithotrophicus and Methanobacterium ivanovii: evolutionary implications. J. Mol. Evol. 1988;27:65–76. doi: 10.1007/BF02099731. [DOI] [PubMed] [Google Scholar]
- 19.Staples CR, Lahiri S, Raymond J, et al. Expression and association of group IV nitrogenase nifD and nifH homologs in the non-nitrogen-fixing archaeon Methanocaldococcus jannaschii. J. Bacteriol. 2007;189:7392–7398. doi: 10.1128/JB.00876-07. [DOI] [PMC free article] [PubMed] [Google Scholar]
- 20.Nomata J, Mizoguchi T, Tamiaki H, et al. A second nitrogenase-like enzyme for bacteriochlorophyll biosynthesis-reconstitution of chlorophyllide a reductase with purified x-protein (bchX) and yz-protein (bchY-bchZ) from Rhodobacter capsulatus. J. Biol. Chem. 2006;281:15021–15028. doi: 10.1074/jbc.M601750200. [DOI] [PubMed] [Google Scholar]
- 21.Fujita Y, Takahashi Y, Chuganji M, et al. The nifH-like (frxC) gene is involved in the biosynthesis of chlorophyll in the filamentous cyanobacterium Plectonema boryanum. Plant. Cell. Physiol. 1992;33:81–92. [Google Scholar]
- 22.Schloss PD, Handelsman J. Status of the microbial census. Microbiol. Rev. 2004;68:686–691. doi: 10.1128/MMBR.68.4.686-691.2004. [DOI] [PMC free article] [PubMed] [Google Scholar]
- 23.Rappe MS, Giovannoni SJ. The uncultured microbial majority. Ann. Rev. Microbiol. 2003;57:369–394. doi: 10.1146/annurev.micro.57.030502.090759. [DOI] [PubMed] [Google Scholar]
- 24.Hugenholtz P. Exploring prokaryotic diversity in the genomic era. Genome Biol. 2002;3 doi: 10.1186/gb-2002-3-2-reviews0003. reviews0003-reviews0003.8. [DOI] [PMC free article] [PubMed] [Google Scholar]
- 25.Gaby JC, Buckley DH. A comprehensive evaluation of PCR primers to amplify the nifH gene of nitrogenase. Plos One. 2012;7:e42149. doi: 10.1371/journal.pone.0042149. [DOI] [PMC free article] [PubMed] [Google Scholar]
- 26.Cole JR, Chai B, Farris RJ, et al. The ribosomal database project (RDP-ii): sequences and tools for high-throughput rRNA analysis. Nucleic Acid Res. 2005;33:D294–D296. doi: 10.1093/nar/gki038. [DOI] [PMC free article] [PubMed] [Google Scholar]
- 27.Moisander PH, Beinart RA, Hewson I, et al. Unicellular cyanobacterial distributions broaden the oceanic N2 fixation domain. Science. 2010;327:1512–1514. doi: 10.1126/science.1185468. [DOI] [PubMed] [Google Scholar]
- 28.Pereira e Silva MC, Semenov AV, van Elsas JD, et al. Seasonal variations in the diversity and abundance of diazotrophic communities across soils. FEMS Microbiol. Ecol. 2011;77:57–68. doi: 10.1111/j.1574-6941.2011.01081.x. [DOI] [PubMed] [Google Scholar]
- 29.Wallenstein MD, Vilgalys RJ. Quantitative analyses of nitrogen cycling genes in soils. Pedobiologia. 2005;49:665–672. [Google Scholar]
- 30.Martensson L, Diez B, Wartiainen I, et al. Diazotrophic diversity, nifH gene expression and nitrogenase activity in a rice paddy field in Fujian, China. Plant Soil. 2009;325:207–218. [Google Scholar]
- 31.Giebel H-A, Kalhoefer D, Lemke A, et al. Distribution of Roseobacter RCA and SAR11 lineages in the north sea and characteristics of an abundant RCA isolate. ISME J. 2011;5:8–19. doi: 10.1038/ismej.2010.87. [DOI] [PMC free article] [PubMed] [Google Scholar]
- 32.Pruesse E, Quast C, Knittel K, et al. Silva: a comprehensive online resource for quality checked and aligned ribosomal RNA sequence data compatible with ARB. Nucleic Acid Res. 2007;35:7188–7196. doi: 10.1093/nar/gkm864. [DOI] [PMC free article] [PubMed] [Google Scholar]
- 33.Cole JR, Wang Q, Cardenas E, et al. The ribosomal database project: improved alignments and new tools for rRNA analysis. Nucleic Acid Res. 2009;37:D141–D145. doi: 10.1093/nar/gkn879. [DOI] [PMC free article] [PubMed] [Google Scholar]
- 34.DeSantis TZ, Hugenholtz P, Larsen N, et al. Greengenes, a chimera-checked 16S rRNA gene database and workbench compatible with ARB. Appl. Environ. Microbiol. 2006;72:5069–5072. doi: 10.1128/AEM.03006-05. [DOI] [PMC free article] [PubMed] [Google Scholar]
- 35.Ludwig W, Strunk O, Westram R, et al. ARB: A software environment for sequence data. Nucleic Acid Res. 2004;32:1363–1371. doi: 10.1093/nar/gkh293. [DOI] [PMC free article] [PubMed] [Google Scholar]
- 36.Finn RD, Mistry J, Tate J, et al. The pfam protein families database. Nucleic Acid Res. 2010;38:D211–D222. doi: 10.1093/nar/gkp985. [DOI] [PMC free article] [PubMed] [Google Scholar]
- 37.Larkin MA, Blackshields G, Brown NP, et al. Clustal W and clustal X version 2.0. Bioinformatics. 2007;23:2947–2948. doi: 10.1093/bioinformatics/btm404. [DOI] [PubMed] [Google Scholar]
- 38. R Development Core Team. (2012) R: A language and environment for statistical computing. R Foundation for Statistical Computing, Vienna, Austria. ISBN: 3-900051-07-0.
- 39.Severin I, Stal LJ. NifH expression by five groups of phototrophs compared with nitrogenase activity in coastal microbial mats. FEMS Microbiol. Ecol. 2010;73:55–67. doi: 10.1111/j.1574-6941.2010.00875.x. [DOI] [PubMed] [Google Scholar]
- 40.Farahi K, Pusch GD, Overbeek R, et al. Detection of lateral gene transfer events in the prokaryotic tRNA synthetases by the ratios of evolutionary distances method. J. Mol. Evol. 2004;58:615–631. doi: 10.1007/s00239-004-2582-2. [DOI] [PubMed] [Google Scholar]
- 41.Stackebrandt E, Goebel BM. Taxonomic note: a place for DNA-DNA reassociation and 16S rRNA sequence analysis in the present species definition in bacteriology. Int. J. Syst. Bacteriol. 1994;44:846–849. [Google Scholar]
- 42.Boyd ES, Anbar AD, Miller S, et al. A late methanogen origin for molybdenum-dependent nitrogenase. Geobiology. 2011;9:221–232. doi: 10.1111/j.1472-4669.2011.00278.x. [DOI] [PubMed] [Google Scholar]
- 43.Thony B, Kaluza K, Hennecke H. Structural and functional homology between the alpha-subunits and beta-subunits of the nitrogenase NifE protein as revealed by sequencing the Rhizobium japonicum nifK gene. Mol. Gen. Genet. 1985;198:441–448. [Google Scholar]
- 44.McGlynn SE, Boyd ES, Peters JW, et al. Classifying the metal dependence of uncharacterized nitrogenases. Front. Microbiol. 2012;3:419–419. doi: 10.3389/fmicb.2012.00419. [DOI] [PMC free article] [PubMed] [Google Scholar]
- 45.Hagstrom A, Pinhassi J, Zweifel UL. Biogeographical diversity among marine bacterioplankton. Aquat. Microb. Ecol. 2000;21:231–244. [Google Scholar]
- 46.Konstantinidis KT, Ramette A, Tiedje JM. The bacterial species definition in the genomic era. Philos. Trans. R. Soc. Lond. B Biol. Sci. 2006;361:1929–1940. doi: 10.1098/rstb.2006.1920. [DOI] [PMC free article] [PubMed] [Google Scholar]


