Abstract
Globular proteins contain cavities/voids that play specific roles in controlling protein function. Elongated cavities provide migration channels for the transport of ions and small molecules to the active center of a protein or enzyme. Using Monte Carlo and Molecular Dynamics on fully atomistic protein/water models, a new computational methodology is introduced that takes into account the protein's dynamic structure and maps all the cavities in and on the surface. To demonstrate its utility, the methodology is applied to study cavity structure in myoglobin and five of its mutants. Computed cavity and channel size distributions reveal significant differences relative to the wild type myoglobin. Computer visualization of the channels leading to the heme center indicates restricted ligand access for the mutants consistent with the existing interpretations. The new methodology provides a quantitative measure of cavity structure and distributions and can become a valuable tool for the structural characterization of proteins.
According to the philosophy of the Latin poet Lucretius, “all things are made up of matter and void, without which atoms could not move”1. Scientists employ the same distinction today to help explain aspects of polymer chain mobility and the transport of small molecules through polymers. Numerous globular proteins are known to possess permanent cavities and channels2. Some are polar and filled with water while others are lined mostly by hydrophobic residues and are empty or are only partially occupied. The dynamics of the internal cavities and channels of a protein have evolutionary value in ligand diffusion, drug delivery, and the control of reactivity3. For example, the internal cavities in myoglobin (MB) are the docking sites transiently occupied by the ligands O2, CO, and NO during their trajectory through the protein, and define a pathway for migration to and from the heme, which is deeply buried. In addition, a cavity containing a molecule can catalyze a chemical process, as illustrated by the mechanism of the reaction of NO with oxyhemoglobin or oxymyoglobin4.
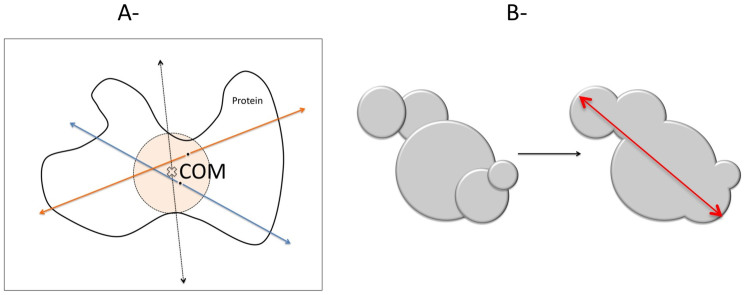
Since the time evolution of cavity creation/destruction inside the protein provides a specific link for protein structure, dynamics, and function, it has attracted much attention in the scientific community5,6,7. Computer simulations have been widely used to study the properties of these cavities. Molecular Dynamics simulations (MD) that take into account explicit treatment of water and protein fluctuations serves as the method of choice for computational exploration of ligand diffusion pathways and dynamics of cavities3,8,9,10,11,12,13,14,15,16,17,18,19,20. However, MD simulation timescale is generally shorter than the time scale of ligand diffusion process and computations are expensive even for a single realization of a ligand escape event. Due to stochastic nature of the process, most of the cases, a single realization is not enough to compare a theory with an experiment especially when kinetics and thermodynamics is of concern. Kinetics and thermodynamics of the process has been studied with enhanced simulation techniques such as Locally Enhanced Sampling11, Umbrella Sampling8, free energy perturbation12, metadynamics18, potential of mean force calculations10 and recently the string method18. Despite the great progress in the methodologies a need exists for a method that is fast, takes into account protein conformational changes caused by thermal fluctuation and solvent interactions, and maps out cavity distributions and all possible diffusion pathways. Herein a new method that combines Cavity Energetic Sizing Algorithm (CESA)21,22 to identify cavities within a dynamic protein and a new method Surface Atom Characterization Algorithm (SACA) (see Figure 1) that finds the cavities on the exterior is presented.
Figure 1.
(a)- Description of Surface Atom Determination by SACA method. Enclose the protein in a box and emit rays from Center of Mass (COM). A surface atom is defined as the furthest atom from COM that intersects the ray (dashed lines). For each ray define a sphere from COM with diameter from the furthest atomic pair. Randomly chose a test particle within the sphere and emit rays to find the remaining surface atoms (blue and orange lines). Repeat the procedure until no new surface atoms found. (b)- Definition of Span. Spherical cavities overlap if the distance between their centers is less than the sum of their diameters (left). Overlapping cavities are grouped into clusters (right). The linear distance between two furthest cavities in a cluster is called span (red solid line).
The presence of hydrophobic cavities inside MB has been known for a long time23, yet only recently has there been experimental evidence for ligand pathways24. Such possible routes were suggested already in the pioneering simulations of Elber and Karplus11 and confirmed in more recent atomistic MD simulations10. Some of these studies have shown evidence for a single major pathway for ligand migration that would require movement of the distal histidine amino acid (“His gate”)25,26,27,28,29. However, other investigators have suggested the existence of multiple pathways for ligand diffusion in myoglobin13,14,30. Whether a “single path” or “multiple paths”, the ligand needs entrances on the protein surface to reach the heme center.
To elucidate how ligand migrates through MB, tryptophan (Trp) exchanges has been used widely by experimental groups15,28,31. Single point mutations at the His64 gate, in the distal pocket near the iron atom, and in the Xe4 and Xe1 cavities exhibit dramatic changes in ligand binding kinetics when compared to the wild type28,31. What is the effect of mutations on the cavity structure? How does cavity sizes and distribution change with mutations? Is there any correlation between the cavity distributions and measured experimental observables?
To investigate the effect of Trp exchanges on cavity distributions and ligand migration pathways we have studied wild type myoglobin (MB) and five of its mutants (H64W, L29W, V68W, I107W, and L104W). Our approach allows us to map out all cavities in the protein interior and exterior. Our results show that the structure of the ligand migration pathways and the number of exterior cavities change by the mutations and elucidate for the first time ligand migration pathways and cavity distributions of the mutants in atomic detail. We also observe a relation between cavity properties of the protein and the kinetics of ligand binding.
Results
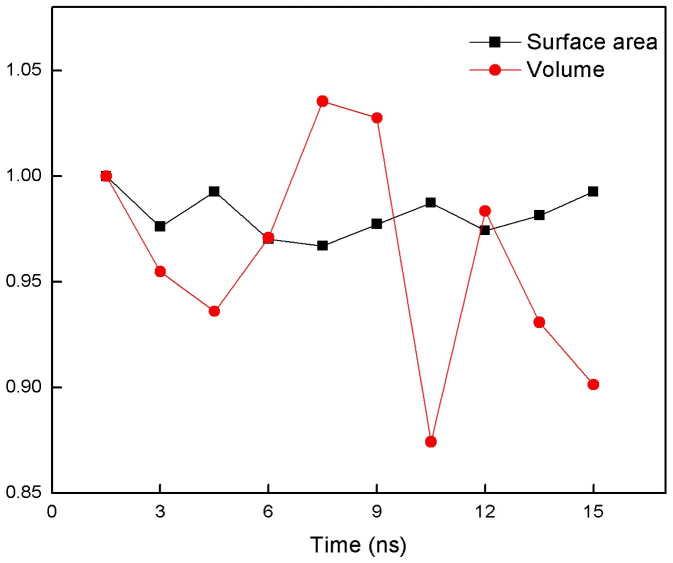
Figure 2 shows the surface and cavity distributions from a snapshot taken from MD simulations. The cavity distribution and surface structure vary in time while the chemical compositions of both surface atoms and the cavity atoms stay about the same during 15 ns of simulation time. A heuristic method is used to test the ergodicity of the estimates (see Figure 3 and Methods for more detail). We compute the average surface area from the snapshots taken from the simulation trajectory. SACA finds the average surface area of MB to be 16,550 ± 414 Å2 and the result agrees favorably well with the surface area computed by a widely used method32. Using a similar procedure to SACA we also compute the protein volume. We found that the average volume of MB is about 19,000 Å3 and fluctuates by ±10% during the simulation (Figure 4). Surprisingly, fluctuations on the surface area are a lot less. Computed average density of MB is about 1.6 g/cm3, which is close to 1.5 g/cm3 measured in the experiments33.
Figure 2. Surface area and Cavity Map of Myoglobin by our method.
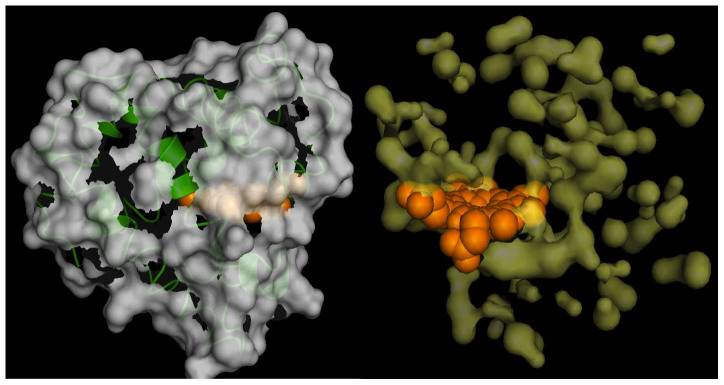
(a) The surface of Myoglobin is computed for a snapshot of Molecular Dynamics simulation. (b) The cavities (yellow) in Myoglobin are shown for a single snapshot of Molecular Dynamics simulation. HEME group is shown in orange and the protein conformation is not shown for clarity. Molecular renderings are done with program PyMOL.
Figure 3. Statistical convergence measure.
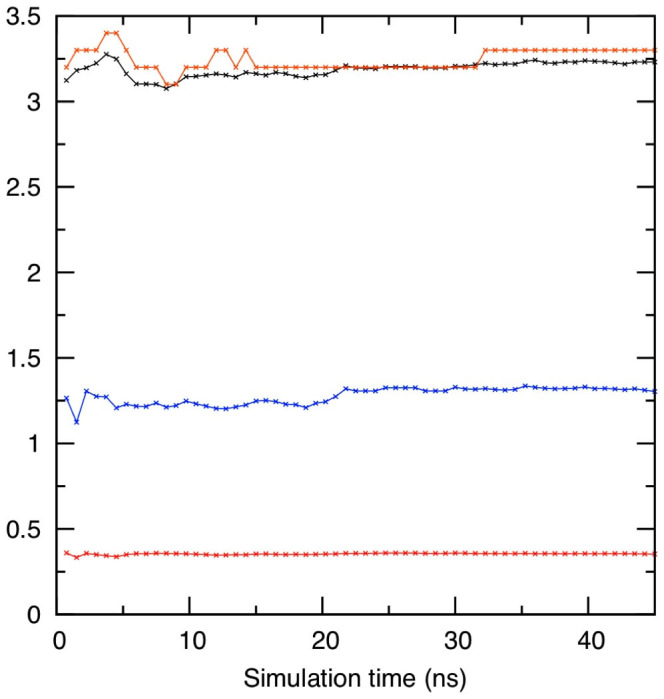
Mean (black), median (orange), variance (blue) of the cavity size distribution of Myoglobin as a function of simulation time. To estimate the timescale for statistical convergence the ratio  (red) is computed where N is proportional with simulation time (see Methods).
Figure 4. Surface area and total volume fluctuations in time.
The dynamics of total surface area and volume in wild type Myoglobin. The values are normalized to the values at the first snapshot (which is 16950 Å2 for surface area and 19500 Å3 volume).
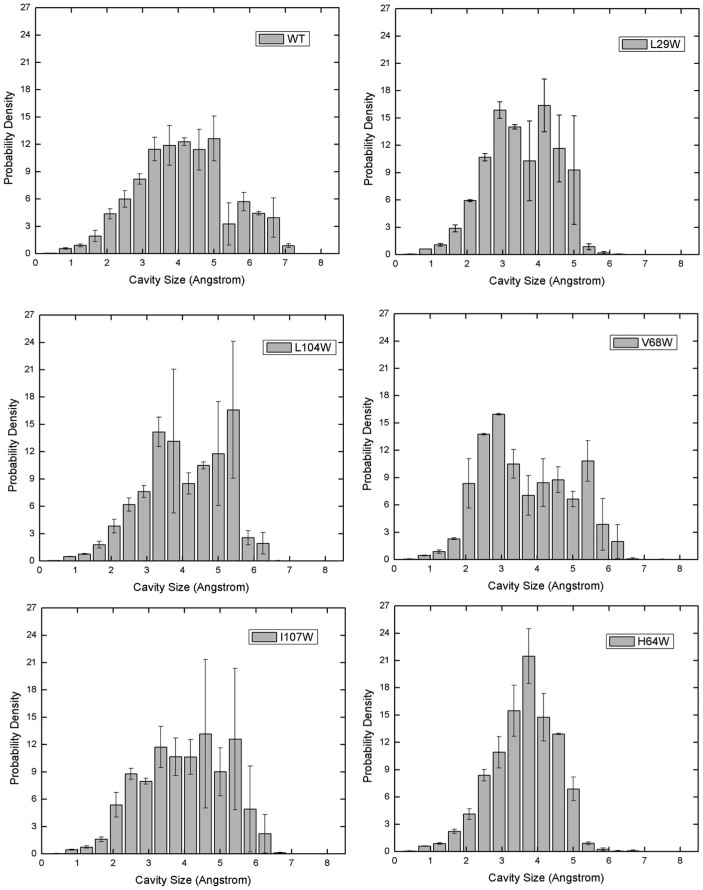
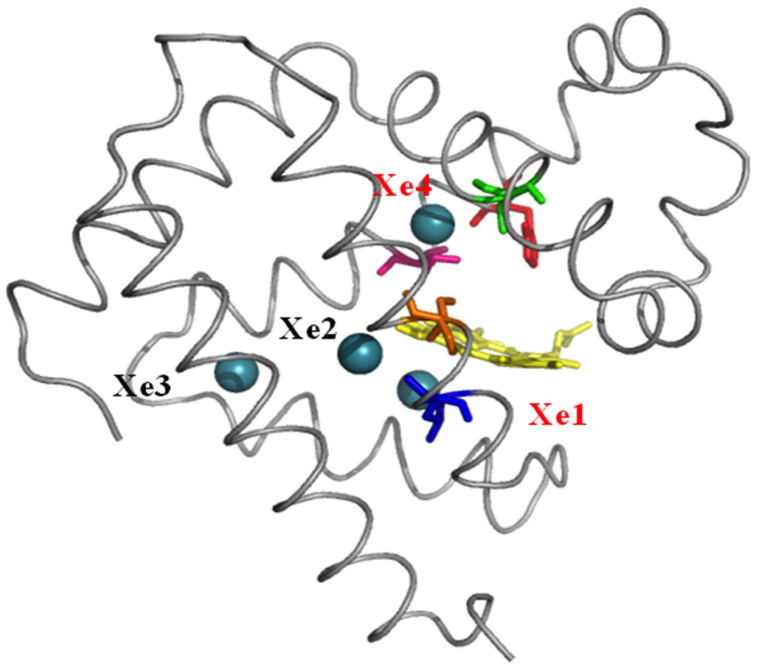
To compare the differences in cavity distribution in MB and its mutants we compute the cavity size distributions from MD trajectories (Figure 5). Figure 6 displays the position of each mutation on the protein. We find significant differences in the distributions. MB shows a bimodal distribution with cavity sizes peaked at 4Å (major) and 6Å (minor). Major peak values shifted to lower cavity sizes in Trp exchanges. In addition, the bimodal nature of the distribution disappeared except for the mutant V68W. Trp exchanges are found to reduce the size of large cavities, for example Trp mutations of Leu29 and His64 residues decrease the largest cavity size from 7.5 Å to 6 Å.
Figure 5. Cavity Size Distributions for Myoglobin and Mutants.
The cavity size distributions of wild type Myoglobin and mutants; L29W, L104W, V68W, I107W, and H64W. Error bars are estimated by dividing the trajectory into sequential segments and computing the average and standard deviation.
Figure 6. Tryptophan exchanges in Myoglobin.
Myoglobin (gray lines) with HEME (yellow sticks), Xenon binding sites (green spheres), and positions of five mutations studied: L104W (blue), L29W (green), V68W (pink), I107W (orange), and H64W (red).
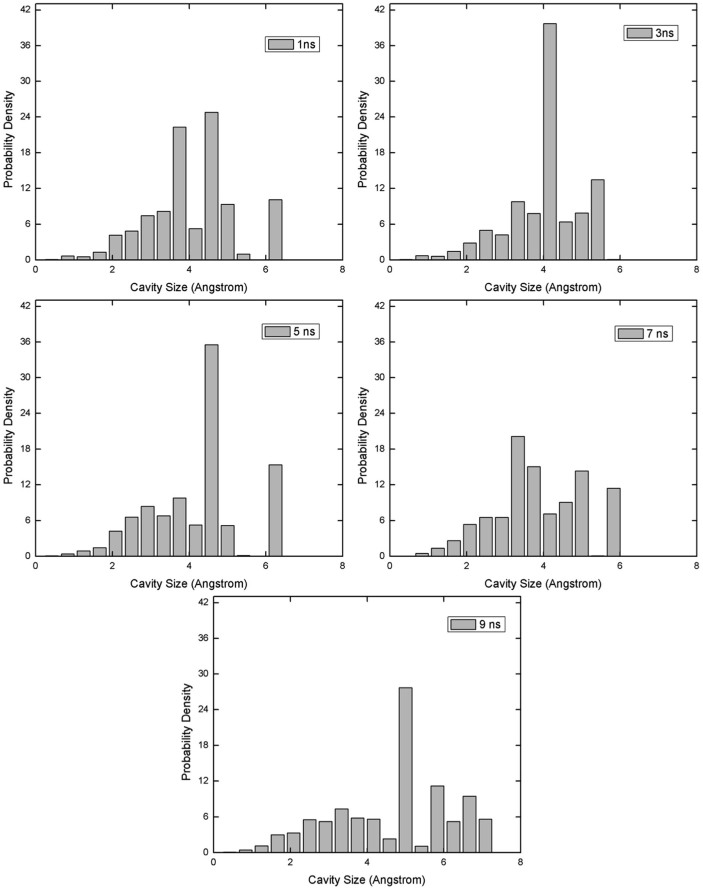
The distributions in Figure 5 are obtained from the entire 15 ns trajectories. Figure 7 shows the dynamics of cavity size distributions. Each histogram corresponds to a snapshot in time. We observe breaking of large cavities (in 1 ns to 3 ns) and again their re-formation (in 7 ns to 9 ns).
Figure 7. The cavity size distributions of Myoglobin in time.
One intriguing observation is the relationship between the experimental rate constants for oxygen rebinding kinetics and cavity size distributions that we compute for MB and its mutants. In Table 1 we compare the experimental rate constants from the kinetic scheme proposed by Scott and Gibson23 with average cavity size computed from our method. Except for V68W, average cavity sizes correlate well with bimolecular binding rate (kO2) which decreases in the order of WT ≈ I107W ≈ L104W > H64W > L29W. Ligand entry rate (kentry) also found to be correlating well with the number of possible entrances on the protein exterior. The more the number of entrances the higher the rate of ligand entry (see Table 1). Furthermore, ligand escape rate increases with the decrease in average cavity sizes. For example, MB has the largest average cavity diameter, around 4.90 Å, whereas L29W has the smallest, with average cavity size of 4.08 Å. Bimolecular binding rate kO2 of MB is about 54 times faster than that of L29W. However, the ligand escape rate (kescape) for MB is about 60% less than that of L29W. An increase in cavity size is accompanied by an increase in bimolecular binding and ligand entry, suggesting the importance of interior voids on gas transport. The insertion of Trp in myoglobin, especially in Leu29 site, causes the most serious breaking of larger cavities, which likely inhibits the O2 binding on the heme28.
Table 1. Experimental rate constants and average cavity properties computed from simulations for Myoglobin and five mutants. Experimental data are from Scott et al.28 The number of entrances is calculated from configurations evenly spaced in 15 ns simulation.
| Geminate rebinding | Bimolecular binding | Ligand entry | Ligand escape | Average cavity size (Å) | Longest span with diameter >3.46 (Å) | Number of Entrance1 | ||
|---|---|---|---|---|---|---|---|---|
| Mutant | PDB ID | kbond (μs−1) | kO2 (μM−1s−1) | kentry (μM−1s−1) | kescape (μs−1) | |||
| WT | 2MB5 | 5.7 ± 1 | 16 | 34 ± 7 | 6.3 ± 1 | 4.90 | 16.5 | 6 |
| H64W | 3OGB | 27 | 6.2 | 8.6 | 10 | 4.20 | 13.5 | 4 |
| L29W | 2BW9 | <0.05 | 0.29 | ≥6 | ≥10 | 4.08 | 14.5 | 3 |
| V68W | 2OH9 | >200 | 0.2 | 0.2 | ~10 | 4.43 | 12.0 | 2 |
| I107W | 2OHB | 26 | 14 | 21 | 13 | 4.71 | 13.5 | 4 |
| L104W | 1CPW | 13 | 16 | 28 | 9.3 | 4.68 | 15.5 | 5 |
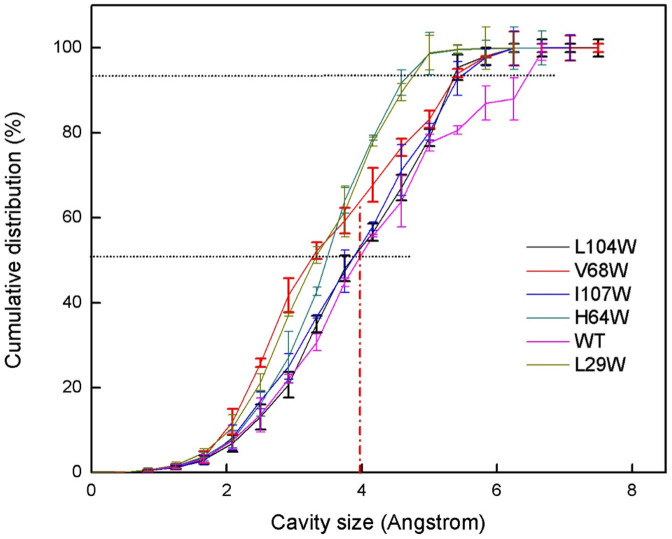
To quantitatively compare the cavity size distribution of MB and its mutants, the cumulative distributions are computed (see Figure 8). Interestingly, MB has a distribution that is shifted towards the larger cavity sizes compared to all of its mutants. In MB, about 60% of the cavities have a size larger than the kinetic diameter of oxygen molecule34 (dOxygen = 3.46 Å) whereas the ratio is smaller for the mutants. In particular only about 40% of the cavities have equal or larger size than oxygen molecule in V68W. It is no wonder why V68W has an extremely low oxygen binding rate, (around 0.2 μM−1S−1 while MB has about 16 μM−1S−128). The mutants L104W and I107W have a similar cumulative distribution and it reflects to their kinetics (Table 1). The same can be said for H64W and L29W.
Figure 8. The Cumulative Cavity Size Distribution of Myoglobin and mutants.
Vertical dashed line shows the kinetic diameter of O2 molecule.
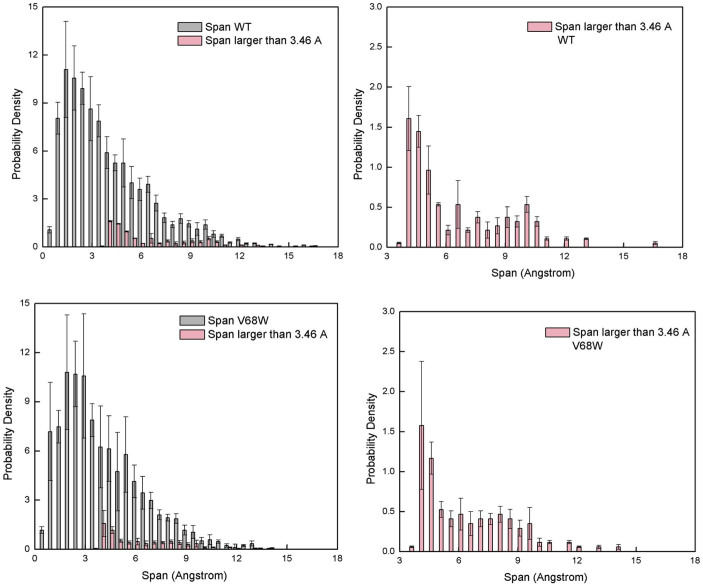
The span distribution is also affected from Trp exchanges. Here we show MB and V68W mutant as an example. The longest span in MB is compared with mutant V68W (Figure 9-a, c). Figure 9-b, d magnifies the distribution of spans that has wider diameter than oxygen molecule. This is important since in order to transport O2 a span must be as wide as the gas molecule. That said, only 7–10% of the total spans in MB and V68W are larger or equal to oxygen molecule kinetic diameter. The longest span with a diameter larger or equal to O2 has a length of about 16.5 Å in MB, whereas it is significantly shorter in V68W (about 12 Å). Same is true for other mutants (not shown here). A decrease in span length is accompanied by an increase in the number of short span elements in V68W and again suggests the segmentation of longer spans.
Figure 9. Span Distributions in Myoglobin and V68W mutant.
(a) Probability density of span size in Myoglobin, (b) spans size distribution with a diameter of 3.46 Å or higher (c) Same as (a) but for mutant V68W (d) Same as (b) but for mutant V68W. Error bars are estimated by dividing the trajectory into sequential segments and computing the average and standard deviation from it.
Figure 2 (right panel) shows the cavities from a single MD snapshot. The cavities from a single configuration are disconnected. To find the pathways at which the ligand moves, if enough time is given, are estimated by combining the cavities obtained from each MD snapshots. Combining the cavities explored in different time frames allows us to determine all unique entrance and exit pathways provided by the dynamics of the protein. It also allowed us to visualize a continuous otherwise disconnected pathways inside the protein. Figure 9 shows such a pathway for MB. We observe that the major pathway going from protein surface to heme passes from some of the Xe binding sites that has been determined by experiments. For wild type myoglobin Xe1, Xe2 and Xe4 are on the ligand migration pathway while Xe3 binding site is slightly off the major pathway (see Figure 10).
Figure 10.
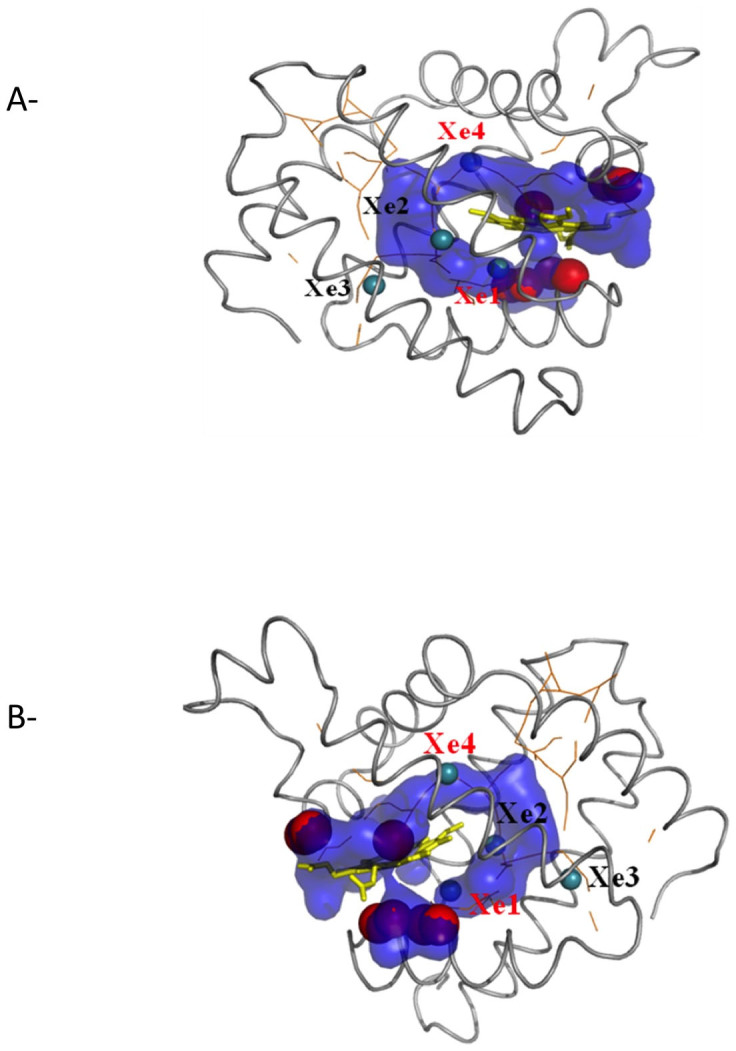
(a) Cavity pathway of Myoglobin (blue) from heme (yellow sticks) to the surface. The surface cavities with size larger than the diameter of Oxygen molecule (3.64 Å) are shown with red spheres. Orange lines are the results obtained by pathfinder program14. (b) Same as (a) from a different angle.
In addition, the Figure also shows the cavities on the protein exterior with diameter larger or equal to oxygen kinetic diameter (red spheres). Cavities on the surface are also the result of merged snapshots of the voids on the surfaces. Of course not all cavities on the surface are exit/entrance for the gas molecule. If the cavity on the surface is connected to a cavity that reaches to heme we called it a possible exit/entrance. The total number of such exit/entrance channels is reported in Table 1. From Figure 10, we can see that all pathways from heme to the surface are on one side of the protein and close to heme, which supports the interpretation5 that the ligand entry and exit to myoglobin is from short and direct channel(s) between the heme pocket and solvent. Different than single channel interpretations25,26,27,28,29 our simulations argue that multiple channels to ligand entry/exit can be possible. The same conclusion is proposed by extensive MD simulations of Rusico et al.14 and Maragliano et al.13. However our data suggest the pathways to and in the Mb are very close to the heme group. Rusico et al.14 propose different routes to alternative pathways. A comparison is shown in Figure 10. Difference in the results may be attributed to the difference in our methodology (pathfinder versus our approach) or the difference in the forcefields used in simulations.
Cavities found on the exterior show differences between Mb and its mutants, MB has more entrances/exits than its mutants (Table 1). The most dramatic difference is the mutation of Val68 to Trp in which a dramatic decrease in the number of entrances are observed. Interestingly, the rate of ligand entry (kentry) in V68W is slower by 160 fold28. The decrease in the number of entrances, which is found in our study, explains why there is a dramatic change in the entry rates in V68W.
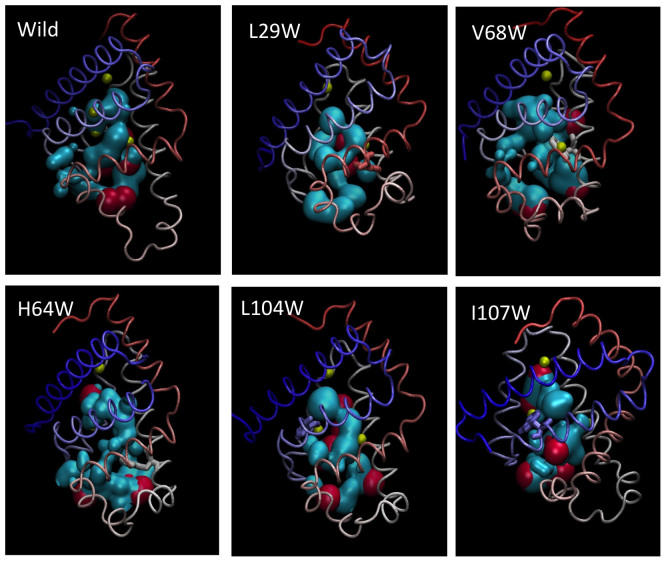
Our simulations show that in WT MB, the pathway from heme to the surface goes through Xe1, Xe2 and Xe4 cavities while Xe3 cavity does not contribute to the main gas diffusion pathway. The pathway also goes through His64, which opens and closes in time supporting the earlier studies25,26,27,28,29,30 and recapitulating that His64 is the gate for O2 transport25. Similarly, we observe dramatic changes in ligand migration pathway for mutants (Figure 11). Insertion of Trp to Val68 and Ile107 positions block the cavity going to Xe4 binding site, leaving the main pathway going only to Xe1 and Xe2. Trp insertion to Leu104 position, on the other hand blocks the pathway going to Xe1 cavity. The changes in the main pathway observed in our simulations were predicted by Brunori and Olson5 and verified for the first time by computer simulations.
Figure 11. Cavity pathway of wild type Myoglobin (cyan) and five of its mutants.
Cavities that are on the surface and larger than kinetic diameter of oxygen molecule are shown by red spheres. Yellow spheres are Xe binding sites. Molecular rendering is done by VMD.
Discussion
A new protocol is developed to study the cavity and surface properties of globular proteins. MB and five mutants (H64W, L29W, V68W, I107W and L104W) were studied as examples. It is shown that Trp exchanges not only changed the major ligand pathway, as was predicted5, but also it changes the cavitiy size distributions in and out of the protein. Native MB found to have the largest average cavity size in the interior and more possible entrance/exits on the exterior when compared to its mutants. We found that the major pathway for the ligand has multiple exit/entrances and they are on the one side of MB (close to heme) in accord with the experiments. Insertion of Trp to His64, Leu29, Val68, Ile107 and Leu104 positions reduces the number of possible entrances to the protein. Mutations also reduce the average cavity size and block the pathways connecting heme to the surface. The blocked pathways stay blocked during the time scale of the simulations. Our method clearly shows that Ile107 and Val68 to Trp mutations blocks Xe4 cavity, whereas L104W mutant blocks Xe1 cavity. However, Leu104 to Trp mutation has little effect on the interior cavities of myoglobin. Finally, we observe a relationship between the average cavity size and bimolecular binding rate and ligand escape rate. The number of possible entrances also found to be correlated with the rate of ligand entry.
Methods
We aim to find all the cavities within the protein as well as the ones on the protein surface. To find the cavities on the surface one has to identify the surface atoms. Lee & Richards35,36 proposed a method to identify molecular surfaces by probing the van der Waals surface with a probe atom comparable to the size of a water molecule. This approach generally accepted as the definition of a molecular surface, or “solvent-accessible surface”, and is supported by a wide range of algorithms37,38,39. An alternative computational method described below, Surface Atom Characterization Algorithm (SACA), not only computes the surface area but also identifies the surface atoms at the same time. The steps involved in implementing SACA are as follows:
Enclose protein configuration within a box.
Find the Center of Mass (COM) of the protein and emit random rays from the COM (see Figure 1-a). Collect the coordinates of each intersected atom defined by its van der Waals volume. For each ray, surface atoms along the ray line are the atomic pair with the largest center-to-center distance.
Define a sphere centered in the COM with a diameter equal to the minimum distance of separation between surface atoms. Within this sphere, randomly choose test points and send rays from each test point to capture the remaining surface atoms.
Repeat the process (step 3) until the number of surface atoms converges.
To calculate the protein surface area, assume that on average half of each atom's surface area contributes to the protein surface.
To find the cavities in the protein matrix we used Cavity Energetic Sizing Algorithm21,22. The method was developed by us and applied to polymer cavities in the past (for more detail21,22). Similar idea was implemented and utilized to study the cavities in proteins10,14 and proved to be useful. The results obtained agreed favorably well with long MD simulations and Locally Enhanced Simulations. In CESA we insert a probe particle (gas molecule) inside a protein and compute the potential energy on the probe particle. A Monte Carlo procedure is then used to move the particle and effectively sample the cavity space.
The cavities in this model are assumed to be spherical with the center of sphere being the minimum of the potential. Two spherical cavities overlap if the distance between their centers is less than the sum of their diameters. Overlapping cavities are grouped into a new entity called a cluster (Figure 1-b). Each cavity belongs to only one cluster and each cluster contains at least one cavity. The span is defined as the maximum distance between any two points that lie within the cluster. This is calculated by finding the two cavity centers in the cluster with the greatest distance. The span is the linear distance between the furthest centers plus the radius of each of the two end spherical cavity.
Cavities and spans are not static entities. As the protein changes configuration they also change their shape and size. To study the dynamics of the cavities we used MD simulations. MD is used to generate protein configurations in room temperature in the presence of water. In this study wild type myoglobin (2MB528) and five of its mutants (3OGB, 2BW9, 2OH9, 2OHB, 1CPW28) were solvated in a cubic box of 60 Å. Water molecules whose atoms were within 1.8 Å distance from any protein atom were removed. Typically, 200 ± 20 water molecules remain in the protein's interior. To assure charge neutrality in the simulation box some water molecules are replaced with chlorine or sodium ions if the protein has a net charge. The final size of each system is about 18,300 atoms. Periodic boundary conditions were used in all directions. Van der Waals interactions were cutoff beyond a distance of 9 Å and the cutoff for electrostatics was 9 Å. The summation of long range electrostatic forces was done by using particle mesh Ewald sum method40.
Molecular dynamic (MD) simulations were performed using MOIL software41. OPLS parameters were used for protein42 and TIP3P for water43. The geometry of the water molecules was fixed with Matrix variant of SHAKE algorithm44, while SHAKE is not applied to the bonds of the protein. The equations of motion were integrated with velocity Verlet scheme, with a time step of 1.5 fs. The total energy conservation is tested by running a single simulation in the NVE ensemble with a time step of 1.5 fs. The drift was less than 0.2% over a period of 1 ns, suggesting that our integration protocol is acceptable. For production runs we used the same settings but sample in NVT ensemble. To ensure constant temperature we used velocity scaling. The system was equilibrated at 300 K for 1 ns followed by production runs of 15 ns for each system. We computed Root Mean Square Deviations (RMSD) from the crystal structures that we began our simulations. Our results show an average RMSD of 2–2.5 Å and fluctuations around it during the simulations suggesting the structures that we started are stable despite the mutations. We recorded the coordinates for every 3 ps for further analysis.
We used a measure to test the ergodicity of the estimates45. Consider an observable q with a mean 〈q〉N obtained from N sampling points. The standard deviation of the N points is σN. If the sampling is made from a uniform distribution the measure  should approach a constant value for N. A plot of c(N) as a function of simulation time is shown for cavity size (see Figure 3). Our result shows a constant c(N) even after five nanoseconds. We also report mean, median, and variance of the distributions as a function of simulation time which also shows no drift in longer times and suggest that 15 ns simulation is statistically sufficient for analysis. To estimate the uncertainty we divide the data to two sequential blocks and we compute the average and standard deviation using these data.
Author Contributions
I.S., S.K. and Y.J. designed the research. Y.J. and S.K. performed the simulations. S.K., Y.J. and I.S. analyzed the data. S.K. and Y.J. wrote the paper, I.S., S.K. and Y.J. reviewed the manuscript.
References
- Markl K. P. The Nature of Things - Quinton. [Vol. 2] [341–353] (A. Philosophisches Jahrbuch, 1977). [Google Scholar]
- Carugo O. a. P. A. Accessibility to internal cavities and ligand binding sites monitored by protein crystallographic thermal factors. Pro.-Str. Func. Gen. 31, 201–213 (1998). [PubMed] [Google Scholar]
- Amara P. et al. Ligand diffusion in the catalase from Proteus mirabilis: A molecular dynamics study. Protein Science 10, 1927–1935 (2001). [DOI] [PMC free article] [PubMed] [Google Scholar]
- Doyle M. P. & Hoekstra J. W. Oxidation of nitrogen oxides by bound dioxygen in hemoproteins. J. Inorg. Biochem 14, 351–358 (1981). [DOI] [PubMed] [Google Scholar]
- Brunori M. & Gibson Q. H. Cavities and packing defects in the structural dynamics of myoglobin. EMBO reports 2, 674–679, 10.1093/embo-reports/kve159 (2001). [DOI] [PMC free article] [PubMed] [Google Scholar]
- Graziano G. Cavity size distribution in the interior of globular proteins. Chem. Phys. Lett. 434, 316–319 (2007). [Google Scholar]
- Tomita A., Kreutzer U., Adachi S., Koshihara S. Y. & Jue T. ‘It's hollow': the function of pores within myoglobin. J. Exp. Biol. 213, 2748–2754, 10.1242/jeb.042994 (2010). [DOI] [PubMed] [Google Scholar]
- Banushkina P. & Meuwly M. Diffusive dynamics on multidimensional rough free energy surfaces. J. Chem. Phys. 127, 135101–135106 (2007). [DOI] [PubMed] [Google Scholar]
- Bossa C. et al. Extended molecular dynamics simulation of the carbon monoxide migration in sperm whale myoglobin. Biophys. J. 86, 3855–3862, 10.1529/biophysj.103.037432 (2004). [DOI] [PMC free article] [PubMed] [Google Scholar]
- Cohen J., Arkhipov A., Braun R. & Schulten K. Imaging the migration pathways for O2, CO, NO, and Xe inside myoglobin. Biophys. J. 91, 1844–1857, 10.1529/biophysj.106.085746 (2006). [DOI] [PMC free article] [PubMed] [Google Scholar]
- Elber R. & Karplus M. Locally Enhanced Sampling in Molecular-dynamics - Use of the Time-dependent Hartree Approximation for a Simulation of Carbon-monoxide Diffusion Through Myoglobin. JACS 112, 9161–9175 (1990). [Google Scholar]
- Lopez M. A. & Kollman P. A. Application of molecular dynamics and free energy perturbation methods to metalloporphyrin-ligand systems II: CO and dioxygen binding to myoglobin. Protein Science 2, 1975–1986 (1993). [DOI] [PMC free article] [PubMed] [Google Scholar]
- Maragliano L., Cottone G., Ciccotti G. & Vanden-Eijnden E. Mapping the network of pathways of CO diffusion in myoglobin. JACS 132, 1010–1017, 10.1021/ja905671x (2010). [DOI] [PubMed] [Google Scholar]
- Rusico J. Z. et al. Atomic level computational identification of ligand migration pathways between solvent and binding site in myoglobin. PNAS 105, 9204–9209 (2008). [DOI] [PMC free article] [PubMed] [Google Scholar]
- Schmidt M. et al. Ligand migration pathway and protein dynamics in myoglobin: a time-resolved crystallographic study on L29W MbCO. PNAS 102, 11704–11709, 10.1073/pnas.0504932102 (2005). [DOI] [PMC free article] [PubMed] [Google Scholar]
- Tilton R. F. Jr, Kuntz I. D. Jr & Petsko G. A. Cavities in proteins: structure of a metmyoglobin-xenon complex solved to 1.9 A. Biochemistry 23, 2849–2857 (1984). [DOI] [PubMed] [Google Scholar]
- Tubert-Brohman I., Acevedo O. & Jorgensen W. L. Elucidation of hydrolysis mechanisms for fatty acid amide hydrolase and its Lys142Ala variant via QM/MM simulations. JACS 128, 16904–16913, 10.1021/ja065863s (2006). [DOI] [PubMed] [Google Scholar]
- Yasutaka, Shigehiko & Kato S. A search for ligand diffusion pathway in myoglobin using a metadynamics simulation. Chem. Phys. Lett. 464, 220–225 (2008). [Google Scholar]
- Zhang Y., Fujisaki H. & Straub J. E. Molecular dynamics study on the solvent dependent heme cooling following ligand photolysis in carbonmonoxy myoglobin. J. Phys. Chem. B. 111, 3243–3250, 10.1021/jp065877k (2007). [DOI] [PubMed] [Google Scholar]
- Elber R. & Gibson Q. H. Toward quantitative simulations of carbon monoxide escape pathways in myoglobin. J. Phys. Chem. B. 112, 6147–6154, 10.1021/jp0769779 (2008). [DOI] [PubMed] [Google Scholar]
- Jiang Y. et al. Cavity size, sorption and transport characteristics of thermally rearranged (TR) polymers. Polymer 52, 12028–12034 (2011). [Google Scholar]
- in't Veld P. J., Stone M. T., Truskett T. M. & Sanchez I. C. Liquid structure via cavity size distributions. J. Phys. Chem. B. 104, 12028–12034 (2000). [Google Scholar]
- Scott E. E. & Gibson Q. H. Ligand migration in sperm whale myoglobin. Biochemistry 36, 11909–11917, 10.1021/bi970719s (1997). [DOI] [PubMed] [Google Scholar]
- Nishihara Y., Sakakura M., Kimura Y. & Terazima M. The escape process of carbon monoxide from myoglobin to solution at physiological temperature. JACS 126, 11877–11888, 10.1021/ja038877w (2004). [DOI] [PubMed] [Google Scholar]
- Johnson K. A., Olson J. S. & Phillips G. N. Jr Structure of myoglobin-ethyl isocyanide. Histidine as a swinging door for ligand entry. J. Mol. Biol. 207, 459–463 (1989). [DOI] [PubMed] [Google Scholar]
- Olson J. S. et al. The role of the distal histidine in myoglobin and haemoglobin. Nature 336, 265–266, 10.1038/336265a0 (1988). [DOI] [PubMed] [Google Scholar]
- Ringe D., Petsko G. A., Kerr D. E. & Ortiz de Montellano P. R. Reaction of myoglobin with phenylhydrazine: a molecular doorstop. Biochemistry 23, 2–4 (1984). [DOI] [PubMed] [Google Scholar]
- Scott E. E., Gibson Q. H. & Olson J. S. Mapping the pathways for O2 entry into and exit from myoglobin. J. Biol. Chem. 276, 5177–5188, 10.1074/jbc.M008282200 (2001). [DOI] [PubMed] [Google Scholar]
- Springer B. A. et al. Discrimination between oxygen and carbon monoxide and inhibition of autooxidation by myoglobin. Site-directed mutagenesis of the distal histidine. J. Biol. Chem. 264, 3057–3060 (1989). [PubMed] [Google Scholar]
- Huang X. & Boxer S. G. Discovery of new ligand binding pathways in myoglobin by random mutagenesis. Nat. Struct. Biol. 1, 226–229 (1994). [DOI] [PubMed] [Google Scholar]
- Olson J. S., Soman J. & Phillips G. N. Jr Ligand pathways in myoglobin: a review of Trp cavity mutations. IUBMB life 59, 552–562, 10.1080/15216540701230495 (2007). [DOI] [PubMed] [Google Scholar]
- Liang J., Edelsbrunner H., Fu P., Sudhakar P. V. & Subramaniam S. Analytical shape computation of macromolecules: I. Molecular area and volume through alpha shape. Proteins 33, 1–17 (1998). [PubMed] [Google Scholar]
- Fischer H., Polikarpov I. & Craievich A. F. Average protein density is a molecular-weight-dependent function. Protein. Sci. 13, 2825–2828, 10.1110/ps.04688204 (2004). [DOI] [PMC free article] [PubMed] [Google Scholar]
- Breck D. W. Zeolite Molecular Sieves; Structure, Chemistry and Use. 636 (John Wiley and Sons, 1973). [Google Scholar]
- Bernstein H. J. & Craig P. A. Efficient molecular surface rendering by linear-time pseudo-Gaussian approximation to Lee-Richards surfaces (PGALRS). J. Appl. Crystallogr. 43, 356–361, 10.1107/S0021889809054326 (2010). [DOI] [PMC free article] [PubMed] [Google Scholar]
- Lee B. & Richards F. M. The interpretation of protein structures: estimation of static accessibility. J. Mol. Biol. 55, 379–400 (1971). [DOI] [PubMed] [Google Scholar]
- Connolly M. L. Analytical Molecular Surface Calculation. J. Appl. Cryst. 16, 548–558 (1983). [Google Scholar]
- Lange A. W. & Herbert J. M. A smooth, nonsingular, and faithful discretization scheme for polarizable continuum models: the switching/Gaussian approach. J. Chem. Phys. 133, 244111, 10.1063/1.3511297 (2010). [DOI] [PubMed] [Google Scholar]
- Richmond T. J. Solvent Acceccible Surface-area and Excluded Volume in Proteins - Analytical Equations for Overlapping Spheres and Implications for the Hydrophobic Effect. J. Mol. Biol. 178, 63–89 (1984). [DOI] [PubMed] [Google Scholar]
- Grant W. J. C. Computation of Lattice Sums- Generalization of Ewald Method. Bell System Technical Journal 44, 427–436 (1965). [Google Scholar]
- Ruymgaart A. P., Cardenas A. E. & Elber R. MOIL-opt: Energy-Conserving Molecular Dynamics on a GPU/CPU system. J. Chem. Theory. Comput. 7, 3072–3082, 10.1021/ct200360f (2011). [DOI] [PMC free article] [PubMed] [Google Scholar]
- Acevedo O., Jorgensen W. L. & Evanseck J. D. Elucidation of rate variations for a Diels-Alder reaction in ionic liquids from QM/MM simulations. J. Chem. Theo. Comput. 3, 132–138, 10.1021/Ct6002753 (2007). [DOI] [PubMed] [Google Scholar]
- Jorgensen W. L., Chandrasekhar J., Madura J. D., Impey R. W. & Klein M. L. Comparison of simple potential functions for simulating liquid water. J. Chem. Phys 79, 926–935 (1983). [Google Scholar]
- Weinbach Y. & Elber R. Revisiting and parallelizing SHAKE. J. Comput. Phys. 209, 193–206 (2005). [Google Scholar]
- Kirmizialtin S. & Elber R. Computational exploration of mobile ion distributions around RNA duplex. J. Phys. Chem. B 114, 8207–8220 (2010). [DOI] [PMC free article] [PubMed] [Google Scholar]


