

Abstract
To determine whether Fourier transform (FT)-IR spectral analysis combined with multivariate analysis of whole-cell extracts from ginseng leaves can be applied as a high-throughput discrimination system of cultivation ages and cultivars, a total of total 480 leaf samples belonging to 12 categories corresponding to four different cultivars (Yunpung, Kumpung, Chunpung, and an open-pollinated variety) and three different cultivation ages (1 yr, 2 yr, and 3 yr) were subjected to FT-IR. The spectral data were analyzed by principal component analysis and partial least squares-discriminant analysis. A dendrogram based on hierarchical clustering analysis of the FT-IR spectral data on ginseng leaves showed that leaf samples were initially segregated into three groups in a cultivation age-dependent manner. Then, within the same cultivation age group, leaf samples were clustered into four subgroups in a cultivar-dependent manner. The overall prediction accuracy for discrimination of cultivars and cultivation ages was 94.8% in a cross-validation test. These results clearly show that the FT-IR spectra combined with multivariate analysis from ginseng leaves can be applied as an alternative tool for discriminating of ginseng cultivars and cultivation ages. Therefore, we suggest that this result could be used as a rapid and reliable F1 hybrid seed-screening tool for accelerating the conventional breeding of ginseng.
Keywords: cultivation age, Fourier transform IR, ginseng cultivars, ginseng leaves, Panax ginseng
1. Introduction
Panax ginseng Meyer belongs to the family Araliaceae and is a perennial plant in Korea and northern China [1]. Korean ginseng is an important medicinal plant with a long history [2]. The chemical constituents of P. ginseng roots, which are commonly used in herbal medicine applications, have been extensively studied and shown to include ginsenoside, polyacetylenes, acid polysaccharides, antioxidative aromatic compounds, and insulin-like acid peptides [3]. Korean ginseng has numerous biological activities of potential pharmaceutical interest, including antitumor, antidiabetic, and antiaging properties; it also enhances immune and brain functions and helps maintain homeostasis of the body [3]. In addition to traditional applications of medicinal ginseng plants, there is increasing demand for the development of new ginseng cultivars as medicinal crops [4]. However, the breeding of high quality ginseng seeds is difficult due to the insufficiency of varietal resources and the requirement for long-term management for seed setting.
Conventional plant-breeding methods can improve both agronomic and medicinal traits, and molecular marker-assisted selection systems are useful for hybrid selection [5]. Achieving such goals in ginseng species requires a high degree of genetic variation in the ginseng population along with high-throughput molecular marker-assisted selection systems. A number of molecular markers have been used to evaluate genetic diversity within ginseng species, including amplified fragment length polymorphism markers [6–8], random amplified polymorphic DNA markers [9–14], and sequences of the chloroplast trnC–trnD region [15].
Recently, metabolomics, which represents the systematic study of the metabolite complement of integrated living systems and its dynamic responses to changes in both endogenous and exogenous factors, has been shown to offer many potential applications and advantages for the research of complex systems [16]. These metabolic approaches are usually combined with multivariate statistical analyses, which allow useful biological information to be extracted from complex metabolic data sets. The great advantage of the spectroscopic techniques used in metabolomic approaches is that they are simple and rapid due to the simplicity of sample preparation and analysis, although their sensitivity is low compared to chromatographic techniques. These spectroscopic techniques are used in a variety of plant research applications, including rapid discrimination among plant species [17] and cultivars [18,19], metabolic evaluation of genetically modified plants [20–24], and prediction of chemical quality constituents [25] and medicinal herbs [26,27]. Thus, metabolomic approaches combined with multivariate analysis can be an effective strategy for comprehensively evaluating the qualities of medicinal plants [16]. A few studies have applied these spectroscopic techniques for metabolic discrimination of ginseng plants. For example, these techniques have been used to determine the cultivation age of ginseng root [28,29], classify ginseng according to cultivation area or origin [30–33], identify biomarkers capable of distinguishing different ginseng varieties [27,34,35], and quantify chemical compounds in ginseng roots.
The aerial part of ginseng dies at the end of the growing season and is newly produced the following spring. In addition, as the ginseng plant is competent to flower from the 3rd yr of cultivation [36], a flower-inducing substance could be present in the metabolites of the aerial part generated from 2-yr-old roots. Therefore, it is an interesting dilemma whether or not metabolic profiling of a leaf sample would represent the age of the root. If so, metabolites related to aging of the root would be transported from the root to the aerial part. Therefore, the aim of this study was to examine the possibility that leaf samples instead of the root can be used for the discrimination of cultivars or cultivation ages using Fourier transform (FT)-IR spectral analysis combined with multivariate analysis.
2. Materials and methods
2.1. Plant materials and preparation of whole-cell extracts
Leaves of four cultivars, P. ginseng Meyer cv. Yunpung, Kumpung, Chunpung, and an open-pollinated variety, were provided by Jeollabuk-do Agricultural Research and Extension Services (Fig. 1). Whole leaf samples from each individual were excised and rapidly frozen by pouring liquid N2 over leaves after sample collection. Leaf samples were freeze-dried, ground into powders, and stored at −70°C before analysis. A total of 480 leaf samples belonging to 12 categories corresponding to the four different cultivars and three different cultivation ages (1 yr, 2 yr, and 3 yr) were analyzed in this study. Crude whole-cell extracts were prepared for FT-IR analysis. Five milligrams of each ginseng leaf powder was combined with 100 μL of extraction buffer [20% (v/v) methanol] in a 1.5 mL microfuge tube, mixed vigorously, and incubated in a 50°C water bath for 10 min with occasional vortexing. Mixtures were centrifuged at 13,000× g for 5 min, and supernatants were transferred to fresh tubes. Centrifugation was repeated if cell debris was not fully removed. These crude whole-cell extracts from ginseng leaves were stored at −20°C prior to FT-IR spectroscopy analysis.
Fig. 1.
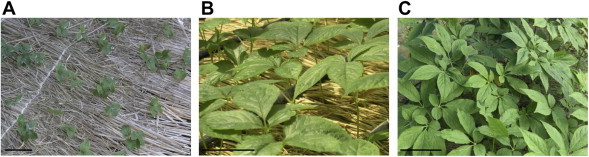
Representative leaf morphology of ginseng (Panax ginseng Meyer cv. Kumpung) grown on fields. (A) 1-yr-old ginseng leaves, (B) 2-yr-old ginseng leaves, and (C) 3-yr-old ginseng leaves. Scale bars represent 5 cm.
2.2. FT-IR spectroscopy and spectral data processing
For FT-IR spectroscopy analysis, 5 μL aliquots of prepared crude whole-cell extracts were loaded onto a 384 well silicon plate on a hotplate prewarmed to 37°C. After the samples were dried, the 384 well silicon plate was placed in a microplate reader unit (HTS-XT; Bruker Optics GbH, Ettlingen, Germany). FT-IR spectra were obtained using the OPUS program (version 6.5; Bruker, Ettlingen, Germany). Each spectrum was recorded from 4,000 cm−1 to 400 cm−1 using a spectral resolution of 4 cm−1. Signal-to-noise ratio was improved by co-adding 128 interferograms and averaging with the analytical results. Infrared spectra were obtained by subtracting the spectra of the plates (background) used for deposition of the samples. For multivariate analysis, the digitized original FT-IR spectra were preprocessed (including correction for baseline), and spectral intensity was normalized using the OPUS program (version 6.5; Bruker, Ettlingen, Germany). These preprocessed spectral data were then subjected to multivariate analyses.
2.3. Multivariate statistical analysis
For multivariate analysis, the 1,800–800-cm−1 region of the FT-IR spectral data rather than the full spectrum was subjected to multivariate analysis. The preprocessed FT-IR spectral data after a second differentiation were imported into the R statistical analysis program (version 2.7.2; R Development Core Team) for principal component analysis (PCA), hierarchical clustering analysis (HCA), and partial least squares-discriminant analysis (PLS-DA). PCA as the representative unsupervised pattern recognition method is used to examine the intrinsic variation in the data set, whereas PLS-DA is a supervised pattern recognition method maximizing the separation between samples. PCA and PLS-DA were conducted using the R program. PCA scores extracted from PCA analysis were used to calculate the correlation matrices, and PLS-DA was applied for rapid discrimination among the four ginseng cultivars. To identify variables that were more valuable for species discrimination among the four ginseng cultivars, we examined PCA loadings. A hierarchical dendrogram was constructed from PLS-DA of the FT-IR data by the unweighted pair–group method with arithmetic mean analysis using the R program; Euclidean distance was used as the similarity measure.
A PLS-DA prediction model for cultivar discrimination from the FT-IR spectral data was created by applying PLS-DA. The PLS-DA model was validated using the cross-validation method, as repeated random subsampling validation [37]. The total dataset was randomly divided into two parts: a training set that was used to build a model (350 samples); and a test set that was not used in the regression model, but was used to verify the model's predictive ability (130 samples). The classification model for cultivars and cultivation ages of ginseng was developed by a PLS-DA function in the caret package in the R program. A test sample was applied to validate the model. This process was repeated 10 times to reduce error from randomization. The predictive ability of PLS-DA model for prediction of age and cultivar was represented as accuracy and p.
3. Results
3.1. Rapid discrimination of cultivation ages of ginseng leaves by FT-IR spectroscopy combined with multivariate analysis
As the ginseng plant ages and grows more leaves, typically having five leaflets, development continues until the 5th yr [38]. First-yr ginseng seedlings produced only one compound leaf with three leaflets (Fig. 1A). Two-yr-old plants had two leaves each with three to five leaflets, rarely four leaflets (Fig. 1B); 3-yr-old plants had three and four leaves, respectively, each with three to five leaflets (Fig. 1C). Quantitative FT-IR spectra from ginseng leaves of different cultivars (Fig. 2A) and cultivation ages (Fig. 2B) were obtained (Fig. 2). The most significant spectral variation among the four ginseng cultivars was observed in the polysaccharide region (1,050–1,150 cm−1) and amide region (1,550–1,650 cm−1) of the FT-IR spectra (Fig. 2A). The quantitative spectral variation among cultivation ages of ginseng leaves was also observed in the polysaccharide region (1,050–1,150 cm−1) and in a broad range (1,200–1,500 cm−1) corresponding to phospholipid/DNA/RNA [39] of the FT-IR spectra (Fig. 2B). These FT-IR spectral variations from leaf samples simply indicate that there were qualitative and quantitative metabolic changes between the cultivars and cultivation ages of ginseng. The PCAs of the FT-IR spectral data are displayed in a two-dimensional plot using the first two principal components (Fig. 3A), which together accounted for 37.5% and 15.7% (53.2% total) of the total variation. PCA score plot showed that most leaf samples belonging to the same cultivation age segregated into broad boundaries indicating that PCA had a relatively high distinguishing capacity between ginseng leaf samples with a cultivation age dependent manner. Identifying the most significant spectral variables (i.e., those exhibiting the greatest variance on PC 1 and PC 2 scores) for sample separation is possible using PCA loading values. A PC score loading plot based on PCA data from ginseng leaves is displayed in Fig. 3B. Significant FT-IR spectral variables for determining PC 1 and PC 2 were mostly distributed in the polysaccharide region (1,050–1,150 cm−1) and amide region (1,550–1,650 cm−1) of the FT-IR spectra, respectively (Fig. 3B). These results indicate that qualitative and quantitative metabolic changes corresponding to polysaccharides and protein/amide regions I and II were important variations related to cultivation age.
Fig. 2.
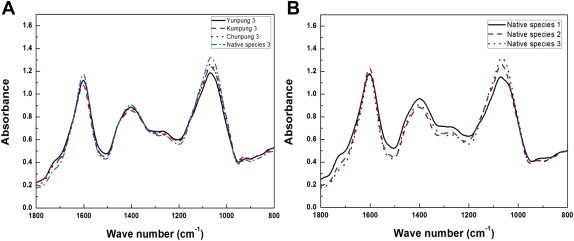
Representative Fourier transform infrared (FT-IR) spectra from ginseng leaves of different cultivars and cultivation ages. (A) Each line represents the FT-IR spectra from four types of ginseng cultivars (Yunpung, Kumpung, Chunpung, and an open-pollinated variety) subjected to FT-IR spectroscopy analysis. (B) Each line represents FT-IR spectra from ginseng leaves of the open-pollinated variety of ginseng with different cultivation ages (1 yr, 2 yr, and 3 yr).
Fig. 3.

Fourier transform infrared (FT-IR) spectra from ginseng leaves of different cultivars and cultivation ages. (A) Principal component (PC) analysis. Broken circles represent each cultivation age. Capital letters represent each cultivar (Y, Yunpung; K, Kumpung; C, Chunpung; N, open-pollinated variety), and numbers represent cultivation age. (B) PC-loading plots. Unbroken and broken lines represent loading values for PC 1 and PC 2, respectively.
PLS-DA also indicated that a more discrete clustering pattern of ginseng leaves was possible (Fig. 4A). Most samples belonging to the same cultivation age, except the 2-yr-old open-pollinated variety, were grouped more closely in discrete clusters than they were in the PCA, indicating that PLS-DA was more clearly able to distinguish between cultivation ages. A dendrogram based on PLS-DA of the FT-IR spectral data (Fig. 4B) showed that the 12 categories of ginseng cultivars were separated into two major groups in a cultivation age-dependent manner without the 2-yr-old open-pollinated variety. The first group consisted of all 1-yr-old ginseng cultivars and the 2-yr-old open-pollinated variety. The second group was composed of two subgroups: the first consisted of 2-yr-old ginseng cultivars (except the open-pollinated variety), whereas the other consisted of all 3-yr-old ginseng cultivars. These results clearly showed that HCA dendrogram was able to discriminate between ginseng leaf samples with a cultivation age dependent manner. Furthermore, HCA dendrogram also showed that there were more significant variations in the overall metabolic pattern between 1-yr-old and 2-yr-old leaves than between 2-yr-old and 3-yr-old leaves. Only a group consisting of the 2-yr-old open-pollinated variety from the 12 total groups was not precisely discriminated in this study. The overall results from PCA and PLS-DA showed that the 12 total categories of ginseng leaf samples formed a cluster in a cultivation age-dependent manner, except for the 2-yr-old open-pollinated variety. These results imply that common metabolic changes occurred in ginseng with increasing cultivation age, and metabolic changes depending on the cultivation age were much greater than those depending on the cultivar.
Fig. 4.
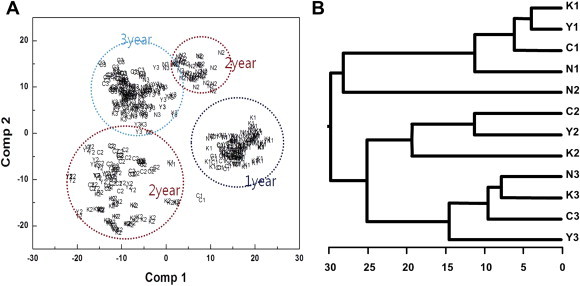
Partial least squares-discriminant analysis (PLS-DA) score plot and hierarchical clustering analysis dendrogram of Fourier transform infrared data from ginseng leaves. (A) Two-dimensional PLS-DA score plot of Fourier transform infrared data from ginseng leaves. Dotted circles represent each cultivation age. (B) A dendrogram based on hierarchical clustering analysis of PLS-DA data from ginseng leaves. Capital letters represent each cultivar (Y, Yunpung; K, Kumpung; C, Chunpung; N, open-pollinated variety), and numbers represent cultivation age.
3.2. Discrimination and prediction of ginseng cultivars within the same cultivation age by PLS modeling
As shown in Fig. 4, the overall metabolic relationship among ginseng leaves was more affected by the cultivation age than the cultivar. If the common metabolic variations derived from cultivation age were removed, a clearer and more reliable discrimination of ginseng cultivars might be possible. To examine this possibility, we divided total FT-IR spectral data sets into three subsets corresponding to the same cultivation age. Each ginseng sample belonging to the same cultivation age was reanalyzed by PLS-DA. Interestingly, ginseng leaf samples were successfully discriminated in a cultivar-dependent manner (Fig. 5). Thus, the four ginseng cultivars were successfully discriminated within 1-yr leaves (Fig. 5A), 2-yr leaves (Fig. 5B), and 3-yr leaves (Fig. 5C), respectively. These results show that ginseng leaves could be discriminated in a cultivar-dependent manner using FT-IR combined with multivariate analysis.
Fig. 5.
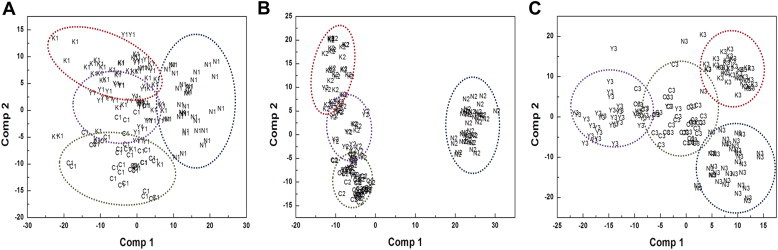
Partial least squares-discriminant analysis score plots from different cultivation ages. (A) 1 yr, (B) 2 yr, and (C) 3 yr. Capital letters and dotted circles represent each cultivar (Y, Yunpung; K, Kumpung; C, Chunpung; N, open-pollinated variety), and numbers represent cultivation age.
To verify the practical applicability of PLS-DA for the discrimination of cultivation ages and cultivars of ginseng, we conducted a cross-validation test (Table 1). In this, 96.2% of the cross-validated group cases were correctly classified. Only a sample from 15 individuals belonging to the 1-yr-old Chunpung cultivar was misclassified. Two samples from five individuals belonging to the 1-yr-old Yunpung cultivar were not correctly classified. However, these misclassifications were only observed within the same cultivation age. The average accuracy for cross-validation test was 94.8%, which was statistically significant (p = 0.00625).
Table 1.
Representative of PLS-DA results from FT-IR spectral data of ginseng leaves1)
| Prediction |
Total | |||||||||||||
|---|---|---|---|---|---|---|---|---|---|---|---|---|---|---|
| K1 | K2 | K3 | Y1 | Y | Y3 | O1 | O2 | O3 | C1 | C2 | C3 | |||
| Count | Kumpung 1 | 10 | 0 | 0 | 0 | 0 | 0 | 0 | 0 | 0 | 0 | 0 | 0 | 10 |
| Kumpung 2 | 0 | 13 | 0 | 0 | 0 | 0 | 0 | 0 | 0 | 0 | 0 | 0 | 13 | |
| Kumpung 3 | 0 | 0 | 9 | 0 | 0 | 0 | 0 | 0 | 0 | 0 | 0 | 0 | 9 | |
| Yunpung 1 | 0 | 0 | 0 | 3 | 0 | 0 | 1 | 0 | 0 | 1 | 0 | 0 | 5 | |
| Yunpung 2 | 0 | 1 | 0 | 0 | 9 | 0 | 0 | 0 | 0 | 0 | 0 | 0 | 10 | |
| Yunpung 3 | 0 | 0 | 0 | 0 | 0 | 12 | 0 | 0 | 0 | 0 | 0 | 0 | 12 | |
| Open-pollinated variety 1 | 0 | 0 | 0 | 0 | 0 | 0 | 17 | 0 | 0 | 0 | 0 | 0 | 17 | |
| Open-pollinated variety 2 | 0 | 0 | 0 | 0 | 0 | 0 | 0 | 13 | 0 | 0 | 0 | 0 | 13 | |
| Open-pollinated variety 3 | 0 | 0 | 0 | 0 | 0 | 0 | 0 | 0 | 9 | 0 | 0 | 0 | 9 | |
| Chunpung 1 | 0 | 0 | 0 | 0 | 0 | 0 | 1 | 0 | 0 | 14 | 0 | 0 | 15 | |
| Chunpung 2 | 0 | 0 | 0 | 0 | 1 | 0 | 0 | 0 | 0 | 0 | 9 | 0 | 10 | |
| Chunpung 3 | 0 | 0 | 0 | 0 | 0 | 0 | 0 | 0 | 0 | 0 | 0 | 7 | 7 | |
| Total | 10 | 14 | 9 | 3 | 10 | 12 | 19 | 13 | 9 | 15 | 9 | 7 | 130 | |
C, Chunpung; K, Kumpung; numbers represent cultivation ages; O, open-pollinated variety; Y Yunpung.
The discriminant functions were determined using the first seven principal components determined by principal component analysis. In cross-validation, each case was classified by the functions derived from all other cases. A total of 350 Fourier transform infrared spectral datasets were used for training in partial least squares modeling. The remaining 130 Fourier transform infrared spectral datasets were used for prediction tests. Abbreviations represent each ginseng cultivar. Accuracy = 0.9615; p = 0.005.
4. Discussion
4.1. Metabolic evaluation of cultivation ages and cultivars of ginseng by FT-IR spectroscopy combined with multivariate analysis
In general, ginseng root is used more than other parts such as the leaf and stem, although extracts from the ginseng leaf and stem also contain similar active ingredients with pharmacological functions [40]. Ginseng leaf and stem extracts contain numerous active ingredients, including ginsenosides, polysaccharides, triterpenoids, flavonoids, volatile oils, polyacetylenic alcohols, peptides, amino acids, and fatty acids [40]. The biologically active ingredients of Panax species are mainly a group of dammarane-type triterpenoid glycosides often referred to as saponins. Over 30 ginsenosides have been isolated from the roots, leaves, stems, flower buds, and berries [41]. However, ginsenoside content varies depending on the plant part and age [41,42]. Ginseng is a deciduous herbaceous plant that perennially loses its leaves in late fall, with the remaining roots persisting through winter. The leaf samples used in this study were of the same seasonal age. Therefore, it is of interest that the leaf samples reflected the chronological age of the roots. The results suggest that ginseng root accumulates or produces different components as chronological age increases.
In this study, FT-IR combined with multivariate analysis was capable of discerning metabolic differences among different cultivation ages and cultivars of ginseng. PCA was able to distinguish between ginseng samples in a cultivation age-dependent manner (Fig. 3). Similar to PCA, PLS-DA was also able to discriminate among ginseng samples in a cultivation age-dependent manner, except for the 2-yr-old open-pollinated variety (Fig. 4). These results imply that FT-IR combined with multivariate analysis from ginseng leaves could be applied for the metabolic discrimination of cultivation age. Our results also show that a longer cultivation period was associated with a greater metabolic variation in ginseng leaves. Furthermore, there were more significant variations in the overall metabolic pattern between 1-yr-old and 2-yr-old leaves than between 2-yr-old and 3-yr-old leaves. Only a group consisting of the 2-yr-old open-pollinated variety from the 12 total groups was not precisely discriminated in this study. It is possible that sampling errors or contamination during leaf sample preparation could account for this failure. However, we could not reexamine the 2-yr-old open-pollinated variety due to the long periods required to obtain leaf samples. We also cannot exclude the possibility that this exclusion reflects inherent characteristics of the open-pollinated variety. Recently, Lin et al [29] reported that Proton nuclear magnetic resonance (1H NMR) fingerprint analysis is able to evaluate cultivation ages of dried ginseng roots. Considering these results, we suggest that FT-IR spectroscopy combined with multivariate analysis can be applied for the discrimination of cultivation ages and cultivars of ginseng leaves.
The highest FT-IR spectral variations from ginseng leaves were observed in the polysaccharide region (1,050–1,150 cm−1), amide region (1,550–1,650 cm−1), and in a broad range (1,200–1,500 cm−1) corresponding to phospholipid/DNA/RNA [39] of the FT-IR spectra (Fig. 2). Identifying the most significant FT-IR spectral variables (i.e., those exhibiting the greatest variance on PC 1 and PC 2 scores) for the discrimination of cultivation ages and cultivars of ginseng is possible using PCA loading values. Significant FT-IR spectral variables for determining PC 1 and PC 2 were mostly distributed in the polysaccharide region (1,050–1,150 cm−1) and amide region (1,550–1,650 cm−1) of the FT-IR spectra, respectively (Fig. 3). These results indicate that qualitative and quantitative metabolic changes corresponding to polysaccharides and protein/amide regions I and II were important for discrimination of cultivation ages and cultivars. Therefore, the overall change in polysaccharides and proteins might play a significant role in discriminating between the cultivars and cultivation ages of ginseng.
Many previous studies regarding IR peak assignment and the chemical composition of ginseng have been reported. The major metabolites of Korean ginseng (P. ginseng) and American ginseng (Panax quinquefolius) are glutamine, arginine, sucrose, malate, and myo-inositol [27]. Thus, glucose, fumarate, and various amino acids could serve as biomarkers for quality assurance in ginseng [27]. Spectroscopic techniques yield spectra that present key bands characteristic of individual components; these data provide information about the chemical composition of the sample, including both primary and secondary metabolites [43,44]. Sugars, including cellulosic, hemicellulosic, and pectic polysaccharides of cell walls and soluble sugar compounds, give a complex fingerprint due to their characteristic bands in the 900–1,200 cm−1 region of the infrared spectrum [45–47]. Cellular proteins and amino acids also give characteristic peaks of 1,750–1,600 cm−1, 1,600–1,500 cm−1, and 1,350–1,200 cm−1, which are assigned the designations amide I, amide II, and amide III, respectively [44,48–51]. Previously, we reported that strawberry cultivars could be discriminated from leaf samples based on FT-IR spectral differences at the 1,650–1,700 cm−1 and 950–1,050 cm−1 regions [19]. Edwards et al [32] reported that Chinese ginseng specimens with different countries of origin could be discriminated by the presence of characteristic bands near 980 cm−1 and 1,600 cm−1 in FT-Raman spectra. Not only primary metabolites but also secondary metabolites are important for characterization of ginseng roots. Phenol compounds give a complex fingerprint due to their characteristic bands in the 1,260–1,180 cm−1 range [44].
Chemical compositions of ginseng can be altered depending on various environmental and biological factors. Ginsenoside contents vary depending on the plant part and age of ginseng [41,42]. The content of polyacetylenes decreases with increasing root size [52]. Calcium oxalate and fatty acids in ginseng root also can vary depending on the cultivation area or method [33]. It has been also shown that quantitative changes in aromatic compounds can be used to discriminate ginseng roots with different ages [28]. In the case of the olive tree, secondary metabolites in leaves play a significant role in cultivar discrimination by multivariate analysis [53]. In this study, the most significant FT-IR spectral regions for the discrimination of cultivation ages and cultivars of ginseng were the polysaccharide region (1,050–1,150 cm−1), amide region (1,550–1,650 cm−1), and the broad range of 1,200–1,500 cm−1 corresponding to phospholipid/DNA/RNA (Figs. 2 and 3). Considering these results, we inferred that the significant FT-IR spectral variations in this study were directly related to changes in major metabolites (sugars and amino acids) and secondary metabolites (aromatic compounds) of ginseng leaves.
4.2. Prediction of cultivation ages and cultivars of ginseng leaves by PLS-DA modeling
The overall metabolic variations between cultivation ages were much greater than those within cultivars. PLS-DA was able to discriminate ginseng cultivars within the same cultivation age groups (Fig. 5). These results show that FT-IR combined with multivariate analysis could be used as a reliable tool for metabolic discrimination of ginseng cultivars. Recently, a novel method combining high performance liquid chromatography fingerprint and simultaneous quantitative analysis of multiple components was developed for quality evaluation of medicinal plants [54,55] or cultivar discrimination [53]. However, these chemical fingerprinting protocols require complex sample preparation as well as metabolite analysis. In this regard, FT-IR could be easily applied without these complexities.
To verify the practical applicability of PLS-DA for the discrimination of cultivation ages and cultivars of ginseng, we conducted a cross-validation test (Table 1). In this, 96.15% of the group cases were correctly classified. The average accuracy for the cross-validation test (×10) was 94.8%, which was statistically significant (p = 0.00625). These results clearly show that cultivation ages and cultivars were simultaneously discriminated through PLS modeling with high accuracies. Kim et al [56] reported that age discrimination of ginseng roots is possible using NMR or Liquid chromatography-mass spectrometry (LC/MS). However, in this study, we showed that it was possible to discriminate cultivation ages and cultivars using multivariate analysis of FT-IR spectra from ginseng leaf samples. We also observed that cultivation age-dependent metabolic changes were much greater than cultivar-dependent ones in ginseng leaf. These results imply that aging-related metabolites in the roots are transported to the aerial part of ginseng.
In conclusion, this study showed that FT-IR combined with multivariate analysis was capable of discerning metabolic differences in ginseng leaf in a cultivation age-dependent or cultivar-dependent manner. Moreover, we showed that quantitative and qualitative modifications of polysaccharide and amide regions of FT-IR spectra from ginseng leaves have the potential to act as metabolic markers for discriminating among different ginseng cultivars and cultivation ages. Similar to the suggestion of Di Donna et al [53] and Schulz and Baranska [44], such metabolic markers could be applied to characterize different cultivars or chemotypes among the same species. Therefore, we suggest that FT-IR could determine the genetic relationship among genotypes from different ginseng cultivars. Furthermore, FT-IR spectroscopy techniques could be applied for high-throughput screening and metabolic evaluation of new cultivars or elite lines in conventional breeding programs.
Conflicts of interest
All contributing authors declare no conflicts of interest.
Acknowledgments
This work was supported by a grant (NRF-2011-0030880 to S.W.K) from the National Research Foundation of Korea and a grant (PJ008329 to S.W.K.) from the Next-Generation BioGreen 21 Program of the Rural Development Administration of Korea.
Footnotes
This is an Open Access article distributed under the terms of the Creative Commons Attribution Non-Commercial License (http://creativecommons.org/licenses/by-nc/3.0) which permits unrestricted non-commercial use, distribution, and reproduction in any medium, provided the original work is properly cited.
References
- 1.Sathiyamoorthy S., In J.G., Gayathri S., Kim Y.J., Yang D.C. Generation and gene ontology based analysis of expressed sequence tags (EST) from a Panax ginseng C. A. Meyer roots. Mol Biol Rep. 2010;37:3465–3472. doi: 10.1007/s11033-009-9938-z. [DOI] [PubMed] [Google Scholar]
- 2.Lee S.Y., Kim Y.K., Park I.N., Kim C.S., Lee C.Y., Park S.U. Chemical constituents and biological activities of the berry of Panax ginseng. J Med Plant Res. 2010;4:349–353. [Google Scholar]
- 3.Choi K.T. Botanical characteristics, pharmacological effects and medicinal components of Korean Panax ginseng C. A. Meyer. Acta Pharmacol Sin. 2008;29:1109–1118. doi: 10.1111/j.1745-7254.2008.00869.x. [DOI] [PubMed] [Google Scholar]
- 4.Wang H., Sun H., Kwon W.S., Jin H., Yang D.C. Molecular identification of the Korean ginseng cultivar “Chunpoong” using the mitochondrial nad7 intron 4 region. Mitochondrial DNA. 2009;20:41–45. doi: 10.1080/19401730902856738. [DOI] [PubMed] [Google Scholar]
- 5.Canter P.H., Thomas H., Ernst E. Bringing medicinal plants into cultivation: opportunities and challenges for biotechnology. Trends Biotechnol. 2005;23:180–185. doi: 10.1016/j.tibtech.2005.02.002. [DOI] [PubMed] [Google Scholar]
- 6.Ha W.Y., Shaw P.C., Liu J., Yau F.C., Wang J. Authentication of Panax ginseng and Panax quinquefolius using amplified fragment length polymorphism (AFLP) and directed amplification of minisatellite region DNA (DAMD) J Agric Food Chem. 2002;50:1871–1875. doi: 10.1021/jf011365l. [DOI] [PubMed] [Google Scholar]
- 7.Hong D.Y., Lau A.J., Yeo C.L., Liu X.K., Yang C.R., Koh H.L., Hong Y. Genetic diversity and variation of saponin contents in Panax notoginseng roots from a single farm. J Agric Food Chem. 2005;53:8460–8467. doi: 10.1021/jf051248g. [DOI] [PubMed] [Google Scholar]
- 8.Kwon H.K., Ahn C.H., Choi Y.E. Molecular authentication of Panax notoginseng by specific AFLP-derived SCAR marker. J Med Plant Res. 2009;3:955–964. [Google Scholar]
- 9.Bai D., Brandle J., Reeleder R. Genetic diversity in North American ginseng (Panax quinquefolius L.) grown in Ontario detected by RAPD analysis. Genome. 1997;40:111–115. doi: 10.1139/g97-015. [DOI] [PubMed] [Google Scholar]
- 10.Watanabe T., Kawaguchi K., Suzuki H., Yoshikawa T., Takano A., Isoda S., Kohda H., Malla K.J. Studies on the medicinal plant resources of the Himalayas(3), random amplified polymorphic DNA analysis and saponin contents of Himalayan ginseng (Panax pseudo-ginseng Wall.) J Nat Med. 1998;52:426–433. [Google Scholar]
- 11.Schluter C., Punja Z.K. Genetic diversity among natural and cultivated field populations and seed lots of American ginseng (Panax quinquefolius L.) in Canada. Int J Plant Sci. 2002;163:427–439. [Google Scholar]
- 12.Kim C., Choi H.K. Genetic diversity and relationship in Korean ginseng (Panax schinseng) based on RAPD analysis. Kor J Genet. 2003;25:181–188. [Google Scholar]
- 13.Artyukova E.V., Kozyrenko M.M., Koren O.G., Muzarok T.I., Reunova G.D., Zhuravlev Y.N. RAPD and allozyme analysis of genetic diversity in Panax ginseng C.A. Meyer and P. quinquefolius L. Russ J Genet. 2004;40:239–247. [Article in Russian] [PubMed] [Google Scholar]
- 14.Lim W., Mudge K.W., Weston L.A. Utilization of RAPD markers to assess genetic diversity of wild populations of North American ginseng (Panax quinquefolium) Planta Med. 2007;73:71–76. doi: 10.1055/s-2006-951768. [DOI] [PubMed] [Google Scholar]
- 15.Lee C., Wen J. Phylogeny of Panax using chloroplast trnC-trnD intergenic region and the utility of trnC-trnD in interspecific studies of plants. Mol Phylogenet Evol. 2004;31:894–903. doi: 10.1016/j.ympev.2003.10.009. [DOI] [PubMed] [Google Scholar]
- 16.Okada T., Afendi F.M., Altaf-Ul-Amin M., Takahashi H., Nakamura K., Kanaya S. Metabolomics of medicinal plants: the importance of multivariate analysis of analytical chemistry data. Curr Comput Aided Drug Des. 2010;6:179–196. doi: 10.2174/157340910791760055. [DOI] [PubMed] [Google Scholar]
- 17.Kim S.W., Ban S.H., Chung H., Cho S.H., Chung H.J., Choi P.S., Yoo O.J., Liu J.R. Taxonomic discrimination of higher plants by multivariate analysis of Fourier transform infrared spectroscopy data. Plant Cell Rep. 2004;23:246–250. doi: 10.1007/s00299-004-0811-1. [DOI] [PubMed] [Google Scholar]
- 18.Ward J.L., Harris C., Lewis J., Beale M.H. Assessment of 1H NMR spectroscopy and multivariate analysis as a technique for metabolite fingerprinting of Arabidopsis thaliana. Phytochemistry. 2003;62:949–957. doi: 10.1016/s0031-9422(02)00705-7. [DOI] [PubMed] [Google Scholar]
- 19.Kim S.W., Min S.R., Kim J.H., Park S.K., Kim T.I., Liu J.R. Rapid discrimination of commercial strawberry cultivars using Fourier transform infrared spectroscopy data combined by multivariate analysis. Plant Biotechnol Rep. 2009;3:87–93. [Google Scholar]
- 20.Roessner U., Luedemann A., Brust D., Fiehn O., Linke T., Willmitzer L., Fernie A. Metabolic profiling allows comprehensive phenotyping of genetically or environmentally modified plant systems. Plant Cell. 2001;13:11–29. doi: 10.1105/tpc.13.1.11. [DOI] [PMC free article] [PubMed] [Google Scholar]
- 21.Garratt L.C., Linforth R., Taylor A.J., Lowe K.C., Power J.B., Davey M.R. Metabolite fingerprinting in transgenic lettuce. Plant Biotechnol J. 2005;3:165–174. doi: 10.1111/j.1467-7652.2004.00110.x. [DOI] [PubMed] [Google Scholar]
- 22.Baker J.M., Hawkins N.D., Ward J.L., Lovegrove A., Napier J.A., Shewry P.R., Beale M.H. A metabolomic study of substantial equivalence of field-grown genetically modified wheat. Plant Biotechnol J. 2006;4:381–392. doi: 10.1111/j.1467-7652.2006.00197.x. [DOI] [PubMed] [Google Scholar]
- 23.Beckmann M., Enot D.P., Overy D.P., Draper J. Representation, comparison, and interpretation of metabolome fingerprint data for total composition analysis and quality trait investigation in potato cultivars. J Agric Food Chem. 2007;55:3444–3451. doi: 10.1021/jf0701842. [DOI] [PubMed] [Google Scholar]
- 24.Ren Y., Wang T., Peng Y., Xia B., Qu L.J. Distinguishing transgenic from non-transgenic Arabidopsis plants by 1H NMR-based metabolic fingerprinting. J Genet Genomics. 2009;36:621–628. doi: 10.1016/S1673-8527(08)60154-X. [DOI] [PubMed] [Google Scholar]
- 25.Lebot V., Ndiaye A., Malpa R. Phenotypic characterization of sweet potato [Ipomoea batatas (L.) Lam.] genotypes in relation to prediction of chemical quality constituents by NIRS equations. Plant Breeding. 2011;130:457–463. [Google Scholar]
- 26.Deborde C., Maucourt M., Baldet P., Bernillon S., Biais B., Talon G., Ferrand C., Jacob D., Dumazet H.F., Daruvar A. Proton NMR quantitative profiling for quality assessment of greenhouse-grown tomato fruit. Metabolomics. 2009;5:183–198. [Google Scholar]
- 27.Lee E.J., Shaykhutdinov R., Weljie A.M., Vogel H.J., Facchini P.J., Park S.U., Kim Y.K., Yang T.J. Quality assessment of ginseng by 1H NMR metabolite fingerprinting and profiling analysis. J Agric Food Chem. 2009;57:7513–7522. doi: 10.1021/jf901675y. [DOI] [PubMed] [Google Scholar]
- 28.Shin Y.S., Bang K.H., In D.S., Kim O.T., Hyun D.Y., Ahn I.O., Ku B.C., Kim S.W., Seong N.S., Cha S.W. Fingerprinting analysis of fresh ginseng roots of different ages using 1H-NMR spectroscopy and principal components analysis. Arch Pharm Res. 2007;30:1625–1628. doi: 10.1007/BF02977333. [DOI] [PubMed] [Google Scholar]
- 29.Lin W.N., Lu H.Y., Lee M.S., Yang S.Y., Chen H.J., Chang Y.S., Chang W.T. Evaluation of the cultivation age of dried ginseng radix and its commercial products by using 1H-NMR fingerprint analysis. Am J Chin Med. 2010;38:205–218. doi: 10.1142/S0192415X10007762. [DOI] [PubMed] [Google Scholar]
- 30.Woo Y.A., Kim H.J., Chung H. Classification of cultivation area of ginseng radix with NIR and Raman spectroscopy. Analyst. 1999;124:1223–1226. [Google Scholar]
- 31.Xie H.P., Jiang J.H., Chen Z.Q., Shen G.L., Yu R.Q. Chemometric classification of traditional Chinese medicines by their geographical origins using near-infrared reflectance spectra. Anal Sci. 2006;22:1111–1116. doi: 10.2116/analsci.22.1111. [DOI] [PubMed] [Google Scholar]
- 32.Edwards H.G., Munshi T., Page K. Analytical discrimination between sources of ginseng using Raman spectroscopy. Anal Bioanal Chem. 2007;389:2203–2215. doi: 10.1007/s00216-007-1605-4. [DOI] [PubMed] [Google Scholar]
- 33.Liu D., Li Y.G., Xu H., Sun S.Q., Wang Z.T. Differentiation of the root of cultivated ginseng, mountain cultivated ginseng and mountain wild ginseng using FT-IR and two-dimensional correlation IR spectroscopy. J Mol Struct. 2008;883–884:228–235. [Google Scholar]
- 34.Chen X., Wu D., He Y., Liu S. Nondestructive differentiation of Panax species using visible and shortwave near-infrared spectroscopy. Food Bioprocess Technol. 2009;4:753–761. [Google Scholar]
- 35.Chen P., Harnly J.M., Harrington Pde B. Flow injection mass spectroscopic fingerprinting and multivariate analysis for differentiation of three Panax species. J AOAC Int. 2011;94:90–99. [PMC free article] [PubMed] [Google Scholar]
- 36.Lee H.S., Liu J.R., Yang S.G., Lee Y.H., Lee K.W. In vitro flowering of plantlets regenerated from zygotic embryo-derived somatic embryos of ginseng. Hort Sci. 1990;25:1652–1654. [Google Scholar]
- 37.Kohavi R. A study of cross-validation and bootstrap for accuracy estimation and model selection. IJCAI. 1995;2:1137–1143. [Google Scholar]
- 38.Proctor J.T., Bailey W.G. Ginseng: industry, botany, and culture. Hort Rev. 1987;9:187–236. [Google Scholar]
- 39.Parker F.S. Plenum Press; New York: 1983. Applications of infrared, Raman and resonance Raman spectroscopy in biochemistry; p. 527. p. [Google Scholar]
- 40.Wang H., Peng D., Xie J. Ginseng leaf-stem: bioactive constituents and pharmacological functions. Chin Med. 2009;4:20. doi: 10.1186/1749-8546-4-20. [DOI] [PMC free article] [PubMed] [Google Scholar]
- 41.Jackson C.J., Dini J.P., Lavandier C., Faulkner H.P., Rupasinghe H.P., Proctor J.T. Ginsenoside content of North American ginseng (Panax quinquefolius L. Araliaceae) in relation to plant development and growing locations. J Ginseng Res. 2003;27:135–140. [Google Scholar]
- 42.Proctor J.T., Sullivan A.J., Rupasinghe H.P., Jackson C.J. Morphological and ginsenoside differences among north American ginseng leaves. J Ginseng Res. 2011;35:155–161. doi: 10.5142/jgr.2011.35.2.161. [DOI] [PMC free article] [PubMed] [Google Scholar]
- 43.Baranski R., Baranska M., Schulz H., Simon P.W., Nothnagel T. Single seed Raman measurements allow taxonomical discrimination of Apiaceae accessions collected in gene banks. Biopolymers. 2006;81:497–505. doi: 10.1002/bip.20452. [DOI] [PubMed] [Google Scholar]
- 44.Schulz H., Baranska M. Identification and quantification of valuable plant substances by IR and Raman spectroscopy. Vib Spectrosc. 2007;43:13–25. [Google Scholar]
- 45.Rothschild K.J. FTIR difference spectroscopy of bacteriorhodopsin: toward a molecular model. J Bioenerg Biomembr. 1992;24:147–167. doi: 10.1007/BF00762674. [DOI] [PubMed] [Google Scholar]
- 46.Pandey K.K. A study of chemical structure of soft and hardwood and wood polymers by FTIR spectroscopy. J Appl Polym Sci. 1999;71:1969–1975. [Google Scholar]
- 47.López-Sánchez M., Ayora-Cañada M.J., Molina-Díaz A. Olive fruit growth and ripening as seen by vibrational spectroscopy. J Agric Food Chem. 2010;58:82–87. doi: 10.1021/jf902509f. [DOI] [PubMed] [Google Scholar]
- 48.Lacey D.J., Wellner N., Beaudoin F., Napier J.A., Shewry P.R. Secondary structure of oleosins in oil bodies isolated from seeds of safflower (Carthamus tinctorius L.) and sunflower (Helianthus annuus L.) Biochem J. 1998;334:469–477. doi: 10.1042/bj3340469. [DOI] [PMC free article] [PubMed] [Google Scholar]
- 49.Ruan X., Wei J., Xu Q., Wang J.S., Gong Y.D., Zhang X.F., Kuang T.Y., Zhao N.M. Comparison of the effects of Triton X-100 treatment on the protein secondary structure of photosystem I and photosystem II studied by FT-IR spectroscopy. J Mol Struct. 2000;525:97–106. [Google Scholar]
- 50.Shi C., Dai Y., Liu Q., Xie Y., Xu X. The FT-IR spectrometric analysis of the changes of polyphenol oxidase II secondary structure. J Mol Struct. 2003;644:139–144. [Google Scholar]
- 51.Schwinté P., Foerstendorf H., Hussain Z., Gärtner W., Mroginski M.A., Hildebrandt P., Siebert F. FTIR study of the photoinduced processes of plant phytochrome phyA using isotope-labeled bilins and density functional theory calculations. Biophys J. 2008;95:1256–1267. doi: 10.1529/biophysj.108.131441. [DOI] [PMC free article] [PubMed] [Google Scholar]
- 52.Baranska M., Schulz H., Christensen L.P. Structural changes of polyacetylenes in American ginseng root can be observed in situ by using Raman spectroscopy. J Agric Food Chem. 2006;54:3629–3635. doi: 10.1021/jf060422d. [DOI] [PubMed] [Google Scholar]
- 53.Di Donna L., Mazzotti F., Naccarato A., Salerno R., Tagarelli A., Taverna D., Sindona G. Secondary metabolites of Olea europaea leaves as markers for the discrimination of cultivars and cultivation zones by multivariate analysis. Food Chem. 2010;121:492–496. [Google Scholar]
- 54.Yang M., Sun J., Lu Z., Chen G., Guan S., Liu X., Jiang B., Ye M., Guo D.A. Phytochemical analysis of traditional Chinese medicine using liquid chromatography coupled with mass spectrometry. J Chromatogr A. 2009;1216:2045–2062. doi: 10.1016/j.chroma.2008.08.097. [DOI] [PubMed] [Google Scholar]
- 55.Yang D.Z., An Y.Q., Jiang X.L., Tang D.Q., Gao Y.Y., Zhao H.T., Wu X.W. Development of a novel method combining HPLC fingerprint and multi-ingredients quantitative analysis for quality evaluation of traditional Chinese medicine preparation. Talanta. 2011;85:885–890. doi: 10.1016/j.talanta.2011.04.059. [DOI] [PubMed] [Google Scholar]
- 56.Kim N., Kim K., Choi B.Y., Lee D., Shin Y.S., Bang K.H., Cha S.W., Lee J.W., Choi H.K., Jang D.S. Metabolomic approach for age discrimination of Panax ginseng using UPLC-Q-Tof MS. J Agric Food Chem. 2011;59:10435–10441. doi: 10.1021/jf201718r. [DOI] [PubMed] [Google Scholar]