Abstract
We discuss a bent-ray ultrasound tomography algorithm with total-variation (TV) regularization. We have applied this algorithm to 61 in vivo breast datasets collected with our in-house clinical prototype for imaging sound-speed distributions in the breast. Our analysis showed that TV regularization could preserve sharper lesion edges than the classic Tikhonov regularization. Furthermore, the image quality of our TV bent-ray sound-speed tomograms was superior to that of the straight-ray counterparts for all types of breasts within BI-RADS density categories 1 through 4. Our analysis showed that the improvements for average sharpness (in the unit of (m · s)−1) of lesion edges in our TV bent-ray tomograms are between 2.1 to 3.4-fold compared with the straight ray tomograms. Reconstructed sound-speed tomograms illustrated that our algorithm could successfully image fatty and glandular tissues within the breast. We calculated the mean sound-speed values for fatty tissue and breast parenchyma as 1422±9 m/s (mean±SD) and 1487±21 m/s, respectively. Based on 32 lesions in a cohort of 61 patients, we also found that the mean sound-speed for malignant breast lesions 1548±17 m/s was higher, on average, than that of benign ones (1513±27 m/s) (one-sided p < 0.001). These results suggest that, clinically, sound-speed tomograms can be used to assess breast density (and therefore, breast cancer risk), as well as detect and help differentiate breast lesions. Finally, our sound-speed tomograms may also be a useful tool to monitor the clinical response of breast cancer patients to neo-adjuvant chemotherapy.
Keywords: Ultrasound tomography, Total-variation, Sound-speed, Breast imaging
INTRODUCTION
Breast cancer affects one in eight women during their lives, making it the most common cancer and the second most common cause of cancer death after lung cancer. Although its false positive and false negative rates are high, mammography is still the current gold standard screening tool for breast cancer. Currently, conventional ultrasound is only an adjunct technique to mammography for breast cancer diagnosis due to its highly operator dependent nature and inconsistency in detecting some early cancers. Numerous ongoing studies (Kolb et al. 2002; Lucas-Fehm 2005) including the large American College of Radiology Imaging Network (ACRIN) study have been aimed at evaluating ultrasound (US) for breast cancer screening. Most of the early experimental work to develop breast ultrasound computed tomography (UCT) was performed in late 1970s and early 1980s (Greenleaf et al. 1974, 1977, 1981, 1987; Carson et al. 1981; Schreiman et al. 1984; Scherzinger et al. 1989). Since the early investigators were often hindered by the limited memory and processor speed of their computers, the quality of the reconstruction images was not high enough for clinical use (Jones 1993). As Andre et al. note in their article (1997), after the initial experimental research, most of the work on UCT through the mid 1990s involved theoretical reconstructions and not experimental designs. Rapidly improving computer power allowed investigators to explore in vivo applications of breast ultrasound tomography. Examples include the work of Carson et al. (1981), Andre et al. (1997), Johnson et al. (1999), Marmarelis et al. (2002), Liu and Waag (1997) and Duric et al. (2005, 2007). Chang et al. (2007) also applied limited-angle UCT to clinical breast radio-frequency (RF) signals collected by conventional B-mode ultrasound machine.
Compared with conventional B-mode imaging, there are a few advantages for ultrasound transmission imaging (tomography): (1) transmission images are quantitative and they provide sound-speed imaging of the whole breast; (2) transmission measurements encode complete information about the gross structure of the tissue; (3) transmission measurements are independent of echo images; and (4) transmission measurements are relatively easy to analyze mathematically.
There are basically two types of UCT methods. The first is based on ray theory, which is fast and stable. The second applies inverse scattering principles, which are much more time consuming but have higher resolution (Devaney 1981, 1982; Johnson et al. 1983, 1999). For ray-theory based breast UCT, there are primarily two modes. The first mode uses the time-of-flight measurements of the transmission US signals to reproduce the sound-speed distribution within the breast. The second mode reconstructs attenuation measurements to give a distribution of energy absorption and scatter within the breast. Our study focuses on the first mode to improve the quality of UCT by overcoming the shortcomings of previous noniterative straight-ray mathematical models, thereby making it more clinically acceptable for in vivo breast imaging.
Based on Fermat's Principle and Snell's Law, the ultrasound ray path in an inhomogeneous medium (such as breast tissue) is not straight, which makes the inverse problem nonlinear. The first bent-ray ultrasound tomography was proposed by Schomberg in 1978 (Schomberg 1978). However, applications of bent-ray algorithm were limited to numerical simulations and phantom studies thereafter (Norton 1987; Andersen 1987, 1990). To record both the transmitted and reflected ultrasound energy, a clinical ultrasound ring array scanner for breast cancer diagnosis, termed computed ultrasound risk evaluation (CURE), was designed and built at the Karmanos Cancer Institute (KCI), Detroit, MI, USA (Duric et al. 2005, 2007; Littrup et al. 2001, 2002). Since most abnormal breast lesions have higher sound-speed than normal breast tissue (Gauss et al. 1997), the goal is to accurately and efficiently produce images of breast sound-speeds based on the ultrasound signals that are transmitted through the breast tissue to the other side of the ring array. Therefore, a robust ultrasound sound-speed tomography algorithm is critical to ensure a high-resolution sound-speed tomogram of the breast data.
In this study, we present an iterative bent-ray ultra-sound tomography method to extract sound-speed information from in vivo ultrasound breast data acquired by CURE. We investigate the use of total-variation (TV) to regularize the uneven ray coverage, which leads to a non-quadratic minimization problem. The TV method was introduced by Rudin et al. in 1992 and has been widely used in inverse problems in image processing (denoising, restoration and zooming). While most regularization methods, such as Tikhonov regularization, tend to smooth reconstructed images, TV regularization preserves edge information. We applied a limited memory Broyden-Fletcher-Goldfarb-Shanno (L-BFGS) method to solve the optimization problem (Nocedal and Wright 2000). Sixty-one datasets from clinical breast patients were acquired by CURE and reconstructed using this algorithm.
This article is organized as follows. Patient selection and the CURE device are briefly described, followed by details of the iterative tomography algorithm and applications to clinical breast data. Finally, the potential clinical value of the reconstructed sound-speed images and their limitations are addressed.
MATERIALS AND METHODS
Patient selection
A total of 61 patients (mean age: 43.73±11.84 years) with a variety of breast types, breast mass types and sizes, were included in this study. Patient recruitment was done by a research nurse at our Comprehensive Breast Center and informed consent from each patient had been obtained before the scan. All patients were scanned with our clinical UCT, or CURE, prototype after mammography and standard US exams, but before US guided biopsy. Scanning procedures were performed under an institutional review board approved protocol and in compliance with the Health Insurance Portability and Accountability Act (HIPAA). CURE data was not used for any clinical decisions and reviewed only after the patient had left KCI.
The CURE device and data collection
The CURE device is a clinical prototype producing near real-time data acquisition and integrated into the normal patient flow of the Comprehensive Breast Center. A detailed description of CURE was presented by Duric et al. (2007) and a brief overview is given below.
Figure 1a is a schematic representation of the CURE ring transducer. The 20 cm diameter ring consists of 256 equally-spaced and water-coupled transducers, immersed in a water tank (Fig. 1a). During the scan, the patient is positioned prone with the breast situated through a hole in the canvas bedding. The breast is suspended in water, inside the imaging tank and encircled by the ring. A motorized gantry translates the ring in the vertical direction, starting from the chest wall through the breast's nipple region. One complete scan takes about 1 minute and leads to approximately 75 slices of data per patient.
Fig. 1.
The CURE clinical prototype. (a) Close-up of the imaging tank showing the transducer ring affixed to a mechanical arm that steps the ring down while imaging the entire breast volume. (b) A schematic representation of the CURE ring transducer. (From Duric et al. 2007).
During scanning at each step, all 256 transducer elements sequentially emit a fan beam of ultrasound signals with a central frequency of 1.5 MHz toward the opposite side of the ring. The scattered (transmission) and backscattered (reflection) ultrasound signals are subsequently recorded by all 256 elements at a sampling rate of 6.25 MHz. Figure 1b (from Duric et al. 2007) illustrates that the ring insonofies a cross-section of the breast that leads to data of all wavefields (including both transmission and reflection) that can be used to reconstruct images of acoustic properties.
Ultrasound sound-speed tomography
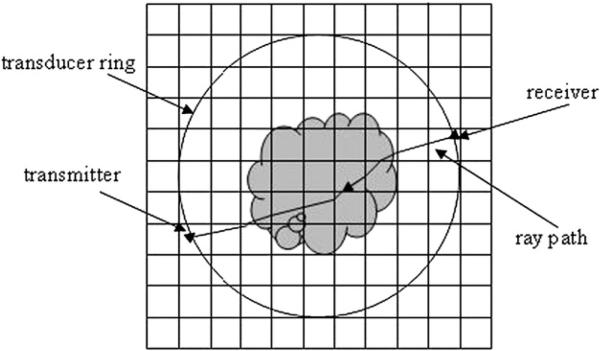
Based on the Radon transform, classical tomography reconstruction using filtered back-projection (FBP) cannot take ray bending into account. However, according to Fermat's Principle and Snell's Law, the ultrasound ray path is not straight in an inhomogeneous medium like breast tissue, which makes the inverse problem nonlinear. In this study, an iterative bent-ray ultrasound tomography algorithm with a TV regularization term was assessed. To solve the bent-ray ultrasound tomography problem, a regular rectangular grid model was created on the image plane, whose boundaries enclose the transducer ring (Fig. 2). During each iteration, both the forward problem and the inverse problem were solved and the sound-speed model was updated for successive iterations. Details about our methods to solve forward and inverse problems are described as follows.
Fig. 2.
Illustration of the grid model for forward modeling. Rays are traced from receiver to transmitter as shown in the figure.
Forward modeling
Two-dimensional (2-D) ultra-sound wave propagation is governed by the eikonal equation
| (1) |
where T is the travel-time, v is the sound-speed, and (sx; sy) is the slowness vector of the ultrasound wave that is defined as the inverse of sound-speed. In eqn (1), E = const. describes the “wavefronts”, and “rays” are defined as the orthogonal trajectories of these wavefronts.
In this article, eqn (1) was solved using Klimes’ grid travel-time tracing technique (1996), which had been proven to be both accurate and fast. Klimes’ method calculates the slowness vector (sx; sy) and travel-time T at the center point of each grid cell simultaneously with at least second-order accuracy (relative to the grid spacing). (sx; sy) and T at an arbitrary point within the grid model were interpolated by 2-D fourth order Lagrange interpolation. An ultrasound ray was backpropagated from receiver to transmitter in the following way:
Starting from the receiver location (xr; yr); the ray segment within the current grid cell was traced along the direction Ḡ = (–sxr, –syr) until it intercepted the cell boundary at point (xi; yi);
Update Ḡ to be the negative slowness vector of the intercept point Ḡ = (–sxi, –syi), and trace the ray segment within the next adjacent cell;
Repeat (2), until the current ray arrives at the transmitter within a certain tolerance.
Assuming that the slowness is constant within each grid cell, the bent ray path can be traced using the above procedure fairly accurately. An illustration of the grid model and the backpropagated is shown in Figure 2.
Inverse problem.
Let Δti be the difference between the ith picked time-of-flight (TOF) for the recorded ultrasound data and the ith calculated TOF for the sound-speed model, our inverse problem can be described as follows
| (2) |
where Δsj is the slowness perturbation for the jth grid cell, which needs to be inverted, and lij is the ray length of the ith ray within the jth cell. Equation (2) can be expressed as a matrix form
| (3) |
This is a nonlinear inverse problem due to ray bending. The objective function for the inverse problem can be described as in eqn (4)
| (4) |
and
| (5) |
However, TV(ΔSλ)) is not differentiable at zero. So to avoid this difficulty a small positive constant value is added to the eqn (6)
| (6) |
The quantity is known as the gradient magnitude. This provides us with the information about the discontinuities in the image. In eqn (4), λ is the regularization parameter that balances the roughness of the inverted results and the fit to the data.
To avoid direct computation of Hessian matrices, we applied the quasi-Newton algorithm—L-BFGS method to iteratively solve the nonlinear problem in eqn (4) for ΔS, starting with a homogeneous sound-speed model. The L-BFGS method was proven to be both time and memory efficient (Nocedal et al. 2000). After each iteration, an updated sound-speed model was obtained by adding the solution ΔS to the initial model. Rays were traced on the updated model using the method discussed in the forward modeling section, and the TOF data were updated at the same time. The iteration continues until the TOF misfit ΔT was not significantly improved from the previous iteration, which meant the solutions had converged. The regularization parameter λ was determined using the L-curve technique (Hansen 2001).
In this study, we applied our TV bent-ray tomography algorithm to a total of 61 in vivo breast datasets. Uncertainties in the sound-speed tomograms were simply estimated by calculating the standard deviation in reconstructions for water shot data. Water shot data was recorded before each patient scan, with only water in the tank. Sixteen reconstructions with 1 mm by 1 mm grid cell for water shot data were used to do the analysis. The typical standard deviation for individual pixel sound-speed values in water was 4 m/s.
Our clinical protocol was designed to include a sample of patients with a wide variety of breast types, ranging from fatty to dense on the BI-RADS categories 1 through 4. The sound-speed tomograms were reviewed and classified by a board certified radiologist with over 10 years of breast imaging experience (P.J.L.).
Define sharpness of lesion edges
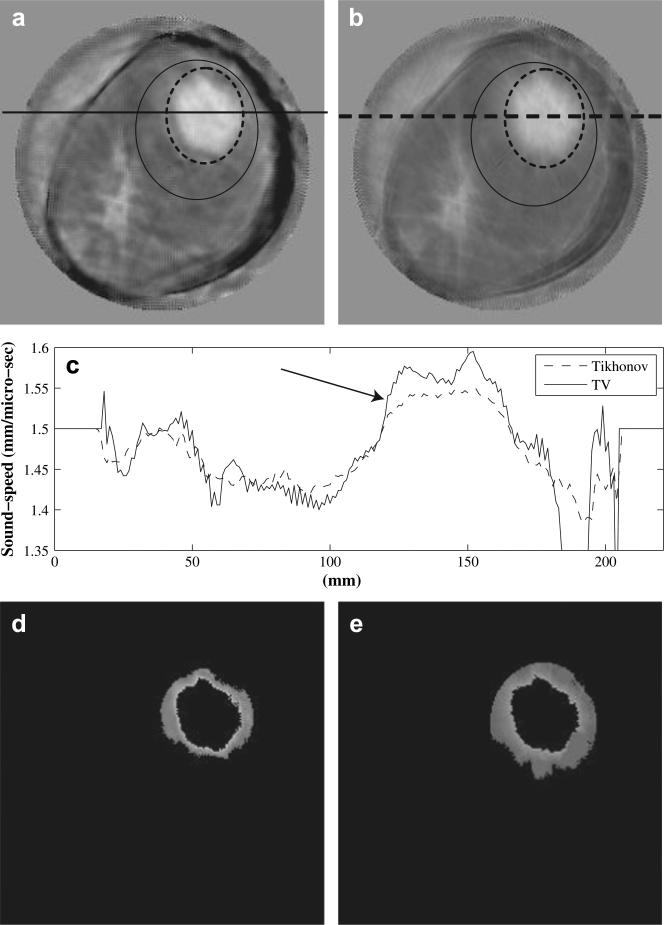
To define sharpness of lesion edges in a more illustrative way, we took the TV tomogram in Figure 4a as an example: (1) selecting a region-of-interest (ROI) by drawing an ellipse enclosing the lesion (solid ellipse in Fig. 4a) and the sound-speed outside the ROI is set to zero, (2) select another ROI inside the ROI in (1) (dashed ellipse in Fig. 4a), (3) calculate the mean background sound-speed (BgSS) using those pixels inside the solid ellipse but outside the dashed ellipse, (4) find the maximum sound-speed (MaxSS) inside the dashed ellipse, and calculate the half-power (HpSS) sound-speed between background (BgSS) and the maximum sound-speed (HpSS = BgSS + [MaxSS-BgSS)/2), (5) threshold the image obtained in (1) with BgSS and HpSS, respectively, then subtract the two resulting images (Fig. 4d), (6) the edge sharpness is defined as: (HpSS – BgSS)/ (number of pixels in the subtracted image in Fig. 4d). The unit for the sharpness obtained in the above way is (m · s)−1.
Fig. 4.
Comparison of TV (L1-norm) reconstruction in (a) with classic Tikhonov (L2-norm) reconstruction in (b). The breast has a 55 × 47 × 37 mm invasive ductal carcinoma at 12:00-1:00 o'clock. Those pixels inside the solid ellipse but outside the dashed ellipse are used to calculate the mean background sound-speed for (a) and (b),respectively. (c) Sound-speed cross-sections along the solid line in (a) and the dashed line in (b). (d) Segmented sound-speed image from (a). The left over pixels have sound-speeds high than background (1468 m/s) but lower than half power value (1530 m/s). (e) Segmented sound-speed image from (b). The left over pixels have sound-speeds high than background (1436 m/s) but lower than half power value (1501 m/s). The sound-speed scale in (a) and (b) is from 1350 m/s to 1468 m/s.
Select region of interest (ROI)
Two methods were used to isolate lesions in the sound-speed tomograms as described in the following.
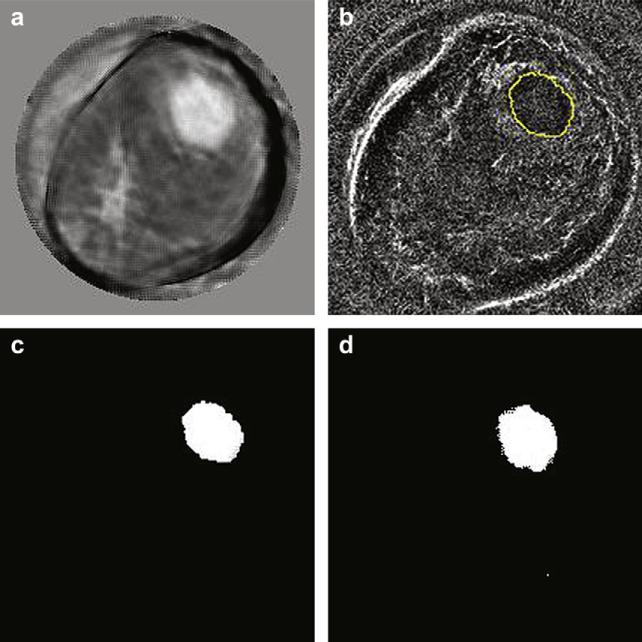
The first method utilizes CURE reflection images for regions-of-interest (ROI) selection at the lesion locations. Since CURE reflection images were reconstructed from the same data as sound-speed images, they can be registered without any geometric discrepancies. Figure 5a shows a typical sound-speed tomogram, with an invasive ductal carcinoma at 12:00 to 1:00 o’clock. The reflection image in Figure 5b for the same slice has a clear edge for the lesion and the ROI within the enclosed curve was manually selected. A plugin for ImageJ that was developed in-house was used to record a mask image with all ones (1) within the selected ROI and all zeros (0) outside the ROI. The sound-speed tomogram in Figure 5a was multiplied by the mask image, and the resulting image is shown in Figure 5c with all 0s except that the original sound-speed values are unchanged within the ROI.
Fig. 5.
ROI selection by referring to CURE reflection. (a) Sound-speed image showing an invasive ductal carcinoma at 12:00 to 1:00 o'clock. (b) ROI was manually selected in reflection image. (c) The ROI in (b) was applied to the image in (a) resulting the sound-speed image ith all 0's except that the original sound-speed values were unchanged within the ROI. (d) ROI selected by thresholding method.
The second method was used to select an ROI when there was no clear lesion edge in the reflection image. In this method, the half-power sound-speed (HpSS) is calculated following those steps as described in the section “Define sharpness of lesion edges”. The ROI is selected by thresholding the sound-speed image obtained in step (1) with HpSS. This ROI selection method was also applied to the sound-speed image in Figure 5a and the resulting image (Fig. 5d) is put next to the one obtained by referring to reflection image (Fig. 5c) for visual comparison.
RESULTS
Phantom study
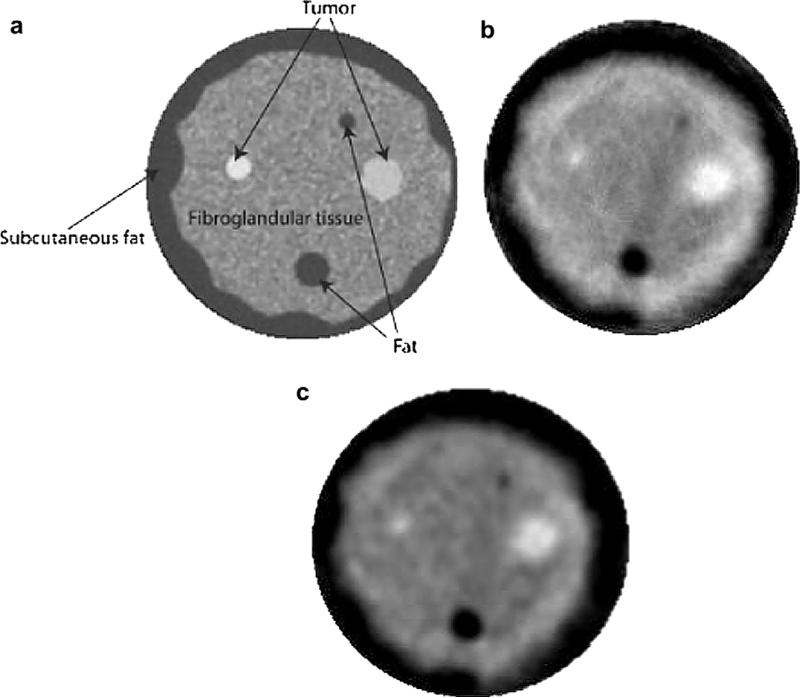
An initial phantom study was performed to justify the selection of imaging parameters and evaluate the accuracy of our algorithm for the in vivo study. The breast phantom was built by Dr. Ernest Madsen of the University of Wisconsin and provides tissue-equivalent scanning characteristics of highly scattering, predominantly parenchyma breast tissue. A representative X-ray CT scan of the breast phantom is shown in Figure 3a. The phantom mimics the presence of benign and cancerous masses embedded in glandular tissue. The sound-speed reconstructions using the TV and the Tikhonov regularizations are presented in Figure 3b and c with an absolute sound-speed scale from 1470 m/s to 1560 m/s.
Fig. 3.
Tomography images of breast phantom. (a) X-ray CT scan of breast phantom. (b) TV bent-ray ultrasound tomogram. (c) Tikhonov bent-ray ultrasound tomogram. The sound-speed scale in (b) and (c) is from 1470 m/s to 1560 m/s.
We quantitatively assessed the reconstructions shown in Figure 3b and c (Table 1). The results in Table 1 show that both the TV and the Tikhonov reconstructions are generally consistent with the known sound-speed values and with the phantom's X-Ray CT appearance. The TV reconstruction demonstrates a higher accuracy than the Tikhonov one in the phantom study, thereby justifying a comparison of the two methods using in vivo data. Furthermore, the phantom study helped us select the imaging parameters that were used in the comparative in vivo study described below.
Table 1.
Comparison of calculated and known sound-speeds for breast phantom
| Material | Diameter (mm) | Known sound-speed (m/s) | TV calculated sound-speed (m/s) | Tikhonov calculated sound-speed (m/s) |
|---|---|---|---|---|
| Big fat sphere | 12 | 1470 | 1468 | 1472 |
| Small fat sphere | 6 | 1470 | 1480 | 1488 |
| Subcutaneous fat | 1470 | 1468 | 1470 | |
| Glandular | 1515 | 1515 | 1508 | |
| Small tumor | 9 | 1549 | 1544 | 1539 |
| Irregular tumor | 15 | 1559 | 1558 | 1552 |
In vivo study
Total-variation (L1-norm)) regularization vs. Tikhonov (L2-norm) regularization.
We compared the TV reconstruction (third iteration) with those reconstructed with the classic Tikhonov regularization (third iteration). One example is shown in Figure 4. Figure 4 shows a TV tomogram (a), Tikhonov tomogram (b) and sound-speed cross-sections (c) along the solid line from the TV tomogram and along the dashed line in Tikhonov tomogram. The breast in Figure 4 has a 55 × 47 × 37 mm invasive ductal carcinoma at 12:00 to 1:00 o'clock. Note that the TV method not only preserved sharper edges of the lesionbut also damped out the “ray” artifacts more than the Tikhonov method. For fair comparison, the two tomograms in Figure 3 are shown in the same absolute sound-speed scale ranging from 1350 m/s to 1600 m/s.
We calculated the edge sharpness of the lesion in Figure 4 according to the method described in the “Define sharpness of lesion edges” section. The obtained sharpness in Figure 4a is 0.094 (m · s)−1, while the sharpness for the lesion in Figure 4b is 0.049(m · s)−1. In addition, we selected one breast with a lesion from each density category (from fatty to dense) to further assess the improvement of the TV regularization over the Tikhonov regularization. The calculated results are shown in Table 2. The average improvement of lesion edge sharpness using the TV method is 1.88 times over the Tikhonov method.
Table 2.
Comparison of sharpness of lesion edges
Bent-ray inversion vs. straight-ray inversion.
We also compared TV bent-ray sound-speed tomograms for in vivo data with their straight-ray counterparts. Our analysis showed that, for our selected patients, the TV bent-ray approach led to sharply improved image quality (i.e. lesion sharpness). In vivo examples are used to illustrate this point.
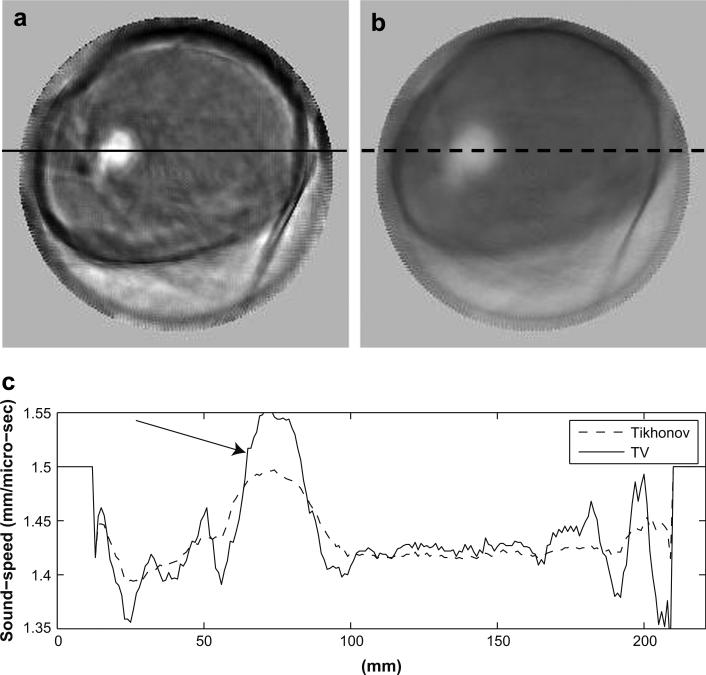
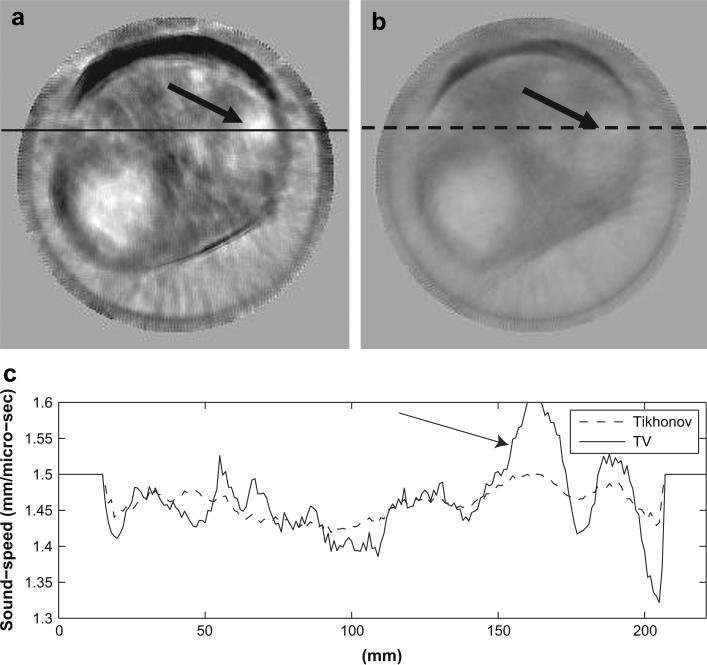
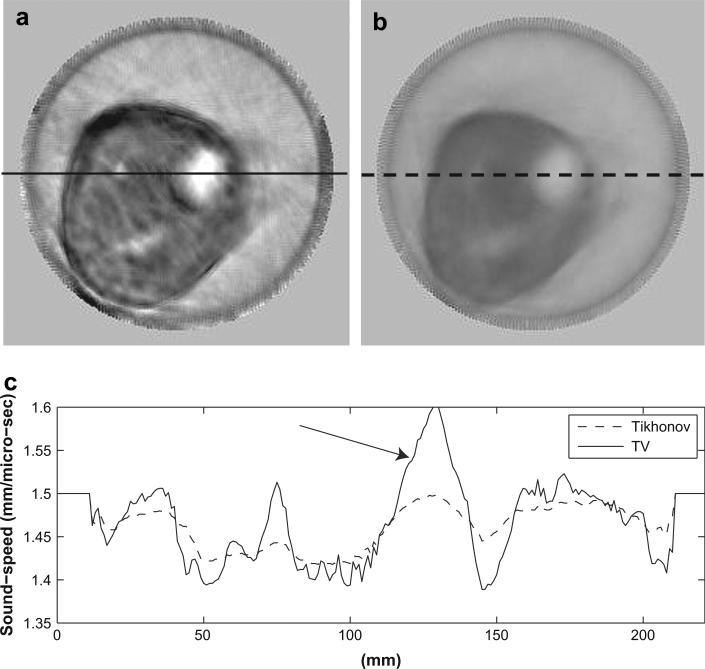
In Figure 6 through Figure 8, we show three examples to demonstrate the improvements of the TV bent-ray reconstructions over the corresponding straight-ray ones. For fair comparisons, the TV bent-ray tomograms and the straight-ray tomograms are shown in the same absolute sound-speed scale from 1350 m/s to 1550 m/s. In all three figures, (a) are the TV bent-ray inversions (third iteration), (b) are the straight-ray inversions, and (c) are sound-speed cross-sections along the solid line in (a) (upper panel) and the dashed line in (b) (lower panel). Arrows in all three figures indicate the lesion locations. A fibroadenoma within a fatty breast is shown in Figure 6. The TV bent-ray inversion exhibited higher resolution and sharper lesion edge than the straight-ray inversion. Figure 7 shows a high sound-speed mass at the 2:00 o'clock position in a patient with scattered breast density, which was pathologically confirmed as a 4.8 × 1.7 × 2.9 cm invasive carcinoma. The sound-speed and position tracings for the TV bent-ray image (Fig. 6c, top) confirm a significantly higher sound-speed for the mass (mean 5 1553 m/s) than the adjacent water in the bath (mean = 1498 m/s; one-sided p < 0.001). Whereas the straight-ray image (Fig. 6c, bottom) shows no significant sound-speed differences between the tumor and adjacent water (mean = 1491 m/s vs. 1488 m/s; one-sided p > 0.19). The dense breast shown in Figure 8 shows a 1.6 × 1.1 × 1.8 cm fibroadenoma in the 2:00 o'clock position. The higher contrast for the fibroadenoma is confirmed by the sound-speed tracing (Fig. 8a and c, upper), effectively making it much more clinically discernible than the straight-ray inversion (Fig. 8b and c, lower). Again, the straight-ray tomogram has the mass sound-speed insignificantly different than from the adjacent water, literally washing out the image. In this article, p values were calculated using a one-sided z-test.
Fig. 6.
Sound-speed tomograms for a breast with a 21 × 17 × 20 (mm) fibroadenoma at 9:00-10:00 o'clock. (a) Sound-speed tomograms using bent-ray algorithm (third iteration); (b) Sound-speed tomograms using straight-ray algorithm. (c) Sound-speed along the solid line in (a) and the dashed line in (b). The sound-speed scale in (a) and (b) is from 1350 m/s to 1550 m/s.
Fig. 8.
Sound-speed tomograms for a dense breast with a 16 × 11 × 18 mm fibroadenoma at 2:00 o'clock. (a) Sound-speed tomograms using bent-ray algorithm (third iteration); (b) Sound-speed tomograms using straight-ray algorithm. (c) Sound-speed along the solid line in (a) and the dashed line in (b). The sound-speed scale in (a) and (b) is from 1350 m/s to 1550 m/s.
Fig. 7.
Sound-speed tomograms for a breast with scattered fibroglandular tissue containing a 27 × 17 × 19 mm invasive ductal carcinoma at 2:00 o'clock. (a) Sound-speed tomograms using bent-ray algorithm (third iteration); (b) Sound-speed tomograms using straight-ray algorithm; (c) Upper panel: sound-speed along the solid line in (a). Sound-speed along the solid line in (a) and the dashed line in (b). The sound-speed scale in (a) and (b) is from 1350 m/s to 1550 m/s.
Sound-speeds of the lesions are also illustrated in their cross-sections (Fig. 6c through Fig. 8c), where the lesions are indicated by arrows. The edge sharpness was calculated as described in the section “Define sharpness of lesion edges”. The same three breasts as in previous section were analyzed to compare the lesion edge sharpness for bent-ray reconstruction and straight-ray reconstruction. The average improvement using the TV bent-ray is 2.6 times over the TV straight- ray ones. The calculated results for the four lesions are presented in Table 2.
Fatty tissue vs. breast parenchyma.
Breast density is a known risk factor for developing breast cancer. Breast density is determined by the ratio of breast parenchyma to fatty tissue within the breast. Separation of fatty tissue from breast parenchyma would be a significant step for breast density evaluation using our sound-speed tomograms (Glide et al. 2007; Glide-Hurst et al. 2008).
We utilized the k-mean clustering routine of ImageJ to segment the sound-speed tomograms for a cohort of 61 patients. To reduce workload, we segmented every 10th sound-speed tomogram for each patient. Since the abnormal lesions were not considered part of the normal breast architecture, we removed them from the sound-speed tomograms before we applied the clustering. Details of k-mean clustering segmentation are described by Glide et al. (2007). For more quantitative comparison, we calculated the mean sound-speeds for fatty tissue and breast parenchyma based on these segmentation results. The calculated mean sound-speeds were 1422 ± 9 m/s (mean ± SD) and 1487 ± 21 m/s for fatty tissue and breast parenchyma (one-sided p > 0.001), respectively (Table 3).
Table 3.
Mean sound-speed with standard deviation (SD)
| Sound-speed (m/s) | |
|---|---|
| Fat | 1422 ± 9 |
| Parenchyma | 1487 ± 21 |
| Malignant mass | 1548 ± 17 |
| Benign mass | 1513 ± 27 |
Benign vs. malignant lesions.
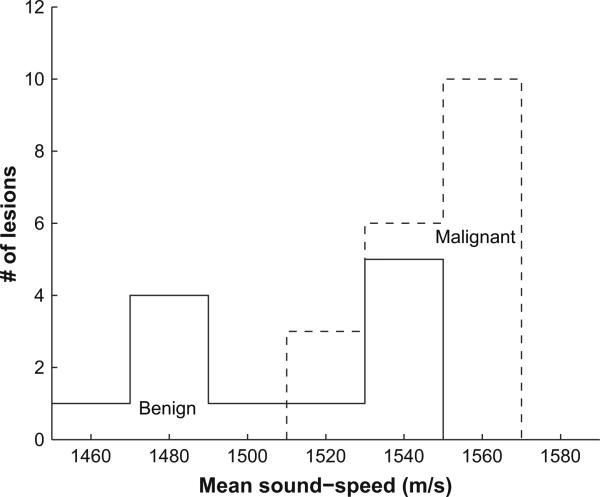
Out of 32 lesions in 61 patients, 19 were malignant (16 invasive ductal carcinoma (IDC) and 3 ductal carcinoma in situ (DCIS); mean age: 48.24 ± 11.31 yrs) and 13 were benign (8 fibroadenoma and 5 cysts, complicated cysts or fibrocystic structures; mean age: 44.17 ± 13.44 years). We selected the slices that contained lesions based on radiologists’ evaluations. We isolated lesions using the methods discussed in the section “Select region of interest (ROI).” Of a total 32 lesions, 20 were isolated with the first method and 12 were isolated using the second method. The mean sound-speed of a lesion for a single patient was calculated by summing all sound-speeds for every pixel within the ROI in the selected slices, then dividing this summation by the total number of pixels. To avoid bias because of different ROI selection methods, we compared the mean sound-speeds for benign and malignant lesions for the above two groups (Table 4). No systematic difference was seen between these two ROI selection methods. Mean sound-speed histograms for 13 benign lesion and 19 malignant lesions are depicted in Figure 9, where malignant lesions show, on average, higher mean sound-speed than benign lesions. As presented in Table 3, the mean sound-speeds for malignant and benign lesions were 1548±17 m/s and 1513±27 m/s (one-sided p > 0.001), respectively.
Table 4.
Mean sound-speed with standard deviation (SD)
| Mean sound-speed (m/s) (ROI selected by referring to reflection image) | Mean sound-speed (m/s) (ROI selected by thresholding) | |
|---|---|---|
| Benign | 1514 ± 34 | 1511 ± 14 |
| Malignant | 1549 ± 18 | 1546 ± 16 |
ROI = region-of-interest.
Fig. 9.
Histogram of mean sound-speeds for 13 benign lesions (solid line) and 19 malignant lesions (dashed line).
DISCUSSION
The results of the phantom study, summarized in Figure 3 and Table 1 provided the necessary calibration to justify the application of the TV bent-ray tomography to in vivo breast data. In addition, the comparisons in Figure 4 make it clear that the TV reconstruction is superior to the reconstruction obtained with the classic Tikhonov regularization. Although TV is computationally more intensive than Tikhonov reconstruction, Vogel et al. (1998) demonstrated that this difference was not significant. Our own experience suggests that reconstruction time for TV and Tikhonov regularization are about the same. We also compared in vivo TV bent-ray tomograms with their straight-ray counterparts. These comparisons (Fig. 6 to Fig. 8, especially the cross-section plots from Fig. 6c through 8c) clearly showed that the TV bent-ray tomograms exhibited more tissue structures within the breast than their straight-ray counterparts. It was also obvious that the straight-ray tomograms were strongly degraded relative to the TV bent-ray tomograms because the linear approximation in straight-ray tomography was not accurate enough for the nonlinear inverse problem. For our TV bent-ray tomograms (Fig. 6 through Fig. 8), there were improvements for average sharpness of lesion edges seen in all four breasts from fatty to dense. Perhaps more importantly, the improved contrast in the TV bent-ray tomograms leads to significantly greater enhancement of the masses relative to the background. Also, our results on mean sound-speeds of benign (1513±27 m/s) and malignant lesions (1548±17 m/s) generally corresponds with those reported in literature. Duck (1990) has calculated the mean sound-speeds for carcinoma and fibroadenoma to be 1584±27 m/s and 1550±32 m/s, respectively. Chang et al. (2007) reports a mean sound-speed of 1499.8±26.8 m/s for fibroadenoma and a mean sound-speed of 1530.9±36.2 m/s for carcinoma.
The results of our study suggest three potential clinical applications for our TV bent-ray algorithm that require accurate differentiation of focal areas that have different sound-speeds, including tracking them over time as a means to potentially reduce overall x-ray exposure to the breast in screening and follow-up. First, our sound-speed tomograms may be used to improve the accuracy of assessing breast density. Second, they can help to improve the detection and characterization of breast lesions. Third, they also can be used to better monitor clinical response of breast cancer patients to neo-adjuvant chemotherapy. We now discuss each of these applications.
Breast density is an important risk factor for developing breast cancer. Studies have shown that women with high mammographic breast density are at higher risk of developing breast cancer (Boyd et. al. 1995, 2002; Wolfe, et al. 1987; Hall 2008). We have previously shown (Glide et al. 2007; Glide-Hurst et al. 2008) a definite positive correlation (Pearson correlation coefficient = 0.87) between mean sound-speed values and breast density. From fatty to dense breasts, the mean sound-speed values tend to increase. Based on straight-ray reconstructions, Glide-Hurst et al. (2008) already established the feasibility of employing CURE sound-speed tomograms to estimate volumetric breast density. As a result, CURE sound-speed tomograms can be potentially used to assess this breast cancer risk factor. Our in vivo study indicates that the TV bent-ray tomography algorithm can successfully image fatty and glandular tissue within the breast with higher resolution than the straight-ray algorithm (Fig. 6 through Fig. 8). As a result, we expect more accurate and better quantitative correlation between sound-speed and breast density in future studies.
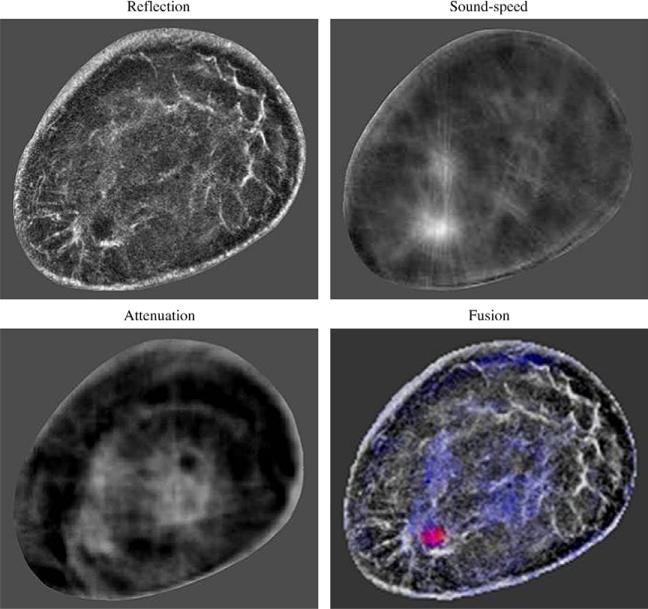
Another potential clinical application is to help detect and characterize breast lesions. Since most abnormal breast lesions have higher sound-speed than normal breast tissue (Gauss et al. 1997), UCT is a potential way to detect abnormal breast lesions. More importantly, our study suggests greater detection of these elevated sound-speeds over the background for both malignant and benign breast lesions with the TV bent-ray algorithm. This further confirmed the feasibility of using sound-speed UCT to detect breast lesions, allowing higher contrast settings and improved threshold values for more prospective assessment of mass detection in the future. These more accurate sound-speed characterizations also applied to characterizing higher sound-speeds for malignant than benign lesions. One potential way to characterize a breast lesion is to compare a sound-speed tomogram with the corresponding CURE attenuation and reflection images. Statistically, the malignant lesions have elevated sound-speed and attenuation relative to surrounding tissue (Greenleaf et al. 1977). The architectural distortion at the tumor region in the reflection image is another indicator of cancer (Stavros et al. 1995). The addition of reflection and attenuation data can potentially further improve the separation of benign from cancer as illustrated in the color-coded fused image in Figure 10. Studies based on such image fusions are undergoing in our group.
Fig. 10.
Color-coded fused image for a breast with an infiltrating ductal carcinoma. CURE images are constructed from the same data, so they can be fused together without any geometric discrepancies.
The third potential clinical application of UCT is to monitor clinical response of breast cancer patients to neo-adjuvant chemotherapy. Although chemotherapy is widely used to treat cancers, it is important to identify patients who are not responding to chemotherapy as early as possible, to avoid unsuccessful treatment strategies and unnecessary side effects (Rousseau et al. 2006; Tozaki 2008). Accurate evaluation of a tumor's response to therapy is also necessary to plan for surgery (Partridge et al. 2002; Londero et al. 2004). In an ongoing study, we have used CURE images to monitor the progress of chemotherapy for six patients. CURE exams were performed at each cycle of chemotherapy. The sound-speed distribution from each scan was reconstructed to track the change in size, shape and mean sound-speed of the tumor. Compared with MRI, a significant potential advantage of using our sound-speed tomograms for chemotherapy monitoring is the low cost for both patients and health care providers. Figure 11 illustrates our sound-speed tomograms, fused with CURE attenuation and reflection images, for one patient’ chemotherapy monitoring, in which the change of the tumor size and shape during chemotherapy is demonstrated. Again, the greater potential accuracy of sound-speed measurements with the TV bent-ray algorithm and the ability to increase the contrast over the background makes this a more feasible procedure which could easily be automated and compared for patients at each follow-up visit over time.
Fig. 11.
Clinical response of one breast cancer patient to neo-adjuvant chemotherapy shown in gray-scale fused images (sound-speed + reflection) over a period of 8 weeks. The time resolution was 2 weeks. The large mass is in the 2 o'clock position and shows dramatic shrinkage over time.
There are several limitations in our study. First, the performance of our tomography algorithm declined when the lesion size dropped to and below the elevation beam width (5 mm for our ring array), since the signal dilution led to a loss of contrast. Another important factor influencing the performance of our algorithm is the signal-to-noise ratio of the acquired patient data. Although our in-house time-of-flight picker was tolerant to white noise, coherent noise in the ultrasound data might still affect the performance of the picker (Li et al. 2009). Thus, low signal-to-noise of the data might affect the accuracy of our time-of-flight picks. Consequently, bigger data errors would degrade the reconstructed sound-speed tomograms. Second, the trade-off between image resolution and computation speed needs to be balanced. For a typical breast scan with 76 slices, three-iteration inversion of the whole stack with 2 mm by 2 mm grid points on a 2.4 GHz Dell Precision workstation Duo Core (4 GB memory, redhat linux, Dell Inc., Round Rock, Texas) required 1.5 hours to finish. If 1 mm by 1 mm grid size is used, the running time on the same computer is ~4 hours. Since most parts of our current algorithm implementation are sequential, the computation speed can be improved by parallelizing the code. Finally, the clinical implications suggest that it will be important to assess the relative contrast levels for algorithms in defining thresholds for viewing images on a prospective basis. Accurate depictions of local areas of increase sound-speed may then become more reliable parameters for diagnostic assessment in clinical applications.
CONCLUSIONS
We developed a TV based bent-ray tomography algorithm for imaging the sound-speed distribution of the breast. We applied this algorithm to 61 breast datasets acquired using our clinical prototype CURE. Our sound-speed images showed that the TV regularization, in combination with bent-ray tomography, better defined lesion edges and improved not only spatial resolution but significantly improved tissue contrast for better lesion conspicuity over background. Fatty and dense tissues could be well separated and mean sound-speeds of malignant lesions was higher than that of benign masses on average. Fusing sound-speed images with the corresponding attenuation and reflection images may help differentiate benign from malignant breast lesions. The lower costs compared with MRI and the lack of radiation exposure potentially allows UCT a prominent role in the future for therapeutic interventions, either for breast density deduction or cancer treatment.
Acknowledgements
The authors wish to thank Lisa Bey-Knight for her help in recruiting patients and data collection. C. Li also wants to acknowledge Jason Shen for his assistance for the ROI segmentation of our images. This work was supported in part by research grant from the Michigan Economic Development Corporation (MEDC) and Susan G. Komen Breast Cancer Foundation. L. Huang also acknowledges the support of the U.S. DOE Laboratory-Directed Research and Development program at Los Alamos National Laboratory.
REFERENCES
- ACRIN Available at: http://www.acrin.org.
- Andersen AH. Ray linking for computed tomography by rebinning of projection data. J Acoust Soc Am. 1987;81:1190–1192. [Google Scholar]
- Andersen AH. A ray tracing approach to restoration and resolution enhancement in experimental ultrasound tomography. Ultrasound Imaging. 1990;12:268–291. doi: 10.1177/016173469001200403. [DOI] [PubMed] [Google Scholar]
- Andre MP, Janee HS, Martin PJ, Otto GP, Spivey BA, Palmer DA. High-speed data acquisition in a diffraction tomography system employing large-scale toroidal arrays. Int J Imaging Syst Technol. 1997;8:137–147. [Google Scholar]
- Boyd NF, Byng JW, Jong RA, Fishell EK, Little LE, Miller AB, Lockwood GA, Tritchler DL, Yaffe MJ. Quantitative classification of mammographic densities and breast cancer risk: Results from the Canadian National Breast Screening Study. J Natl Cancer Inst. 1995;87:670–675. doi: 10.1093/jnci/87.9.670. [DOI] [PubMed] [Google Scholar]
- Boyd NF, Dite GS, Stone J, Gunasekara A, English DR, McCredie MR, Giles GG, Tritchler D, Chiarelli A, Yaffe MJ, Hopper JL. Heritability of mammographic density, a risk factor for breast cancer. N Engl J Med. 2002;347:886–894. doi: 10.1056/NEJMoa013390. [DOI] [PubMed] [Google Scholar]
- Carson PL, Meyer CR, Schezinger AL, Oughton TV. Breast imaging in coronal planes with simultaneous pulse echo and transmission ultra-sound. Science. 1981;214:1141–1143. doi: 10.1126/science.7302585. [DOI] [PubMed] [Google Scholar]
- Chang CH, Huang SW, Yang HC, Chou YH, Li PC. Reconstruction of ultrasonic sound velocity and attenuation coefficient using linear arrays: Clinical assessment. Ultrasound Med Biol. 2007;33:1681–1687. doi: 10.1016/j.ultrasmedbio.2007.05.012. [DOI] [PubMed] [Google Scholar]
- Devaney A. Inverse scattering theory within the Rytov approximation. Opt Lett. 1981;6:374–376. doi: 10.1364/ol.6.000374. [DOI] [PubMed] [Google Scholar]
- Devaney A. Inverse formula for inverse scattering within the Born approximation. Opt Lett. 1982;7:111–112. doi: 10.1364/ol.7.000111. [DOI] [PubMed] [Google Scholar]
- Duck FA. Physical properties of tissue. Academic Press; London: 1990. [Google Scholar]
- Duric N, Littrup PJ, Babkin A, Chambers D, Azevedo S, Kalinin A, Pevzner R, Tokarev M, Holsapple E, Rama O, Duncan R. Development of ultrasound tomography for breast imaging: Technical assessment. Med Phys. 2005;32:1375–1386. doi: 10.1118/1.1897463. [DOI] [PubMed] [Google Scholar]
- Duric N, Littrup P, Poulo L, Babkin A, Pevzner R, Holsapple E, Rama O, Glide C. Detection of breast cancer with ultrasound tomography: First results with the Computed Ultrasound Risk Evaluation (CURE) prototype. Med Phys. 2007;34:773–785. doi: 10.1118/1.2432161. [DOI] [PubMed] [Google Scholar]
- Gauss RC, Soo MS, Trahey GE. Wavefront distortion measurements in the human breast. IEEE Ultraon Symp. 1997;2:1547–1551. [Google Scholar]
- Glide CK, Duric N, Littrup P. Novel approach to evaluating breast density utilizing ultrasound tomography. Med Phys. 2007;34:744–753. doi: 10.1118/1.2428408. [DOI] [PubMed] [Google Scholar]
- Glide-Hurst CK, Duric N, Littrup P. Volumetric breast density evaluation from ultrasound tomography images. Med Phys. 2008;35:3988–3997. doi: 10.1118/1.2964092. [DOI] [PubMed] [Google Scholar]
- Greenleaf JF, Johnson A, Lee S, Harman G, Acoustical holography Wood E, Booth N, editors. Plenum; New York: 1974. pp. 591–603. [Google Scholar]
- Greenleaf JF, Johnson A, Bahn RC, Rajagopalan B. Quantitative cross-sectional imaging of ultrasound parameters. Ultrason Symp Proc. 1977:989–995. [Google Scholar]
- Greenleaf JF, Bahn RC. Clinical imaging with transmissive ultrasonic computerized tomography. IEEE Trans Biomed Eng. 1981;28:177–185. doi: 10.1109/TBME.1981.324789. [DOI] [PubMed] [Google Scholar]
- Greenleaf JF, Litalo J, Gisvold JJ. Ultrasonic computed tomography for breast examination. IEEE Eng Med Biol. 1987:27–32. doi: 10.1109/MEMB.1987.5006465. [DOI] [PubMed] [Google Scholar]
- Hansen PC. The L-curve and its use in the numerical treatment of inverse problems. In: Johnston P, editor. Computational inverse problems in electrocardiology. WIT; Southampton, UK: 2001. pp. 119–142. [Google Scholar]
- Hall FM. Mammographically determined breast density and cancer risk. Radiology. 2008;248:1083. doi: 10.1148/radiol.2483080512. [DOI] [PubMed] [Google Scholar]
- Jego JR, Whittinghan TA. Experimental studies in transmission ultra-sound tomography. Phys Med Biol. 1991;36:1515–1527. doi: 10.1088/0031-9155/36/11/011. [DOI] [PubMed] [Google Scholar]
- Jones HW. Recent activity in ultrasonic tomography. Ultrasonics. 1993;31:353–360. doi: 10.1016/0041-624x(93)90069-c. [DOI] [PubMed] [Google Scholar]
- Johnson SA, Tracy ML. Inverse scattering solutions by a sinc basis, multiple source, moment method—Part I: Theory. Ultrason Imaging. 1983;5:361–375. doi: 10.1177/016173468300500406. [DOI] [PubMed] [Google Scholar]
- Johnson SA, Borup DT, Wiskin JW, Natterer F, Wuebbling F, Zhang Y, Olsen C. Apparatus and method for imaging with wavefields using inverse scattering techniques. 1999 United States Patent 6,005,916.
- Klimes L. Grid travel-time tracing: Second-order method for the first arrivals in smooth media. Pageoph. 1996;148:539–563. [Google Scholar]
- Kolb TM, Lichy J, Newhouse JH. Comparison of the performance of screening mammography, physical examination, and breast US and evaluation of factors that influence them: An analysis of 27,825 patient evaluation. Radiology. 2002;225:165–175. doi: 10.1148/radiol.2251011667. [DOI] [PubMed] [Google Scholar]
- Li C, Huang L, Duric N, Zhang H, Rowe C. An improved automatic time-of-fight picker for medical ultrasound tomography. Ultrasonics. 2009;49:61–72. doi: 10.1016/j.ultras.2008.05.005. [DOI] [PMC free article] [PubMed] [Google Scholar]
- Littrup PJ, Duric N, Azevedo S, Chambers DH, Candy JV, Johnson S, Auner G, Rather J, Holsapple ET. Computerized ultrasound risk evaluation (CURE) system: Development of combined transmission and reflection ultrasound with new reconstruction algorithms for breast imaging. Acoust Imaging. 2001;28:175–182. [Google Scholar]
- Littrup PJ, Duric N, Leach RR, Jr., Azevedo SG, Candy JV, Moore T, Chambers DH, Mast JE, Holsapple ET. Characterizing tissue with acoustic parameters derived from ultrasound data.. Ultrasonic Imaging and Signal Processing; Proceedings of the SPIE: Medical Imaging 2002; San Diego, California. Feb. 23-28, 2002.pp. 4687–43. [Google Scholar]
- Liu DL, Waag RC. Propagation and back propagation for ultrasonic wavefront design. IEEE Trans Ultrason Ferroelectr Freq Control. 1997;44:1–13. doi: 10.1109/58.585184. [DOI] [PubMed] [Google Scholar]
- Londero V, Bazzocchi M, Del Frate C, Puqlisi F, Di Loreto C, Francescutti G, Zuiani C. Locally advanced breast cancer: Comparison of mammography, sonography and MR imaging in evaluation of residual disease in women receiving neoadjuvant chemotherapy. Eur Radiol. 2004;14:1371–1379. doi: 10.1007/s00330-004-2246-z. [DOI] [PubMed] [Google Scholar]
- Lucas-Fehm L. Sonographic mammographic correlation. Appl Radiol. 2005 Feb;:20–25. [Google Scholar]
- Marmarelis VZ, Kim T, Shehada RE. Ultrasonic Imaging and Signal Processing; Proceedings of the SPIE: Medical Imaging 2003; San Diego, California. Feb. 23-28, 2002.pp. 5035–6. [Google Scholar]
- Nocedal J, Wright SJ. In: Limited-memory quasi-Newton methods: Numerical optimization. 2nd ed. Mikosch TV, Resnich SI, Robinson SM, editors. Springer; New York: 2000. [Google Scholar]
- Norton SJ. Computing ray trajectories between two points: A solution to the ray-linking problem. Opt Soc Am. 1987;4:1919–1922. [Google Scholar]
- Partridge SC, Gibbs JE, Lu Y, Esserman LJ, Sudilovsky D, Hylton NM. Accuracy of MR imaging for revealing residual breast cancer in patients who have under gone neoadjuvant chemotherapy. AJR. 2002;179:1193–1199. doi: 10.2214/ajr.179.5.1791193. [DOI] [PubMed] [Google Scholar]
- Rousseau C, Devilliers A, Sagan C, Ferrer L. Monitoring of early response to neoadjuvant chemotherapy in stage II and III breast cancer by [18F] fluorodeoxyglucose positron emission tomography. JCO. 2006;24:5366–5372. doi: 10.1200/JCO.2006.05.7406. [DOI] [PubMed] [Google Scholar]
- Rudin LI, Osher S, Fatemi E. Nonlinear total variation based noise removal algorithms. Phys D. 1992;60:259–268. [Google Scholar]
- Scherzinger AL, Belgam RA, Carson PA, Meyer CR, Sutherland JV, Bookstein FL. Assessment of ultrasonic computed tomography in symptomatic breast patients by discriminant analysis. Ultrasound Med Biol. 1989;15:21–28. doi: 10.1016/0301-5629(89)90128-2. [DOI] [PubMed] [Google Scholar]
- Schomberg H. An improved approach to reconstructive ultrasound tomography. J Phys D Appl Phys. 1978;11:L181–L185. [Google Scholar]
- Schreiman J, Gisvold J, Greenleaf RB. Ultrasound transmission computed tomography of the breast. Radiology. 1984;150:523–530. doi: 10.1148/radiology.150.2.6691113. [DOI] [PubMed] [Google Scholar]
- Stavros AT, Thickman D, Rapp CL, Dennis MA, Parker MA, Sisney GA. Solid breast nodules: Use of sonography to distinguish between benign and malignant lesions. Radiology. 1995;196:123–134. doi: 10.1148/radiology.196.1.7784555. [DOI] [PubMed] [Google Scholar]
- Tozaki M. Diagnosis of breast cancer: MDCT vs. MRI. Breast Cancer. 2008;15:205–211. doi: 10.1007/s12282-008-0049-9. [DOI] [PubMed] [Google Scholar]
- Vogel CR, Oman ME. Fast, robust total variation-based reconstruction of noisy, blurred images. IEEE Trans Image Proc. 1998;7:813–824. doi: 10.1109/83.679423. [DOI] [PubMed] [Google Scholar]
- Wolfe JN, Saftlas AF, Salane M. Mammographic parenchymal patterns and quantitative evaluation of mammographic densities: A case-control study. AJR Am J Roentgenol. 1987;148:1087–1092. doi: 10.2214/ajr.148.6.1087. [DOI] [PubMed] [Google Scholar]


