

Abstract
BACKGROUND
Blood pressure (BP) variability has a genetic component, most of which has yet to be attributed to specific variants. One promising strategy for gene discovery is analysis of interactions between single-nucleotide polymorphisms (SNPs) and BP-related factors, including age, sex, and body mass index (BMI). Educational attainment, a marker for socioeconomic status, has effects on both BP and BMI.
METHODS
We investigated SNP–education interaction effects on BP in genome-wide data on 3,836 subjects in families from the Framingham Heart Study. The ABEL suite was used to adjust for age, sex, BMI, medication use, and kinship and to perform 1 degree-of-freedrom (df) and 2 df SNP–education interaction tests.
RESULTS
An SNP in PTN was associated with increased systolic BP (5.4mm Hg per minor allele) in those without a bachelor’s degree but decreased systolic BP (1.6mm Hg per allele) in those with a bachelor’s degree (2 df; P = 2.08×10⁻⁸). An SNP in TOX2 was associated with increased diastolic BP (DBP; 4.1mm Hg per minor allele) in those with no more educational attainment than high school but decreased DBP in those with education past high school (−0.7; 1 df; P = 3.74×10⁻⁸). Three suggestive associations were also found: in MYO16 (pulse pressure: 2 df; P = 2.89×10⁻⁷), in HAS2 (DBP: 1 df; P = 1.41×10⁻⁷), and in DLEU2 (DBP: 2 df; P = 1.93×10⁻⁷). All 5 genes are related to BP, including roles in vasodilation and angiogenesis for PTN and TOX2.
CONCLUSIONS
PTN and TOX2 are associated with BP. Analyzing SNP–education interactions may detect novel associations. Education may be a surrogate for unmeasured exposures and behaviors modifying SNP effects on BP.
Keywords: blood pressure, educational attainment, gene–education interaction, GWAS, hypertension, interaction.
Elevated blood pressure (BP) is a major risk factor for cardiovascular disease and renal failure and was the leading global health burden in 2010,1 annually costing tens of billions of dollars in the United States alone. Evidence suggests that systolic BP (SBP) and diastolic BP (DBP) have a heritability of at least 30%, but genetic variants identified thus far explain <3% of the total phenotypic variability.2 Several explanations have been offered for this so-called missing heritability,3 and diverse research strategies addressing these explanations have emerged to pursue it. In addition to meta-analyses in enormous genome-wide association study consortia,2 investigators have focused on sequence data and the role of rare variants,4 as well as subphenotypic distinctions within hypertension5 (e.g., degree of salt sensitivity and of sympathetic nervous activation). Another recently expanding field explores the role of interactions amongst single nucleotide polymorphisms (SNPs)6 and between SNPs and other factors known to influence BP such as age,7 sex,8 and body mass index (BMI).8 Motivated by the observation that these variables are directly correlated with BP themselves, these studies of SNP–covariable interactions test the hypothesis that these covariables also modulate the effect of SNPs on BP and have reported compelling evidence supporting that hypothesis.
One such variable just beginning to receive attention for its role in BP is educational attainment. Noting that educational attainment is inversely associated with cardiovascular disease in developed countries,9 Loucks et al. tested BP as an explanatory mechanism in the Framingham Heart Study. They reported that educational attainment (≤12 years vs. ≥17 years) was also inversely correlated with BP, both as a baseline effect and as a change in SBP over a 30-year life span (the latter particularly in female subjects).10 The contrast between those with limited literacy and those with adequate literacy showed a complex effect on SBP, with the direction of effect varying depending on the health-care system used: those with limited literacy had lower SBP in the Veterans Affairs healthcare system but higher in the university healthcare system.11 A study of low-income rural Mexican women showed no association between BP and educational attainment, although the study reported a negative association between BP and 3 other socioeconomic indicators: household income, housing, and assets.12 Variance component modeling in the Strong Heart Family Study also indicated that educational attainment has a modifying effect on the contribution of SNPs to BP variance, with evidence suggesting distinct genetic effects on DBP among those with less than high school education as compared with those with at least high school education.13 Although these studies provide evidence of an association between educational attainment and BP, to our knowledge this study is the first to report associations arising from SNP–education interactions on BP.
METHODS
Subjects
The data were drawn from the Framingham SNP Health Association Resource (SHARe) from the database of Genotypes and Phenotypes (dbGaP; http://www.ncbi.nlm.nih.gov/projects/gap/cgi-bin/study.cgi?study_id=phs000342.v8.p8). The Framingham Heart Study is a longitudinal study with 3 cohorts: the Original cohort, the Offspring cohort, and the Third Generation cohort. The Original cohort was recruited in 1948. The Offspring cohort was recruited in 1971, consisting of the offspring of the Original cohort, as well as the spouses and children of those offspring. The biological and adopted offspring of the Offspring cohort form the Third Generation cohort, recruited in 2002. The analysis data were taken from the Third Generation cohort’s single visit because only this cohort provided the educational attainment data used in our analysis.
Phenotypes and genotypes
Three measurements (1 nurse/technician reading and 2 physician readings) were taken for each subject for SBP and DBP, and the averages of these 3 values were used for the analysis; mean arterial pressure (MAP; calculated as two-thirds of average DBP plus one-third of average SBP) and pulse pressure (PP; calculated as average SBP minus average DBP) were derived.
Subjects were genotyped on the GeneChip Human Mapping 500k Array Set (Affymetrix, Santa Clara, CA) containing 487,998 SNPs. Eight thousand four hundred seventy-seven subjects (across all 3 cohorts) had an additional 2.5 million SNPs imputed using MACH.14 These SNPs were filtered by the absence of Mendelian errors, minor allele count ≥30 among all 3 cohorts in the most recent visit, Hardy–Weinberg equilibrium (P ≥ 10–6), and good quality for imputed SNPs (r 2 ≥ 0.3).
All subjects had nonmissing genotype and imputed data, as well as complete data for SBP, DBP, both education covariables, age, sex, BMI, and hypertension medication use; this limited the analysis dataset to 3,386 Third Generation cohort subjects. Two education covariables were derived from the raw Framingham Heart Study education variable. This raw variable contains 9 categories: 0 = no schooling; 1 = grades 1–8; 2 = grades 9–12; 3 = high school graduate; 4 = some college; 5 = technical school; 6 = associate’s degree; 7 = bachelor’s degree; 8 = graduate/professional degree. We derived Comp_HS+ as a dichotomous variable distinguishing those with no more than high school education (categories 0–3) from those with at least some college (categories 4–8), and Comp_BA as a dichotomous variable distinguishing those without a bachelor’s degree (categories 0–6) from those with a bachelor’s degree (categories 7–8). Descriptive statistics for this sample are shown in Table 1.
Table 1.
Study sample descriptive statistics
| Trait | Value |
|---|---|
| Sample size | 3,836 |
| % Comp_HS+ | 84.7% |
| % Comp_BA | 53.2% |
| % Male sex | 47% |
| Age | 40.2±8.8 |
| BMI | 26.9±5.5 |
| % Taking antihypertensive meds | 8.6% |
| SBP | 116.3±13.7 |
| DBP | 75.7±9.3 |
| MAP | 89.2±10.1 |
| PP | 40.6±8.9 |
Data are mean ± SD unless otherwise stated.
Abbreviations: BMI, body mass index; Comp_BA, dichotomous variable distinguishing those without a bachelor’s degree from those with a bachelor’s degree; Comp_HS+, dichotomous variable distinguishing those with no more than high school education from those with at least some college; DBP, diastolic blood pressure; MAP, mean arterial pressure; PP, pulse pressure; SBP, systolic blood pressure.
Analysis
For each combination of BP trait and education covariable, we used the following linear mixed model:
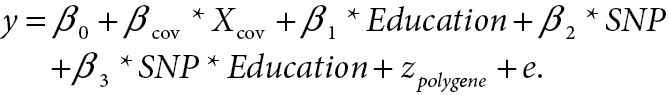 |
where Xcov refers to the covariables age, age squared, sex, BMI, and use of hypertension medication, and zpolygene is a random effect to account for family relationships using the kinship matrix. Using this model, we performed the 1 degree-of-freedom (df) test of the SNP–education interaction (β3), and the 2 df joint test of the SNP main effect and SNP–education interaction (β2 and β3).15 These analyses were performed using the ABEL suite, including GenABEL (c 1.6–6), ProbABEL (v 0.1-9e), and MixABEL (v 0.0–9).16,17 MixABEL is one of few packages that can provide the 2 df joint test for family data; we also found the ABEL suite to be faster than other options, which was an important practical consideration for this analysis of approximately 2.5 million imputed SNPs on multiple combinations of phenotype and education covariable.
For both the 1 df and 2 df SNP–education interaction tests, the genomic inflation factor λ was calculated as the ratio of the observed median χ2 value to the expected median χ2 value. None of the analyses yielding significant or suggestive loci exhibited substantial evidence of inflation, with λ values in the range 1.02–1.08 (Table 2), as expected for highly polygenic traits.18 Figure 1a–d show QQ plots for these analyses.
Table 2.
Genomic control λ values
| Covariable (test) | SBP | DBP | MAP | PP |
|---|---|---|---|---|
| Comp_HS+ (1 df) | 1.990 | 1.052 | 1.098 | 1.076 |
| Comp_HS+ (2 df) | 1.132 | 1.071 | 1.079 | 1.070 |
| Comp_BA (1 df) | 1.018 | 1.032 | 1.014 | 1.018 |
| Comp_BA (2 df) | 1.043 | 1.061 | 1.036 | 1.038 |
Abbreviations: Comp_BA, dichotomous variable distinguishing those without a bachelor’s degree from those with a bachelor’s degree; Comp_HS+, dichotomous variable distinguishing those with no more than high school education from those with at least some college; DBP, diastolic blood pressure; df, degrees of freedom; MAP, mean arterial pressure; PP, pulse pressure; SBP, systolic blood pressure.
Figure 1.


QQ plots for selected combinations of blood pressure phenotype, education covariable, and interaction test. (a) QQ plot for joint 2 degrees-of-freedom (df) test of single nucleotide polymorphism (SNP) main effect and interaction of SNP with a dichotomous variable distinguishing those without a bachelor’s degree from those with a bachelor’s degree (Comp_BA) for systolic blood pressure (SBP). (b) QQ plot for 1 df test of interaction of SNP with a dichotomous variable distinguishing those with no more than high school education from those with at least some college (Comp_HS+) for diastolic blood pressure (DBP). (c) QQ plot for 1 df test of SNP-Comp_HS+ interaction for pulse pressure (PP). (d) QQ plot for 2 df test of SNP main effect and SNP-Comp_BA interactions for DBP.
RESULTS
Figure 2a–d show Manhattan plots for the indicated combination of BP trait (SBP, DBP, or PP), educational attainment covariable (Comp_HS+ or Comp_BA), and test (1 df interaction or 2 df joint test). There were 2 loci reaching significance at α = 5×10⁻⁸ and 3 suggestive loci with P < 5×10⁻⁷. These SNPs are summarized in Table 3 (significant loci) and Table 4 (suggestive loci).
Figure 2.


Manhattan plots for selected combinations of blood pressure phenotype, education covariable, and interaction test. (a) Manhattan plot of the joint 2 degrees-of-freedom (df) test of the singlue nucleotide polymorphism (SNP) main effect and interaction of SNP with a dichotomous variable distinguishing those without a bachelor’s degree from those with a bachelor’s degree (Comp_BA) for systolic blood pressure (SBP). The –log10(P value) is plotted by genomic position. One novel locus reaching significance is located on chromosome 7 (PTN). (b) Manhattan plot of the 1 df test of interaction of SNP with a dichotomous variable distinguishing those with no more than high school education from those with at least some college (Comp_HS+) for diastolic blood pressure (DBP). The –log10(P value) is plotted by genomic position. One novel locus reaching significance is located on chromosome 20 (TOX2), and a suggestive locus is located on chromosome 8 (HAS2). (c) Manhattan plot of joint 1 df test of the SNP main effect and SNP-Comp_HS+ interaction for pulse pressure (PP). The –log10(P value) is plotted by genomic position. A suggestive locus is located on chromosome 13 (MYO16). (d) Manhattan plot of joint 2 df test of the SNP main effect and SNP-Comp_BA interaction for DBP. The –log10(P value) is plotted by genomic position. A suggestive locus is located on chromosome 13 (DLEU2).
Table 3.
Significant single nucleotide polymorphism–education interactions
| SNP rs no. | Chr | Location | Type | MAF | Trait | Covariable | Beta (Main) | SE (Main) | Beta (Int) | SE (Int) | P value 1 df interaction | P value 2 df interaction |
|---|---|---|---|---|---|---|---|---|---|---|---|---|
| rs12113527 | 7 | PTN intron | Imp | 0.044 | SBP | Comp_BA | −5.40 | 0.98 | 7.05 | 1.29 | 4.28E-08 | 2.86E-08 |
| rs12536916 | 7 | PTN intron | Imp | 0.044 | SBP | Comp_BA | −5.30 | 0.98 | 6.97 | 1.29 | 5.83E-08 | 4.61E-08 |
| rs6979228 | 7 | PTN intron | Imp | 0.044 | SBP | Comp_BA | −5.30 | 0.98 | 6.97 | 1.28 | 5.81E-08 | 4.58E-08 |
| rs7792298 | 7 | PTN intron | Gen | 0.047 | SBP | Comp_BA | 5.50 | 0.99 | −7.18 | 1.29 | 2.90E-08 | 2.08E-08 |
| rs11086907 | 20 | TOX2 intron | Gen | 0.102 | DBP | Comp_HS+ | 4.12 | 0.81 | −4.81 | 0.87 | 3.74E-08 | 2.61E-07 |
Bolded values are those with P < 5.00E-08.
Abbreviations: Comp_BA, dichotomous variable distinguishing those without a bachelor’s degree from those with a bachelor’s degree; Comp_HS+, dichotomous variable distinguishing those with no more than high school education from those with at least some college; DBP, diastolic blood pressure; df, degrees of freedom; Gen, genotyped; Int, interaction effect; Imp, imputed; MAF, minor allele frequency; Main, main effect; SBP, systolic blood pressure; SNP, single nucleotide polymorphism.
Table 4.
Suggestive single nucleotide polymorphism–education interactions
| SNP rs no. | Chromosome | Location | Type | MAF | Trait | Covariable | Beta (Main) | SE (Main) | Beta (Int) | SE (Int) | P value 1 df interaction | P value 2 df interaction |
|---|---|---|---|---|---|---|---|---|---|---|---|---|
| rs4771625 | 13 | MYO6 intron | Imp | 0.37 | PP | Comp_HS+ | 0.23 | 0.05 | −0.29 | 0.05 | 7.61E-08 | 2.89E-07 |
| rs13274659 | 8 | Near HAS2 | Imp | 0.49 | DBP | Comp_HS+ | −2.65 | 0.54 | 3.01 | 0.58 | 2.04E-07 | 1.22E-06 |
| rs1994404 | 8 | Near HAS2 | Imp | 0.49 | DBP | Comp_HS+ | 2.65 | 0.54 | −3.05 | 0.58 | 1.41E-07 | 9.11E-07 |
| rs2171348 | 8 | Near HAS2 | Imp | 0.5 | DBP | Comp_HS+ | −2.63 | 0.55 | 3.03 | 0.59 | 2.84E-07 | 1.79E-06 |
| rs6990539 | 8 | Near HAS2 | Imp | 0.49 | DBP | Comp_HS+ | −2.65 | 0.54 | 3.05 | 0.58 | 1.43E-07 | 9.21E-07 |
| rs6991390 | 8 | Near HAS2 | Imp | 0.49 | DBP | Comp_HS+ | −2.65 | 0.54 | 3.05 | 0.58 | 1.43E-07 | 9.19E-07 |
| rs7839349 | 8 | Near HAS2 | Imp | 0.49 | DBP | Comp_HS+ | −2.72 | 0.55 | 3.09 | 0.60 | 2.16E-07 | 1.28E-06 |
| rs12100048 | 13 | DLEU2 intron | Imp | 0.12 | DBP | Comp_BA | −2.36 | 0.43 | 2.01 | 0.58 | 5.60E-04 | 1.93E-07 |
| rs17073826 | 13 | DLEU2 intron | Imp | 0.13 | DBP | Comp_BA | −2.30 | 0.42 | 1.88 | 0.57 | 1.04E-03 | 2.41E-07 |
| rs17073834 | 13 | DLEU2 intron | Imp | 0.13 | DBP | Comp_BA | −2.27 | 0.42 | −1.82 | 0.57 | 1.45E-03 | 2.86E-07 |
| rs6561575 | 13 | DLEU2 intron | Imp | 0.13 | DBP | Comp_BA | 2.31 | 0.42 | −1.92 | 0.58 | 8.53E-04 | 2.26E-07 |
| rs7981648 | 13 | DLEU2 intron | Imp | 0.13 | DBP | Comp_BA | −2.30 | 0.42 | 1.89 | 0.57 | 9.92E-04 | 2.43E-07 |
Abbreviations: Comp_BA, dichotomous variable distinguishing those without a bachelor’s degree from those with a bachelor’s degree; Comp_HS+, dichotomous variable distinguishing those with no more than high school education from those with at least some college; DBP, diastolic blood pressure; df, degrees of freedom; Int, interaction effect; Imp, imputed; MAF, minor allele frequency; Main, main effect; PP, pulse pressure; SNP, single nucleotide polymorphism.
The most significant interaction (2 df; P = 2.08×10⁻⁸) was between rs7792298 and the Comp_BA covariable on SBP (Figure 2a). This is one of several SNPs in the chromosome 7 locus with similar effects, minor allele frequencies, and P values (see Table 3). Subjects with 1 minor allele and no bachelor’s degree showed a large increase in average adjusted SBP (5.5mm Hg) relative to those without a minor allele, whereas those with a bachelor’s degree and a minor allele showed a decrease (1.7mm Hg) (Figure 3a). All of the significant SNPs at this locus are located in intron 4 of pleiotrophin (PTN).
Figure 3.

Mean blood pressure by minor allele count (MAC) for selected combinations of blood pressure phenotype and SNP. (a) Mean systolic blood pressure (SBP) by PTN genotype and a dichotomous variable distinguishing those without a bachelor’s degree from those with a bachelor’s degree (Comp_BA). (b) Mean diastolic blood pressure (DBP) by TOX2 genotype and a dichotomous variable distinguishing those with no more than high school education from those with at least some college (Comp_HS+).
A single SNP in an intron of TOX high mobility group box family member 2 (TOX2) on chromosome 20 also reached significance for interaction with Comp_HS+ on DBP (1 df; P = 3.74×10⁻⁸) (Figure 2b). Subjects with no education beyond high school showed an increase in DBP of 4.1mm Hg for each minor allele of this genotyped SNP (rs11086907), whereas those with some post–high school education and 1 or 2 minor alleles showed a modest decrease in DBP (0.7mm Hg per allele) (Figure 3b).
Three other loci showed suggestive association with a BP trait (Table 4). An SNP in an intron of myosin XVI (MYO16) on chromosome 13 had an interaction with Comp_HS+ associated with PP. Pulse pressure was higher by 0.2mm Hg per minor allele among those with no more than high school education but lower by 0.1mm Hg per minor allele among those with more than high school education (1 df; P = 7.61×10⁻⁸) (Figure 2c). Several SNPs on chromosome 8 near hyaluronan synthase 2 (HAS2) had interactions with Comp_HS+ suggestively associated with DBP. The strongest association was with rs1994404, which showed an increase of 2.6mm Hg DBP per minor allele for those with no more than high school education and a decrease of 0.4mm Hg DBP per minor allele for those with at least some college education (1 df; P = 1.41×10⁻⁷) (Figure 2b). Finally, several SNPs on chromosome 13 near deleted in lymphocytic leukemia 2 (DLEU2) had interactions with Comp_BA suggestively associated with DBP. The strongest association was with rs12100048, which showed an increase of 2.4mm Hg per minor allele for those without a bachelor’s degree and a decrease of 0.6mm Hg per minor allele for those with a bachelor’s degree (2 df; P = 1.93×10⁻⁷) (Figure 2d).
One additional SNP, rs6936075, yielded a significant interaction with Comp_BA associated with SBP (2 df; P = 2.8×10⁻⁸) (Figure 2a). This SNP had a minor allele frequency of 0.16%, barely surviving the cutoff based on minor allele count in all 3 cohorts in the most recent visit (see Methods). In the analysis sample (Third Generation cohort only), the total number of minor alleles present in the sample dropped to <30. Because no other SNP supported its association with P < 5×10⁻⁶, this locus was not further considered.
DISCUSSION
The effects of interactions between SNPs and educational attainment on SBP, DBP, MAP, and PP were analyzed. Two loci showed significant interactions: intronic SNPs in pleiotrophin (PTN) and Comp_BA showed significant interaction effects on SBP using either the 1 or 2 df tests (Table 3) and an intronic SNP in TOX2 and Comp_HS+ showed a significant interaction effect on DBP. Loci in 3 genes also suggested interaction effects (Table 4): MYO16 and Comp_HS+ affecting PP, HAS2 and Comp_HS+ affecting DBP, and DLEU2 and Comp_BA affecting DBP.
Previous analyses of the Framingham Heart Study based on SNP main effects did not show significant associations at the PTN locus associated with SBP in this study.19 Modest associations (2×10⁻⁵ < P < 6×10⁻⁵) with other SNPs in PTN have been reported in dbGaP for several related phenotypes, including high-density lipoprotein cholesterol, BMI, and coronary artery disease,20 but they were all based on main effects only. This growth factor has numerous biological functions, including roles in angiogenesis and kidney development, and it critically regulates both the renin-angiotensin system and catecholamine synthesis in mice.21 PTN is expressed in vascularized atherosclerotic plaques and mediates migration of endothelial cells following upregulation by the vasodilator nitric oxide.22 It is also involved in inflammation and has been shown to induce expression of inflammatory cytokines including tumor necrosis factor alpha, interleukin 1 beta, and interleukin 6 in peripheral blood mononuclear cells.23 Collectively, these studies point to a multifaceted role for PTN in cardiovascular and metabolic physiology with effects on inflammation and BMI, as well as cholesterol. Our results extend this role to BP in particular. In addition, the interaction with educational attainment may reflect PTN’s role in learning and memory, as it has been shown to inhibit long-term potentiation (a crucial neural mechanism of memory) in the hippocampus.24
The second genome-wide significant locus contains a single SNP (Table 3) located in an intron of TOX2 coding a DNA-binding protein about which relatively little is known. As with the PTN locus, the SNP–Comp_HS+ interaction reached significance in the absence of significant associations of SNP main effects at this locus in previous analyses of the Framingham Heart Study.19 The expression of several hundred genes was affected by small interfering RNA–mediated knockdown of TOX2 in 2 cell lines normally expressing TOX2.25 These genes represented multiple pathways, including vasodilation, blood clotting, angiogenesis, and inflammatory response.25 A meta-analysis of the Family Blood Pressure Program reported linkage evidence with BP for which the confidence interval (logarithm of the odds ratio ≥ 2; approximately 10Mb wide) included TOX2.26 In addition, an association between TOX2 SNPs and conduct disorder27 and a suggestive association with alcoholism28 have been reported, identifying possible mechanisms linking BP regulation with low educational attainment.
The suggestive interaction effect involving MYO16 on PP (Table 4) is supported by previous association results. Zhang et al.29 reported an association with PP in Chinese twins (P = 7.21×10⁻⁷). Associations with other cardiovascular and metabolic traits, including high-density lipoprotein cholesterol, diabetic nephropathies, and coronary artery disease, have also been reported in dbGaP.30 In addition, a suggestive association (P = 3.3×10⁻⁶) has been reported with urinary free dopamine in a Hispanic population.31 Expression analysis contrasting 3 strains of spontaneously hypertensive rats with Wistar Kyoto rats also implicated MYO16 in hypertension.32 MYO16 is expressed predominantly in the central nervous system, as well as in the kidney, and collectively these results suggest a role for MYO16 in BP, possibly through involvement in sympathetic nervous activity, which regulates both vasodilation and renal sodium transport. In addition to its role in cardiovascular and metabolic traits, MYO16 has also been implicated in brain development, neurological morphogenesis, and autism,33 traits which may be associated with educational attainment.
The chromosome 8 locus suggestive of an interaction effect on DBP (Table 4) is located in an intron of HAS2, an important member of the extracellular matrix in atherosclerotic vascular lesions,34 which provides a framework for blood vessel growth. The Framingham Heart Study linked HAS2 with microalbuminuria,35 a risk factor for cardiac and vascular abnormalities, and a SNP near HAS2 has been associated with survival among female black diabetic dialysis patients.36 Rat studies have shown a role for hyaluronan in renal water handling, and response to water deprivation and an F2 intercross (between normotensive and spontaneously hypertensive rats) showed a linkage peak for both MAP and left ventricular mass that contained HAS2.37
The final suggestive locus contains both DLEU1 and DLEU2 (Table 4), 2 noncoding RNAs that harbor 2 microRNAs (MIR15A and MIR16-1). Little is known about these genes, and most studies targeting them are focused on cancers (the name refers to their being frequently downregulated in lymphocytic leukemia). However, epigenetic regulation of DLEU2 has been linked with downregulation of a group of genes regulating the nuclear factor kappa B (NF-κB) complex, a core mediator of inflammation signaling.38 Recent unpublished work (of J. J. Basson) suggests a possible association between BP and SNP–SNP interactions between NF-κB genes and members of the NF-κB–inhibiting IκK complex. Another major inflammatory mediator, transforming growth factor β, is regulated by miRNA-16, which also regulates the renal sodium channel SCNN1B and a serotonin transporter.39 Serotonin is widely expressed in the brain, heart, kidney, and vasculature, organs which play a key role in BP regulation. SNPs in this locus have also been found to have suggestive associations with bipolar disorder;40 expression levels of miRNA-16 have been found to be dysregulated in brains from schizophrenic individuals.41 Once again, a common theme has appeared whereby genes associated with BP regulation are also found to be associated with neuropsychiatric disorders.
SNP interactions with educational attainment have thus revealed 2 significant and 3 suggestive loci associated with BP, none of which were previously implicated in BP by SNP main effects in the Framingham Heart Study or any other study. Although the identified loci are in or near genes not previously associated with BP, biological plausibility, in some cases substantial, provides physiological connection to BP regulation. In this study, as in others, educational attainment likely serves as a surrogate for other unmeasured innate and environmental exposures and behaviors, including neuropsychiatric disorders, smoking, alcohol consumption, physical activity, and stress;42 thus, the specific mechanisms of the identified SNP–education interactions remain uncertain. Although further work is necessary to validate these findings and elucidate their mechanisms, these data provide evidence that educational attainment (or other factors for which educational attainment serves as a surrogate) modifies the effect of SNPs on BP and that consideration of SNP–education interactions can improve gene discovery.
DISCLOSURE
The authors declared no conflict of interest.
ACKNOWLEDGMENTS
We thank all participants of the Framingham Heart Study for their dedication to cardiovascular health research. Our investigation was supported by grant R01 HL107552 from the National Heart, Lung, and Blood Institute (NHLBI). The Framingham Heart Study is conducted and supported by the NHLBI in collaboration with Boston University (Contract No. N01-HC-25195). Funding for SHARe Affymetrix genotyping was provided by NHLBI Contract N02-HL-64278. This manuscript was not prepared in collaboration with investigators of the Framingham Heart Study and does not necessarily reflect the opinions or views of the Framingham Heart Study, Boston University, or the NHLBI.
REFERENCES
- 1. Lim SS, Vos T, Flaxman AD, Danaei G, Shibuya K, Adair-Rohani H, Amann M, Anderson HR, Andrews KG, Aryee M, Atkinson C, Bacchus LJ, Bahalim AN, Balakrishnan K, Balmes J, Barker-Collo S, Baxter A, Bell ML, Blore JD, Blyth F, Bonner C, Borges G, Bourne R, Boussinesq M, Brauer M, Brooks P, Bruce NG, Brunekreef B, Bryan-Hancock C, Bucello C, Buchbinder R, Bull F, Burnett RT, Byers TE, Calabria B, Carapetis J, Carnahan E, Chafe Z, Charlson F, Chen H, Chen JS, Cheng AT, Child JC, Cohen A, Colson KE, Cowie BC, Darby S, Darling S, Davis A, Degenhardt L, Dentener F, Des Jarlais DC, Devries K, Dherani M, Ding EL, Dorsey ER, Driscoll T, Edmond K, Ali SE, Engell RE, Erwin PJ, Fahimi S, Falder G, Farzadfar F, Ferrari A, Finucane MM, Flaxman S, Fowkes FG, Freedman G, Freeman MK, Gakidou E, Ghosh S, Giovannucci E, Gmel G, Graham K, Grainger R, Grant B, Gunnell D, Gutierrez HR, Hall W, Hoek HW, Hogan A, Hosgood HD, 3rd, Hoy D, Hu H, Hubbell BJ, Hutchings SJ, Ibeanusi SE, Jacklyn GL, Jasrasaria R, Jonas JB, Kan H, Kanis JA, Kassebaum N, Kawakami N, Khang YH, Khatibzadeh S, Khoo JP, Kok C, Laden F, Lalloo R, Lan Q, Lathlean T, Leasher JL, Leigh J, Li Y, Lin JK, Lipshultz SE, London S, Lozano R, Lu Y, Mak J, Malekzadeh R, Mallinger L, Marcenes W, March L, Marks R, Martin R, McGale P, McGrath J, Mehta S, Mensah GA, Merriman TR, Micha R, Michaud C, Mishra V, Mohd Hanafiah K, Mokdad AA, Morawska L, Mozaffarian D, Murphy T, Naghavi M, Neal B, Nelson PK, Nolla JM, Norman R, Olives C, Omer SB, Orchard J, Osborne R, Ostro B, Page A, Pandey KD, Parry CD, Passmore E, Patra J, Pearce N, Pelizzari PM, Petzold M, Phillips MR, Pope D, Pope CA, 3rd, Powles J, Rao M, Razavi H, Rehfuess EA, Rehm JT, Ritz B, Rivara FP, Roberts T, Robinson C, Rodriguez-Portales JA, Romieu I, Room R, Rosenfeld LC, Roy A, Rushton L, Salomon JA, Sampson U, Sanchez-Riera L, Sanman E, Sapkota A, Seedat S, Shi P, Shield K, Shivakoti R, Singh GM, Sleet DA, Smith E, Smith KR, Stapelberg NJ, Steenland K, Stockl H, Stovner LJ, Straif K, Straney L, Thurston GD, Tran JH, Van Dingenen R, van Donkelaar A, Veerman JL, Vijayakumar L, Weintraub R, Weissman MM, White RA, Whiteford H, Wiersma ST, Wilkinson JD, Williams HC, Williams W, Wilson N, Woolf AD, Yip P, Zielinski JM, Lopez AD, Murray CJ, Ezzati M, AlMazroa MA, Memish ZA. A comparative risk assessment of burden of disease and injury attributable to 67 risk factors and risk factor clusters in 21 regions, 1990–2010: a systematic analysis for the Global Burden of Disease Study 2010. Lancet 2012; 380:2224–2260 [DOI] [PMC free article] [PubMed] [Google Scholar]
- 2. Ehret GB. Genome-wide association studies: contribution of genomics to understanding blood pressure and essential hypertension. Curr Hypertens Rep 2010; 12:17–25 [DOI] [PMC free article] [PubMed] [Google Scholar]
- 3. Manolio TA, Collins FS, Cox NJ, Goldstein DB, Hindorff LA, Hunter DJ, McCarthy MI, Ramos EM, Cardon LR, Chakravarti A, Cho JH, Guttmacher AE, Kong A, Kruglyak L, Mardis E, Rotimi CN, Slatkin M, Valle D, Whittemore AS, Boehnke M, Clark AG, Eichler EE, Gibson G, Haines JL, Mackay TF, McCarroll SA, Visscher PM. Finding the missing heritability of complex diseases. Nature 2009; 461:747–753 [DOI] [PMC free article] [PubMed] [Google Scholar]
- 4. Ji W, Foo JN, O’Roak BJ, Zhao H, Larson MG, Simon DB, Newton-Cheh C, State MW, Levy D, Lifton RP. Rare independent mutations in renal salt handling genes contribute to blood pressure variation. Nat Genet 2008; 40:592–599 [DOI] [PMC free article] [PubMed] [Google Scholar]
- 5. Defago MD, Gu D, Hixson JE, Shimmin LC, Rice TK, Gu CC, Jaquish CE, Liu DP, He J, Kelly TN. Common genetic variants in the endothelial system predict blood pressure response to sodium intake: the GenSalt study. Am J Hypertens 2013; 26:643–656 [DOI] [PMC free article] [PubMed] [Google Scholar]
- 6. Tsai CT, Fallin D, Chiang FT, Hwang JJ, Lai LP, Hsu KL, Tseng CD, Liau CS, Tseng YZ. Angiotensinogen gene haplotype and hypertension: interaction with ACE gene I allele. Hypertension 2003; 41:9–15 [DOI] [PubMed] [Google Scholar]
- 7. Shi G, Gu CC, Kraja AT, Arnett DK, Myers RH, Pankow JS, Hunt SC, Rao DC. Genetic effect on blood pressure is modulated by age: the Hypertension Genetic Epidemiology Network Study. Hypertension 2009; 53:35–41 [DOI] [PMC free article] [PubMed] [Google Scholar]
- 8. Ramirez-Lorca R, Grilo A, Martinez-Larrad MT, Manzano L, Serrano-Hernando FJ, Moron FJ, Perez-Gonzalez V, Gonzalez-Sanchez JL, Fresneda J, Fernandez-Parrilla R, Monux G, Molero E, Sanchez E, Martinez-Calatrava MJ, Saban-Ruiz J, Ruiz A, Saez ME, Serrano-Rios M. Sex and body mass index specific regulation of blood pressure by CYP19A1 gene variants. Hypertension 2007; 50:884–890 [DOI] [PubMed] [Google Scholar]
- 9. Kaplan GA, Keil JE. Socioeconomic factors and cardiovascular disease: a review of the literature. Circulation 1993; 88:1973–1998 [DOI] [PubMed] [Google Scholar]
- 10. Loucks EB, Abrahamowicz M, Xiao Y, Lynch JW. Associations of education with 30 year life course blood pressure trajectories: Framingham Offspring Study. BMC Public Health 2011; 11:139. [DOI] [PMC free article] [PubMed] [Google Scholar]
- 11. Powers BJ, Olsen MK, Oddone EZ, Thorpe CT, Bosworth HB. Literacy and blood pressure--do healthcare systems influence this relationship? A cross-sectional study. BMC Health Serv Res 2008; 8:219. [DOI] [PMC free article] [PubMed] [Google Scholar]
- 12. Fernald LC, Adler NE. Blood pressure and socioeconomic status in low-income women in Mexico: a reverse gradient? J Epidemiol Community Health 2008; 62:e8. [DOI] [PubMed] [Google Scholar]
- 13. Franceschini N, Rose KM, Storti KL, Rutherford S, Voruganti VS, Laston S, Goring HH, Dyer TD, Umans JG, Lee ET, Best LG, Fabsitz RR, Cole SA, MacCluer JW, North KE. Social- and behavioral-specific genetic effects on blood pressure traits: the Strong Heart Family Study. Circ Cardiovasc Genet 2009; 2:396–401 [DOI] [PMC free article] [PubMed] [Google Scholar]
- 14. Li Y, Willer CJ, Ding J, Scheet P, Abecasis GR. MaCH: using sequence and genotype data to estimate haplotypes and unobserved genotypes. Genet Epidemiol 2010; 34:816–834 [DOI] [PMC free article] [PubMed] [Google Scholar]
- 15. Kraft P, Yen YC, Stram DO, Morrison J, Gauderman WJ. Exploiting gene-environment interaction to detect genetic associations. Hum Hered 2007; 63:111–119 [DOI] [PubMed] [Google Scholar]
- 16. Aulchenko YS, Ripke S, Isaacs A, van Duijn CM. GenABEL: an R library for genome-wide association analysis. Bioinformatics 2007; 23:1294–1296 [DOI] [PubMed] [Google Scholar]
- 17. Aulchenko YS, Struchalin MV, van Duijn CM. ProbABEL package for genome-wide association analysis of imputed data. BMC Bioinformatics 2010; 11:134. [DOI] [PMC free article] [PubMed] [Google Scholar]
- 18. Yang J, Weedon MN, Purcell S, Lettre G, Estrada K, Willer CJ, Smith AV, Ingelsson E, O’Connell JR, Mangino M, Magi R, Madden PA, Heath AC, Nyholt DR, Martin NG, Montgomery GW, Frayling TM, Hirschhorn JN, McCarthy MI, Goddard ME, Visscher PM. Genomic inflation factors under polygenic inheritance. Eur J Hum Genet 2011; 19:807–812 [DOI] [PMC free article] [PubMed] [Google Scholar]
- 19. Roslin NM, Hamid JS, Paterson AD, Beyene J. Genome-wide association analysis of cardiovascular-related quantitative traits in the Framingham Heart Study. BMC Proc 2009; 3:S117. [DOI] [PMC free article] [PubMed] [Google Scholar]
- 20.Gene [database on the Internet] http://www.ncbi.nlm.nih.gov/gene/5764. http://www.ncbi.nlm.nih.gov/gene/5764 National Library of Medicine (US), National Center for Biotechnology Information. PTN pleiotrophin [Homo sapiens (human)] Accessed 18 September 2013.
- 21. Herradon G, Ezquerra L, Nguyen T, Vogt TF, Bronson R, Silos-Santiago I, Deuel TF. Pleiotrophin is an important regulator of the renin-angiotensin system in mouse aorta. Biochem Biophys Res Commun 2004; 324:1041–1047 [DOI] [PubMed] [Google Scholar]
- 22. Polytarchou C, Hatziapostolou M, Poimenidi E, Mikelis C, Papadopoulou A, Parthymou A, Papadimitriou E. Nitric oxide stimulates migration of human endothelial and prostate cancer cells through up-regulation of pleiotrophin expression and its receptor protein tyrosine phosphatase beta/zeta. Int J Cancer 2009; 124:1785–1793 [DOI] [PubMed] [Google Scholar]
- 23. Achour A, M’Bika J P, Baudouin F, Caruelle D, Courty J. Pleiotrophin induces expression of inflammatory cytokines in peripheral blood mononuclear cells. Biochimie 2008; 90:1791–1795 [DOI] [PubMed] [Google Scholar]
- 24. del Olmo N, Gramage E, Alguacil LF, Perez-Pinera P, Deuel TF, Herradon G. Pleiotrophin inhibits hippocampal long-term potentiation: a role of pleiotrophin in learning and memory. Growth Factors 2009; 27:189–194 [DOI] [PubMed] [Google Scholar]
- 25. Tessema M, Yingling CM, Grimes MJ, Thomas CL, Liu Y, Leng S, Joste N, Belinsky SA. Differential epigenetic regulation of TOX subfamily high mobility group box genes in lung and breast cancers. PLoS One 2012; 7:e34850. [DOI] [PMC free article] [PubMed] [Google Scholar]
- 26. Simino J, Shi G, Kume R, Schwander K, Province MA, Gu CC, Kardia S, Chakravarti A, Ehret G, Olshen RA, Turner ST, Ho LT, Zhu X, Jaquish C, Paltoo D, Cooper RS, Weder A, Curb JD, Boerwinkle E, Hunt SC, Rao DC. Five blood pressure loci identified by an updated genome-wide linkage scan: meta-analysis of the Family Blood Pressure Program. Am J Hypertens 2011; 24:347–354 [DOI] [PMC free article] [PubMed] [Google Scholar]
- 27. Dick DM, Aliev F, Krueger RF, Edwards A, Agrawal A, Lynskey M, Lin P, Schuckit M, Hesselbrock V, Nurnberger J, Jr., Almasy L, Porjesz B, Edenberg HJ, Bucholz K, Kramer J, Kuperman S, Bierut L. Genome-wide association study of conduct disorder symptomatology. Mol Psychiatry 2011; 16:800–808 [DOI] [PMC free article] [PubMed] [Google Scholar]
- 28. Edenberg HJ, Koller DL, Xuei X, Wetherill L, McClintick JN, Almasy L, Bierut LJ, Bucholz KK, Goate A, Aliev F, Dick D, Hesselbrock V, Hinrichs A, Kramer J, Kuperman S, Nurnberger JI, Jr., Rice JP, Schuckit MA, Taylor R, Todd Webb B, Tischfield JA, Porjesz B, Foroud T. Genome-wide association study of alcohol dependence implicates a region on chromosome 11. Alcohol Clin Exp Res 2010; 34:840–852 [DOI] [PMC free article] [PubMed] [Google Scholar]
- 29. Zhang D, Pang Z, Li S, Jiang W, Wang S, Thomassen M, Hjelmborg JV, Kruse TA, Ohm Kyvik K, Christensen K, Zhu G, Tan Q. Genome-wide linkage and association scans for pulse pressure in Chinese twins. Hypertens Res 2012; 35:1051–1057 [DOI] [PubMed] [Google Scholar]
- 30.Gene [database on the Internet] http://www.ncbi.nlm.nih.gov/gene/23026. http://www.ncbi.nlm.nih.gov/gene/23026 National Library of Medicine (US), National Center for Biotechnology Information. . MYO16 myosin XVI [Homo sapiens (human)] Accessed 18 September 2013.
- 31. Comuzzie AG, Cole SA, Laston SL, Voruganti VS, Haack K, Gibbs RA, Butte NF. Novel genetic loci identified for the pathophysiology of childhood obesity in the Hispanic population. PLoS One. 2012; 7:e51954. [DOI] [PMC free article] [PubMed] [Google Scholar]
- 32. Kinoshita K, Ashenagar MS, Tabuchi M, Higashino H. Whole rat DNA array survey for candidate genes related to hypertension in kidneys from three spontaneously hypertensive rat substrains at two stages of age and with hypotensive induction caused by hydralazine hydrochloride. Exp Ther Med 2011; 2:201–212 [DOI] [PMC free article] [PubMed] [Google Scholar]
- 33. Wang K, Zhang H, Ma D, Bucan M, Glessner JT, Abrahams BS, Salyakina D, Imielinski M, Bradfield JP, Sleiman PM, Kim CE, Hou C, Frackelton E, Chiavacci R, Takahashi N, Sakurai T, Rappaport E, Lajonchere CM, Munson J, Estes A, Korvatska O, Piven J, Sonnenblick LI, Alvarez Retuerto AI, Herman EI, Dong H, Hutman T, Sigman M, Ozonoff S, Klin A, Owley T, Sweeney JA, Brune CW, Cantor RM, Bernier R, Gilbert JR, Cuccaro ML, McMahon WM, Miller J, State MW, Wassink TH, Coon H, Levy SE, Schultz RT, Nurnberger JI, Haines JL, Sutcliffe JS, Cook EH, Minshew NJ, Buxbaum JD, Dawson G, Grant SF, Geschwind DH, Pericak-Vance MA, Schellenberg GD, Hakonarson H. Common genetic variants on 5p14.1 associate with autism spectrum disorders. Nature 2009; 459:528–533 [DOI] [PMC free article] [PubMed] [Google Scholar]
- 34. Bot PT, Pasterkamp G, Goumans MJ, Strijder C, Moll FL, de Vries JP, Pals ST, de Kleijn DP, Piek JJ, Hoefer IE. Hyaluronic acid metabolism is increased in unstable plaques. Eur J Clin Invest 2010; 40:818–827 [DOI] [PubMed] [Google Scholar]
- 35. Fox CS, Yang Q, Guo CY, Cupples LA, Wilson PW, Levy D, Meigs JB. Genome-wide linkage analysis to urinary microalbuminuria in a community-based sample: the Framingham Heart Study. Kidney Int 2005; 67:70–74 [DOI] [PubMed] [Google Scholar]
- 36. Murea M, Lu L, Ma L, Hicks PJ, Divers J, McDonough CW, Langefeld CD, Bowden DW, Freedman BI. Genome-wide association scan for survival on dialysis in African-Americans with type 2 diabetes. Am J Nephrol 2011; 33:502–509 [DOI] [PMC free article] [PubMed] [Google Scholar]
- 37. Tsujita Y, Iwai N, Tamaki S, Nakamura Y, Nishimura M, Kinoshita M. Genetic mapping of quantitative trait loci influencing left ventricular mass in rats. Am J Physiol Heart Circ Physiol 2000; 279:H2062–H2067 [DOI] [PubMed] [Google Scholar]
- 38. Garding A, Bhattacharya N, Claus R, Ruppel M, Tschuch C, Filarsky K, Idler I, Zucknick M, Caudron-Herger M, Oakes C, Fleig V, Keklikoglou I, Allegra D, Serra L, Thakurela S, Tiwari V, Weichenhan D, Benner A, Radlwimmer B, Zentgraf H, Wiemann S, Rippe K, Plass C, Dohner H, Lichter P, Stilgenbauer S, Mertens D. Epigenetic upregulation of lncRNAs at 13q14.3 in leukemia is linked to the In Cis downregulation of a gene cluster that targets NF-kB. PLoS Genet. 2013; 9:e1003373. [DOI] [PMC free article] [PubMed] [Google Scholar]
- 39. Moya PR, Wendland JR, Salemme J, Fried RL, Murphy DL. miR-15a and miR-16 regulate serotonin transporter expression in human placental and rat brain raphe cells. Int J Neuropsychopharmacol 2013; 16:621–629 [DOI] [PubMed] [Google Scholar]
- 40. Djurovic S, Gustafsson O, Mattingsdal M, Athanasiu L, Bjella T, Tesli M, Agartz I, Lorentzen S, Melle I, Morken G, Andreassen OA. A genome-wide association study of bipolar disorder in Norwegian individuals, followed by replication in Icelandic sample. J Affect Disord 2010; 126:312–316 [DOI] [PubMed] [Google Scholar]
- 41. Beveridge NJ, Gardiner E, Carroll AP, Tooney PA, Cairns MJ. Schizophrenia is associated with an increase in cortical microRNA biogenesis. Mol Psychiatry 2010; 15:1176–1189 [DOI] [PMC free article] [PubMed] [Google Scholar]
- 42. Ghaed SG, Gallo LC. Subjective social status, objective socioeconomic status, and cardiovascular risk in women. Health Psychol 2007; 26:668–674 [DOI] [PubMed] [Google Scholar]