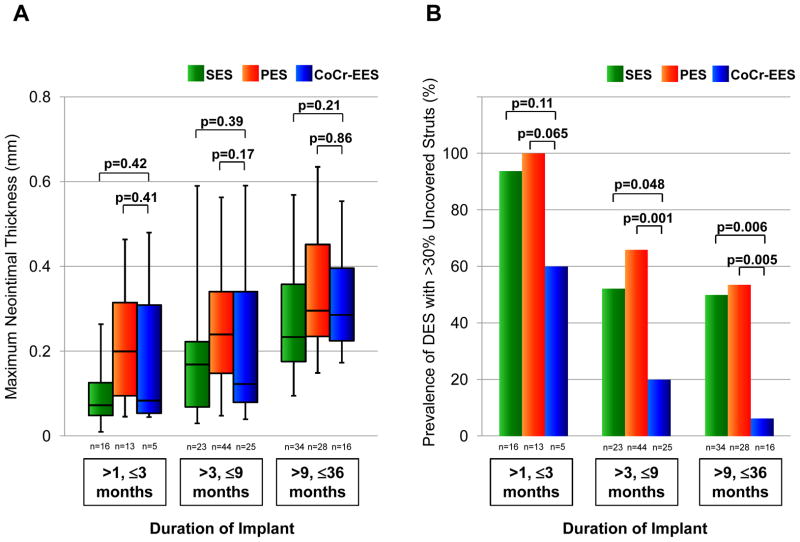
Figure 3.
Box-and-whisker plots showing maximum neointimal thickness (A) and bar graphs showing prevalence of DES lesions with >30% uncovered struts (B) stratified by duration of implant in SES, PES, and CoCr-EES. In box-and-whisker plots, lines within boxes represent median values; the upper and lower lines of the boxes represent the 75th and 25th percentiles, respectively; and the upper and lower bars outside the boxes represent the 90th and 10th percentiles, respectively. P values for CoCr-EES versus SES and for CoCr-EES versus PES are presented. Multiple-comparison threshold is used as in Table 1.

