Abstract
The vasculature inside breast cancers is one important component of the tumour microenvironment. The investigation of its spatial morphology, distribution and interactions with cancer cells, including cancer stem cells, is essential for elucidating mechanisms of tumour development and treatment response. Using confocal microscopy and fluorescent markers, we have acquired three-dimensional images of vasculature within mammary tumours and normal mammary gland of mouse models. However, it is difficult to segment and reconstruct complex vasculature accurately from the in vivo three-dimensional images owing to the existence of uneven intensity and regions with low signal-to-noise ratios (SNR). To overcome these challenges, we have developed a novel three-dimensional vasculature segmentation method based on local clustering and classification. First, images of vasculature are clustered into local regions, whose boundaries well delineate vasculature even in low SNR and uneven intensity regions. Then local regions belonging to vasculature are identified by applying a semi-supervised classification method based on three informative features of the local regions. Comparison of results using simulated and real vasculature images, from mouse mammary tumours and normal mammary gland, shows that the new method outperforms existing methods, and can be used for three-dimensional images with uneven background and low SNR to achieve accurate vasculature reconstruction.
Keywords: vasculature reconstruction, tumour microenvironment, vascular imaging
1. Introduction
Tumour-associated vasculature is an important component of the tumour microenvironment (mE) [1,2]. As such, the spatial morphology of vasculature, e.g. density and diameters, inside the tumour mE is one important parameter for understanding roles of vasculature in drug response [2–4]. Also, information about variations in the morphology of vasculature is important for modelling vasculature development and the availability of nutrient, oxygen and drug molecules within the tumour [5–7]. Using confocal microscopy, we have acquired three-dimensional image sets of fluorescently labelled vasculature in order to investigate the spatial morphology and distribution of vasculature inside normal mammary gland and the mammary tumour, as shown in figure 1. To analyse the vasculature quantitatively, automated reconstruction and geometric analysis are needed. However, it is challenging, with existing methods, to reconstruct the vasculature from in vivo three-dimensional images of mammary tumour and normal mammary gland because of complex vasculature structures and the existence of uneven intensity and low signal-to-noise ratio (SNR) regions.
Figure 1.
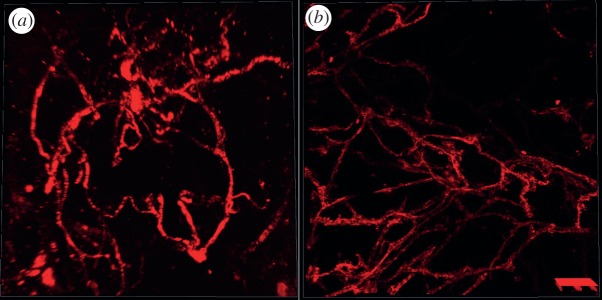
Examples of vascular images from (a) mammary tumour and (b) normal mammary gland of mouse models.
Although many methods have been reported in the literature to analyse vasculature structure images, there is still a need for improved methods that can be used to segment and reconstruct the three-dimensional vasculature from in vivo images of normal mammary gland, and mammary tumours of mouse models. Level set is also widely used for vasculature reconstruction. For example, the local binary fitting (LBF)-based level set model [8,9] and level set-based vascular segmentation approach in vmtk (the Vascular Modelling Toolkit) (vmtk, http://www.vmtk.org) were developed for segmenting vascular images. The level set-based methods often require manual selection of initial contour points, and often fail to identify vasculature with low SNR and uneven background. The Farsight toolkit provides a robust adaptive vascular segmentation approach [10,11], which is fast, but fails to distinguish vasculature with low SNR from background. The TubularTracking module [12] in MeVisLab (MeVisLab, http://www.mevislab.de) implements a template-based multiple hypothesis vessel tracking approach [13]. It can generate continuous vasculature reconstruction results, but requires manual selection of seed points on vasculature, and might identify false connections among seed points. Moreover, NeuronStudio [14], NeuronJ [15] and Vaa3D [16] could be used to reconstruct vasculature, but their results closely depend on the manually selected seed points.
Herein, we propose a novel automated three-dimensional vasculature reconstruction algorithm using local clustering and a classification approach to overcome the aforementioned challenges. In brief, vascular images are first divided into local clusters that could well delineate the boundaries of vasculature. Then, three informative features, i.e. relative local intensity, shape irregularity and orientation consistency, are calculated to quantify the distinct characteristics of local clusters belonging to either vascular or avascular groups. Finally, the graph transduction-based semi-supervised classification model, which requires a small set of training samples and integrates the information from unlabelled data, is employed to separate the local regions on vasculature from those on the avascular regions. The details of the method, including the vascular imaging, local clustering, informative feature extraction and graph transduction model, are provided in §2. The experimental evaluation and comparison results, on both simulated vascular images and those from normal mammary gland and mammary tumour of mouse models, are shown in §3, and a summary and discussion are presented in §4.
2. Methodology
2.1. Vascular imaging of mammary tumours and normal mammary gland of mouse models
The vascular images, as shown in figure 1a, of mammary tumours were acquired from the P53 null mouse mammary tumour T1model [17,18]. The vasculature was stained by tail vein injection of a Dextran-conjugated fluorescent marker that labels the vascular endothelial cells. The vascular images of normal mammary gland, as shown in figure 1b, were acquired from a Scid/bg mouse model that carries a transgenic reporter that expresses a membrane-targeted mCherry fluorescent protein (Tg(Flk1-myr::mCherry)) [19,20]. Both mammary tumour and normal mammary gland were excised immediately and cleared in 50 per cent glycerol with phosphate-buffered saline (PBS) for 16 h at 4°C. Before imaging, samples were washed and resuspended in 1X PBS. The z-stack of mammary tumour was acquired using a confocal microscope LSM 510 META (Carl Zeiss, Jena, Germany) with a Plan-Apochromat 20×/0.75 lens. The Dextran was excited using the 543 nm laser. The z-stack consists of 17 images, each of which has 512 × 512 pixels. The size of a pixel in the x–y plane is 0.88 × 0.88 µm. The axial separation between the images in the z-stack is 2 µm. The volume of the z-stack is 450 × 450 × 32 µm. The z-stack of normal mammary gland was acquired using a TCS SP5 confocal microscope (Leica Microsystems, Mannheim, Germany) with a Plan-Apochromat 40.0×/1.25 lens. The mCherry fluorophore was excited using the 543 nm laser. The z-stack consists of 32 images each of which has 1024 × 1024 pixels. The size of a pixel in the x–y plane is 0.38 × 0.38 µm. The axial separation between the images in the z-stack is 1.98 um. The volume of the z-stack is 387.5 × 387.5 × 61.3 µm.
2.2. Local clustering
Instead of working on individual voxels, the simple linear iteration clustering (SLIC) method [21,22], which considers both intensity variation and spatial information, groups individual voxels into local clusters with similar size (local clustering). One desirable characteristic of these local regions (clusters) is that their boundaries well delineate boundaries of vasculature even in low SNR and uneven intensity areas, as shown in figure 2. In the local clustering analysis, each voxel is represented by its intensity [l a b] in the CIELAB colour space, and its spatial coordinates [x y z]. A new distance metric is defined by combining the colour-space similarity and the spatial distance between two given voxels, k and i, as 
 , where
  , and
, and  , ω is an adjustable parameter. Then the SLIC is applied based on the new distance metric to obtain the local clustering result [21,22]. Finally, a vascular image is divided into a set of local regions: S = {S1, … ,Sm, Sm
+1, … ,SM}, where M is the total number of local regions. By changing the parameter ω and the number of regions, M, the size and shape of local regions can be adjusted. Examples of local clustering analysis are shown in figure 2. The other desired property of the local clustering analysis is that these local regions in the vascular and avascular groups have distinct characteristics that will be discussed in the feature extraction section.
Figure 2.
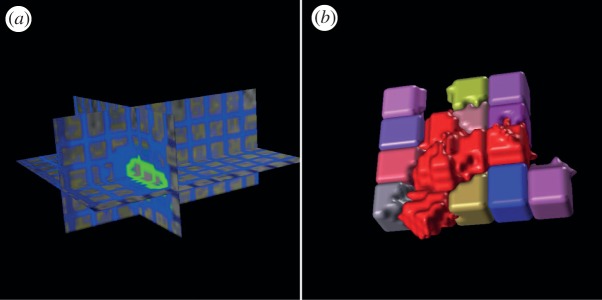
Examples of local clustering analysis. (a) The grid lines (green and blue) indicate boundaries of local clusters (regions). (b) Three-dimensional rendering of local clusters in vascular (red) and avascular groups, respectively.
2.3. Informative feature extraction
After dividing vascular images into local regions, the following analysis aims to separate those local regions belonging to the vascular group from those in the avascular group based on their distinct characteristics. Instead of using a set of complex numerical features, only three simple but informative features, i.e. relative local intensity, shape irregularity and orientation consistency, are designed for the following classification analysis.
2.3.1. Relative local intensity feature
Local intensity variation is important for separating neighbouring objects. Thus, the ratios of average intensity of given local regions relative to immediate neighbours are discriminative. The maximum of the ratios is thus used as the relative local intensity feature considering vasculature has relative higher intensity than neighbouring avascular regions. Mathematically, let Ii denote the average pixel intensity inside a given local region Si, and Oi denote the set of its immediate neighbouring regions, then the relative local intensity of Si is calculated as  .
.
2.3.2. Shape irregularity feature
Owing to the intensity variation between vascular and avascular regions, local regions on vasculature often exhibit irregular shapes, whereas the local regions on avascular background have regular cube-like shapes, as shown in figure 2. Though rayburst-based shape descriptors are effective, the calculation of these features requires high computational cost [23,24]. Here, we employ a simpler descriptor to measure the shape irregularity of local regions. If we denote the surface area of local region Si as Ai, and its volume as Vi, then the shape descriptor is calculated as SDi = Ai/Vi, i = 1, … ,M. Accordingly, local regions on vasculature have higher values for this shape irregularity feature.
2.3.3. Orientation consistency feature
The orientation consistency feature is designed to capture the continuity of vasculature. Based on Hessian matrices analysis, the orientation of each voxel vk can be determined by the eigenvector corresponding to the least absolute eigenvalue [25], denoted by (dxk, dyk, dzk), k = 1, … ,N, where N is the number of voxels in the image. The orientation vectors of voxels in the vascular group are all along vasculature consistently, whereas the orientation vectors of voxels in the avascular group distribute randomly due to the existence of noise, as illustrated in figure 3a. Based on direction vectors of individual voxels, we define the local regions' orientation vectors as follows. Denote θi = (θxi, θyi, θzi) as the orientation vector for local region Si, and denote VSi as all voxels inside Si, then θi is computed as follows:
where (dxk, dyk, dzk)is the unit length orientation vector for voxel vk, and Ni is the number of voxels inside Si, i = 1, … ,M. Owing to voxel-level orientation consistency, the region-level orientation vectors of vascular regions have larger norms (amplitudes), comparing with those from the avascular group, as shown in figure 3b. Moreover, the orientation consistency for the neighbouring vascular local regions still holds, as shown in figure 3b.
Figure 3.
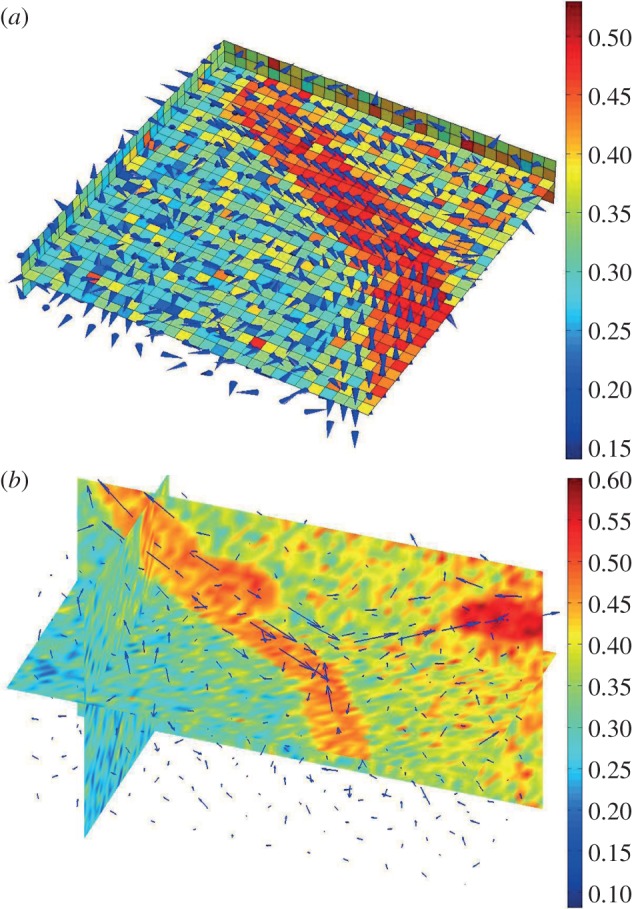
Examples of the orientation feature. (a) Voxel-level orientation vectors. Each cube corresponds to one voxel, and each cone represents the computed orientation vector for each voxel; the consistent cone region indicates vasculature; the random distributed cone region is the avascular background; (b) region-level orientation vectors. Arrows show orientation vectors of individual local regions.
2.4. Vascular region classification using a graph transduction model
Following the feature extraction, the vasculature segmentation problem becomes a classifcation problem, i.e. separating vascular regions from avascular ones based on the relative local intensity, shape irregularity and orientation consistancy features. In this study, we employ the semi-supervised learning approach for the classification analysis, as it requires a small set of labelled samples and integrates the information from unlabelled data for better classification. The graph transduction model is one of the most widely used semi-supervised learning methods [26–28]. In this study, the graph transduction-based semi-supervised classification model is formulated as follows. Given the local region set: S = {S1, S2, … ,SM}, and the corresponding feature set f = {f1, f2, … ,fM}, where fi is the feature vector for Si, i = 1, … ,M. Suppose the first m local clusters S1, S2, … ,Sm have been labelled and the rest are unlabelled, then the graph transduction model propagates labels to unlabelled samples locally. This process can be formulated as the following optimization problem:
 |
where
 |
is an affinity matrix using the Gaussian kernel with standard deviation σ; D is a diagonal matrix with  , F is the expected label vectors of all samples and is required to be non-negative; Fi denotes the ith row of F; Y is the known label data of samples, where
where k = 1, 2 represents the vascular and avascular local regions, respectively; and Yi. is the ith row vector of Y. The first term in the above equation requires nearby local regions sharing the same label, whereas the second term limits the predicted labels to be consistent with the known labels. The parameter μ (µ > 0) adjusts weights of label smoothness with neighbours and consistence with known labels. Based on the differential theory, the optimal solution, F*, satisfies the following equation: F* − SF*/(1 + μ) − μY/(1 + μ) = 0, and it is explicitly given by: F* = (μ/(1 + μ))(I − (1/(1 + μ))S)−1 Y. Then the labels of samples can be obtained as: yi = arg maxk ≤ 2 Fik, i = 1, … ,M. To collect training samples, local regions with high intensity could be conveniently labelled by the thresholding analysis, and some local regions in the low SNR regions need to be labelled manually.
3. Experimental results
3.1. Simulated vascular images
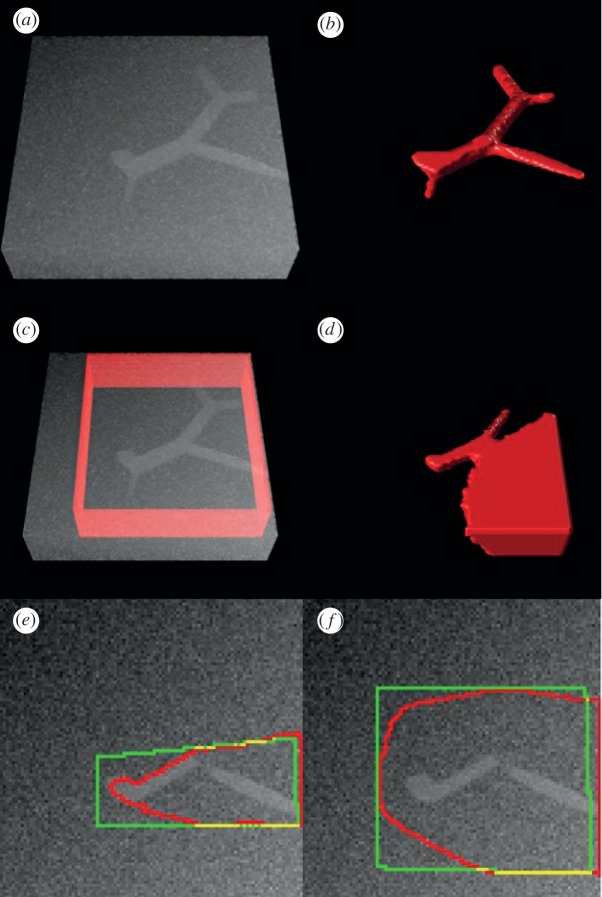
To validate the performance of the proposed method objectively and quantitatively, we simulated vascular images with uneven intensity, low SNR and varying diameters of vasculature, as shown in figure 4a. The blood vessel tree was generated as demonstrated in the study of Hamarneh & Jassi [29,30]. Gaussian noise and uneven background were added to the image. The size of image volume is 100 × 100 × 25 voxels. The image was preprocessed first by a median filter and then a mean filter in a 3 × 3 × 3 neighbourhood. In the local clustering analysis, we set the size of local region as 5 × 5 × 5 voxels. Figure 4b shows the vasculature reconstruction result on the simulated data with the proposed method. As shown, the vascular tree is completely recovered. The precision and recall of the vasculature reconstruction result are 92.87 per cent and 91.74 per cent, respectively. We also compared the Chan–Vese (CV) region-based level set method [31]. Figure 4c,d shows the reconstruction by the CV method on the simulated data. Some vascular branches are missed due to low SNR, and a large avascular region is misclassified as vasculature due to the uneven background, as shown in figure 4d. We further compared the improved region-based level set method that specifically deals with uneven intensity by introducing a kernel-based LBF energy. As only the two-dimensional image analysis programme is available, we conducted the comparison on two-dimensional image sections. Figure 4e,f shows the vasculature segmentation results of the LBF method on a two-dimensional section. As can be seen, the LBF method cannot identify vascular regions correctly. Moreover, segmentation results of LBF are sensitive to the level set initialization.
Figure 4.
Vasculature reconstruction comparison on the simulated vasculature image. (a) Simulated blood vessel tree with noise and uneven background; (b) vasculature reconstruction using the proposed method. (c) Initial level set contour (red surface), and (d) vasculature reconstruction result of the Chan–Vese (CV) model. (e,f) Two segmentation results with different initial level set contours (green) and segmentation results (red) of the LBF method.
3.2. Vascular images from mammary tumour and normal mammary gland of mouse models
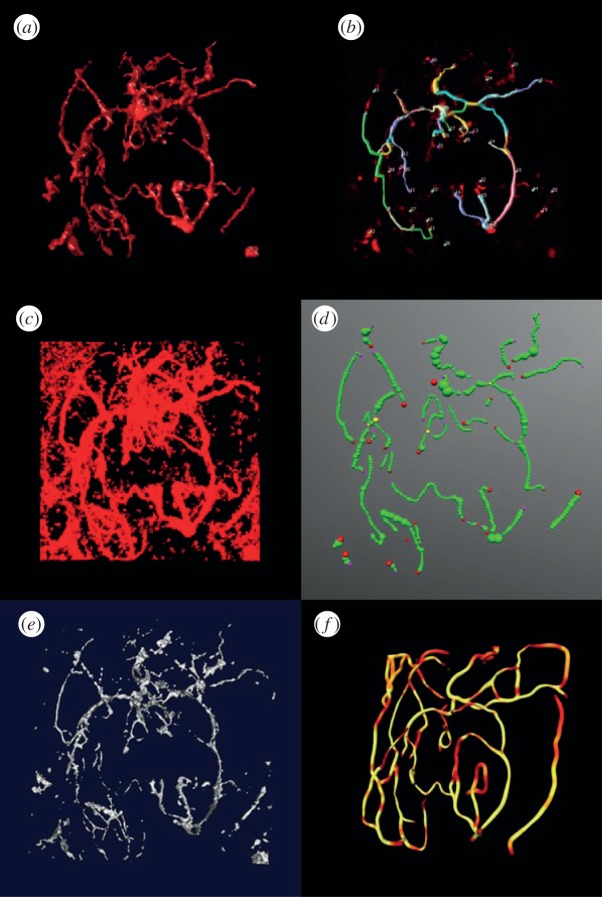
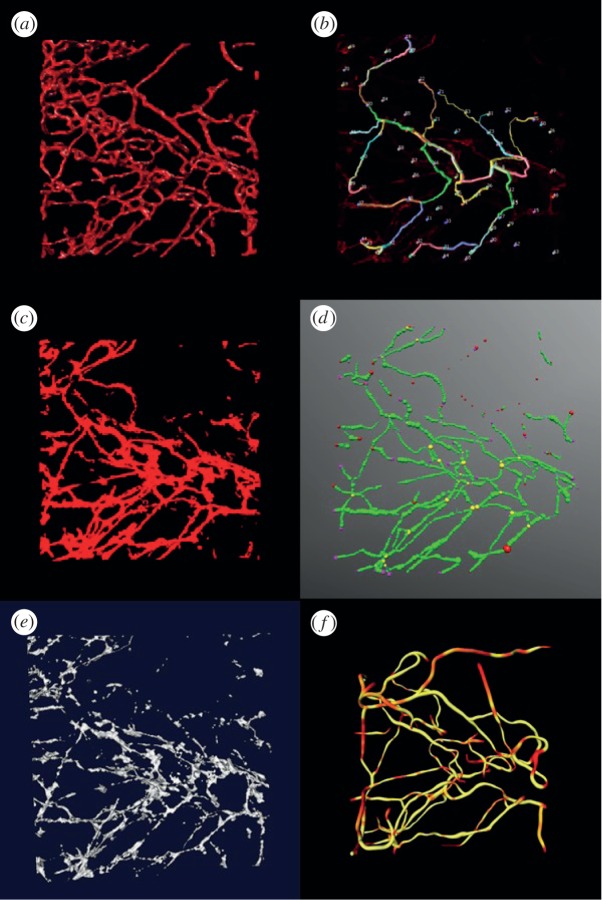
Three-dimensional vascular images of mammary tumours and the normal mammary gland of mice were used to validate the proposed method. The image was preprocessed first by a median filter and then a mean filter in a 3 × 3 × 3 neighbourhood. In the local clustering analysis, the size of the local region is set as 5 × 5 × 5 voxels. Figures 5a and 6a show the vasculature reconstruction results from mouse mammary tumours and the normal mammary gland, respectively, of the proposed method. As can be seen, the vasculature is well segmented in both images. To further indicate the efficiency of the proposed method, we compared Farsight, NeuronStudio, Vaa3D, vmtk and TubularTracking. The NeuronStudio and Vaa3D require manual selection of seed points and then track the vasculature based on those seed points. Figures 5b and 6b show the segmentation results of NeuronStudio. As expected, NeuronStudio detected vasculature partially based on the manually selected seed points on vasculature. Farsight performed similar to an adaptive thresholding method. Though identified vasculature with low SNR in the normal mammary gland but kept most of the noise in tumour vasculature images, as shown in figures 5c and 6c. Comparing with NeuronStudio, Vaa3D identified more vasculature, but generated more discontinuous vascular segments, as shown in figures 5d and 6d (red points are the seed points). The results of vmtk are shown in figures 5e and 6e. As can be seen, many vascular branches are broken because of the low SNR and uneven background. Figures 5f and 6f show the vasculature reconstruction results of TubularTracking. The vasculature is continuous, but the results depend on the manually selected seed points on vasculature, and some vascular branches are wrongly connected. In summary, the proposed vasculature method based on the clustering and classification analyses is effective to reconstruct vasculature based on three-dimensional vascular images of mammary tumour and normal mammary gland of mouse models.
Figure 5.
Vasculature reconstruction results of the P53 null mouse mammary tumours. (a) Reconstruction results of the proposed method, (b) NeuronStudio, (c) Farsight, (d) Vaa3D and, (e) vmtk, (f) TubularTracking.
Figure 6.
Vasculature reconstruction results of normal mammary gland of Scid/bg mice. (a) Reconstruction results of the proposed method, (b) NeuronStudio, (c) Farsight, (d) Vaa3D, (e) vmtk and, (f) TubularTracking.
4. Summary and discussion
Tumour vasculature is an important component of tumour mE regulating tumour initialization, progression, metastasis and drug response. The spatial morphology, distribution, density and diameters of vasculature inside tumours and their relative locations to subpopulations of tumour cells, are important parameters to study the roles of intratumoural heterogeneities in tumour development and drug response. We have acquired vascular images from mammary tumours and normal mammary gland mouse models with confocal microscopy. To reconstruct the vasculature, we developed an automated vasculature segmentation and reconstruction approach based on the local clustering and classification to deal with the uneven intensity, low SNR and complex vascular structure challenges. Comparison results on both simulated and real vascular images indicated advantages of the proposed method. Based on the reconstruction results, further geometric analysis, e.g. centreline extraction and diameter estimation, could be conducted for the quantitative analysis of vasculature. The reconstruction and geometric analysis of vasculature are helpful for modelling the variation of vasculature during tumour development, and the nutrient and drug availability within the tumour mE. In the proposed method, some vascular regions, e.g. vascular branching points, might be misclassified into avascular regions, which results in the broken vasculature. Thus, a linking process is always needed to solve this problem. The other limitation of the proposed method is that when vascular branches with large and small diameters coexist in one image, it is difficult to select the right region size in local clustering. With a small region size, vascular braches with large diameters will be divided into small pieces. With a large region size, local regions on the vascular braches with small diameters will include avascular voxels. Both settings will reduce the vasculature reconstruction accuracy. In future work, we plan to improve the performance of the proposed method, and reconstruct large-scale vasculature based on vascular images covering the entire tumours.
Acknowledgements
We thank Ahmad Hammoudi for helpful discussion about the local clustering. This work was supported by NIH U54 CA149196-01, R01LM009161 and John S Dunn Research Foundation.
References
- 1.Veeravagu A, et al. 2008. The cancer stem cell-vascular niche complex in brain tumor formation. Stem Cells Dev. 17, 859–867 10.1089/scd.2008.0047 (doi:10.1089/scd.2008.0047) [DOI] [PubMed] [Google Scholar]
- 2.Jain RK. 2005. Normalization of tumor vasculature: an emerging concept in antiangiogenic therapy. Science 307, 58–62 10.1126/science.1104819 (doi:10.1126/science.1104819) [DOI] [PubMed] [Google Scholar]
- 3.Tredan O, et al. 2007. Drug resistance and the solid tumor microenvironment. J. Natl Cancer Inst. 99, 1441–1454 10.1093/jnci/djm135 (doi:10.1093/jnci/djm135) [DOI] [PubMed] [Google Scholar]
- 4.Tozer GM. 2003. Measuring tumour vascular response to antivascular and antiangiogenic drugs. Br. J. Radiol. 76, S23–S35 10.1259/bjr/30165281 (doi:10.1259/bjr/30165281) [DOI] [PubMed] [Google Scholar]
- 5.Shirinifard A, et al. 2009. 3D multi-cell simulation of tumor growth and angiogenesis. PLoS ONE 4, e7190. 10.1371/journal.pone.0007190 (doi:10.1371/journal.pone.0007190) [DOI] [PMC free article] [PubMed] [Google Scholar]
- 6.Travasso RD, et al. 2011. Tumor angiogenesis and vascular patterning: a mathematical model. PLoS ONE 6, e19989. 10.1371/journal.pone.0019989 (doi:10.1371/journal.pone.0019989) [DOI] [PMC free article] [PubMed] [Google Scholar]
- 7.Tan H, et al. 2012. A 3-dimentional multiscale model to simulate tumor progression in response to interactions between cancer stem cells and tumor microenvironmental factors. In IEEE 6th Int. Conf. on Systems Biology (ISB), Xi'an, China, 18–20 August 2012. New York, NY: IEEE. [Google Scholar]
- 8.Li C, et al. 2008. Minimization of region-scalable fitting energy for image segmentation. IEEE Trans. Image Process. 17, 1940–1949 10.1109/TIP.2008.2002304 (doi:10.1109/TIP.2008.2002304) [DOI] [PMC free article] [PubMed] [Google Scholar]
- 9.Li C, et al. 2011. A level set method for image segmentation in the presence of intensity inhomogeneities with application to MRI. IEEE Trans. Image Process. 20, 2007–2016 10.1109/TIP.2011.2146190 (doi:10.1109/TIP.2011.2146190) [DOI] [PMC free article] [PubMed] [Google Scholar]
- 10.Narayanaswamy A, et al. 2010. Robust adaptive 3-D segmentation of vessel laminae from fluorescence confocal microscope images and parallel GPU implementation. IEEE Trans. Med. Imaging 29, 583–597 10.1109/TMI.2009.2022086 (doi:10.1109/TMI.2009.2022086) [DOI] [PMC free article] [PubMed] [Google Scholar]
- 11.Shen Q, et al. 2008. Adult SVZ stem cells lie in a vascular niche: a quantitative analysis of niche cell–cell interactions. Cell Stem Cell 3, 289–300 10.1016/j.stem.2008.07.026 (doi:10.1016/j.stem.2008.07.026) [DOI] [PMC free article] [PubMed] [Google Scholar]
- 12.Friman O, Hindennach M, Peitgen HO. 2008. Template-based multiple hypotheses tracking of small vessels. In 5th IEEE Int. Symp. on Biomedical Imaging: From Nano to Macro, Paris, France, 14–17 May 2008 New York, NY: IEEE. [Google Scholar]
- 13.Friman O, et al. 2010. Multiple hypothesis template tracking of small 3D vessel structures. Med. Image Anal. 14, 160–171 10.1016/j.media.2009.12.003 (doi:10.1016/j.media.2009.12.003) [DOI] [PubMed] [Google Scholar]
- 14.Rodriguez A, et al. 2008. Automated three-dimensional detection and shape classification of dendritic spines from fluorescence microscopy images. PLoS ONE 3, e1997. 10.1371/journal.pone.0001997 (doi:10.1371/journal.pone.0001997) [DOI] [PMC free article] [PubMed] [Google Scholar]
- 15.Meijering E, et al. 2004. Design and validation of a tool for neurite tracing and analysis in fluorescence microscopy images. Cytometry A 58, 167–176 10.1002/cyto.a.20022 (doi:10.1002/cyto.a.20022) [DOI] [PubMed] [Google Scholar]
- 16.Peng H, et al. 2010. Automatic reconstruction of 3D neuron structures using a graph-augmented deformable model. Bioinformatics 26, i38–i46 10.1093/bioinformatics/btq212 (doi:10.1093/bioinformatics/btq212) [DOI] [PMC free article] [PubMed] [Google Scholar]
- 17.Herschkowitz JI, et al. 2011. Comparative oncogenomics identifies breast tumors enriched in functional tumor-initiating cells. Proc. Natl Acad. Sci. USA 109, 2778–2783 10.1073/pnas.1018862108 (doi:10.1073/pnas.1018862108) [DOI] [PMC free article] [PubMed] [Google Scholar]
- 18.Zhang M, et al. 2008. Identification of tumor-initiating cells in a p53-null mouse model of breast cancer. Cancer Res. 68, 4674–4682 10.1158/0008-5472.CAN-07-6353 (doi:10.1158/0008-5472.CAN-07-6353) [DOI] [PMC free article] [PubMed] [Google Scholar]
- 19.Larina IV, et al. 2009. A membrane associated mCherry fluorescent reporter line for studying vascular remodeling and cardiac function during murine embryonic development. Anat. Rec. (Hoboken) 292, 333–341 10.1002/ar.20821 (doi:10.1002/ar.20821) [DOI] [PMC free article] [PubMed] [Google Scholar]
- 20.Poché RA, et al. 2009. The Flk1-myr::mCherry mouse as a useful reporter to characterize multiple aspects of ocular blood vessel development and disease. Dev. Dyn. 238, 2318–2326 10.1002/dvdy.21886 (doi:10.1002/dvdy.21886) [DOI] [PMC free article] [PubMed] [Google Scholar]
- 21.Achanta R, Shaji A, Smith K, Lucchi A, Fua P, Susstrunk S. 2010. Slic superpixels. Technical Report no. 149300 École Polytechnique Fédérale de Lausanne, Switzerland [DOI] [PubMed]
- 22.Lucchi A, et al. 2010. A fully automated approach to segmentation of irregularly shaped cellular structures in EM images. Med. Image Comp. Comp. Assist. Interv. MICCAI, 13, 463–471 [DOI] [PubMed] [Google Scholar]
- 23.Smith K, Carleton A, Lepetit V. 2009. Fast ray features for learning irregular shapes. In IEEE 12th Int. Conf. on Computer Vision, Kyoto, Japan, 29 September to 2 October 2009 New York, NY: IEEE. [Google Scholar]
- 24.Zhu Y, et al. 2011. Coupling oriented hidden Markov random field model with local clustering for segmenting blood vessels and measuring spatial structures in images of tumor microenvironment. In IEEE Int. Conf. on Bioinformatics and Biomedicine (BIBM), Atlanta, GA, 12–15 November 2011, pp. 352–357 New York, NY: IEEE. [Google Scholar]
- 25.Frangi A, et al. 1998. Multiscale vessel enhancement filtering. Med. Image Comp. Comp. Assist. Interv. (MICCAI 1998) 1496, 130–137 10.1007/BFb0056195 (doi:10.1007/BFb0056195) [DOI] [Google Scholar]
- 26.Wang J, Jebara T, Chang SF. 2008. Graph transduction via alternating minimization. In Proc. of the 25th Int. Conf. on Machine Learning, Helsinki, Finland, 5–9 July 2008. New York, NY: ACM. [Google Scholar]
- 27.Zhou D, et al. 2004. Learning with local and global consistency. Adv. Neural Inform. Process. Syst. 16, 321–328 [Google Scholar]
- 28.Zhu X. 2005. Semi-supervised learning literature survey. Technical Report 1530, Computer Sciences, University of Wisconsin–Madison, USA
- 29.Hamarneh G, Jassi P. 2010. VascuSynth: simulating vascular trees for generating volumetric image data with ground-truth segmentation and tree analysis. Comp. Med. Imaging Graph. 34, 605–616 10.1016/j.compmedimag.2010.06.002 (doi:10.1016/j.compmedimag.2010.06.002) [DOI] [PubMed] [Google Scholar]
- 30.Jassi P, Hamarneh G. 2011. VascuSynth: Vascular Tree Synthesis Software. Insight J. See http://hdl.handle.net/10380/3260 [Google Scholar]
- 31.Chan TF, Vese LA. 2001. Active contours without edges. IEEE Trans. Image Process. 10, 266–277 10.1109/83.902291 (doi:10.1109/83.902291) [DOI] [PubMed] [Google Scholar]


