

Abstract
There is a constant shortage of red blood cells (RBCs) from sufficiently matched donors for patients who need chronic transfusion. Ex vivo expansion and maturation of human erythroid precursors (erythroblasts) from the patients or optimally matched donors could represent a potential solution. Proliferating erythroblasts can be expanded from umbilical cord blood mononuclear cells (CB MNCs) ex vivo for 106–107-fold (in ~50 days) before proliferation arrest and reaching sufficient number for broad application. Here, we report that ectopic expression of three genetic factors (Sox2, c-Myc, and an shRNA against TP53 gene) associated with iPSC derivation enables CB-derived erythroblasts to undergo extended expansion (~1068-fold in ~12 months) in a serum-free culture condition without change of cell identity or function. These expanding erythroblasts maintain immature erythroblast phenotypes and morphology, a normal diploid karyotype and dependence on a specific combination of growth factors for proliferation throughout expansion period. When being switched to a terminal differentiation condition, these immortalized erythroblasts gradually exit cell cycle, decrease cell size, accumulate hemoglobin, condense nuclei and eventually give rise to enucleated hemoglobin-containing erythrocytes that can bind and release oxygen. Our result may ultimately lead to an alternative approach to generate unlimited numbers of RBCs for personalized transfusion medicine.
Introduction
The transfusion of red blood cells (RBCs) is the first documented form of cell therapy, practiced for over 100 years. Recently, laboratory generation of cultured RBCs (cRBCs) for transfusion has been investigated in order to help overcome limitations of donation-based systems.1,2,3 Many anemia patients need frequent transfusion of RBC concentrates from best matched donors, which are difficult to find. Transfusion of RBCs from various donors overtime leads to development of alloimmunization. If are newable source of cRBCs derived from autologous or optimally matched donors can be established, it will greatly enhance the quality of life and lifespan of these patients. It is now possible to generate enough RBCs for in vivo studies from adult hematopoietic stem/progenitor cells (HSPCs).4 HSPC-derived RBCs equal to one tenth of the cells in an RBC transfusion unit (containing ~2 × 10¹² RBCs) were manufactured and tested in a person.4 In addition, recent studies using small-scale expansion suggested that it could be possible to generate 10–500 units from the HSPCs in one unit of umbilical cord blood (CB),5,6 even though RBCs within the CB (normally <150–200 ml) would not be enough for transfusion. Even with this theoretical upper-limit for possible expansion, the current protocol does not allow for the generation of sufficient RBCs ex vivo for transfusion-dependent patients who need repeated transfusion of 1–4 units every 2–4 weeks. One potential approach is to first establish a renewable cell source, such as induced pluripotent stem cells (iPSCs) from donors. Although human iPSCs can be reprogrammed from adult somatic cells and expanded ex vivo unlimitedly as embryonic stem cells (ESCs),7,8,9 their maintenance, direct differentiation to erythroid lineage, and terminal differentiation remain inefficient.10,11,12 While we and others are continuing to improve this approach, we are also exploring other means to obtain erythroid precursors that can be expanded vastly for the purpose of generating large numbers of cRBCs for transfusion.
Definitive erythropoiesis occurs primarily in the fetal liver and postnatal bone marrow in mammals and is characterized by three distinct stages.13,14 The first stage consists of differentiation of HSPCs to erythroid progenitors. The earliest erythroid-restricted progenitor is the burst-forming unit erythroid (BFU-E) that gives rise to colony-forming unit erythroid (CFU-E). The second stage consists of morphologically recognizable erythroblasts that progress from pro-erythroblast to basophilic, polychromatophilic, and orthochromatic erythroblasts. During this stage, erythroblasts accumulate hemoglobin, expand cell numbers by limited (~3–4) cell divisions, decrease cell size, condense nuclei, and enucleate to form young RBCs (reticulocytes). The third stage consists of reticulocyte maturation and RBC circulation. Mature RBCs enter the blood stream and circulate for 120 days in humans before being cleared.
Numerous investigators have tried to establish erythroid progenitor/precursor cell lines from primary human blood cells with genetic modifications.15 Most of these genetically immortalized erythroid cell lines are of leukemic cell origin or transformed by in vitro genetic manipulation, and thus have defects on terminal differentiation and maturation, rendering them unsuitable for clinical application.16,17,18 Recently, mouse erythroblast lines have been established from in vitro differentiated ESCs or early mouse embryos that have normal in vitro or in vivo terminal maturation capabilities.19,20,21 These new findings suggest that embryonic stage erythroblasts process much higher proliferative or self-renewal capabilities than postnatal counterparts.
Adult somatic cells can be reverted to embryonic-like states, best exemplified by the iPSC technology.22 Recently, several studies reported that the original Yamanaka reprogramming factors (Oct4, Sox2, Klf4, and Myc), which are first used to convert somatic cells into iPSCs, can also convert fibroblasts to cardiomyocytes or neural progenitors under culture conditions favoring the growth of the new cell types.23,24 It is suggested that the forced expression of the reprogramming factors may induce an epigenetically unstable state of the cells, which can then adopt a different stable cell fate under specific culture conditions.23 These findings led us to hypothesize that postnatal erythroblasts with limited ex vivo expansion potential may be reprogrammed or converted into embryonic-like erythroblasts with extensive ex vivo expansion potential by forced expression of one or more reprogramming factors, followed by an optimal erythroblast expansion condition (instead of the ESC culture condition for iPSC derivation).
Here, we demonstrate that primary human CB-derived erythroblasts with short-term ex vivo expansion potential can be reprogrammed or induced to become erythroblasts with long-term extensive ex vivo expansion potential by ectopic expression of 3 to 4 genetic factors. Despite prolonged ex vivo culture (>12 months), these immortalized/induced erythroblasts (iE) are karyotypically and phenotypically normal, remain dependent on a combination of cytokines and hormone for survival and expansion. Most importantly, they preserve the capability to differentiate into functional enucleated and hemoglobinized erythrocytes in vitro after extended expansion in a defined serum-free condition. This method may eventually create unlimited sources of optimally matched cRBCs for transfusion medicine.
Results
Expansion of primary erythroblasts established from human CB mononuclear cells is limited
To establish a primary culture of erythroblasts from unfractionated CB mononuclear cells (CB MNCs), we used a serum-free culture condition adapted from published reports.25,26 CB MNCs were seeded in a serum-free medium supplemented with cytokines (SCF, Epo, IL-3, and IGF-I) and a hormone (a synthetic glucocorticoid Dexamethasone or Dex). The cell number decreased in the first 5 days, likely due to cell death of lymphocytes and other myeloid cells. The cell number started increasing exponentially afterward (Figure 1a). After 2–5 weeks of expansion, nearly all the cells express early erythroid progenitor/precursor cell markers CD36 and CD45. About 70% of them coexpress erythroid specific marker glycophorin A (CD235a), consistent with the pro- and basophilic-erythroblast morphology (Figure 1b,c). A majority of the cells express low level of intracellular fetal hemoglonbin (HbF), which can be detected by FACS but not by lower sensitivity benzidine staining on cytospin slides (Figure 1b,c), as expected from the original neonatal CB sample and “stressed” erythropoiesis mimicked by the culture condition that upregulates fetal hemoglobin expression. These ex vivo-expanded cells are also relatively enriched for colony-forming unit-erythroid (CFU-E) progenitors (Figure 1d) compared to the starting population (CB MNCs). We previously used these proliferating erythroblasts (days 7–21 in culture) to derive human induced pluripotent stem cells (iPSCs).9 These primary erythroblasts can only proliferate ex vivo for about 1 month to reach 0.5–10 × 106-fold expansion (varied among CB donors) (Figure 1a). This limitation has prompted us to devise approaches of enhancing erythroblast ex vivo expansion by defined genetic factors, such as those used in reprogramming them to iPSCs, which have unlimited self-renewal capacity.
Figure 1.
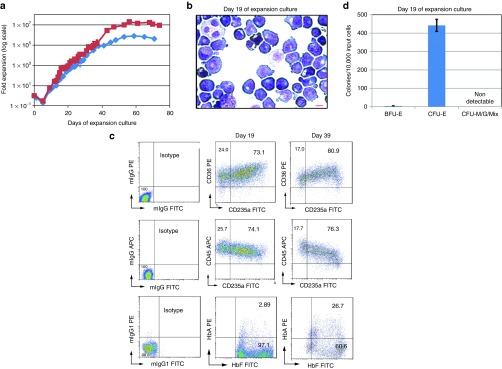
Short-term expansion of primary erythroblasts derived from unfractionated human cord blood mononuclear cells (CB MNCs) in a serum-free culture condition. (a) Growth curves of erythroblast expansion cultures started with unfractionated CB MNCs in serum-free medium supplemented with SCF, IL-3, IGF-1, EPO, and Dexamethasone. Two curves represent two different CB donors. (b) Morphology of day 19 primary erythroblast expansion culture from CB MNCs after Wright-Giemsa and Benzidine staining. Majority of the cells have pro-erythroblast or basophilic-erythroblast morphology and are benzidine negative. Scale bar: 10 µm. (c) FACS analysis of cell surface markers and intracellular hemoglobin expression phenotypes of day 19 primary erythroblast expansion culture from CB MNCs. (d) Colony-forming unit (CFU) types and numbers of 10,000 primary culture cells at day 19 erythroblast expansion culture from CB MNCs. No myeloid CFUs and few burst-forming unit erythroid (BFU-E) colonies were observed. Approximately 4.5% of culture cells are CFU-E. ND: not detectable.
Extensive ex vivo expansion of human erythroblasts after ectopic expression of reprogramming factors in CB-derived primary erythroblasts
The proliferating primary erythroblasts established from CB MNCs (~day 19 of expansion) were transduced with retroviral vectors for self-renewal reprogramming. Initial candidate factors included Oct4 (O), Sox2 (S), Klf4 (K), c-Myc (M) transgenes and anshRNA (P) against human TP53 gene. The four transgenes in the vectors we used happen to be mouse cDNAs in origin, which are highly similar to human orthologs and equally functional in human cells.27 Cultured expanded erythroblasts were transduced with all five factors together (OSKMP), combinations of four factors, or a green fluorescent protein control (Supplementary Figure S1). After gene transduction, we continued to culture transduced cells in the same erythroblast expansion medium. Only the cells transduced with all five factors (OSKMP) or a combination of four factors (SKMP) maintained proliferation for additional 60 days. The cells transduced with OSKMP then became adherent cells with non-erythroid phenotypes (data not shown) after >100 days of expansion (iE1; Figure 2a and Supplementary Table S1). The cells transduced with SKMP showed the fastest growth rate and highest expansion potential: up to 1068-fold in about 12 months and remaining in suspension culture throughout the whole expansion period (named as iE2; Figure 2a). All other four-factor combinations and the green fluorescent protein control did not induce extensive expansion, suggesting the induced expansion is dependent on specific genetic factors. Our data suggest that OCT4 transgene is not necessary or even inhibitory to the induced erythroblast immortalization. To further delineate the essential genetic factors, we eliminated single factors from the SKMP 4-factor combination. Our data showed that three factors, Sox2, c-Myc, and p53shRNA (SMP, named iE3), are essential and sufficient for derivation of immortalized erythroblasts (iE) from CB, while Klf4 transgene is not required (Figure 2b).
Figure 2.

Extensive ex vivo expansion of human erythroblasts after ectopic expression of genetic factors in cord blood (CB)-derived primary erythroblasts. (a) Growth curves of human erythroblasts after retrovirus transduction with different combinations of genetic factors in day 19 CB primary erythroblasts. O: Oct4, S: Sox2, K: Klf4, M: c-Myc, P: p53shRNA, and green fluorescent protein (GFP). (b) Independent experiment showing growth curves of human erythroblasts after retrovirus transduction with different combinations of four and three genetic factors to further narrow down essential factors. (c) FACS analysis of cell surface markers and intracellular hemoglobin protein expression of iE2 cells at day 50, 84, 110, 127, and 185 of expansion culture. (d) Cell morphology in suspension culture well (left) or cytospin by Wright-Giemsa and benzidine staining (middle and right) of iE2 cells at days 132 and 295 of expansion culture. Almost all of the cells have proerythroblasts or basophilic-erythroblasts morphology and are benzidine negative suggesting low hemoglobin content. Scale bar: 10 µm.
We further characterized iE cell lines after reprogramming and expansion for ≥50 days, especially the iE2 line derived by SKMP 4-factor combination that expanded longest (>12 months). Cell surface marker expressions of iE2 cells were analyzed by flow cytometry at various time points (days 50, 84, 103, 185, and 264) of expansion. The iE2 cells maintained immature erythroblast phenotype (CD45+CD36+CD235a+) in near 100% of the cells throughout the expansion period (Figure 2c, Supplementary Figure S2a). The iE2 cells lacked multipotent HSPC marker (CD34), other myeloid (CD14 and CD15) or lymphoid (CD3 and CD19) markers (Figure 2c, Supplementary Figure S2a,b). To further substantiate their erythroid cell identity, we showed that nearly all iE2 cells express intracellular fetal hemoglobin protein (HbF) at various time points of expansion similar to primary CB erythroblasts (Figures 1c and 2c), although the HbF level decreases slightly at later days of expansion (>180 days) (Figure 2c). We also examined iE2 cell morphology at different time points of expansion by Wright-Giemsa and benzidine staining. As shown in Figure 2d, the cells in the iE2 culture morphologically resemble proerythroblasts or basophilic erythroblasts with large cell sizes (22.2 ± 0.7 µm, n = 25), large nuclei and basophilic cytoplasm.21 They are benzidine negative, probably due to the low level of hemoglobin in the cells, below the detection by benzidine staining. Using the standard hematopoietic colony-forming assay in the methylcellulose culture system with multi-lineage hematopoietic cytokines (SCF, Epo, IL-3, and GM-CSF) and fetal bovine serum (FBS), we did not detect typical hematopoietic colonies such as BFU-E, CFU-E, or myeloid CFUs, except some small cell clusters, suggesting that these iE2 cells are composed of erythroid precursor cells (proerythroblasts and basophilic erythroblasts). Under an FBS-free methylcellulose culture supplemented with iE expansion cytokines (SCF, Epo, IL-3, IGF-1, and Dex), iE2 cells form colonies at about 16% efficiency. The other iE cells also maintained immature erythroblast phenotype and morphology during the long-term expansion (Supplementary Figure S3). We have derived four iE cell lines (iE2, iE3, iE4, and iE5) using SMP or SKMP combinations of genetic factors from two different CB donors and one unstable cell line (iE1) with five genetic factors (OSKMP) (Supplementary Table S1). The true iE cell lines (iE2, iE3, iE4 and iE5) all showed similar growth and phenotypic properties (Figure 2a–c, Supplementary Figure S3). Among them, the iE2 cell line was most thoroughly characterized; therefore it was used for most of the following experiments.
iE cells maintain normal diploid karyotypes and growth factor dependence
The expanding iE2 and iE3 cells showed normal diploid karyotypes at different days of expansion culture (up to 275 days), when analyzed by standard G-banding karotyping (Figure 3a–c, Supplementary Figure S3c). To examine if iE cells maintain their dependence on growth factors and hormone for proliferation, individual growth factors or hormone were taken out from the complete medium for the culture of iE2 cells that had already been expanded in full medium for 124 days. The growth curves afterwards showed that iE2 cells are strictly dependent on SCF, Epo, and Dex for survival and long-term proliferation (Figure 3d), consistent with a previous report of extensively expanded mouse erythroblasts.21 We also examined the factor dependence of iE2 cells at later days of expansion (day 271) and found their growth is still dependent on SCF, Epo, and Dex Supplementary Figure S4). To probe if expanded iE2 and iE3 cells are polyclonal or monoclonal, we attempted to determine numbers of transgene insertion sites in the genome. We conducted Southern blot analysis of iE2 (at two expansion time points) and iE3 cell lines together with the starting pCBE19 cells, using two different transgene probes to detect the presence of inserted transgenes in the digested genomic DNA Supplementary Figure S5). Our data revealed that each iE cell line is a clonal or semi-clonal population originating from one or two cells (with one or two insertions of each transgene in the genome). It is consistent with our observation that we saw a significant decrease of cell number in the first 5 days (data not shown) and slow cell number increase during the first 40 days after viral transduction (Figure 2a,b), suggesting only a small subset of the transduced cells with the right combination of multiple transgenes gain the ability to proliferate extensively. Eventually, one or two clones with favorable genetic modifications may dominate the culture due to growth advantage. However, there is no common integration site for each iE cell line, suggesting that a particular insertion site is not required for iE cell generation and expansion.
Figure 3.

iE2 cells maintain normal diploid karyotypes and dependence on cytokines and hormone for proliferation even after long-term ex vivo expansion. (a–c) G-banding of iE2 cells at days 109, 159, and 275 of expansion showed normal karyotypes. At least 20 metaphases were examined for each sample. (d) Growth factor elimination experiments started at day 124 of iE2 expansion culture showed that the continuous survival and proliferation of iE2 cells is dependent on the combinational act of SCF (S), Epo (E), and Dexamethasone (D), while IGF-1 (I) and IL-3 (3) are not required for iE2 proliferation. Error bars represent standard deviation of three repeats.
The expanded iE cells maintain transgenic reprogramming factor expression and express endogenous human SOX2, c-MYC and MYB genes
We examined the expression of retrovirus-mediated transgenes in iE2 cells by specific RT-PCR detecting (mouse) transgenes (primer sequences provided in Supplementary Table S4). The transgenes Sox2 and c-Myc were expressed in the iE2 cells at days 118 and 207 of expansion (Figure 4a) while the Klf4 transgene was not expressed, consistent with its dispensable role for induction of extensive expansion (Figure 2b). We further examined the presence or absence of Klf4 transgene in the genome of iE2 cells by genomic PCR and found no mouse Klf4 transgene in the genome of iE2 cells (Figure 4b), suggesting the pMx-Klf4 did not transduce into the cells or transduced cells are selectively eliminated from the culture. To examine retroviral vector-mediated p53shRNA expression in iE2 cells, we took advantage of the fact that the p53shRNA vector coexpresses a puromycin resistance gene downstream of p53shRNA.28 In Figure 4c, the growth curve showed that iE2 cells are resistant to puromycin, suggesting p53shRNA is also constitutively coexpressed with the puromycin resistance gene. We further determined that human TP53 gene expression in iE2 cells was reduced by about twofold compared to primary erythroblasts by qRT-PCR (Figure 4d) and by array analysis (Supplementary Table S2). Furthermore, we determined that the protein levels of p53 in iE2 and iE3 cells were reduced by about two- to fourfold compared to the starting primary culture-expanded erythroblasts (pCBE19) by western blot analysis Supplementary Figure S6). The reduced level of p53 may be sufficient to maintain genome integrity of iE cells under the culture condition we used.
Figure 4.
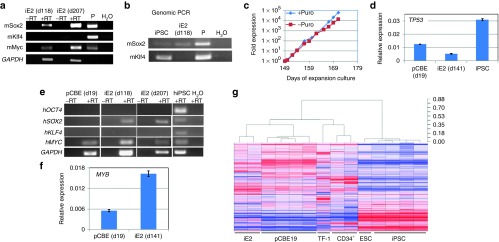
Gene expression studies of iE2 cells. (a) Expression of (mouse) transgenes in iE2 cells after long-term expansion at days (d) 118 and 207 detected by RT-PCR. P: plasmids with the transgene cDNA. (b) Genomic PCR detecting the mouse Sox2 and Klf4 cDNA in genomic DNA. mSox2cDNA is present in iE2 genome (upper panel) but mKlf4 cDNA is absent in iE2 genome (lower panel). iPSC is a human iPSC line derived using pMX-mSox2, mKlf4, mOct4, and mMyc vectors. (c) Puromycin resistance of iE2 cells during expansion suggesting continuous expression of p53shRNA from the integrated retroviral vector. (d) qRT-PCR analysis of human TP53 gene expression of primary day 19 culture-expanded cord blood (CB) erythroblasts (pCBE19), iE2 and iPSC cells. (e) iE2 cells upregulate endogenous human SOX2 gene expression and maintain c-MYC gene expression at both days 118 and 207 of expansion culture. (f) qRT-PCR analysis of human MYB gene expression of primary day 19 culture-expanded CB erythroblasts (pCBE19) and iE2 cells. (g) Dendrogram and heatmap of unsupervised hierarchical clustering analysis of global gene expression profiles of various cell types. Distance numbers on the top right represent the value of Pearson distance (1-R) determined by Pearson correlation algorithms. iE2 cells are clustering with pCBE19 cells while TF-1 cells are clustering with CD34+ HSPCs. ESC/iPSCs are clustering together and separated from all blood cells.
We next examined the expression of the endogenous human OCT4, SOX2, KLF4 and c-MYC genes in both primary erythroblasts and iE2 cells by RT-PCR specific for the human genes (primer sequences provided in Supplementary Table S4). SOX2 is not expressed in primary CB erythroblasts but is upregulated in iE2 cells at both days 118 and 207 of expansion (Figure 4e). The c-MYC gene is expressed in both primary erythroblasts and iE2 cells. OCT4 and KLF4 genes are not expressed in either primary erythroblasts or iE2 cells, suggesting the iE2 cells did not contain pluripotent cells. We also examined the expression of human MYB gene which has been implicated in embryonic erythroblast self-renewal21 by qRT-PCR. MYB gene expression is slightly upregulated (~3-fold) compared to primary erythroblasts (Figure 4f).
Global gene expression profile of iE2 cells
To gain insights of molecular identity and mechanisms of extensive expansion of iE cells, we compared the genome-wide gene expression profiles of iE2 cells to primary CB erythroblasts expanded from CB MNCs (pCBE19: the starting cells of iE2) and to an erythroleukemia-derived human cell line (TF-1) that expresses the CD34 marker. Gene expression profiles of fetal and adult CD34+ HSPCs as well as human ESC and iPSCs were also included for comparison. Unsupervised hierarchical clustering heatmap-dendrogram revealed that iE2 cells (two samples) are clustered closely with pCBE19 (four samples), suggesting that iE2 cells maintained the cell identity of the original starting cell population. The iE2 cells are distinctly different from the erythroleukemia cell line TF-1 that is clustered closer with CD34+ HSPC cells (two samples). The iPSCs (four samples) that are reprogrammed by essentially the same factors are clustered together with ESCs and distinctly separated from iE2 cells (and other blood cells) (Figure 4g). This global gene expression analysis confirmed that the immortalized iE2 cells closely resemble the proliferating erythroblasts (at day 19) and are different from other immortalized cell lines such as TF-1 and reprogrammed iPSCs. To see if iE2 cells share some of the self-renewal factors of ESCs/iPSC or HSPCs, we selected two sets of genes that are known to be preferentially expressed in ESC/iPSCs22 or CD34+ HSPCs29 and compared their expression patterns among these cell types using the above mentioned microarray data (Supplementary Figure S7). This comparison further demonstrated that iE2 cells (and the starting pCBE19 cells) do not express most ESC/iPSC specific factors (Supplementary Figure S7a). This analysis suggests that iE2 cells upregulate some genes associated with HSPCs (Supplementary Figure S7b).
The comparison of global gene expression profiles between iE2 cells and primary CB erythroblasts (pCBE19) provided some interesting candidate genes for further investigation into their roles in the reprogrammed erythroblast self-renewal by defined factors. The top differentially expressed genes are listed in Supplementary Tables S1 and S3. Interestingly, several SOX family members (including SOX2, SOX6, SOX4, and SOX21) are upregulated at significant levels in iE2 cells compared to primary CB erythroblasts (Supplementary Table S3, RT-PCR in Figure 4e). Similarly, the MYB gene expression was found upregulated in iE2 cells by array analysis (Supplementary Table S3) and by RT-PCR (Figure 4f). Similarly by both assays, TP53 gene expression was found attenuated in iE cells. Several hemoglobin genes such as HBB, HBA, and HBZ are substantially downregulated in iE2 cells compared to primary CB erythroblasts (Supplementary Table S2), which are confirmed by qRT-PCR analysis (Supplementary Figure S8) suggesting some de-differentiation of iE2 cells from pCBE19.
Extensively proliferating iE cells maintain the ability to differentiate into enucleated erythrocytes after prolonged ex vivo expansion
To test the ability of extensively proliferating human iE cells to terminally differentiate into enucleated erythrocytes in vitro, we adapted a mouse stromal cell (OP9) coculture system for erythroid terminal differentiation.30,31 SCF, IL-3, IGF-1, and Dex were excluded from the terminal differentiation condition, while Epo, FBS, and holo-transferrin were supplemented. We examined the cell number kinetics, cell size distribution, hemoglobin accumulation and enucleation efficiency during the differentiation process.
The cell number kinetics showed iE2 cells (examined between expansion days 100–200) gradually stopped proliferation during the in vitro terminal differentiation, resulting in a net expansion of ~2- to 3-fold in 16 days (Supplementary Figure S5a) similar to primary erythroblasts expanded from CB MNCs (Supplementary Figure S9a). Cell diameters of maturating iE2 cells gradually decreased from 22.2 ± 0.7 µm (n = 25) at days 0 to 13.1 ± 1.0 µm (n = 25) at day 16 of differentiation culture (Figure 5b). Benzidine staining on cytospin slides showed differentiating iE2 cells accumulated hemoglobin from day 5 and increased hemoglobin accumulation (benzidine positive percentage) during the differentiation period (Figure 5c,d). We used several independent methods to detect terminally differentiated enucleated erythrocytes. Wright-Giemsa and Benzidine staining detected hemoglobin-containing enucleated erythrocytes as early as day 10 of differentiation culture (Figure 5d) and increased in percentage at day 16. To be more unambiguous and quantitative, we used DRAQ5 (a cell permeable fluorescent dye specific for DNA)32 to detect the presence or absence of nuclei in combination with erythrocyte cell surface marker CD235a to detect and quantify enucleated erythrocytes using both fluorescence microscopy and flow cytometry. Fluorescence microscopy images of stained differentiated cells at different time points showed small CD235a positive (green circle) cells without DRAQ5 positive nuclei (red dot) increased in number during the differentiation (Figure 5e). Using flow cytometry, we quantified that the enucleation efficiency (CD235a+DRAQ5−) increased gradually from days 0 to 16 of differentiation culture (30.8 ± 3.6% at day 16, n = 4) (Figure 6a,c). Erythroid terminal differentiation also accompanies cell surface marker changes. Flow cytometry analysis showed marked downregulation of CD45 and upregulation of CD235a, consistent with in vivo erythroid terminal differentiation (Figure 6b). Importantly, the kinetics and efficiency of terminal differentiation and enucleation of iE2 cells are very similar to those of primary culture-expanded CB erythroblasts (Supplementary Figure S9b–d). Blood group antigens are upregulated on the cell surface of differentiated RBCs. We examined Duffy blood group antigen (hDARC) expression on iE2 cells before and after terminal differentiation. iE2 cells at day 335 of expansion culture do not express hDARC on cell surface (Supplementary Figure S10a). After 16 days of terminal differentiation culture, we detected 72.7% of enucleated erythrocytes express hDARC on their cell surface (Supplementary Figure S10b) suggesting normal terminal differentiation of iE2 cells. The iE3 cells at day 190 of expansion can also be induced to terminally differentiate into enucleated erythrocytes, albeit at a lower efficiency than iE2 cells (Supplementary Figure S11).
Figure 5.

Terminal differentiation potential of iE2 cells. (a) Cell number kinetics of iE2 cells in differentiation culture. (b) Cell diameter kinetics of iE2 cells in differentiation culture. Cell diameters are measured using imageJ software from cytospin images of differentiation culture at different time points. (c) Benzidine positive cells percentage during differentiation culture. Benzidine positive cells are identified and counted in the cytospin images of differentiation culture stained with Benzidine (yellow) and Giemsa (dark blue) (as shown in Figure 5d); at least 100 were counted for each sample. (d) Bright field images of Wright-Giemsa staining and benzidine staining of cytospin slides prepared from iE2 cell differentiation culture at different time points. Red arrows mark representative enucleated erythrocytes found at day (d) 16 of maturation. Scale bar: 20 µm. (e) Multichannel immunofluorescence microscopy images of iE2 cell differentiation culture at different time points. Red: DRAQ5. Green: CD235a-FITC. Red arrows mark enucleated erythrocytes. Red arrows mark representative enucleated erythrocytes. Scale bar: 20 µm. Fluorescence images were taken using Nikon Eclipse TE2000-U inverted microscope with 40×ELWD Plan Fluor/0.6 objective at 25 °C and a Qimaging Micropublisher 5.0 digital camera with QCapture software (Version 3.1.2). (f) Cell pellets of iE2 cells before and 16 days after differentiation culture. Shown data are representatives of five independent experiments.
Figure 6.

Flow cytometry analysis of intact cells after terminal differentiation from iE2 cells. (a) Flow cytometry analysis of CD235a (Glycophorin A), DRAQ5 (a cell permeable fluorescent dye after binding DNA) (b) Flow cytometry analysis of CD235a (Glycophorin A) and CD45 cell surface staining during differentiation culture. (c) Percentages of enucleated erythrocytes (CD235a+DRAQ5−) quantified by flow cytometry of 4 independent experiments (n = 4), error bars represent standard error (SE).
To provide further evidence that iE2 cells uniquely maintain normal terminal differentiation potential as compared to erythroleukemic cell line, we performed similar differentiation experiments with the growth factor–dependent human cell line TF-1. The TF-1 was first induced into erythroblast-like cells by culturing with Epo for 8 days (Supplementary Figure S12a). The Epo-treated TF-1 cells were then used for the gene expression array analysis as well as terminal differentiation assay by plating onto the same OP9 coculture terminal differentiation condition. In contrast to iE2 cells, TF-1 cells did not stop growing (Supplementary Figure S12b) and essentially no enucleated erythrocytes can be detected by flow cytometry or fluorescence microscopy 16 days after differentiation culture (Supplementary Figure S12c,d). Therefore, the immortalized iE2 cells are distinct from leukemic cell lines by maintaining normal terminal differentiation potential.
Quantitative RT-PCR showed dramatic upregulation of HBG (hemoglobin gamma gene) expression during iE2 terminal differentiation and a less dramatic upregulation of HBE (hemoglobin epsilon gene), HBB (hemoglobin beta gene) and HBD (hemoglobin delta gene) expression (Figure 7a, Supplementary Figure S8). The major hemoglobin genes expressed in differentiated iE2 cells are HBA and HBG, whose protein products form the fetal hemoglobin (HbF, α2γ2). high-performance liquid chromatography analysis showed predominantly fetal hemoglobin (HbF) proteins in day 16 differentiation cells from iE2 cells (Figure 7b). To study the functionality of differentiated cells from iE2 cells, we measured the oxygen equilibrium curve of day 16 differentiated cells from iE2 cells and compared to normal adult blood (Figure 7c). Differentiated erythrocytes from iE2 cells showed a highly similar but slightly left-shifted hyperbolic curve compared to that of normal adult blood, suggesting a higher affinity to oxygen of differentiated cells from iE2 (p50 = 15.5) than normal adult blood (p50 = 24.6). This result is consistent with predominant fetal hemoglobin expression in differentiated cells from iE2.
Figure 7.

Functional hemoglobin characterization of iE2 terminal differentiation cells. (a) qRT-PCR of HBG and HBB gene expression during iE2 differentiation culture. (b) Cation-exchange high-performance liquid chromatography analysis for hemoglobin tetramers composition of iE2 cells before differentiation (day 0) (left), day 16 differentiation culture of iE2 cells (middle) and a healthy adult peripheral blood (PB) control (right). (c) Oxygen equilibrium curves of day 16 differentiation culture cells of iE2 cells (triangle) or a healthy adult PB control (square) measured by a Hemox-Analyzer.
Discussion
The ex vivo culture of primary CB MNCs in a serum-free medium supplemented with several erythroid-promoting cytokines and glucocorticoid results in production of erythroblasts by up to 2 × 10⁷-fold, much greater than from adult blood MNCs.25,26,33,34,35,36,37 However, this level of expansion can only generate, theoretically, RBC numbers equivalent to 50–100 units of RBC concentrates. Here, we report that ectopic expression of 3 to 4 genetic factors in CB primary erythroblasts (which normally only have transient and limited self-renewal capability) turns them into immortalized erythroblasts (iE) that can self-renew/proliferate for months. The iE cells maintain their phenotype as floating large, CD36+CD45+CD235a+ immature erythroblast cells with a normal karyotype throughout the whole expansion culture period (≥1068-fold in 12 months), suggesting that iE cells are self-renewing ex vivo. These iE cells retain their ability to terminally differentiate into enucleated RBCs that are highly hemoglobinized and are able to bind and release oxygen in response to oxygen partial pressure, even after 1034-fold expansion, they remain entirely dependent on the combinatorial action of SCF, Epo, and glucocorticoid signaling for their survival and proliferation. The global gene expression profiling studies showed that iE cells closely resemble the primary proliferating erythroblasts. During the preparation of this paper, another group reported immortalization of human erythroid progenitor cell lines from hiPSCs and CB cells by inducible expression of TAL1 and HPV16-E6/E7 viral genes after lentivirus-mediated stable gene transfer and coculture with OP9 cells.18 It is intriguing that different sets of transgenes can have similar effects. Whether the cell lines established by two different methods have similar properties and differentiation potential remains to be investigated.
So far, we achieved the reprogrammed self-renewal of human erythroblasts using retroviral vectors expressing Sox2, c-Myc, and anshRNA reducing the expression of TP53. These same vectors have been used to enhance iPSC derivation when used together with another retroviral vector expressing Oct4. It is interesting to note that adding Oct4 transgene is not essential for reprogrammed self-renewal of erythroblasts. The c-Myc and the attenuation of TP53 activity have been shown to play important roles in erythroid precursor proliferation.38,39,40 Although these two genetic factors are commonly associated with tumorigenesis and cell transformation, they are insufficient to transform normal human cells.41 Our results suggest that by a combination of other genetic factors and specific culture conditions, immortalization of lineage specific precursor cells can bypass the cell transformation and maintain the normal phenotypes and functionality. In our system, the retroviral vector-mediated expression of c-Myc transgene may be downregulated after the induction of terminal differentiation, consistent with the notion that downregulation of Myc is essential for terminal erythroid differentiation.40 Further studies are needed to clarify this issue. Sox family transcription factors play important roles in stem/progenitor cell regulations in many tissues;42 we have detected the upregulation of several Sox family members in iE cells, most notably SOX2, whose activity is required for iE derivation. Further studies are needed to understand their functions in reprogrammed self-renewal of lineage-committed precursor cells. The same or similar factors may be able to immortalize other functional lineage precursors. This approach may provide unlimited in vitro supply of wide variety cell types for cell therapy or drug discovery.
Since the final product of this approach is enucleated RBCs, the potential negative impact or risk of the retroviral expression of c-Myc or other genetic factors is minimal, as long as they will not interfere with erythroid terminal differentiation. The residual nucleated cells in the final matured population can be eradicated by irradiation or filtered out by de-leukocyte filtration.2 We have only achieved efficient enucleation of primary and immortalized erythroblasts with mouse stromal cell coculture system that is not scalable or suitable for clinical applications. Among the three iE cell lines (iE2, iE3, and iE4) we tested for terminal differentiation, two of them (iE2 and iE3) can maturate into hemoglobinized and enucleated erythrocytes at varying efficiency (Figure 5 and Supplementary Figure S12), while iE4 underwent cell death in the terminal differentiation system we used (data not shown) (Supplementary Table S1). We are investigating the underlining molecular mechanisms for this difference. In the future, some of the oncogenic transgenes may be replaced by non-oncogenic genes or small molecules to make the iE cells better at maintaining normal terminal differentiation function. We are now working on improving the ex vivo enucleation efficiency of iE cells under a stromal-free condition by testing the addition of candidate genetic factors and/or small molecules, such as survivin and vacuolin-1.43,44 In recent years, alternative methods such as episomal vectors, mRNA or microRNA combinations were also reported for reprogramming somatic cells to iPSCs. We are now testing if these non-integration methods would provide sufficient or sustained gene expression to reprogram erythroblasts to a self-renewing state. Ultimately, we will also apply this erythroblast self-renewing method to adult blood cells, which were shown to be 10- to 50-fold less efficient to be reprogrammed to iPSCs than the counterpart CB cells.45
Human CB has been widely banked worldwide both in public and private organizations, representing a wide variety of ethnicity and genetic background.46,47,48 The iE cells derived from these CB sources can be screened for optimal match to chronic transfusion-dependent patients. Because of the essentially unlimited ex vivo expansion potential of iE cells, these optimally matched iE cells can be expanded, stored, transported and matured into mature RBCs for transfusion with reduced risk of alloimmunization.49 The derivation of iE cells from healthy O and Rh-negative (O-) donors, and their subsequent expansion and maturation, will potentially provide universal RBCs for transfusion in emergency situations where blood supply and typing is limited. This unlimited supply of ex vivo generated human RBCs may also serve as an in vitro model for studying malaria infection and antimalaria drug discovery. In light of this, we demonstrated that matured cells from iE cells highly express Duffy antigen, the receptor for malaria parasite.50
Materials and Methods
Human CB samples. Use of anonymous human CB samples for laboratory research was approved by the Johns Hopkins University Institutional Review Board. Human primary CB MNCs are obtained from anonymous, healthy donors and then isolated in our lab using Ficoll-Paque Plus (P = 1.077) or directly purchased from AllCells, LLC (AllCells, Emeryville, CA).
Primary erythroblast expansion culture from CB MNCs. After thawing, frozen CB MNCs (5 × 10⁶/ml) were cultivated in serum-free medium (50% Iscove's modified Dulbecco's medium (IMDM) with 50% Ham's F12 (Invitrogen, Carlsbad, CA), synthetic lipids (Invitrogen), insulin-transferrin-selenium supplement (Invitrogen) and 5 mg/ml bovine serum albumin (Sigma, St Louis, MO), 50 µg/ml of ascorbic acid (Sigma) and 2 mmol/l GlutaMax (Invitrogen) supplemented with Epo (2 U/ml; R&D systems, Wiesbaden, Germany), Dexamethasone (Dex, 1 µmol/l; Sigma), insulin-like growth factor 1 (IGF-1; 40 ng/ml), stem cell factor (SCF; 100 ng/ml; Peprotech, Rocky Hill, NJ), and holo-transferrin (100 µg/ml; Sigma), termed “erythroblast expansion medium” in gelatin-coated wells. Primary cultures of erythroblasts established after several days were kept <1 × 10⁶ cells/ml by daily cell counting and partial medium changes. Proliferating erythroblasts can be frozen and thawed at high efficiency (~90%).
Derivation and expansion culture of immortalized erythroblast cell lines. Four retroviral vectors pMXs-Oct4, pMXs-Sox2, pMXs-Klf4, and pMXs-cMyc expressing four reprogramming factors (encoded by the mouse genes, used in the original studies by Dr Shinya Yamanaka)22 were obtained from Addgene (www.addgene.org), along with the pMKO.1 puro p53shRNA retroviral vector encoding shRNA against TP53 gene (Plasmid#10672). Retrovirus production and transduction were done as previously described.27 After 2 days of transduction, transduced cells were washed with phosphate-buffered saline (PBS) and plated at a density of 1 × 10⁵ cells/well in 12-well gelatin-coated plates in the erythroblast expansion medium. Total medium changes were performed every other day for the first 4 weeks after transduction. After the cells became proliferating constantly, only partial medium change and cell passaging every 2–3 days were performed to keep cell density ≤5 × 10⁵ cells/ml.
Flow cytometry and fluorescence microscopy. For flow cytometry analysis of erythroblasts in expansion, we harvested the cells, washed with PBS, and resuspended the cell pellet in PBS for antibody staining. We used CD235a-FITC (BD Biosciences, San Jose, CA), CD36-PE (BD Biosciences), hDARC-PE (R&D system), CD34-FITC (Invitrogen), and CD45-APC (Invitrogen) to characterize expanding cells. Dead cells were excluded from analysis by 7-AAD (Viaprobe, BD Biosciences) staining. For intracellular hemoglobin staining, cultured cells were fixed by incubation with PBS containing 4% formaldehyde for 15 minutes at room temperature, and washed twice with PBS. The fixed cells were permeabilized by incubation with 0.25% Triton X-100 in PBS for 5 minutes and washed twice with PBS. To prevent non-specific antibody binding, cells were pre-blocked by incubation with 10% bovine serum albumin in PBS for 30 minutes at room temperature and washed once. The cells were then incubated with fluorochrome-conjugated monoclonal antibodies HBB-PE (specific to HbA; Santa Cruz Biotechnology, Santa Cruz, CA; catalog no. sc-21757) and HBG-FITC (specific to HbF; Invitrogen; catalog no. MHFH01) or appropriate isotype IgG controls diluted in 3% bovine serum albumin/PBS for 30 minutes at room temperature and washed twice with PBS. The stained cells were analyzed using FACSCalibur flow cytometer (BD Biosciences) and FlowJo software (TreeStar, Ashland, OR). At least 50,000 events were collected and analyzed. The percentages of gated cell populations (gates are based on the background staining of isotype-matched antibodies) among the total live cells are shown.
For flow cytometry and fluorescence microscopy analysis of terminal maturation culture of erythroblasts, we harvested suspension cells from OP9 coculture at different time points of maturation, washed with PBS and stained with CD235a-FITC, CD45-PE, and DRAQ5 (Cell Signaling Technology, Danvers, MA). Fluorescence images were taken using Nikon Eclipse TE2000-U inverted microscope with 40×ELWD Plan Fluor/0.60 objective (Nikon, Melville, NY) and a Qimaging Micropublisher 5.0 digital camera with QCapture software (Version 3.1.2), and merged and labeled with Photoshop CS5 (version 12.0.3) (Adobe Systems, San Jose, CA).
Morphological analysis. Cells were spun onto glass slides (Superfrost white microscope slides; Fisher Scientific, Pittsburgh, PA) using Shandon Cytospin 4 (Thermo Scientific, Waltham, MA), stained with Benzidine (3,3′-dimethoxybenzidine; Sigma) and Wright-Giemsa stains (Hema 3, Fisher Scientific, Hampton, NH) as previously described.21 Bright field images were taken with Nikon Eclipse TE2000-U inverted microscope and processed with Photoshop CS5 and ImageJ (NIH, Bethesda, MD).
Karyotyping. Karyotyping analyses of iE cells were carried out as previously described.9,27 Briefly, cells were incubated with 0.1 μg/ml of colcemid for 2 hours, resuspended in 0.075 mol/l KCl, incubated for 20 minutes at 37 °C, and then fixed in 3:1 methanol/acetic acid. After Giemsa staining, karyotypes of normal human chromosomes were examined by a certified cytogeneticist at the 400-band level of resolution or above.
RNA extraction and quantitative RT-PCR. Total RNA was extracted from expanded primary erythroblasts or immortalized erythroblasts cultures using RNeasy Kit (Qiagen, Valencia, CA) and treated with DNA-free kit (Ambion, Austin, TX) to get rid of residual DNA contamination. Total RNA (1 µg) was reverse transcribed into cDNA by using oligodT and Superscript III (Invitrogen), followed by RNase H digestion. The quantitative PCR (Q-PCR) assays were performed using TaqMan assays from Applied Biosystems (ABI, Foster City, CA) in StepOnePlus Quantitative PCR instrument (Life Technologies). Specifically, the probes used in this manuscript are as follows: HBG1/2 (hemoglobin, gamma A/G): Hs00361131_g1; HBB (hemoglobin, beta): Hs00747223_g1; HBZ (hemoglobin, zeta): Hs00923579_m1; HBA (hemoglobin, alpha): Hs00361191_g1; HBE (hemoglobin, epsilon): Hs00362216_m1; HBD (hemoglobin, delta): Hs00426283_m1; MYB: Hs00920556_m1; TP53: Hs01034249_m1; and GAPDH: 4352934E (a constitutive endogenous gene control). All experiments were performed in triplicate and a non-template control (lacking cDNA template) was included in each assay. Relative gene expression was normalized to GAPDH.
Gene expression microarray analysis. Human Gene 1.0 ST Genechip microarrays (Affymetrix, Santa Clara, CA) were hybridized to examine the global gene expression of iE2, pCBE19, TF-1, CD34+ cells and ESC/iPSCs. Total RNA was prepared as described in the RNeasy Mini Kit (Qiagen) and treated with DNA-free kit (Ambion) to get rid of residual DNA contamination. All samples were processed at the Johns Hopkins Deep Sequencing & Microarray Core Facility. Briefly, cDNA was synthesized by the one round amplification protocol for total RNA following Affymetrix' specifications, and Ambion WT Expression Kit (www.affymetrix.com) as described in the manufacturer's instruction manual. All arrays were hybridized for 16 hours at 45 °C with rotation (60 rpm) as described by Affymetrix in their GeneChip Expression Wash, Stain and Scan User Manual (www.affymetrix.com). Fluorescent signals were obtained by using Affymetrix' GeneChip Scanner 3000 7G and default parameters described in the manufacturer's GeneChip Expression Analysis Technical Manual. Images were analyzed using the Affymetrix Command Console version 3 (AGCC v3.0) software, and processed with the Expression Console PLIER algorithm at the manufacturer's specifications. RMA Log2 signal values, for all probe sets, were summarized for gene-level analysis in the Partek Genomics Suite (Partek, St Louis, MO). Gene expression data from the human microarray, described above, were analyzed using Partek Genomic Suite and Spotfire DecisionSite software (TIBCO Software, Palo Alto, CA). The mean-subtracted normalized values underwent unsupervised hierarchical clustering in Spotfire (Pearson correlation algorithms) to compare cell types' gene expression in a heatmap-dendrogram plot (color spectrum indicates relative expression where lower = blue; higher = red). Raw microarray data are available in NCBI's GEO database via accession number GSE44136 (http://www.ncbi.nlm.nih.gov/geo/query/acc.cgi?token=btavbmasyaawsni&acc=GSE44136).
TF-1 cell culture. Human TF-1 leukemia cell line was cultured in RPMI 1640 medium (Invitrogen) containing 10% FBS (Hyclone, Logan, UT) and 1 ng/ml GM-CSF (Peprotech, Rocky Hill, NJ). To induce the erythroid differentiation of TF-1 cells, GM-CSF was replaced by human Epo (3 U/ml) for 8 days in the culture medium.
OP9 stromal cell culture. OP9 cells were expanded in 20% FBS (Hyclone) in α-MEM (Invitrogen) with 4 mmol/l of L-glutamine and 1% penicillin-streptomycin (Invitrogen). OP9 cells were irradiated at 78 Gy using a gamma-irradiator before plating onto gelatin-coated culture wells for coculture with erythroblasts to induce terminal maturation.
Induction of erythroid terminal differentiation. To induce terminal differentiation, proliferating erythroblasts (primary or immortalized) were washed in PBS twice and reseeded at 1 × 10⁶ cells/ml in serum-free medium supplemented with Epo (3 U/ml), holo-transferrin (200 μg/ml), and 10% FBS (Hyclone) on irradiated OP9 stromal cell layers. Suspension cells were counted and collected for analysis at different time points. TF-1 cells were induced to terminal differentiation by the same way as iE cells and pCBE19.
Hemoglobin analysis. Hemoglobin tetramer fractions were measured by high-performance liquid chromatography using a Bio-Rad Variant II Hb analyzer (Bio-Rad Laboratories, Hercules, CA) in accordance with manufacturer's recommendations. Oxygen equilibrium curves were determined using a Hemox-Analyzer (TCS Scientific, New Hope, PA) in accordance with manufacturer's recommendations.
Statistical analysis. Results are presented as the mean ± the standard errors of means, performed at least in triplicates. Data were analyzed with the Student's t-test (two-sided, unequal variance). A P value of <0.05 was considered significant.
Additional materials and methods can be found in Supplementary Materials and Methods.
SUPPLEMENTARY MATERIAL Figure S1. Retroviral transduction efficiency of primary CB-expanded erythroblasts. Figure S2. Cell surface marker expression and morphology of iE2 cells at additional days of expansion culture. Figure S3. Characterization of additional iE cell lines. Figure S4. Growth factor elimination experiments. Figure S5. Southern blot analysis for detecting transgene integrations in iE cells after retrovirus-mediated stable gene transfer. Figure S6. Western blot analysis of p53 protein levels. Figure S7. Gene expression analysis of the selected genes related to (a) pluripotent stem cells (PSC) self-renewal, or (b) hematopoietic stem/progenitor cell (HSC) self-renewal. Figure S8. qRT-PCR of (a) α like and (b) β like hemoglobin gene expression of primary culture-expanded erythroblasts (pCBE19), iE2 cells and terminally differentiated iE2 cells. Figure S9. Terminal differentiation (maturation) culture of primary CB culture-expanded erythroblasts (day 19 of expansion from CB MNCs). Figure S10. Analysis of human Duffy blood group antigen (hDARC) expression. Figure S11. Terminal differentiation(maturation) culture of iE3 cells (at day 190 of expansion). Figure S12. Human erythroleukemia cell line TF-1 cells do not terminally differentiate in terminal differentiation (maturation) condition. Table S1. Summary of iE cell lines generated from two CB donors. Table S2. Selected genes with down-regulated expression in immortalized erythroblasts (iE2) compared to cultured CB primary erythroblasts (pCBE19). Table S3. Selected genes with up-regulated expression in immortalized erythroblasts (iE2) compared to cultured CB primary erythroblasts (pCBE19). Table S4. Primer sequences and PCR parameters used for RT-PCR of mouse and human genes. Materials and Methods.
Acknowledgments
The authors thank the Johns Hopkins Deep Sequencing & Microarray Core Facility and Conover Talbot Jr for microarray data generation and analysis. The authors also thank other members of the Cheng lab for stimulating discussions. This work was supported in grants from Maryland Stem Cell Research Fund (2010-MSCRFF-0095 to X.H. and 2011-MSCRFII-0088 to L.C.), and a grant from NIH (2R01-HL073781 to L.C.), and Edythe Harris Lucas and Clara Lucas Lynn Chair in Hematology to L.C. G.J.K. is supported by funding from the National Institutes of Health Intramural Research Program (1 ZIA HL006013). The authors declare no conflict of interest.
Supplementary Material
References
- Bouhassira EE. Concise review: production of cultured red blood cells from stem cells. Stem Cells Transl Med. 2012;1:927–933. doi: 10.5966/sctm.2012-0097. [DOI] [PMC free article] [PubMed] [Google Scholar]
- Migliaccio AR, Whitsett C, Papayannopoulou T, Sadelain M. The potential of stem cells as an in vitro source of red blood cells for transfusion. Cell Stem Cell. 2012;10:115–119. doi: 10.1016/j.stem.2012.01.001. [DOI] [PMC free article] [PubMed] [Google Scholar]
- Zeuner A, Martelli F, Vaglio S, Federici G, Whitsett C, Migliaccio AR. Concise review: stem cell-derived erythrocytes as upcoming players in blood transfusion. Stem Cells. 2012;30:1587–1596. doi: 10.1002/stem.1136. [DOI] [PMC free article] [PubMed] [Google Scholar]
- Giarratana MC, Rouard H, Dumont A, Kiger L, Safeukui I, Le Pennec PY, et al. Proof of principle for transfusion of in vitro-generated red blood cells. Blood. 2011;118:5071–5079. doi: 10.1182/blood-2011-06-362038. [DOI] [PMC free article] [PubMed] [Google Scholar]
- Fujimi A, Matsunaga T, Kobune M, Kawano Y, Nagaya T, Tanaka I, et al. Ex vivo large-scale generation of human red blood cells from cord blood CD34+ cells by co-culturing with macrophages. Int J Hematol. 2008;87:339–350. doi: 10.1007/s12185-008-0062-y. [DOI] [PubMed] [Google Scholar]
- Timmins NE, Athanasas S, Günther M, Buntine P, Nielsen LK. Ultra-high-yield manufacture of red blood cells from hematopoietic stem cells. Tissue Eng Part C Methods. 2011;17:1131–1137. doi: 10.1089/ten.TEC.2011.0207. [DOI] [PubMed] [Google Scholar]
- Loh YH, Hartung O, Li H, Guo C, Sahalie JM, Manos PD, et al. Reprogramming of T cells from human peripheral blood. Cell Stem Cell. 2010;7:15–19. doi: 10.1016/j.stem.2010.06.004. [DOI] [PMC free article] [PubMed] [Google Scholar]
- Staerk J, Dawlaty MM, Gao Q, Maetzel D, Hanna J, Sommer CA, et al. Reprogramming of human peripheral blood cells to induced pluripotent stem cells. Cell Stem Cell. 2010;7:20–24. doi: 10.1016/j.stem.2010.06.002. [DOI] [PMC free article] [PubMed] [Google Scholar]
- Chou BK, Mali P, Huang X, Ye Z, Dowey SN, Resar LM, et al. Efficient human iPS cell derivation by a non-integrating plasmid from blood cells with unique epigenetic and gene expression signatures. Cell Res. 2011;21:518–529. doi: 10.1038/cr.2011.12. [DOI] [PMC free article] [PubMed] [Google Scholar]
- Chang KH, Huang A, Hirata RK, Wang PR, Russell DW, Papayannopoulou T. Globin phenotype of erythroid cells derived from human induced pluripotent stem cells. Blood. 2010;115:2553–2554. doi: 10.1182/blood-2009-11-252650. [DOI] [PMC free article] [PubMed] [Google Scholar]
- Lapillonne H, Kobari L, Mazurier C, Tropel P, Giarratana MC, Zanella-Cleon I, et al. Red blood cell generation from human induced pluripotent stem cells: perspectives for transfusion medicine. Haematologica. 2010;95:1651–1659. doi: 10.3324/haematol.2010.023556. [DOI] [PMC free article] [PubMed] [Google Scholar]
- Dias J, Gumenyuk M, Kang H, Vodyanik M, Yu J, Thomson JA, et al. Generation of red blood cells from human induced pluripotent stem cells. Stem Cells Dev. 2011;20:1639–1647. doi: 10.1089/scd.2011.0078. [DOI] [PMC free article] [PubMed] [Google Scholar]
- Palis J. Ontogeny of erythropoiesis. Curr Opin Hematol. 2008;15:155–161. doi: 10.1097/MOH.0b013e3282f97ae1. [DOI] [PubMed] [Google Scholar]
- Lodish H, Flygare J, Chou S. From stem cell to erythroblast: regulation of red cell production at multiple levels by multiple hormones. IUBMB Life. 2010;62:492–496. doi: 10.1002/iub.322. [DOI] [PMC free article] [PubMed] [Google Scholar]
- Nakamura Y, Hiroyama T, Miharada K, Kurita R. Red blood cell production from immortalized progenitor cell line. Int J Hematol. 2011;93:5–9. doi: 10.1007/s12185-010-0742-2. [DOI] [PubMed] [Google Scholar]
- Kitamura T, Tange T, Terasawa T, Chiba S, Kuwaki T, Miyagawa K, et al. Establishment and characterization of a unique human cell line that proliferates dependently on GM-CSF, IL-3, or erythropoietin. J Cell Physiol. 1989;140:323–334. doi: 10.1002/jcp.1041400219. [DOI] [PubMed] [Google Scholar]
- Wong S, Keyvanfar K, Wan Z, Kajigaya S, Young NS, Zhi N. Establishment of an erythroid cell line from primary CD36+ erythroid progenitor cells. Exp Hematol. 2010;38:994–1005.e1. doi: 10.1016/j.exphem.2010.07.012. [DOI] [PMC free article] [PubMed] [Google Scholar]
- Kurita R, Suda N, Sudo K, Miharada K, Hiroyama T, Miyoshi H, et al. Establishment of immortalized human erythroid progenitor cell lines able to produce enucleated red blood cells. PLoS ONE. 2013;8:e59890. doi: 10.1371/journal.pone.0059890. [DOI] [PMC free article] [PubMed] [Google Scholar]
- Carotta S, Pilat S, Mairhofer A, Schmidt U, Dolznig H, Steinlein P, et al. Directed differentiation and mass cultivation of pure erythroid progenitors from mouse embryonic stem cells. Blood. 2004;104:1873–1880. doi: 10.1182/blood-2004-02-0570. [DOI] [PubMed] [Google Scholar]
- Hiroyama T, Miharada K, Sudo K, Danjo I, Aoki N, Nakamura Y. Establishment of mouse embryonic stem cell-derived erythroid progenitor cell lines able to produce functional red blood cells. PLoS ONE. 2008;3:e1544. doi: 10.1371/journal.pone.0001544. [DOI] [PMC free article] [PubMed] [Google Scholar]
- England SJ, McGrath KE, Frame JM, Palis J. Immature erythroblasts with extensive ex vivo self-renewal capacity emerge from the early mammalian fetus. Blood. 2011;117:2708–2717. doi: 10.1182/blood-2010-07-299743. [DOI] [PMC free article] [PubMed] [Google Scholar]
- Takahashi K, Yamanaka S. Induction of pluripotent stem cells from mouse embryonic and adult fibroblast cultures by defined factors. Cell. 2006;126:663–676. doi: 10.1016/j.cell.2006.07.024. [DOI] [PubMed] [Google Scholar]
- Efe JA, Hilcove S, Kim J, Zhou H, Ouyang K, Wang G, et al. Conversion of mouse fibroblasts into cardiomyocytes using a direct reprogramming strategy. Nat Cell Biol. 2011;13:215–222. doi: 10.1038/ncb2164. [DOI] [PubMed] [Google Scholar]
- Kim J, Efe JA, Zhu S, Talantova M, Yuan X, Wang S, et al. Direct reprogramming of mouse fibroblasts to neural progenitors. Proc Natl Acad Sci USA. 2011;108:7838–7843. doi: 10.1073/pnas.1103113108. [DOI] [PMC free article] [PubMed] [Google Scholar]
- von Lindern M, Zauner W, Mellitzer G, Steinlein P, Fritsch G, Huber K, et al. The glucocorticoid receptor cooperates with the erythropoietin receptor and c-Kit to enhance and sustain proliferation of erythroid progenitors in vitro. Blood. 1999;94:550–559. [PubMed] [Google Scholar]
- Leberbauer C, Boulmé F, Unfried G, Huber J, Beug H, Müllner EW. Different steroids co-regulate long-term expansion versus terminal differentiation in primary human erythroid progenitors. Blood. 2005;105:85–94. doi: 10.1182/blood-2004-03-1002. [DOI] [PubMed] [Google Scholar]
- Ye Z, Zhan H, Mali P, Dowey S, Williams DM, Jang YY, et al. Human-induced pluripotent stem cells from blood cells of healthy donors and patients with acquired blood disorders. Blood. 2009;114:5473–5480. doi: 10.1182/blood-2009-04-217406. [DOI] [PMC free article] [PubMed] [Google Scholar]
- Masutomi K, Yu EY, Khurts S, Ben-Porath I, Currier JL, Metz GB, et al. Telomerase maintains telomere structure in normal human cells. Cell. 2003;114:241–253. doi: 10.1016/s0092-8674(03)00550-6. [DOI] [PubMed] [Google Scholar]
- Zon LI. Intrinsic and extrinsic control of haematopoietic stem-cell self-renewal. Nature. 2008;453:306–313. doi: 10.1038/nature07038. [DOI] [PubMed] [Google Scholar]
- Giarratana MC, Kobari L, Lapillonne H, Chalmers D, Kiger L, Cynober T, et al. Ex vivo generation of fully mature human red blood cells from hematopoietic stem cells. Nat Biotechnol. 2005;23:69–74. doi: 10.1038/nbt1047. [DOI] [PubMed] [Google Scholar]
- Lu SJ, Feng Q, Park JS, Vida L, Lee BS, Strausbauch M, et al. Biologic properties and enucleation of red blood cells from human embryonic stem cells. Blood. 2008;112:4475–4484. doi: 10.1182/blood-2008-05-157198. [DOI] [PMC free article] [PubMed] [Google Scholar]
- Fraser ST, Isern J, Baron MH. Maturation and enucleation of primitive erythroblasts during mouse embryogenesis is accompanied by changes in cell-surface antigen expression. Blood. 2007;109:343–352. doi: 10.1182/blood-2006-03-006569. [DOI] [PMC free article] [PubMed] [Google Scholar]
- Perry JM, Harandi OF, Paulson RF. BMP4, SCF, and hypoxia cooperatively regulate the expansion of murine stress erythroid progenitors. Blood. 2007;109:4494–4502. doi: 10.1182/blood-2006-04-016154. [DOI] [PMC free article] [PubMed] [Google Scholar]
- van den Akker E, Satchwell TJ, Pellegrin S, Daniels G, Toye AM. The majority of the in vitro erythroid expansion potential resides in CD34(-) cells, outweighing the contribution of CD34(+) cells and significantly increasing the erythroblast yield from peripheral blood samples. Haematologica. 2010;95:1594–1598. doi: 10.3324/haematol.2009.019828. [DOI] [PMC free article] [PubMed] [Google Scholar]
- Migliaccio G, Sanchez M, Masiello F, Tirelli V, Varricchio L, Whitsett C, et al. Humanized culture medium for clinical expansion of human erythroblasts. Cell Transplant. 2010;19:453–469. doi: 10.3727/096368909X485049. [DOI] [PMC free article] [PubMed] [Google Scholar]
- Flygare J, Rayon Estrada V, Shin C, Gupta S, Lodish HF. HIF1alpha synergizes with glucocorticoids to promote BFU-E progenitor self-renewal. Blood. 2011;117:3435–3444. doi: 10.1182/blood-2010-07-295550. [DOI] [PMC free article] [PubMed] [Google Scholar]
- Chaurasia P, Berenzon D, Hoffman R. Chromatin-modifying agents promote the ex vivo production of functional human erythroid progenitor cells. Blood. 2011;117:4632–4641. doi: 10.1182/blood-2010-10-314567. [DOI] [PubMed] [Google Scholar]
- Bondurant MC, Yamashita T, Muta K, Krantz SB, Koury MJ. C-myc expression affects proliferation but not terminal differentiation or survival of explanted erythroid progenitor cells. J Cell Physiol. 1996;168:255–263. doi: 10.1002/(SICI)1097-4652(199608)168:2<255::AID-JCP4>3.0.CO;2-O. [DOI] [PubMed] [Google Scholar]
- Dolznig H, Boulmé F, Stangl K, Deiner EM, Mikulits W, Beug H, et al. Establishment of normal, terminally differentiating mouse erythroid progenitors: molecular characterization by cDNA arrays. FASEB J. 2001;15:1442–1444. doi: 10.1096/fj.00-0705fje. [DOI] [PubMed] [Google Scholar]
- Jayapal SR, Lee KL, Ji P, Kaldis P, Lim B, Lodish HF. Down-regulation of Myc is essential for terminal erythroid maturation. J Biol Chem. 2010;285:40252–40265. doi: 10.1074/jbc.M110.181073. [DOI] [PMC free article] [PubMed] [Google Scholar]
- Boehm JS, Hession MT, Bulmer SE, Hahn WC. Transformation of human and murine fibroblasts without viral oncoproteins. Mol Cell Biol. 2005;25:6464–6474. doi: 10.1128/MCB.25.15.6464-6474.2005. [DOI] [PMC free article] [PubMed] [Google Scholar]
- Sarkar A, Hochedlinger K. The sox family of transcription factors: versatile regulators of stem and progenitor cell fate. Cell Stem Cell. 2013;12:15–30. doi: 10.1016/j.stem.2012.12.007. [DOI] [PMC free article] [PubMed] [Google Scholar]
- Keerthivasan G, Small S, Liu H, Wickrema A, Crispino JD. Vesicle trafficking plays a novel role in erythroblast enucleation. Blood. 2010;116:3331–3340. doi: 10.1182/blood-2010-03-277426. [DOI] [PMC free article] [PubMed] [Google Scholar]
- Keerthivasan G, Liu H, Gump JM, Dowdy SF, Wickrema A, Crispino JD. A novel role for survivin in erythroblast enucleation. Haematologica. 2012;97:1471–1479. doi: 10.3324/haematol.2011.061093. [DOI] [PMC free article] [PubMed] [Google Scholar]
- Ye Z, Chou BK, Cheng L. Promise and challenges of human iPSC-based hematologic disease modeling and treatment. Int J Hematol. 2012;95:601–609. doi: 10.1007/s12185-012-1095-9. [DOI] [PubMed] [Google Scholar]
- Broxmeyer HE. Cord Blood Hematopoietic Stem Cell Transplantation. StemBook. Harvard Stem Cell Institute: Cambridge, MA. 2008. [PubMed]
- Broxmeyer HE, Lee MR, Hangoc G, Cooper S, Prasain N, Kim YJ, et al. Hematopoietic stem/progenitor cells, generation of induced pluripotent stem cells, and isolation of endothelial progenitors from 21- to 23.5-year cryopreserved cord blood. Blood. 2011;117:4773–4777. doi: 10.1182/blood-2011-01-330514. [DOI] [PMC free article] [PubMed] [Google Scholar]
- Rao M, Ahrlund-Richter L, Kaufman DS. Concise review: Cord blood banking, transplantation and induced pluripotent stem cell: success and opportunities. Stem Cells. 2012;30:55–60. doi: 10.1002/stem.770. [DOI] [PubMed] [Google Scholar]
- Peyrard T, Bardiaux L, Krause C, Kobari L, Lapillonne H, Andreu G, et al. Banking of pluripotent adult stem cells as an unlimited source for red blood cell production: potential applications for alloimmunized patients and rare blood challenges. Transfus Med Rev. 2011;25:206–216. doi: 10.1016/j.tmrv.2011.01.002. [DOI] [PubMed] [Google Scholar]
- Chaudhuri A, Polyakova J, Zbrzezna V, Williams K, Gulati S, Pogo AO. Cloning of glycoprotein D cDNA, which encodes the major subunit of the Duffy blood group system and the receptor for the Plasmodium vivax malaria parasite. Proc Natl Acad Sci USA. 1993;90:10793–10797. doi: 10.1073/pnas.90.22.10793. [DOI] [PMC free article] [PubMed] [Google Scholar]
Associated Data
This section collects any data citations, data availability statements, or supplementary materials included in this article.