Abstract
Apoptosis is a tightly controlled process in mammalian cells. It is important for embryogenesis, tissue homoeostasis, and cancer treatment. Apoptosis not only induces cell death, but also leads to the release of signals that promote rapid proliferation of surrounding cells through the Phoenix Rising (PR) pathway. To quantitatively understand the kinetics of interactions of different molecules in this pathway, we developed a mathematical model to simulate the effects of various changes in the PR pathway on the secretion of prostaglandin E2 (PGE2), a key factor for promoting cell proliferation. These changes include activation of caspase 3 (C3), caspase 7 (C7), and nuclear factor κB (NFκB). In addition, we simulated the effects of cyclooxygenase-2 (COX2) inhibition and C3 knockout on the level of secreted PGE2. The model predictions on PGE2 in MEF and 4T1 cells at 48 hours after 10-Gray radiation were quantitatively consistent with the experimental data in the literature. Compared to C7, the model predicted that C3 activation was more critical for PGE2 production. The model also predicted that PGE2 production could be significantly reduced when COX2 expression was blocked via either NFκB inactivation or treatment of cells with exogenous COX2 inhibitors, which led to a decrease in the rate of conversion from arachidonic acid to prostaglandin H2 in the PR pathway. In conclusion, the mathematical model developed in this study yielded new insights into the process of tissue regrowth stimulated by signals from apoptotic cells. In future studies, the model can be used for experimental data analysis and assisting development of novel strategies/drugs for improving cancer treatment or normal tissue regeneration.
Author Summary
Apoptosis, or programmed cell death, is known to be important for embryogenesis, tissue homoeostasis, and cancer treatment. Furthermore, researchers have recently observed that apoptosis may promote wound healing and tissue regeneration, and accelerate undesired solid tumor regrowth after chemotherapy/radiation therapy. Mechanisms of apoptosis-induced tissue regrowth are related to a molecular network discovered recently in our lab. To quantitatively understand the kinetics of interactions of different molecules in this network, we developed a mathematical model and validated it by comparing the simulation results to experimental data reported in previous studies. To gain new insights into the process of tissue regrowth after inducing apoptosis, we used the model to simulate the effects of radiation on the production of a key growth stimulating factor, PGE2, in apoptotic cells. Additionally, we simulated how PGE2 production could be altered when cells were treated with different inhibitors. We expect that the new mathematical model can be used in future studies to facilitate design of better approaches to cancer treatment or normal tissue regeneration.
Introduction
Apoptosis, or programmed cell death, is an important and tightly controlled process in mammalian cells [1]. However, not all cells in the same population undergo apoptosis when exposed to identical death signals [2], [3]. This “fractional killing” phenomenon is problematic in cancer treatment, but may be beneficial for wound healing since it has been observed that surviving cells in damaged tissues repopulate at a more rapid pace [4], [5], [6]. While there could be multiple factors that contribute to the rapid regrowth, one potential mechanism is that apoptotic cells may release signals that can promote proliferation of surrounding cells through the “Phoenix Rising” (PR) pathway discovered recently in our lab [5], [6]. This pathway may play important roles in both regeneration of damaged normal tissues and recurrence of tumors after chemotherapy/radiation therapy.
Wound healing in normal tissues is a complicated process that is time-dependent and requires coordination of different cells. While it is known that inflammation is the initial response to tissue damage, the exact cellular and molecular events in wound healing remain unclear. It has been generally assumed that factors released from damaged tissues mobilize and recruit stem and progenitor cells to the damaged site, where they proliferate, differentiate, and eventually replace the damaged tissue [6], [7]. Our previous studies have shown that two of the key molecular players in the initial response are caspase 3 (C3) and caspase 7 (C7), which are two proteases activated during the execution phase of apoptosis [5], [6]. Mice lacking either of these caspases are deficient in skin wound healing and liver regeneration [6]. The activation of C3 and C7 triggers a cascade of molecular events that lead to upregulation of prostaglandin E2 (PGE2), a growth-promoting signal that stimulates stem and progenitor cell proliferation and thus tissue regeneration.
Tumor recurrence often happens after chemotherapy and radiation therapy due to incomplete killing of tumor cells [8], [9]. Our previous studies have shown that apoptotic cells in the tumor mass can release signals to stimulate proliferation of remaining cells [5], [6]. Here, C3 in apoptotic cells is again a key regulator for the upregulation of signals that promote tumor regrowth.
The PR pathway outlined in our previous studies involves a complicated network of molecular interactions [5], [6] (see also Figure 1 ). To understand the dynamics of these interactions, we developed a mathematical model that links the concentrations of activated C3, activated C7, and nuclear factor κB (NFκB) to the activity of PGE2 in the PR pathway. This type of “input-output” model, combined with experimental data, has been shown to be useful in understanding mechanisms of molecular events in cells [10]. Our model was built upon previous mathematical models for regulatory networks involved in apoptosis [1], [11] and arachidonic acid (AA) metabolism [12]. Our model was validated by comparing the predicted PGE2 concentrations in MEF and 4T1 cells at 48 hours after 10 Gray (Gy) radiation with the experimental data observed in previous studies [5], [6]. Using this model, we numerically simulated time-dependent changes in levels of key molecular players in the PR pathway after radiation therapy, and evaluated effects of C3 activation, C7 activation, C3 knockout, and cyclooxygenase-2 (COX2) inhibition on PGE2 production.
Figure 1. Schematic of the Phoenix Rising pathway.

Radiation induces apoptosis of tumor cells, which causes release of PGE2 that can lead to rapid proliferation of remaining tumor cells. Reprinted from Ref. [5], with permission of Nature Publishing Group.
Results/Discussion
The PR pathway shown in Figure 1 was modeled as a molecular network with seventeen key interactions. The model development was an iterative process, and involved various simplifications and assumptions (for details see the Materials and Methods section). The final outline of the model is shown in Figure 2 . To validate the model, we compared numerically simulated [PGE2] with experimental data of [PGE2] reported in our previous study for wild-type MEF and 4T1 cells with/without radiation (see Figure 5b in Ref. [5]). It should be noted that two units are used for concentrations reported in this paper: pg mL−1 and µM. The former is used for [PGE2] in order to directly compare it with experimental data in the literature; the latter is used for concentrations of all other molecules in the model. The conversion factor for [PGE2] is 3.525×10⁵ pg mL−1 per µM. The maximal difference between model predictions and experimental data of [PGE2] was 9% (see Table 1 ), which was smaller than the uncertainties in the experimental data.
Figure 2. Mathematical model of the Phoenix Rising pathway.
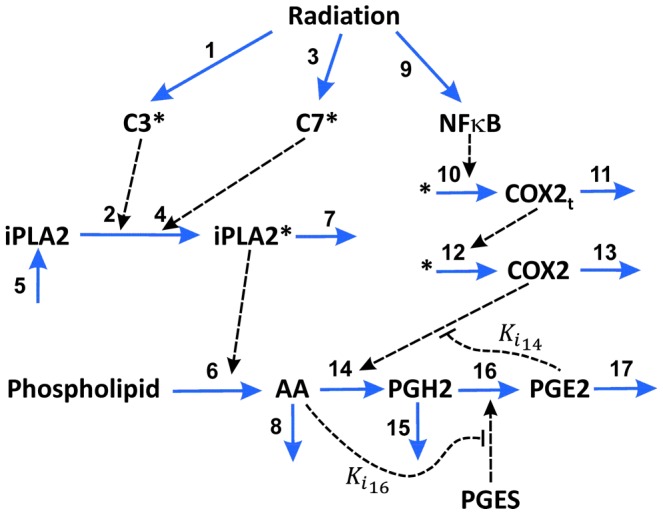
Seventeen molecular interactions in apoptotic cells were considered in the model. The input of the model was radiation-induced activation of C3, C7, and NFκB. Through the pathway, the activated molecules could result in secretion of PGE2 into the cell's microenvironment. The secreted PGE2 may promote proliferation of stem cells, progenitor cells, and tumor cells in surrounding regions. The mathematical model was used to simulate the dynamics of PGE2 synthesis and how inhibitions of different molecular players in the pathway affected PGE2 synthesis.
Figure 5. Dependence of simulated [PGE2] on [NFκB] in unirradiated 4T1 cells.
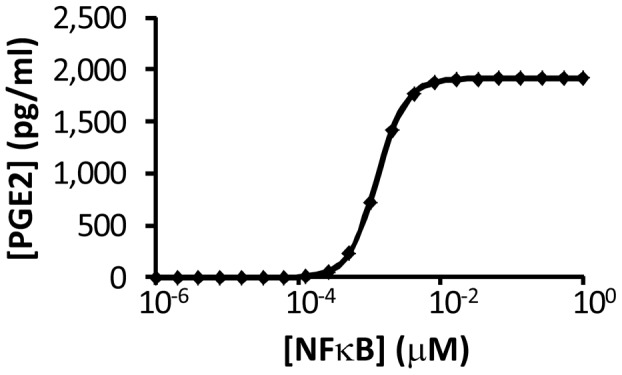
For each level of [NFκB], the reported [PGE2] was determined at 48 hours when its level had reached a steady state.
Table 1. Experimentally measured and numerically simulated [PGE2].a .
| C3 KO MEF (0) | C3 KO MEF (10) | MEF (0) | MEF (10) | 4T1 (0) | 4T1 (10) | |
| Experimentally measured [PGE2] (pg mL−1) | 335b | 525b | 398 | 1730 | 285b | 2100 |
| Numerically simulated [PGE2] (pg mL−1) | 333 | 525 | 388 | 1801 | 285 | 1910 |
All experimental data were obtained from the literature, i.e., Figure 5b in Ref. [5]. Experimental data and numerically simulated [PGE2] were compared for three types of tumor cells: C3 knockout (KO) MEF cells, wild type MEF cells, and wild type 4T1 cells without (0) or with (10) 10-Gy radiation.
The experimental data with the superscript were used to determine the values of [C3*]0, [C7*]0 and k3; and the data without the superscript were used to validate the model predictions.
Using the model and the baseline values of the model constants listed in Tables 2 and 3 , we examined the time-dependent changes in [PGE2] after 10-Gy radiation treatment. The numerical results shown in Figure 3 demonstrated that there was a time delay of ∼24 hours in PGE2 production, due to slow activations of C3 and C7. After the delay, [PGE2] in wild-type MEF and 4T1 cells as well as C7 knockout (KO) MEF cells experienced a short, rapid increase phase, followed by a slow increase phase. In contrast, the simulated production of PGE2 in C3 KO MEF cells was slow and increased linearly with time between 24 and 48 hours. To investigate the dependence of [PGE2] on activation rates of C3 and C7, we simulated [PGE2] in MEF cells at 48 hours after radiation for a set of values of k1 and k3. The numerical results shown in Figure 4 demonstrated that [PGE2] was insensitive to changes in k3 when k1 was maintained at its baseline, but increased significantly with increasing k1 when k3 was maintained at its baseline, suggesting that PGE2 production was regulated mainly by the amount of activated C3 (C3*) but not activated C7 (C7*). To simulate effects of C3* or C7* deficiency on PGE2 production in irradiated cells, we assumed [C3*] (or [C7*]) be zero in C3 (or C7) knockout cells. The numerical results shown in Figure 4 demonstrated that in C3 (or C7) knockout cells, activation of C7 (or C3) was important for increasing the production of PGE2. Taken together, our model predicted that activation of C3 was critical for PGE2 production whereas activation of C7 was important only in C3 knockout cells. This model prediction was consistent with experimental observations in vivo reported in our previous study [6], which showed that C3 deficiency could make MEF cells inefficient in promoting stem and progenitor cell proliferation. When both C3 and C7 were knocked out, our mathematical model predicted no PGE2 production in apoptotic cells. This prediction was also consistent with an experimental observation that lethally irradiated MEF cells with double knockout of C3 and C7 were less capable to promote stem or progenitor cell proliferation than those with only C3 knocked out [6].
Table 2. Simulation condition-independent rate and equilibrium constants.
| k | k- | K | Ki | |
| 2 | 144 (min−1)a | - | 11 (µM)a | - |
| 4 | 26 (min−1)a | - | 12 (µM)a | - |
| 5 | 0.06 (min−1)b | 0.09 (µM min−1)a | - | - |
| 7 | 0.06 (min−1)b | - | - | - |
| 8 | 0.06 (min−1)b | - | - | - |
| 10 | 7.68×10⁻⁴ (µM min−1)a | - | 5.2×10⁻³ (µM)a | - |
| 11 | 0.6 (min−1)b | - | - | - |
| 12 | 4.5 (min−1)a | - | - | - |
| 13 | 0.06 (min−1)b | - | - | - |
| 14 | 1000 (min−1)c | - | 50 (µM)c | 30 (µM)c |
| 15 | 0.06 (min−1)b | - | - | - |
| 16 | 3000 (min−1)c | - | 160 (µM)c | 0.3 (µM)c |
| 17 | 0.06 (min−1)b | - | - | - |
Values for these rate and equilibrium constants were calculated based on the information in the literature. Details of the calculation are described in the Materials and Methods section.
Values for these rate and equilibrium constants were assumed in this study.
Values for these rate and equilibrium constants were obtained from the literature [12].
Table 3. Simulation condition-dependent model constants.a .
| C3 KO MEF (0) | C3 KO MEF (10) | MEF (0) | MEF (10) | 4T1 (0) | 4T1 (10) | |
| [NFκB]0 (µM) | 0.1 | 0.1 | 0.1 | 0.1 | 0.1 | 0.1 |
| [C3*]0 (nM) | 0 | 0 | 0. 2 | 0. 2 | 0. 2 | 0. 2 |
| [C7*]0 (nM) | 6.0 | 6.0 | 6.0 | 6.0 | 3.8 | 3.8 |
| k1 (µM min−1) | 0 | 0 | 0 | 2.8×10⁻⁵ | 0 | 6.8×10⁻⁵ |
| k3 (µM min−1) | 0 | 3.24×10⁻⁶ | 0 | 3.24×10⁻⁶ | 0 | 3.24×10⁻⁶ |
| k9 (µM min−1) | 0 | 3.47×10⁻⁵ | 0 | 3.47×10⁻⁵ | 0 | 3.47×10⁻⁵ |
Details of the determination of these constants are described in the Materials and Methods section. The subscript “0” indicates steady state for unirradiated cells (0 Gy) or initial concentrations for irradiated cells (10 Gy). Values for these constants were determined for three types of tumor cells: C3 knockout (KO) MEF cells, wild type MEF cells, and wild type 4T1 cells without (0) or with (10) 10-Gy radiation.
Figure 3. Model simulation of time dependent changes in [PGE2] after 10-Gy radiation of different tumor cells.
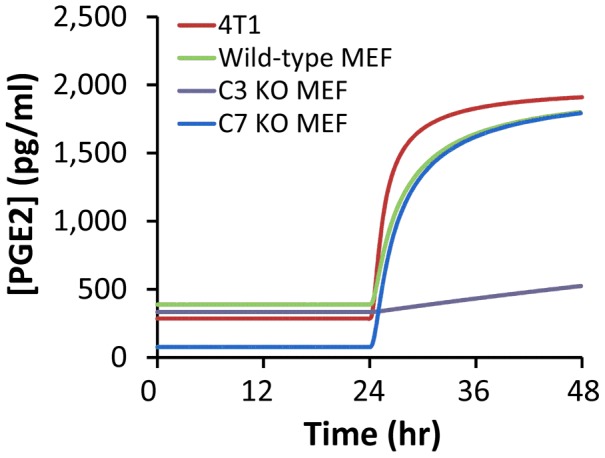
The concentration profiles for wild type MEF and 4T1 cells were similar, but the production of PGE2 was significantly reduced in C3 knockout (KO) MEF cells. For C7 KO MEF cells, [PGE2] was low without radiation treatment. After 24 hours post radiation, [PGE2] started to increase, and quickly approached to the level in irradiated, wild type MEF cells.
Figure 4. Dependence of simulated [PGE2] on k1 and k3 in MEF cells.
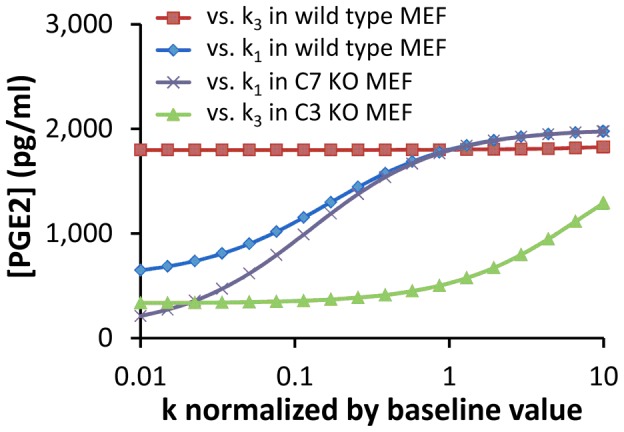
The value of ki (i = 1, 3) was normalized to its baseline shown in Table 3 . [PGE2] was calculated at 48 hours after radiation. Four scenarios were simulated in the study: (i) dependence of [PGE2] on k1 when k3 was set at its baseline, (ii) dependence of [PGE2] on k3 when k1 was set at its baseline, (iii) dependence of [PGE2] on k1 in C7 KO cells, and (iv) dependence of [PGE2] on k3 in C3 knockout (KO) cells.
Nuclear factor κB (NFκB) is critical for the regulation of PGE2 production through the control of COX2 expression (see Figure 2 ) [13]. To simulate effects of NFκB on PGE2 production, we fixed [NFκB] at different levels, and calculated the steady state [PGE2] in unirradiated 4T1 cells. The numerical results are shown in Figure 5 ; and similar results were also observed for unirradiated MEF cells (data not shown). These profiles demonstrated that the dependence of [PGE2] on [NFκB] variation was biphasic, which was controlled by the rate of COX2 transcription (see the equation for v10). When [NFκB] was <10−4 µM, the simulated [PGE2] was close to zero. When [NFκB] was increased from 10−2 to 1 µM, a two-order-of-magnitude change, the increase in simulated [PGE2] was minimal. This was because the increase in simulated concentration of COX2 mRNA (COX2t) was only 21%, which was too small to cause a significant increase in the simulated [PGE2]. In studies reported in the literature, [NFκB] in untreated cells is often higher than 0.1 µM [14], suggesting that the PR pathway was insensitive to radiation- or other tissue damage-induced increase in [NFκB].
Dynamic changes in numerically simulated concentrations of calcium independent phospholipase A2 (iPLA2), its active form (iPLA2*), arachidonic acid (AA), and prostaglandin H2 (PGH2) in 4T1 and MEF cells are shown in Figures 6 and 7 . Differences in the corresponding profiles between MEF and 4T1 cells were small. The overall observation was that the simulated concentration of iPLA2* in cells treated with 10-Gy radiation increased with time, which led to an increase in AA production from phospholipids. The numerically simulated [AA] profiles shown in Figures 6 and 7 were quantitatively similar to those observed in previous experimental studies (see Figure 5a in both Ref. [5] and Ref. [6]).
Figure 6. Model simulation of time-dependent changes in [iPLA2], [iPLA2*], [AA], and [PGH2] after 10-Gy radiation.
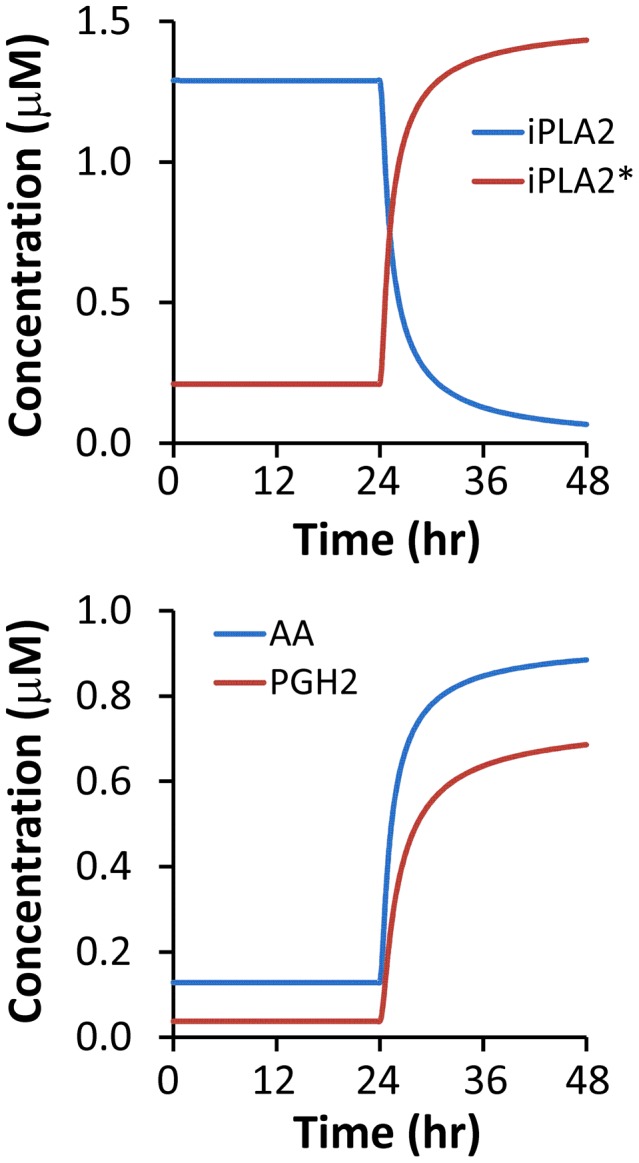
The simulation was performed for wild type 4T1 cells.
Figure 7. Model simulation of time-dependent changes in [iPLA2], [iPLA2*], [AA], and [PGH2] after 10-Gy radiation.
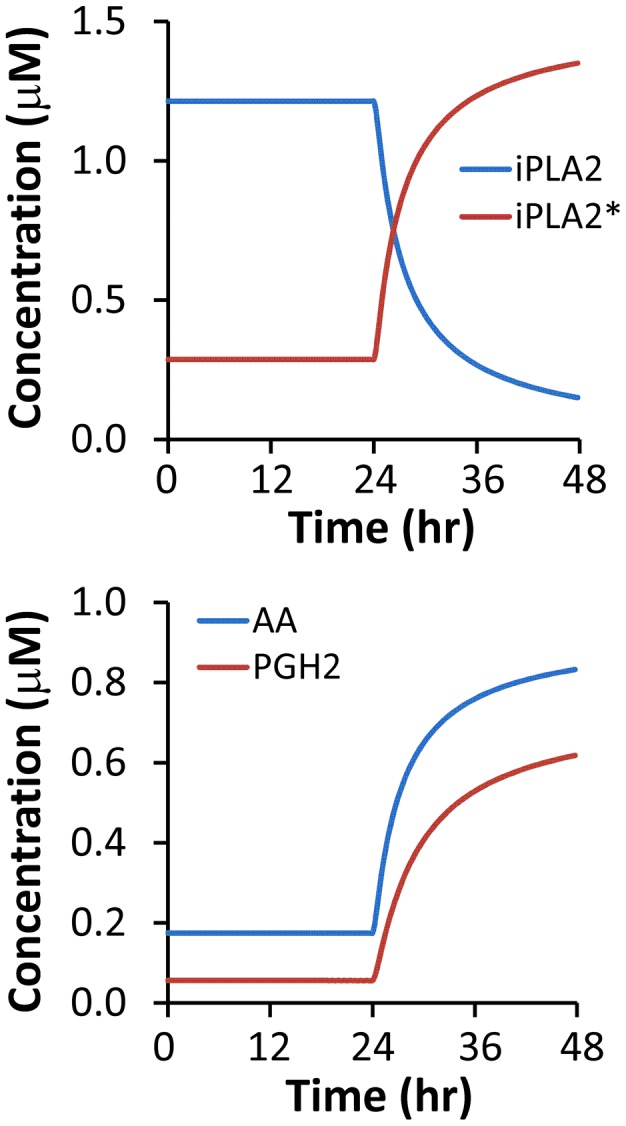
The simulation was performed for wild type MEF cells.
To simulate effects of C3 knockout on the PR pathway, we let [C3*] be zero. The simulated concentrations of iPLA2, iPLA2*, AA, and PGH2 in C3 knockout MEF cells are shown in Figure 8 ; and the dynamic change in simulated [PGE2] is shown in Figure 3 . These results demonstrated that C3 gene knockout reduced the amount of activated iPLA2 by a factor of 3.5, thereby slowing the production of AA, which in turn reduced the levels of PGH2 and PGE2. Although the simulated concentrations of PGH2 and PGE2 would continue to increase with time beyond the 48-hour period, the increase may not happen in experimental studies. This is because our mathematical model did not consider cell proliferation nor the inactivation of C7* and NFκB that may happen in cells over time. More importantly, the cells may have already died/lysed after 48 hours.
Figure 8. Model simulation of time-dependent changes in [iPLA2], [iPLA2*], [AA], and [PGH2] after 10-Gy radiation.
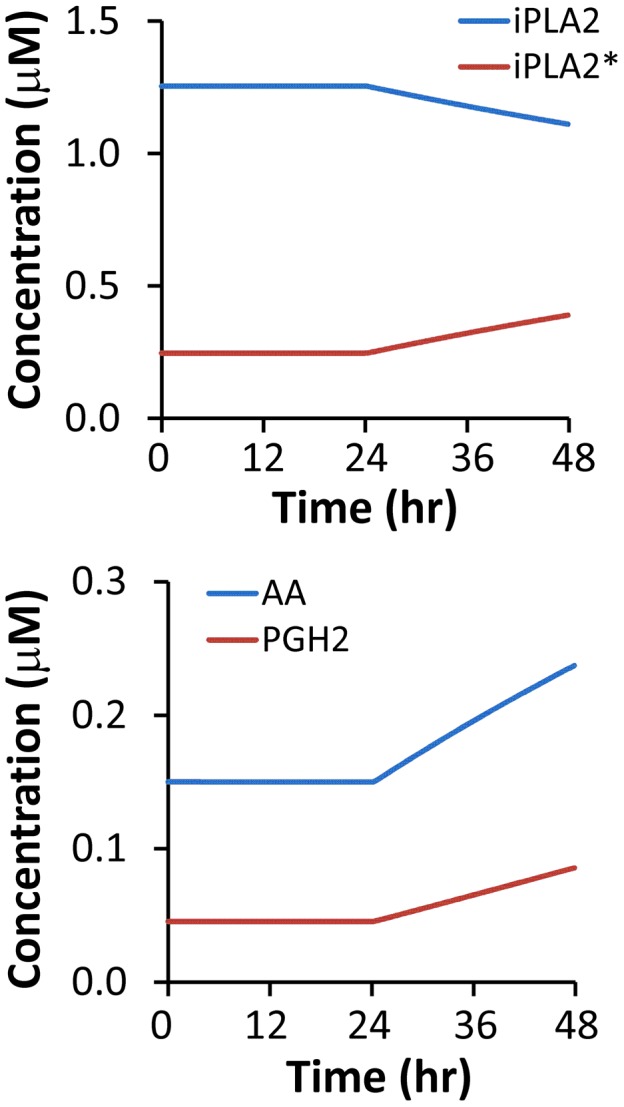
The simulation was performed for C3 knockout MEF cells.
Effects of silencing iPLA2 expression on PGE2 production was simulated by reducing the rate of iPLA2 synthesis (k−5) in wild type MEF cells. The numerical results are shown in Figure 9 , which demonstrated that the simulated [PGE2] at 48 hours post radiation decreased approximately linearly with decreasing k−5. This result was qualitatively consistent with our previous experimental observation where iPLA2 knockdown with shRNA reduced [PGE2] in MEF cells (Figure 5b in Ref. [6]).
Figure 9. Effects of silencing iPLA2 expression on model simulated [PGE2] in wild type MEF cells at 48 hours post radiation.

Experimentally, silencing gene expression can be achieved through treatment of cells with small interfering RNA molecules. In this study, silencing iPLA2 expression was mathematically modeled through reducing k−5 (unit: µM min−1), the rate of iPLA2 synthesis.
Previous studies have shown that exogenous COX2 inhibitors can enhance efficacy of radiation therapy of cancer [15], [16], [17]. The mechanism of enhancement is likely to be related to the reduction in the release of growth-promoting signals, such as PGE2, from apoptotic cells. To simulate this mechanism, we introduced a parameter α to model competitive inhibition of COX2 (see the Materials and Methods section), and numerically simulated the dependence of [PGE2] on α at 48 hours post radiation. The simulation results shown in Figure 10 indicated that [PGE2] decreased rapidly with increasing the value of α, suggesting that inhibition of COX2 could indeed reduce the production of growth-promoting signals in apoptotic cells.
Figure 10. Effects of COX2 inhibition on model simulated [PGE2] in wild type MEF cells at 48 hours post radiation.
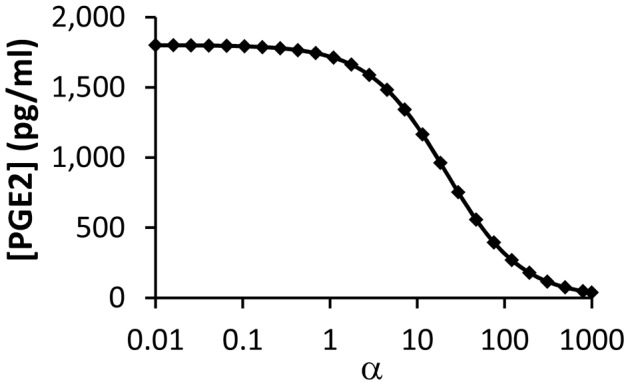
Experimentally, COX2 inhibition can be achieved through treatment of cells with exogenous competitive inhibitors. In this study, the competitive inhibition was modeled through introducing a parameter, α, which was the ratio of inhibitor concentration versus equilibrium constant of binding between COX2 and its inhibitor. It can be observed that [PGE2] decreased rapidly with increasing the value of α.
We also examined the two negative feedback mechanisms (Ki14 and Ki16) shown in Figure 2 and their roles played in the regulation of PGE2 production in silico. We observed that removal of both negative feedback mechanisms (i.e., setting both 1/Ki14 and 1/Ki16 to zero) led to <2% increase in [PGE2], suggesting that these inhibitory mechanisms were weak and insignificant in the regulation of tissue regeneration after radiation treatment.
Finally, we performed a sensitivity analysis of model predictions. It was observed that [PGE2] was sensitive to only four rate constants: k−5, k6, k7, and k17, among all 25 rate and equilibrium constants (see Figure 11 ). Approximately, [PGE2] was proportional to changes in k−5 and k6, and reversely proportional to changes in k7 and k17. In the mathematical model, k17 determined the rate of PGE2 degradation, k6 and k7 determined the rates of AA production and degradation, respectively, and k−5 affected AA production indirectly through regulation of iPLA2 synthesis. Therefore, the analysis suggested that the simulated concentration of PGE2 was sensitive to its rate of degradation and the intracellular concentration of AA.
Figure 11. Sensitivity analysis of model simulated [PGE2] in wild type MEF cells at 48 hours post radiation.
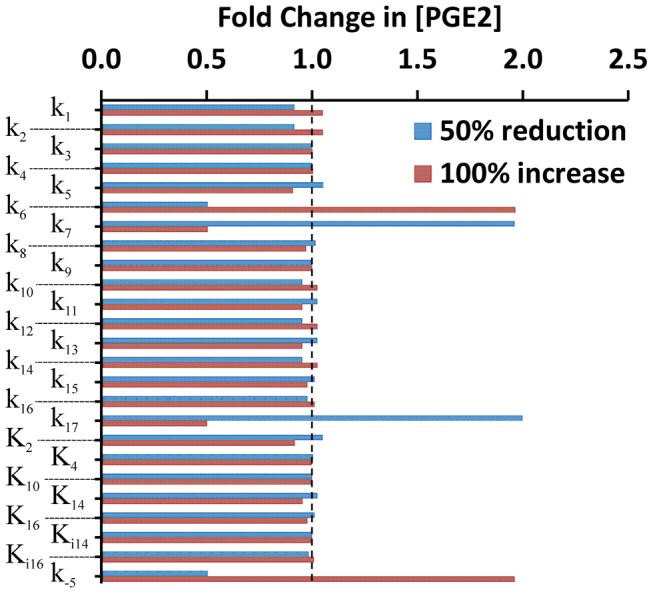
The value of each constant was either decreased or increased by a factor of two, relative to its baseline level shown in Tables 2 and 3 . Effects of the variation in model constants on [PGE2], in terms of fold change in [PGE2], were calculated, relative to the baseline level of [PGE2]. It can be observed that [PGE2] was sensitive to variations in four rate constants: k−5, k6, k7, and k17. The dashed line indicates the level where the fold change was equal to unity, i.e., no change in [PGE2].
In summary, the mathematical model of the PR pathway yielded new insights into the process of growth-promoting signal production in apoptotic cells. While the model is limited by uncertainty in some parameter values and is only as good as the assumptions that were made, it provides useful information on the PR pathway. The model can be used to integrate experimental data obtained from different studies, adjust for cell-to-cell variability observed in different experiments, and determine sensitivity of the PR pathway to individual molecular interactions. The model can be further improved to serve as a tool for in silico experiments in future studies that may generate experimentally testable hypotheses, and facilitate development of novel strategies for improving cancer treatment and normal tissue regeneration.
Materials and Methods
A. Experimental determination of [C3*]
To determine [C3*], we analyzed digital images of Western blot gels reported in our previous study [5]. For each C3 or C3* band in the images, we inversed its intensity and measured the total intensity over the entire area covered by the band, using the Gel Analysis function in ImageJ software. After background intensity subtraction, the total intensity data was used as a measure of the relative protein concentration. To determine the absolute concentration of C3 and C3*, we assumed that the concentration of C3 in unirradiated cells was 200 nM [11], and then used its band intensity to normalize those of C3* under different experimental conditions. [C3*] was determined as the normalized image intensity of C3* multiplied by 200 nM.
B. Mathematical model
Model development
The PR pathway begins when a damaged cell activates its execution caspases (e.g., C3 and C7) to undergo apoptosis. The caspases then proceed to cleave/activate iPLA2, which binds to the membrane and catalyzes the hydrolysis of phospholipids to produce AA. AA is then converted to PGH2, catalyzed by COX2, which in turn is used to produce PGE2 catalyzed by prostaglandin E synthases (PGES) (see Figure 1 ) [5], [6], [18]. Finally, PGE2 is secreted into the environment of apoptotic cells to signal for cell replacements in damaged tissues.
To model the PR Pathway, we considered cell damage through treatment (e.g., radiation), which led to activation of C3, C7, and NFκB [5], [6], [19]. The activation processes have been modeled extensively in previous studies [1], [11], [20], [21], [22]. Thus, we used the activated forms of these molecules, i.e., C3*, C7*, and NFκB, as inputs for our model. The activated C3 and C7 would then trigger a cascade of reactions, which involved AA, COX2, iPLA2, PGE2, and PGH2 in the PR pathway shown in Figure 1 . Meanwhile, the activated NFκB is critical for COX2 expression [13], and the latter is required for catalyzing PGH2 production from AA. The proposed network model also included two inhibitory reactions based on a mathematical model of AA metabolism, developed by Yang et al. [12], where PGES and COX2 could be inhibited by AA and PGE2, respectively. To simplify the model of the PR pathway, we did not consider interactions between lysyl oxidases (LOXs) and AA, which may lead to a reduction in the production of PGE2 [12]. Although the amount of reduction might be small, further studies are needed to elucidate roles of LOXs played in the PR pathway.
Based on all these considerations, we constructed a simple network model shown in Figure 2 , which consisted of seventeen molecular interactions. In developing the mathematical model to recapitulate key experimental observations [5], [6], we made the following assumptions. First, chemical species shown in Figure 2 behaved independently from other intracellular molecules that were not included in the model. Second, enzymatic reactions were governed by the Michaelis-Menten equation, except for the hydrolysis of phospholipids (see the description below), and they could be blocked by competitive inhibitors [12]. Third, PGES concentration was assumed to be time-independent within the simulation period (i.e., 48 hours) [12]. Fourth, NFκB is a transcription factor involved in the regulation of COX2 expression. The rate of transcription, i.e., COX2 mRNA (COX2t) synthesis, was assumed to be governed by the Hill equation [21]. The rate of translation from COX2t to COX2 was assumed to be proportional to the concentration of COX2t. Fifth, iPLA2 is a housekeeping gene and constitutively expressed in cells under normal conditions [23]. Thus, its rate of synthesis was assumed to be constant. Sixth, the degradation of all chemical species considered in this model was assumed to be a first order reaction. Finally, the activated C3 and C7 were observed to be minimal but NFκB was clearly visible in Western blot analysis at 24 hours post radiation [5]. Therefore, the rate of NFκB production was assumed to be constant [24], and the rates of C3 and C7 activation were assumed to be proportional to the Heaviside step function of time, H(t - 24), which is equal to 0 if t<24 hours and unity if t≥24 hours.
Phospholipid hydrolysis catalyzed by iPLA2* has been modeled as a three-step reaction: (i) iPLA2* adsorption to plasma membrane (MB), (ii) binding of adsorbed enzyme (iPLA2*-MB) to phospholipids (PS), and (iii) conversion of PS to reaction products, including AA [25], [26]. The final step in the reaction is very slow compared to the first one, indicating that the ratio of concentrations between iPLA2* and iPLA2*-MB is approximately equal to the equilibrium dissociation constant times the concentration of available adsorption sites on the membrane. Furthermore, it is known that the concentration of iPLA2*-MB is approximately equal to that of iPLA2*-MB-PS [26], and the rate of AA production from PS is proportional to the concentration of iPLA2*-MB-PS. Assuming the amount of phospholipid hydrolyzed during the 48-hour period to be negligible compared to its total amount in a cell, we found that the rate of AA production was proportional to the total concentration of iPLA2* in the cell (see the equation for v6). PGH2 production from AA is catalyzed by COX2, which can be competitively inhibited by either endogenous PGE2 or exogenous drugs [15], [16], [17]. To simulate effects of drug treatment on PGE2 production, a parameter α was included in the denominator of the equation for v14, which was proportional to intracellular concentration of the drug.
Based on the discussion above, the rates of reactions (vi, i = 1, 2, 3, …, and 17) shown in Figure 2 were modeled as,
 |
 |
Mass conservation for the chemical species considered in the model required that
In these equations, all concentrations are defined as the number of moles per unit cell volume (Vc) except for [AA] and [PGE2] because a fraction of these molecules produced in cells are secreted into extracellular medium, and it is the concentration in the medium that was measured in previous experiments. To directly compare model predictions with previous experimental data, [AA] and [PGE2] were therefore defined as the number of moles per unit volume of cells plus the medium (Vt), which were close to the concentrations in the medium since the volume ratio (Vt/Vc), denoted by β, is significantly larger than unity, and there is no substantial difference in the concentrations between intracellular and extracellular spaces [27]. As a result, v6 and v16 in the mass balance equations for AA and PGE2 were corrected by a factor of β−1.
Initial conditions and numerical simulations
The initial conditions for all concentrations in irradiated cells were assumed to be equal to the steady state concentrations of the same chemical species in unirradiated cells. To determine the latter, the nonlinear differential equations described above were solved numerically, using the Dormand-Prince method (ODE45) in MATLAB, with all initial concentrations, except for [C3*], [C7*], and [NFκB], assumed to be zero. [C3*], [C7*], and [NFκB] in unirradiated cells were assumed to be time-independent, and the determination of their values, which were cell type-dependent, is discussed below.
C. Determination of model constants
The baseline values of some model constants listed in Tables 2 and 3 were assumed in this study. Specifically, the cell volume was assumed to be 1 pL, which means that 600 molecules per cell is 1 nM [28]. The degradation rates were assumed to be 0.6 min−1 for all mRNAs and 0.06 min−1 for all proteins [11], [21]. The baseline value of α is zero, i.e., there was no exogenous COX2 inhibitor unless indicated otherwise. k6 was assumed to be 6×10³ min−1. [PGES] was assumed to be 0.5 µM [12]. The baseline values of other model constants were either obtained directly from the literature or estimated in this study based on model assumptions, experimental data reported in the literature, or values of similar constants used in previous mathematical models.
β. This constant depends on experimental conditions. For experiments reported in Ref [5], 2×10⁵ cells were cultured in 1 mL medium. Thus, the total volume of cells was 2×10⁵ pL; and β was approximately equal to 5000.
[C3*]0 and k1
[C3*] in unirradiated cells (i.e., [C3*]0) was too low to be detected accurately in the analysis of Western blot gel images described above. On the other hand, [C3*]0 was not necessarily equal to zero. Therefore, we adjusted [C3*]0 in simulations for unirradiated, wild type cells until the model predicted values of [PGE2] were consistent with the experimental data shown in Table 1 . This procedure led us to choose [C3*]0 to be 0.2 nM or 0.1% of [C3], which was approximately 200 nM [11]. In C3 knockout cells, [C3*]0 was assumed to be zero. To determine the value of k1, we estimated concentrations of C3 and C3* in irradiated cells through the analysis of Western blot gel images shown in the supplemental Figures 6a and 7a in Ref. [5] (see the procedure described above). Activation of C3 was observed only after 24 hours. Thus, k1 was calculated as the difference between 0.2 nM and [C3*] data on Day 2, divided by 1440 min. The final results of k1 for irradiated MEF and 4T1 cells are shown in Table 3 . k1 was assumed to be zero for C3 knockout cells and unirradiated cells.
[NFκB]0 and k9
[NFκB] in unirradiated cells (i.e., [NFκB]0) was assumed to be 0.1 µM in all types of cells in this study [14]. After 10-Gy radiation, the level of [NFκB] was assumed to increase linearly with time. The level of increase was observed to be one to four folds in 48 hours [24]. We chose the increase to be one fold for estimating the rate of [NFκB] increase since we observed in a preliminary simulation that the model output, i.e., [PGE2], varied insignificantly when the increase in [NFκB] was changed from one to four folds. As a result, k9 for all irradiated cells was calculated to be 3.47×10⁻⁵ µM min−1 (see Table 3 ).
k5, k−5, and steady state concentration of iPLA2
Hydrolysis of phospholipids can be catalyzed by a superfamily of enzymes, called phospholipase A2 (PLA2) [29]. Among them, Ca2+ independent PLA2 (i.e., iPLA2) is an important housekeeping gene that is highly expressed in cells under normal conditions [23]. The level of its expression is on the same order of magnitude as that of the total PLA2 in cells, which has been assumed to be 1.5 µM at steady state [12]. Therefore, we assumed the steady state concentration of iPLA2, [iPLA2]ss, to be 1.5 µM in unirradiated cells. Although iPLA2 can be activated through cleavage to become iPLA2*, the rate of cleavage in unirradiated cells is likely to be negligible, compared to its degradation with the rate constant k5. Thus, we assumed that in these cells at steady state, k−5 – k5[iPLA2]ss≈0. Since the rate constant for degradation of all proteins had been assumed to be 0.06 min−1 in this study, k−5 = 0.09 µM min−1.
k2, K2, k4, and K4
iPLA2 can be activated when it is cleaved by caspase 3 at Asp513 or Asp733 [30]. We assumed that iPLA2 activation by caspase 7 was also caused by its cleavage at an Asp site. For these enzymatic reactions, kcat/KM has been determined to be 200,000 M−1 s−1 for caspase 3 and 33,000 M−1 s−1 for caspase 7 [31]. Talanian et al. have also measured kcat and KM for both caspase 3 and caspase 7 catalyzed reactions with various substrate sequences [32]. We chose the values of kcat and KM, measured by Talanian et al., based on the criterion that the kcat/KM ratio must be consistent with the data reported in Ref. [31]. This requirement led to the choice of substrate sequence Asp-Glu-Val-Asp reported in Ref. [32], for which k2 and K2 were 144 min−1 and 11 µM, respectively, and k4 and K4 were 26 min−1 and 12 µM, respectively.
k10, K10, n, and k12
Following the assumptions made by Terry et al. [21], we assumed that expressions of different genes activated by NFκB had the same transcription and translation rates. Thus, the baseline values of k10, K10, and k12 were assumed to be equal to the maximal rate of NFκB induced transcription, NFκB half-maximal concentration, and rate of translation, respectively, reported in Ref. [21] (see Table 2 ). The Hill coefficient n in v10 was assumed to be 2 [21].
[C7*]0 in unirradiated cells
[C7*]0 is the steady state concentration of C7* in unirradiated cells. There are no experimental data of [C7*]0. Thus, it was determined by fitting simulated [PGE2] to experimental data reported in our previous study for unirradiated C3 knockout (KO) MEF and wild-type 4T1 cells (see Figure 5b in Ref [5]). In the procedure, values of all other constants were fixed at the baseline levels shown in Tables 2 and 3 . For unirradiated cells, k3 = 0. Thus, [C7*] was time-independent, which was equal to [C7*]0. In predicting [PGE2] in unirradiated cells, k1 = k9 = 0, [C3*]0 was 0.2 nM for wild-type cells, and zero for C3 knockout cells, [NFκB] was 0.1 µM for both types of cells (see Table 3 ), and all other concentrations at t = 0 were zero. For C3 knockout MEF cells, [PGE2] at 48 hours was experimentally observed to be 335 pg mL−1 in our previous study [5] (see Table 1 ); and the best fit of the model prediction to this data required [C7*]0 to be 6.0 nM. For wild-type MEF cells, [C7*]0 was assumed to be 6.0 nM as well. For 4T1 cells, [PGE2] at 48 hours measured experimentally in our previous study [5] was 285 pg mL−1 (see Table 1 ), which was lower than that in MEF cells. Thus, [C7*]0 was reduced to 3.8 nM for the model prediction to fit the experimental data.
k3 in irradiated cells
To determine k3, we first calculated the steady state concentrations in unirradiated cells, and then used them as the initial conditions for the differential equations described above. These equations were solved numerically with different values of k3 to obtain [PGE2] at 48 hours post radiation. For C3 knockout MEF cells treated with 10-Gy radiation, the experimental data of [PGE2] was observed to be 525 pg mL−1 in our previous study [5] (see Table 1 ), and the best fit of the model prediction to this data required k3 to be 3.24×10⁻⁶ µM min−1. For wild type MEF and 4T1 cells, k3 could not be accurately determined through fitting the model prediction to the experimental data of [PGE2] since an increase in k3 by three orders of magnitude led to only minimal increase (<5%) in [PGE2]. Thus, k3 for all irradiated cells were assumed to be 3.24×10⁻⁶ µM min−1.
Funding Statement
The work is supported partly by a grant from the National Institutes of Health (RO1 CA155270). The funders had no role in study design, data collection and analysis, decision to publish, or preparation of the manuscript.
References
- 1. Spencer SL, Sorger PK (2011) Measuring and modeling apoptosis in single cells. Cell 144: 926–939. [DOI] [PMC free article] [PubMed] [Google Scholar]
- 2. Meyn RE, Stephens LC, Ang KK, Hunter NR, Brock WA, et al. (1993) Heterogeneity in the development of apoptosis in irradiated murine tumours of different histologies. Int J Radiat Biol 64: 583–591. [DOI] [PubMed] [Google Scholar]
- 3. Spencer SL, Gaudet S, Albeck JG, Burke JM, Sorger PK (2009) Non-genetic origins of cell-to-cell variability in TRAIL-induced apoptosis. Nature 459: 428–432. [DOI] [PMC free article] [PubMed] [Google Scholar]
- 4. Tubiana M (1988) Repopulation in human tumors. A biological background for fractionation in radiotherapy. Acta Oncol 27: 83–88. [DOI] [PubMed] [Google Scholar]
- 5. Huang Q, Li F, Liu X, Li W, Shi W, et al. (2011) Caspase 3-mediated stimulation of tumor cell repopulation during cancer radiotherapy. Nat Med 17: 860–866. [DOI] [PMC free article] [PubMed] [Google Scholar]
- 6. Li F, Huang Q, Chen J, Peng Y, Roop DR, et al. (2010) Apoptotic cells activate the “phoenix rising” pathway to promote wound healing and tissue regeneration. Sci Signal 3: ra13. [DOI] [PMC free article] [PubMed] [Google Scholar]
- 7. Crosby LM, Waters CM (2010) Epithelial repair mechanisms in the lung. Am J Physiol Lung Cell Mol Physiol 298: L715–731. [DOI] [PMC free article] [PubMed] [Google Scholar]
- 8. Fuks Z, Leibel SA, Wallner KE, Begg CB, Fair WR, et al. (1991) The effect of local control on metastatic dissemination in carcinoma of the prostate: long-term results in patients treated with 125I implantation. Int J Radiat Oncol Biol Phys 21: 537–547. [DOI] [PubMed] [Google Scholar]
- 9. Clarke M, Collins R, Darby S, Davies C, Elphinstone P, et al. (2005) Effects of radiotherapy and of differences in the extent of surgery for early breast cancer on local recurrence and 15-year survival: an overview of the randomised trials. Lancet 366: 2087–2106. [DOI] [PubMed] [Google Scholar]
- 10. LeDuc PR, Messner WC, Wikswo JP (2011) How do control-based approaches enter into biology? Annu Rev Biomed Eng 13: 369–396. [DOI] [PubMed] [Google Scholar]
- 11. Legewie S, Bluthgen N, Herzel H (2006) Mathematical modeling identifies inhibitors of apoptosis as mediators of positive feedback and bistability. PLoS Comput Biol 2: e120. [DOI] [PMC free article] [PubMed] [Google Scholar]
- 12. Yang K, Ma W, Liang H, Ouyang Q, Tang C, et al. (2007) Dynamic simulations on the arachidonic acid metabolic network. PLoS Comput Biol 3: e55. [DOI] [PMC free article] [PubMed] [Google Scholar]
- 13. Lee KM, Kang BS, Lee HL, Son SJ, Hwang SH, et al. (2004) Spinal NF-kB activation induces COX-2 upregulation and contributes to inflammatory pain hypersensitivity. Eur J Neurosci 19: 3375–3381. [DOI] [PubMed] [Google Scholar]
- 14. Ihekwaba A, Broomhead D, Grimley R, Benson N, Kell D (2004) Sensitivity analysis of parameters controlling oscillatory signaling in the NF-kB pathway: the roles of IKK and IkBa. Systems Biology 1: 93–103. [DOI] [PubMed] [Google Scholar]
- 15. Petersen C, Petersen S, Milas L, Lang FF, Tofilon PJ (2000) Enhancement of intrinsic tumor cell radiosensitivity induced by a selective cyclooxygenase-2 inhibitor. Clin Cancer Res 6: 2513–2520. [PubMed] [Google Scholar]
- 16. Kishi K, Petersen S, Petersen C, Hunter N, Mason K, et al. (2000) Preferential enhancement of tumor radioresponse by a cyclooxygenase-2 inhibitor. Cancer Res 60: 1326–1331. [PubMed] [Google Scholar]
- 17. Kang KB, Wang TT, Woon CT, Cheah ES, Moore XL, et al. (2007) Enhancement of glioblastoma radioresponse by a selective COX-2 inhibitor celecoxib: inhibition of tumor angiogenesis with extensive tumor necrosis. Int J Radiat Oncol Biol Phys 67: 888–896. [DOI] [PubMed] [Google Scholar]
- 18. Morita I (2002) Distinct functions of COX-1and COX-2. Prostaglandins & other Lipid Mediators 68: 165–175. [DOI] [PubMed] [Google Scholar]
- 19. Vile GF, Tanew-Ilitschew A, Tyrrell RM (1995) Activation of NF-kappa B in human skin fibroblasts by the oxidative stress generated by UVA radiation. Photochem Photobiol 62: 463–468. [DOI] [PubMed] [Google Scholar]
- 20. Stucki JW, Simon HU (2005) Mathematical modeling of the regulation of caspase-3 activation and degradation. J Theor Biol 234: 123–131. [DOI] [PubMed] [Google Scholar]
- 21. Terry A, Chaplain M (2011) Spatio-temporal modeling of the NF-kB intracellular signaling pathway: The roles of diffusion, active transport, and cell geometry. Journal of Theoretical Biology 273: 15–31. [DOI] [PubMed] [Google Scholar]
- 22. Schlatter R, Schmich K, Lutz A, Trefzger J, Sawodny O, et al. (2011) Modeling the TNFalpha-induced apoptosis pathway in hepatocytes. PLoS One 6: e18646. [DOI] [PMC free article] [PubMed] [Google Scholar]
- 23. Ong WY, Farooqui T, Farooqui AA (2010) Involvement of cytosolic phospholipase A(2), calcium independent phospholipase A(2) and plasmalogen selective phospholipase A(2) in neurodegenerative and neuropsychiatric conditions. Curr Med Chem 17: 2746–2763. [DOI] [PubMed] [Google Scholar]
- 24. Kim BY, Kim KA, Kwon O, Kim SO, Kim MS, et al. (2005) NF-kappaB inhibition radiosensitizes Ki-Ras-transformed cells to ionizing radiation. Carcinogenesis 26: 1395–1403. [DOI] [PubMed] [Google Scholar]
- 25. Deems RA, Eaton BR, Dennis EA (1975) Kinetic analysis of phospholipase A2 activity toward mixed micelles and its implications for the study of lipolytic enzymes. J Biol Chem 250: 9013–9020. [PubMed] [Google Scholar]
- 26. Cherney DP, Myers GA, Horton RA, Harris JM (2006) Optically trapping confocal Raman microscopy of individual lipid vesicles: kinetics of phospholipase A(2)-catalyzed hydrolysis of phospholipids in the membrane bilayer. Anal Chem 78: 6928–6935. [DOI] [PubMed] [Google Scholar]
- 27. Cherian PP, Siller-Jackson AJ, Gu S, Wang X, Bonewald LF, et al. (2005) Mechanical strain opens connexin 43 hemichannels in osteocytes: a novel mechanism for the release of prostaglandin. Mol Biol Cell 16: 3100–3106. [DOI] [PMC free article] [PubMed] [Google Scholar]
- 28. Eissing T, Conzelmann H, Gilles ED, Allgower F, Bullinger E, et al. (2004) Bistability analyses of a caspase activation model for receptor-induced apoptosis. J Biol Chem 279: 36892–36897. [DOI] [PubMed] [Google Scholar]
- 29. Balsinde J, Winstead MV, Dennis EA (2002) Phospholipase A(2) regulation of arachidonic acid mobilization. FEBS Lett 531: 2–6. [DOI] [PubMed] [Google Scholar]
- 30. Zhao X, Wang D, Zhao Z, Xiao Y, Sengupta S, et al. (2006) Caspase-3-dependent activation of calcium-independent phospholipase A2 enhances cell migration in non-apoptotic ovarian cancer cells. J Biol Chem 281: 29357–29368. [DOI] [PubMed] [Google Scholar]
- 31. Stennicke HR, Renatus M, Meldal M, Salvesen GS (2000) Internally quenched fluorescent peptide substrates disclose the subsite preferences of human caspases 1, 3, 6, 7 and 8. Biochem J 350 Pt 2: 563–568. [PMC free article] [PubMed] [Google Scholar]
- 32. Talanian R, Quinlan C, Trautz S, Hackett M, Mankovich J, et al. (1997) Substrate specificities of caspase family proteases. The Journal of Biological Chemistry 272: 9677–9682. [DOI] [PubMed] [Google Scholar]


