

Abstract
Previously, pulsed magneto-motive ultrasound (pMMUS) imaging has been introduced as a contrast-agent-assisted ultrasound-based imaging modality capable of visualizing biological events at the cellular and molecular level. In pMMUS imaging, a high intensity pulsed magnetic field is used to excite cells or tissue labeled with magnetic nanoparticles. Then, ultrasound (US) imaging is used to monitor the mechanical response of the tissue to an externally applied magnetic field (i.e., tissue displacement). Signal to noise ratio (SNR) in pMMUS imaging can be improved by using superparamagnetic nanoparticles with larger saturation magnetization. Metal-doped magnetic nanoparticles with enhanced tunable nanomagnetism are suitable candidates to improve the SNR and, therefore, sensitivity of pMMUS imaging, which is essential for in vivo pMMUS imaging. In this study, we demonstrate the capability of pMMUS imaging to identify the presence and distribution of zinc-doped iron oxide nanoparticles in live nude mice bearing A431 (human epithelial carcinoma) xenograft tumors.
Introduction
Nanoscale contrast agents have been utilized to assist several different imaging modalities such as magnetic resonance imaging (MRI), radionuclide imaging and optical imaging to detect events at molecular and cellular level.1–4 However, these imaging modalities have certain limitations, such as reconstructive (i.e., not real-time) nature and relatively high cost of MRI,5 ionizing radiation associated with radioactive markers used in radionuclide imaging,6 and shallow penetration depth in optical imaging.7 Ultrasound (US) imaging – a non-ionizing, deeply penetrating, real-time, portable and cost efficient technique - is the most widely used medical imaging modality in clinical practice.8 However, limited contrast in US imaging is the major restriction for being utilized directly as a tool for cellular and molecular imaging. Pulsed magneto-motive ultrasound (pMMUS) imaging has been introduced as an ultrasound-based imaging modality capable of using superparamagnetic nanoparticles as contrast agents to expand the utility of US imaging for visualizing events at cellular and molecular levels.9–12 In pMMUS imaging, superparamagnetic nanoparticles are employed to label specific cells or tissue. Then, an externally pulsed magnetic excitation is used to induce a mechanical response (i.e. displacement) within the labeled tissue and the magnetically induced displacement is subsequently measured using ultrasound-based motion tracking technique. As most tissue components are weakly diamagnetic materials,10, 13, 14 there is no significant interaction between native tissue and magnetic force. In contrast, superparamagnetic nanoparticles exhibit significantly larger (seven to eight orders of magnitude) magnetic susceptibility (χ).13 Therefore, when cells or tissue labeled with superparamagnetic nanoparticles are exposed to a magnetic field, they tend to move toward lower magnetic potential.15 In most cases, the labeled cells or tissue are located within a viscoelastic tissue background. Therefore, internal tissue elasticity forces act against the magnetically induced displacement. The superposition of these two forces leads to an induced vibration within the magnetically labeled tissue that can be detected with accurate and sensitive US motion tracking techniques.16, 17 Combination of superparamagnetic contrast agents, magnetic excitation and US motion detection results in a unique contrast mechanism utilized in the newly developed pMMUS imaging technique, capable of microscopic visualization of nanoscale events with sufficient contrast and at clinically relevant depths.
In pMMUS imaging, the magnetically induced displacement (i.e. pMMUS signal) is directly proportional to the magnetic susceptibility (χ) and saturation magnetization value (Ms) of nanoscale contrast agents.9–12 Therefore, superparamagnetic nanoparticles with larger magnetization can more actively respond to external pulsed magnetic excitation and hence the sensitivity of pMMUS imaging can be significantly enhanced. Iron oxide nanoparticles are the most common type of superparamagnetic nanoparticles and are suitable candidates for pMMUS imaging due to their tunable magnetism. For example, by precisely controlling the size of iron oxide nanoparticles, the saturation magnetization value of nanoparticles can be tuned.4 Recently, metal dopant substitution strategy of iron oxide nanoparticles has been introduced to achieve superparamagnetic nanoparticles with higher χ and Ms.3, 18 For example, zinc-doped iron oxide nanoparticles exhibit significantly superior saturation magnetization (161 emu g−1(Zn+Fe)) compared to typical iron oxide (Fe3O4) nanoparticles (typically around 50 emu g−1 Fe)19 and therefore are capable of increasing the contrast and the sensitivity in pMMUS imaging. Such contrast and sensitivity enhancements can open up further opportunities for pMMUS imaging to image magnetically labeled tissue at larger depths and in vivo where biological motions exist. Moreover, utilizing nanoparticles with such large magnetization values can potentially decrease the required dose of contrast agent which is generally desired for in vivo applications.
In previous work, we demonstrated the ability of pMMUS imaging to detect and visualize the presence and distribution of cells loaded with iron oxide nanoparticles within an ex vivo tissue sample.10 Here, we further demonstrate the feasibility of in vivo pMMUS imaging of immunodeficient nude mice with A431 xenograft tumor. For in vivo pMMUS imaging, zinc-doped iron oxide (Zn0.4Fe2.6O4) nanoparticles were used as magnetoactive imaging contrast agent (MCA) for pMMUS imaging. To the best of our knowledge, this is the first report on in vivo pMMUS imaging of superparamagnetic nanoparticles in a live animal.
Results and discussions
Phantom Study of the pMMUS Imaging Property of MCA
Zinc-doped iron oxide nanoparticles were selected as MCA for in vivo imaging experiments due to their superior magnetization properties, enabling larger pMMUS signal. To demonstrate the pMMUS signal enhancement by using zinc-doped iron oxide (Zn0.4Fe2.6O4) nanoparticles as MCA, a phantom study was performed to compare pMMUS signals from 15 nm zinc-doped iron oxide MCA with a commercial superparamagnetic iron oxide nanoparticles (Feridex I.V.®, Bayer Healthcare Pharmaceuticals), and an in-house synthesized 7.5 nm citrate-coated superparamagnetic iron oxide (Citrate-SPION) nanoparticles. Magnetic inclusions, made out of 6% porcine gelatin, were placed in a 4% gelatin background. The metal concentration of nanoparticles was kept the same for all three types of nanoparticles (0, 0.5, and 1 mg (metal)/ml mixture). pMMUS imaging was performed using a single element focused ultrasound transducer operating at 25 MHz. The magnetically induced displacement in response to a 10 ms magnetic excitation pulse was accurately measured in each inclusion and was normalized for magneto-motive force variation in experimental procedure. The results (Fig. 1) show that zinc-doped iron oxide MCAs exhibit a significant enhancement in pMMUS signal (maximum magnetically induced displacement). The ringing observed in displacement of magnetic inclusions (Fig. 1b) and after the magnetic excitation is due to the elastic properties of the gelatin phantoms. The MCAs resulted in significant signal enhancement of 192%, and 150% for inclusions containing 0.5, and 1mg Fe/ml compared to Citrate-SPIONs. These signal increments were measured as 277% and 225% when comparing commercial superparamagnetic iron oxide nanoparticles and MCAs. The signal measured in control (non-magnetic) inclusions is considered as noise/error of the custom-built pMMUS system.
Fig. 1.

(a) The schematics of the experimental setup used to measure pMMUS signal in a gelatin phantom with inclusions made from three different types of contrast agents with identical concentration (by metal mass). (b) Typical magnetically induced displacement detected in zinc-doped iron oxide magnetoactive imaging contrast agents (MCAs), commercial iron oxide SPIONs (Feridex I.V.), and citrate-SPIONs. The black arrows marked as “on” or “off” represent the excitation magnetic pulse of 10 ms used for phantom studies. (c) Average pMMUS signal (maximum magnetically induced displacement) of magnetic inclusions.
In vivo US/pMMUS imaging of MCAs within xenograft tumors
Three mice with xenograft tumors were used to conduct in vivo pMMUS imaging studies (Fig. 2a). US and pMMUS imaging of A431 xenograft tumors was performed prior to intra-tumor injection of MCAs and after injection of MCAs within the tumors. US images of tumor cross-section in the first mouse in absence and presence of MCAs are shown in Fig. 2b and Fig. 2d, correspondingly. As expected, US imaging was not capable of detecting the presence of accumulated MCAs. Because the animal was repositioned after the injection of MCAs, there is a slight difference between two images. pMMUS images of the tumor cross-section before and after injection of nanoparticles are presented in Fig. 2c and 2e, respectively. A significant contrast between pMMUS images of control (pre-injection) and MCA-loaded (post-injection) tumor was detected. The maximum displacement of 30 μm was detected in the tumor due to the presence of zinc-doped iron oxide MCAs. The noise floor of our imaging system was measured to be approximately 5 μm and, therefore, the displacements less than 5 μm were considered noise and masked out in Fig. 2c and 2e. The average displacement detected in two regions of interest, the first within the tumor (solid blue) and the second within the tissue region adjacent to the tumor (dashed green) is shown in Fig. 2f. The behavior of the MCA-loaded tumor in response to magnetic excitation is clearly demonstrated by the solid blue line while the dashed green line represents the physiological motion where no nanoparticle accumulation is expected. The histological slices of the tumor stained with Prussian blue (Fig. 2g) confirm the heterogeneous distribution of MCAs (blue color), similar to what was visualized in pMMUS images.
Fig. 2.

(a) Schematic represents the location of the xenograft tumor and intra-tumor injection of MCAs. In vivo (b,d) US and (c,e) pMMUS images of a mouse with an A431 tumor: (top) prior to injection and (bottom) 2 hours after injection of magnetic nanoparticles (FOV= 12×9 mm2). The dashed yellow line outlines the tumor (b,d). (f) The temporal behavior of the displacement measured within two regions of interest (inside and outside of the tumor) marked in panel (c). (g) Histological cross-section of the xenograft tumor after injection of MCAs. The section is stained with Prussian blue stain and then was counterstained with nuclear fast red. The blue areas indicate the presence of MCAs.
Three-dimensional US/pMMUS imaging of a nanoparticle-loaded tumor was performed by mechanically translating the animal in horizontal direction while the imaging probe and the magnetic coil were kept stationary. The tumor was imaged using 16 imaging cross-sections spaced by 400 μm. US and pMMUS images of the tumor cross sections were used to form 3-D US and pMMUS images of the tumor (Fig. 3a and Fig. 3c, respectively). Combined US/pMMUS image of the tumor is demonstrated in Fig. 3d, clearly indicating the morphology of the tumor (US background) and distribution of MCAs within the tumor (pMMUS signal). The detected pMMUS signal within the tumor prior to injection of MCAs (Fig. 3b) is due to the presence of physiological motions, finite signal-to-noise ratio associated with the US images and motion tracking algorithm. However, significantly larger magnetically induced motion and, therefore, pMMUS signals were detected after injection of MCAs within the tumor.
Fig. 3.

Three-dimensional in vivo (a) US image and (b) pMMUS image before injection of contrast agents. (c) pMMUS image after injection of MCAs in tumor. (d) combined US/pMMUS image of a mouse tumor loaded with MCAs (FOV=12×9×6 mm3). The colorbar indicates the maximum magnitude of magnetically induced displacement (pMMUS signal).
To further validate the performance of pMMUS imaging and to quantify imaging results, US and pMMUS imaging was performed using two additional mice. The results from three animals are summarized and contrasted in Fig. 4. Fig. 4a and 4b demonstrate combined US/pMMUS images of the xenograft tumor in the first mouse prior to injection of MCAs within the tumor and thus represent control images. Fig. 4c–h represents the combined US/pMMUS images of tumor cross-sections in three mice after injection of MCAs (before and after magnetic excitation). These results clearly show that the MCAs responses to the magnetic excitation can be clearly visualized by pMMUS imaging. The smaller signal detected in the first mouse (Fig. 4d) compare to other two mice (Fig. 4f and 4h) could be due to lower dose of MCAs within the imaged area in the first mouse tumor. However, the detected signal is still strong enough to demonstrate the presence of MCAs within the tumor.
Fig. 4.
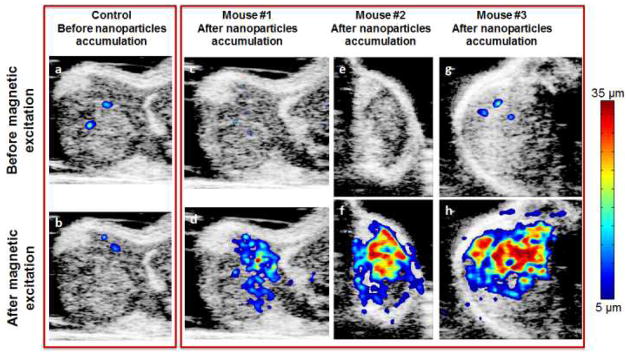
In vivo US/pMMUS images of mice with A431 tumor: panels (a,b) demonstrate the background pMMUS signal due to physiological motion of the mouse – these images were acquired in presence or absence of magnetic pulse excitation prior to injection of MCAs within the tumor. Panels (c,e,g) show low amplitude of the detected tissue displacement in the tumor region before applying the magnetic pulse excitation, and panels (d,f,h) display pMMUS signal detected in tumors loaded with MCAs.
Fig. 5 further summarizes the detected pMMUS signal (i.e. tissue displacement) within regions of interest of the three tumors prior to and after injection of MCAs as well as in the presence and absence of magnetic pulse excitation. Each bar graph represents the mean and standard deviation of the tissue displacement detected in image pixels within the selected ROIs. Obvious increments of tissue displacement within the tumors after injection of MCAs indicate the feasibility of utilizing pMMUS for in vivo detection of these superparamagnetic MCAs. The p-values for each mouse, calculated using Student’s t-test, were found to be less than 0.05 indicating the significant difference between pMMUS signals measured before and after injection of MCAs and in response to the magnetic excitation. Moreover, comparison of the pMMUS signals in presence and absence of MCAs, in response to the magnetic excitation, clearly indicates that the signal is generated due to the interaction between magnetically stimulated MCAs and the magnetic excitation field.
Fig. 5.
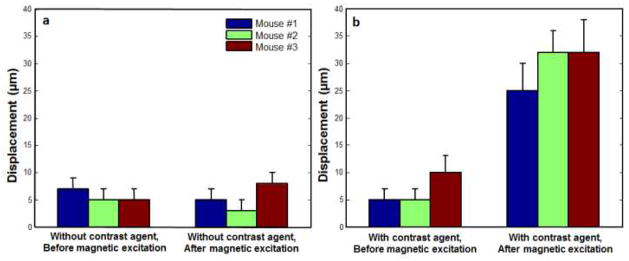
The mean and standard deviation of the tissue displacement calculated in a region of interest located within the xenograft tumors: (a) prior to injection of MCAs. (b) after injection of MCAs within a tumor.
Our results indicate the feasibility of in vivo pMMUS in live subjects. The different temporal characteristics of slow biological motion and faster induced displacement in pMMUS enabled us to separate these motions and thus identify the location of MCAs. The spatial resolution in pMMUS imaging depends on several parameters such as spatial and temporal resolution of the ultrasound imaging system, the mechanical coupling between MCAs and surrounding tissue, and the motion tracking algorithm. In general, the spatial resolution of pMMUS imaging is somewhat degraded compared to US imaging but it is still in sub-millimeter range, which is comparable with current clinical, imaging modalities.
Regarding the sensitivity of pMMUS imaging, the pMMUS signal is affected by the magneto-motive force, and mechanical properties of the tissue surrounding the cells or tissue which are labeled with magnetic materials. The larger magneto-motive force will generate larger displacement and therefore larger contrast in pMMUS imaging. Therefore, larger local concentration of MCAs can enhance the sensitivity of pMMUS. In the experiments reported here, the average magnetically induced displacement was measured to be between 25 to 33 μm. However, smaller displacements (in order of a few μm) can be accurately detected using ultrasound-based motion estimators as demonstrated in shear-wave elasticity imaging20, 21 and acoustic radiation force imaging.22 Therefore, even smaller dose of nanoparticles can be utilized while the pMMUS signal will be still detectable.
Experimental
Synthesis and surface modification zinc-doped iron oxide superparamagnetic nanoparticles
Zinc-doped iron oxide (Zn0.4Fe2.6O4) nanoparticles (MCAs) were synthesized using a one-pot thermal decomposition method which involved a zinc (II) chloride (ZnCl2, ≥98%, Sigma-Aldrich, USA) and an iron (III) acetylacetonate (Fe(acac)3, ≥98%, Sigma-Aldrich, USA) in the presence of oleic acid (Sigma-Aldrich, USA), oleylamine (Sigma-Aldrich, USA), and octyl ether (98%, Aldrich, USA).18 In order to make these MCAs water soluble, surface modification of these nanoparticles was performed with tetramethyl ammonium hydroxide (TMAOH, ≥97%, Aldrich, USA) and carboxy methyl dextran (CMD, 10kDa, PK Chemical, Denmark) (Fig. 6a). The mixture of MCAs and TMAOH was allowed to react at room temperature for 15 min before being washed with excess amount of hexane. The isolated nanoparticles were dispersed in deionized water (DIW) and stirred with excess amount of CMD. The final product was purified by dialysis and filtration.
Fig. 6.
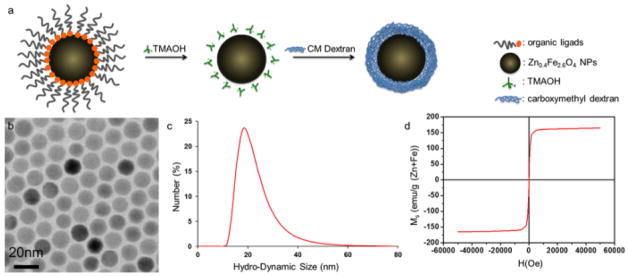
(a) Schematics of surface modification of MCAs, (b) TEM image of 15 nm MCAs, showing monodisperse size distribution, (c) DLS data of surface modified nanoparticles. DLS confirms average hydrodynamic size of carboxy methyl dextran coated MCAs as 21.5 nm. (d) M-H curve of 15 nm MCAs measured at 5 K using a SQUID magnetometer. The red curve showed their superparamagnetic nature with no coercivity and their saturation magnetization (Ms) was measured as 161 emu g−1 (Zn+Fe).
The size and mass magnetic susceptibility of nanoparticles were characterized using techniques including transmission electron microscopy (TEM, JEOL-2100, JEOL, Japan), dynamic light scattering (DLS, Zetasizer Nano ZS, Malvern, UK), and superconducting quantum interference device (SQUID, MPMS7, Quantum Design, USA). The average size of as-synthesized core nanoparticles was 15 nm with size distribution less than 5% (Fig. 6b). The hydrodynamic size of surface modified nanoparticles was measured with DLS, which showed relatively small (ca. 21.5 nm) (Fig. 6c). SQUID measurement showed superparamagnetic property of nanoparticles with high saturation magnetization value of 161 emu g−1 (Zn+Fe) (Fig. 6d).
Synthesis and surface modification of superparamagnetic iron oxide nanoparticles
Superparamagnetic iron oxide nanoparticles (SPIONs) were synthesized using a surfactant-free, thermal decomposition reaction of iron (III) acetylacetonate (Fe(acac)3) in tri(ethylene glycol). 23, 24 1 g of Fe(acac)3 (≥99.9% trace metals basis, Sigma-Aldrich, USA) was added to 20 ml of tri(ethylene glycol) (99%, Sig ma-Aldrich, USA) and heated to approximately 250°C at an average rate of 450°C/h. The reaction was held for four hours under reflux between 250°C and 260°C. After cooling to room temperature, the tri (ethylene glycol)–coated SPIONs (TREG-SPIONs) were obtained. The SPIONs’ tri (ethylene glycol) surface layer was replaced with a capping layer of citrate ions to improve their colloidal stability in water or saline solutions through a phase transfer step.
Nude mice tumor model preparation
Human epidermoid carcinoma A431 cells were cultured in Dulbecco’s modified Eagle medium (DMEM, Sigma-Aldrich, USA) at 5% CO2 and 37°C supplemented with 10% fetal calf serum. Cells (1.2×10⁶) suspended in 0.2 ml 1x PBS (Sigma Aldrich, USA) were inoculated subcutaneously on the right flank of the mice.25, 26 After 18 days, the volume of the implanted tumors reached to 8 to 10 mm in diameter. All these procedures were performed under the animal protocol approved by Institutional Animal Care and Use Committee (IACUC) at The University of Texas at Austin.
Intratumoral injection of MCA and in vivo US/pMMUS imaging
In vivo US/pMMUS imaging was performed on eight-week old nude mice (Nu/Nu) with A431 xenograft tumor. The mice were imaged (with US and pMMUS) prior to the injection of superparamagnetic nanoparticles (control condition). Then, 50 μl of MCA solution (at the concentration of 10 mg (Zn+Fe)/ml) were directly injected into the tumors. A permanent magnet (NdFeB block magnet, surface field of 5754 Gauss, B555, K&J magnets Inc, USA) was placed close to the tumors for 120 minutes after administration of superparamagnetic nanoparticles to increase the present dose of MCAs within the tumor.27 The choice of intra-tumor injection was based on achieving efficient accumulation of non-targeted superparamagnetic nanoparticles. The mice underwent the same imaging procedure after injection of nanoparticles within the tumor. During both imaging sessions (pre-injection and post-injection), animals was anesthetized with a combination of isoflurane (0.5 ~ 2.0%) and oxygen (0.5 L/min). After post-injection imaging, the animals were sacrificed by carbon dioxide (CO2) asphyxiation followed by cervical dislocation and the tumor was excised for histological analysis.
US and pMMUS imaging system
Fig. 7 represents the block diagram of the US/pMMUS imaging system. US and pMMUS imaging was performed using US array transducer operating at a center frequency of 9 MHz. A multi-channel pre-beamformed data acquisition system (DAQ, Ultrasonix Co., Canada) was utilized to capture US pulse-echo RF data at high frame rate (1000 Fr/sec), which is an essential requirement to accurately measure magnetically induced displacement. Magnetic excitation pulses were generated using an electromagnet solenoid (S103.0, SolenInc, USA) driven by a high power voltage controlled current amplifier (7796 power amplifier, AE TECHRON, USA). The solenoid was enclosed by an aluminum casing filled with mineral oil which was connected to an active cooling system (EX2-1055 cooling system, Koolance, USA) to avoid heat generation within the hardware. The magnetic pulses with 40 ms duration and with 0.8 T strength were used to excite the magnetically loaded tissue. The US transducer and magnetic coil were kept stationary, and a uni-axial linear axes system (T-LSR, Zaber Technologies Inc., Canada) was used to scan the animals over the region of interest with a step-size of 400 μm. US pulse-echo RF data was acquired 20 ms before application of the magnetic pulse, during the excitation period and 40 ms after removing the magnetic excitation pulse at an acquisition rate of 1 KHz (total 100 frames).
Fig. 7.
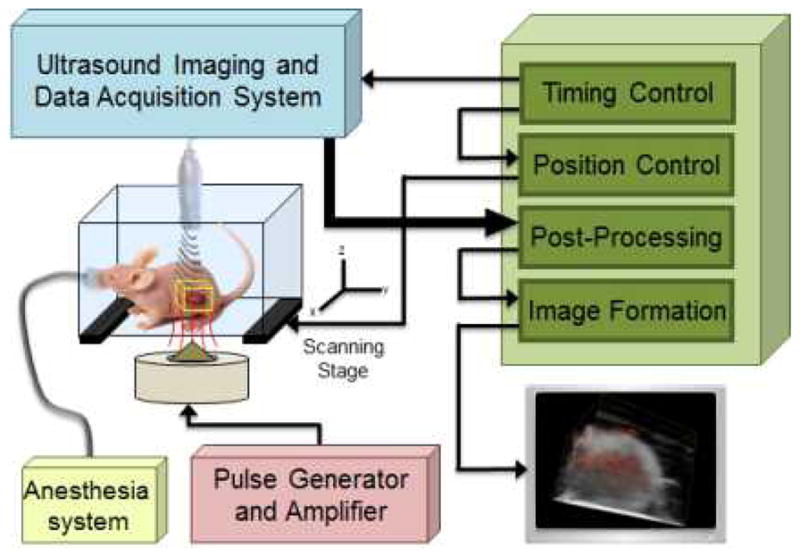
Block diagram of US/pMMUS imaging system used for in vivo imaging of tumor bearing animal. The location of the tumor in mouse model and the imaging volume is depicted using a yellow box.
US and pMMUS image reconstruction
Fig. 8 shows the function block diagram of the post-processing modules for US/pMMUS imaging reconstruction. The US imaging system was programmed so that the whole US aperture, including 128 elements, was used to transmit unfocused, US pulsed waves and to receive backscattered signals.17, 28, 29 A delay and sum beamformer that accurately accounts for the delay distances between the transducer elements and the reconstructed point in the image was used to form gray-scale B-scan US images. The motion tracking module uses a pair of beamformed US frames where a stationary frame (captured prior to application of magnetic pulse) was always used as the reference frame to calculate the relative displacement in consecutive acquired frames. The frame-to-frame displacements were estimated using a 1-D (axial), cross-correlation based speckle tracking method, in which the normalized magnitude of the cross-correlation function was used to obtain a pixel level estimate of the displacement, then interpolation and phase zero-crossing were used to estimate subpixel displacements.16, 30, 31 To minimize the effect of the biological (cardiac and respiratory) motion in pMMUS imaging, the magnetic excitation pulses were sent during the “grace period”, when the animal has the least respiratory motion.32 Note that the tumors were inoculated in the lower body of the animals and therefore cardiac motion was not very significant. Also as the magnetically induced displacement is time-gated, it could be separated from the bulk tissue displacement. Moreover, the magnetically induced displacement takes place in short period of time (sharp and high frequency characteristics) and therefore slow respiratory motion can be suppressed by using a high pass filter. In our pMMUS measurements, the noise floor was considered to be 5 μm (i.e. any displacement below 5 μm was considered as experimental or computational noise). Moreover, the pMMUS signal at each position within the imaging plane was normalized to the magneto-motive force by measuring the magnetic flux density of every pulse using a digital gaussmeter equipped with a hall-effect sensitive detector.
Fig. 8.
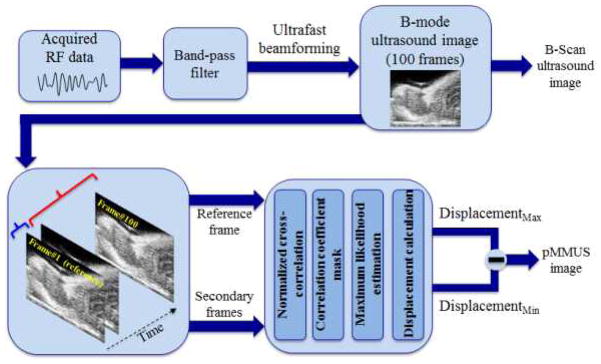
Block diagram of the US and pMMUS image reconstruction approach. pMMUS image is reconstructed by finding the maximum of magnetically induced displacement in each pixel.
Conclusion
The capability of pMMUS imaging to detect the presence and distribution of nano-sized MCAs within tumor bearing mice is demonstrated. While US imaging is not capable of detecting nano-sized MCAs, our results suggest that pMMUS imaging can expand the scope of US imaging to detect nanoscale interactions (i.e. accumulation of nano-sized contrast agents within a xenograft tumor). Utilizing short magnetic excitation pulses and the time-gated characteristics of the magnetically induced displacement allows the separation of magnetically induced displacement from bulk biological motion of animal.
Zinc-doped nano-sized MCAs with superior magnetic properties such as large saturation magnetization (Ms) compared to commonly used iron oxide nanoparticles significantly enhanced the pMMUS signal and thus paved the way to perform in vivo imaging. During pMMUS imaging using these novel MCAs, no side effects associated with cytotoxicity of the MCAs was observed and their colloidal stability made them a suitable tool to perform in vivo studies.
As an ultrasound-based imaging modality, pMMUS benefits from notable advantages of US imaging. Compared to currently existing molecular imaging techniques such as optical imaging and magnetic resonance imaging (MRI) pMMUS offers several advantages including capacity for real-time imaging, large imaging depth, lower implementation cost and reduced system complexity. Moreover, unlike required contrast agents in several other molecular imaging techniques such as radionuclide imaging, superparamagnetic iron oxide nanoparticles have low cytotoxicity concerns which make them suitable for cellular/molecular biomarkers in biomedical applications. Several research groups have demonstrated feasibility of using magnetic nanoparticles for in vivo and even in clinical trials without introducing organ toxicity.18, 33 Therefore, pMMUS imaging can become a tool for diagnostic and therapeutic applications. By using MCAs with a desired targeting moiety,34, 35 pMMUS can potentially be a tool for cellular and molecular imaging. With further development of pMMUS imaging, we envision the ultimate application of pMMUS in detecting skin melanoma, detection of lymph-node metastasis, stem-cell tracking, and monitoring magnetic-enhanced drug delivery to primary tumors.
Supplementary Material
Acknowledgments
The authors are grateful to Mr. Seung Yun Nam and Mr. Soon Joon Yoon for help with 3D visualization of imaging results, Mr. Jason Cook for his helps with histology, and Mr. Douglas Yeager for the insightful discussion of the manuscript and helpful feedback. This work was partially supported by the National Institutes of Health under grant EB 008821. J.C. was supported by Creative Research Initiative (2010-0018286) and WCU Program (R32-10217).
Footnotes
Electronic Supplementary Information (ESI) available: Supplementary information includes transmission electron microscopy (TEM), powder x-ray diffraction (PXRD) pattern, thermogravimetric analysis (TGA), colloidal stability and biocompatibility of Zn0.4Fe2.6O4 nanoparticles, and comparison between SQUID magnetometry of zinc-doped MCAs and different sizes of iron oxide nanoparticles.
Contributor Information
Jinwoo Cheon, Email: jcheon@yonsei.ac.kr.
Stanislav Y. Emelianov, Email: emelian@mail.utexas.edu.
Notes and references
- 1.Weissleder R, Mahmood U. Radiology. 2001;219:316–333. doi: 10.1148/radiology.219.2.r01ma19316. [DOI] [PubMed] [Google Scholar]
- 2.Debbage P, Jaschke W. Hist Cell Biol. 2008;130:845–875. doi: 10.1007/s00418-008-0511-y. [DOI] [PubMed] [Google Scholar]
- 3.Lee JH, Huh YM, Jun Y, Seo J, Jang J, Song HT, Kim S, Cho EJ, Yoon HG, Suh JS. Nat Med. 2006;13:95–99. doi: 10.1038/nm1467. [DOI] [PubMed] [Google Scholar]
- 4.Jun Y, Seo J, Cheon J. Acc Chem Res. 2008;41:179–189. doi: 10.1021/ar700121f. [DOI] [PubMed] [Google Scholar]
- 5.Bushong SC. Magnetic resonance imaging: Physical and biological principles. C.V. Mosby Co; St. Louis, MO: 1996. [Google Scholar]
- 6.Holland JP, Williamson MJ, Lewis JS. Mol Imaging. 2010;9:1. [PMC free article] [PubMed] [Google Scholar]
- 7.Bremer C, Ntziachristos V, Weissleder R. Eur Radiol. 2003;13:231–243. doi: 10.1007/s00330-002-1610-0. [DOI] [PubMed] [Google Scholar]
- 8.Szabo TL. Diagnostic ultrasound imaging: inside out. Elsevier Academic Press; Burlington, MA: 2004. [Google Scholar]
- 9.Mehrmohammadi M, Oh J, Aglyamov SR, Karpiouk AB, Emelianov SY. Proceedings of the IEEE Eng Med Biol Soc. 2009:4771–4774. doi: 10.1109/IEMBS.2009.5334214. [DOI] [PubMed] [Google Scholar]
- 10.Mehrmohammadi M, Oh J, Mallidi S, Emelianov SY. Mol Imaging. 2011;10:102–110. [PMC free article] [PubMed] [Google Scholar]
- 11.Mehrmohammadi M, Oh LMJ, Yantsen E, Larson T, Mallidi S, Park S, Johnston KP, Sokolov K, Milner T, Emelianov S. Proceedings of the IEEE Ultrasonics Symp. 2007:652–655. [Google Scholar]
- 12.Oh J, Feldman MD, Kim J, Condit C, Emelianov S, Milner TE. Nanotechnology. 2006;17:4183. doi: 10.1088/0957-4484/17/16/031. [DOI] [PubMed] [Google Scholar]
- 13.Schenck JF. Med Phys. 1996;23:815–850. doi: 10.1118/1.597854. [DOI] [PubMed] [Google Scholar]
- 14.Schenck JF. J Magn Reson Imaging. 2000;12:2–19. doi: 10.1002/1522-2586(200007)12:1<2::aid-jmri2>3.0.co;2-v. [DOI] [PubMed] [Google Scholar]
- 15.Wada S, Tazawa K, Suzuki N, Furuta I, Nagano I. Oral Dis. 2007;13:193–197. doi: 10.1111/j.1601-0825.2006.01266.x. [DOI] [PubMed] [Google Scholar]
- 16.Cohn NA, Emelianov SY, Lubinski MA, O’Donnell M. Ultrason Ferroelectr Freq Control IEEE Trans. 1997;44:1304–1319. [Google Scholar]
- 17.Park S, Aglyamov SR, Emelianov SY. Ultrason Ferroelectr Freq Control IEEE Trans. 2007;54:2246–2256. doi: 10.1109/tuffc.2007.529. [DOI] [PubMed] [Google Scholar]
- 18.Jang J, Nah H, Lee JH, Moon SH, Kim MG, Cheon J. Angew Chem. 2009;121:1260–1264. doi: 10.1002/anie.200805149. [DOI] [PubMed] [Google Scholar]
- 19.Gupta AK, Gupta M. Biomaterials. 2005;26:3995–4021. doi: 10.1016/j.biomaterials.2004.10.012. viscosity with Shearwave Dispersion Ultrasound Vibrometry (SDUV), 2009. [DOI] [PubMed] [Google Scholar]
- 20.Bouchard RR, Hsu SJ, Wolf PD, Trahey GE. Ultrasonic imaging. 2009;31:201–213. doi: 10.1177/016173460903100305. [DOI] [PMC free article] [PubMed] [Google Scholar]
- 21.Urban MW, Chen S, Greenleaf JF. Ultrason Ferroelectr Freq Control IEEE Trans. 2009;56:748–758. doi: 10.1109/TUFFC.2009.1097. [DOI] [PMC free article] [PubMed] [Google Scholar]
- 22.Hsu SJ, Bouchard RR, Dumont DM, Wolf PD, Trahey GE. Ultraso in Med and Bio. 2007;33:1706–1719. doi: 10.1016/j.ultrasmedbio.2007.05.009. [DOI] [PMC free article] [PubMed] [Google Scholar]
- 23.Maity D, Kale SN, Kaul-Ghanekar R, Xue JM, Ding J. J Magn Magn Mater. 2009;321:3093–3098. [Google Scholar]
- 24.Wan J, Cai W, Meng X, Liu E. Chem Comm. 2007:5004–5006. doi: 10.1039/b712795b. [DOI] [PubMed] [Google Scholar]
- 25.Di Benedetto M, Starzec A, Vassy R, Perret GY, Crepin M, Kraemer M. British J Cancer. 2003;88:1987–1994. doi: 10.1038/sj.bjc.6600985. [DOI] [PMC free article] [PubMed] [Google Scholar]
- 26.Farhan H, Schuster C, Klinger M, Weisz E, Waxenecker G, Schuster M, Sexl V, Mudde GC, Freissmuth M, Kircheis R. J Pharm Exp Ther. 2006;319:1459. doi: 10.1124/jpet.106.107318. [DOI] [PubMed] [Google Scholar]
- 27.Plank C, Schillinger U, Scherer F, Bergemann C, Remy JS, Krotz F, Anton M, Lausier J, Rosenecker J. Biol Chem. 2003;384:737–747. doi: 10.1515/BC.2003.082. [DOI] [PubMed] [Google Scholar]
- 28.Sandrin L, Catheline S, Tanter M, Hennequin X, Fink M. Ultrasonic imaging. 1999;21:259–272. doi: 10.1177/016173469902100402. [DOI] [PubMed] [Google Scholar]
- 29.Tanter M, Bercoff J, Sandrin L, Fink M. Ultrason Ferroelectr Freq Control IEEE Trans. 2002;49:1363–1374. doi: 10.1109/tuffc.2002.1041078. [DOI] [PubMed] [Google Scholar]
- 30.Lubinski MA, Emelianov SY, O’Donnell M. Ultrason Ferroelectr Freq Control IEEE Trans. 1999;46:82–96. doi: 10.1109/58.741427. [DOI] [PubMed] [Google Scholar]
- 31.O’Donnell M, Skovoroda AR, Shapo BM, Emelianov SY. Ultrason Ferroelectr Freq Control IEEE Trans. 1994;41:314–325. [Google Scholar]
- 32.Cavanaugh D, Johnson E, Price RE, Kurie J, Travis EL, Cody DD. Mol Imaging. 2004;3:55–62. doi: 10.1162/15353500200403184. [DOI] [PubMed] [Google Scholar]
- 33.Hafeli UO, Pauer GJ. J Magn Magn Mater. 1999;194:76–82. [Google Scholar]
- 34.Khemtong C, Kessinger CW, Ren J, Bey EA, Yang SG, Guthi JS, Boothman DA, Sherry AD, Gao J. Cancer Res. 2009;69:1651–1658. doi: 10.1158/0008-5472.CAN-08-3231. [DOI] [PMC free article] [PubMed] [Google Scholar]
- 35.Sun C, Sze R, Zhang M. J Biomed Mater Res Part A. 2006;78:550–557. doi: 10.1002/jbm.a.30781. [DOI] [PubMed] [Google Scholar]
Associated Data
This section collects any data citations, data availability statements, or supplementary materials included in this article.