Abstract
Realgar is a poorly water-soluble compound that exhibits poor bioavailability. To improve this, the authors reduced the particle size of realgar to nanoscale by high-energy ball milling and optimized the preparation process under which (realgar weight 40 g, milling time 9 hours, milling speed 38 Hz, milling temperature −20°C) realgar nanoparticles (NPs) with an average size of 78±8.3 nm were prepared. The average particle size of realgar was characterized by laser scattering, and its apparent shape was observed by transmission electron microscopy and scanning electron microscopy. The solubility of realgar was enhanced after milling until the particles were in the nanoscale region without altering its properties, as confirmed by a scanning electron microscopy energy-dispersive spectrometer. Realgar NPs had higher cytotoxicity on the selected cell lines, namely human breast cancer (MCF7), human hepatoma (HepG2), and human lung cancer (A549) cell lines, than coarse realgar. In addition, a pharmacokinetics study performed in rats indicated that the relative bioavailability of realgar NPs was 216.9% compared with coarse realgar; a biodistribution study performed in mice showed that after intragastric administration of realgar NPs, higher arsenic concentration was reached in the tumor, heart, liver, spleen, lung, and kidney compared with the administration of coarse realgar, as confirmed by inductively coupled plasma mass spectrometry to determine the concentration of arsenic. This study indicated that high-energy ball milling is an effective way to reduce the average particle size of realgar, and compared with coarse realgar, the cytotoxicity and bioavailability of realgar NPs were significantly improved.
Keywords: realgar nanoparticles, high-energy ball milling, cytotoxicity, pharmacokinetics, biodistribution
Introduction
A traditional Chinese medicine, realgar, which contains a potent carcinogen, has been extensively used in the People’s Republic of China and Europe for a long time,1 and 90% of it consists of a sparingly soluble agent – sulfoarsenide.2 For a long time, Chinese people have used compound preparations containing realgar to treat certain types of leukemia.3 In recent years, researchers have used an oral preparation of highly purified crystalline realgar to treat acute promyelocytic leukemia (APL) patients in different stages of the disease, and found that realgar given orally on its own was highly effective and safe in these patients.4,5 Moreover, during recent decades, realgar has exhibited significant beneficial effects in the treatment of APL,5 chronic myeloid leukemia,6,7 and even some human malignancies,8 especially skin and lung cancer.9,10 However, a systematic pharmacokinetic study and definitive systematic molecular proof of its mechanism of action remain to be carried out.
Realgar is insoluble in water and most organic solvents, resulting in poor bioavailability, and so its wide use in clinical situations has encountered many difficulties, such as lack of significant efficacy, need for high doses, and poor patient compliance.11 In order to improve the poor bioavailability of realgar caused by its limited solubility, some means of increasing its solubility is needed. Since realgar is nonionizable, its solubility cannot simply be increased by converting it into a salt.12 However, it has been suggested that a particle-size reduction might significantly accelerate its rate and extent of absorption.13 Transforming poorly water-soluble drugs into nanosize crystals will dramatically enhance their bioavailability and extend their clinical use.14 Colloidal gold and iron oxide nanocrystals are examples of nanoparticles (NPs) that are widely used in biology and medicine.15 To date, realgar NPs have been prepared by physical and chemical methods. Physical methods include high-energy milling2,16–18 and air-current grinding,19 while chemical methods include solvent-relay technology,20 chemical precipitation,21 and coordination chemistry.22 When chemical methods are used to prepare realgar NPs, some problems arise, such as removal of organic solvent residues and the larger particle size. High-energy milling, which was used in this study to prepare realgar NPs, is a suitable tool for preparing particles in the nanosize region by a simple solid-state approach and a production process that is also simple and suitable for production on a large scale.23
However, it needs to be confirmed that realgar NPs have more dramatically and significantly enhanced pharmacological in vitro anticancer activity compared with coarse realgar. The in vitro anticancer activity of realgar NPs was tested using blood-disease models – HL-6016,24–26 and K56216 – which showed positive results as being obtained from the clinical use of realgar. In addition to the effect on the blood-disease cell lines, studies were carried out on other cancer cell lines. Researchers have found that realgar NPs can significantly inhibit the viability and proliferation of certain human gynecological cancer cell lines (C180-13S, OVCAR, OVCAR-3, HeLa),2,27,28 as well as the cell lines ARH 77, U266,29 ECV-304,28 and U937.18,30 To investigate the anticancer mechanism of action of realgar further, a series of in vitro studies were carried out, and the results demonstrated that the apoptosis of U937 took place via caspase, mitochondria, and mitogen-activated protein kinase-signal pathways.18,30 Studies at a gene level showed that realgar NPs produce changes in some gene expression in the human uterine cervix cancer cell line SiHa.31 Studies carried out on a limited number of cell lines have clarified the mechanism of action of realgar NPs to some degree.20,24–30 Although most studies focus on the marked and significant effect of realgar NPs on different cancer cell lines, especially blood disorders under the in vitro condition, there have been few comparisons of the anticancer activity of two realgar preparations with different particle sizes.
Regardless of the in vitro anticancer effect of realgar, as far as in vivo studies are concerned, only an increase in the urinary excretion of the total arsenic content was observed,2 and there are as yet no systematic pharmacokinetic studies about its concentration in blood and various tissues. This is because a specific and sensitive analytic technique is needed. High-sensitivity inductively coupled argon plasma mass spectrometry (ICP-MS) was used in this paper to meet the detection requirements. Thanks to this analytic technique, the concentration of arsenic in blood and various tissues can be determined. The comprehensive analysis of the in vivo absorption and distribution course of realgar in this study will improve the rational and safe clinical use of realgar. Moreover, a comparison of the bioavailability of the two realgar preparations with different particle sizes was carried out, providing reliable data for the use of realgar NPs in clinical situations.
The realgar NPs produced after milling were 78±8.3 nm in size. In vitro studies were carried out on human breast cancer (MCF7), human hepatoma (HepG2), and human lung cancer (A549) cell lines to compare the cytotoxicity of the two realgar preparations with different particle sizes. For the in vivo study, a rat model was selected for comparison of the oral bioavailability, and a tumor-bearing mouse model was selected for comparison of the biodistribution differences in the two realgar preparations, with different particle sizes using the concentration of arsenic in the blood and various tissues. ICP-MS, a specific and sensitive analytic technique, was used.32
Materials and methods
Materials
Realgar (As2S2, 98% pure) was obtained from the Hubei Institute of Chinese Traditional Medicine (Hubei, People’s Republic of China). The compounds – 3-(4, 5-dimethylthiazol-2-yl)-2, 5-diphenyltetrazolium bromide (MTT), ethylene glycol, nitric acid, sodium hydroxide, and monopotassium phosphate – were purchased from Tianjin Bodi Chemical Co., Ltd (Tianjin, People’s Republic of China). Ultrapure water was used throughout the study.
Methods
Preparation of realgar NPs
Realgar NPs were prepared in the temperature-controlled inert atmosphere of a high-energy ball mill (QM-DY4, low temperature planetary ball mill, Nanjing Instrument Plant, Nanjing, People’s Republic of China), loaded well with balls weighing 640 g each. In order to obtain the optimum conditions during the preparation of realgar NPs, the process conditions were optimized by the orthogonal experiment method. Table 1 lists the schedule for the four important factors involved in the orthogonal experiment: the weight of realgar, milling time, milling speed, and milling temperature. Based on preliminary experiments, three levels were set for each factor separately. The average particle size was taken as the index to evaluate the preparation process under selected conditions. The best process conditions were selected by analyzing the experimental conclusions. To determine the particle-size distribution of samples, the polygonal dynamic laser-light scattering method was used, and the evaluation indicators were analyzed using the average particle size. To examine the realgar NPs prepared under optimized conditions, the particle-size distribution was measured and the apparent morphology was observed.
Table 1.
Experimental parameters of preparation of realgar nanoparticles for different cases
| Number | Weight of realgar (g) | Milling time (hours) | Milling speed (Hz) | Milling temperature (°C) |
|---|---|---|---|---|
| 1 | 160 | 3 | 28 | 0 |
| 2 | 80 | 6 | 33 | −10 |
| 3 | 40 | 9 | 38 | −20 |
Characterization of the realgar particles
A laser particle-size analyzer (Zetasizer Nano; Malvern Instruments, Malvern, UK) was used to determine particle-size distribution and zeta-potential. A transmission electron microscope (TEM; CM20 Ultra Twin microscope; Philips, Eindhoven, the Netherlands) equipped with a thermionic gun providing a point of 0.27 nm was used to observe the morphology of the realgar NPs and the coarse realgar. The samples were suspended in alcohol, and then the suspension was placed on a copper grid covered with a nitrocellulose membrane. The morphology of the samples was observed under an electric voltage of 120.0 kV.
Scanning electron microscopy (SEM; Quanta Phenom; FEI, Hillsboro, OR, USA) was also used to examine the morphology of realgar NPs and coarse realgar. Before starting the observations, samples were suspended in alcohol and vacuum-coated with a thin layer of gold using a Pelco 91000 (Ted Pella, Redding, CA, USA) sputter-coating system. Then, the samples were observed at an acceleration potential of 20.0 kV.
An automated mineralogy system that combines SEM and an energy resolution-dispersive spectrometer (EDS) and facilitates ultrafast analysis of particulate-mineral phases was used for quantitative analysis of the elements on the surface. The pulverized samples were coated with a thin gold layer, and then the samples were observed at 25.0 kV using the gaseous secondary electron detector. Dissolution tests were carried out in aqueous media (pH 1.2, pH 7.4, and ultrapure water) over a period of 8 hours.
In vitro studies
Cells and cell culture
Human breast cancer (MCF7), human hepatoma (HepG2), and human lung cancer (A549) cell lines were used to compare the cytotoxicity of the two different particle sizes of realgar. MCF7, HepG2 and A549 were obtained from the American Type Culture Collection (San Francisco, CA, USA). All cells were grown at 37°C in a humidified atmosphere containing 5% CO2. Cell viability of the stock cultures used for subsequent experiments was always above 95%, as determined by the trypan blue exclusion test.
Cell-viability assay
To quantify drug cytotoxicity and cell proliferation, cell viability was determined using an MTT assay after different periods of incubation.33,34 In brief, cells were seeded into 96-well plates at a density of 3,000 cells/well for 24 hours, and the cells were allowed to reach confluence. Five concentrations of realgar NPs and coarse realgar suspensions were added separately. After different culture periods (24, 48, and 72 hours), the cells were incubated with 1 mg/mL MTT for 4 hours. Then, the formazan product was solubilized with 10% sodium dodecyl sulfate in 10 mM HCl. The absorbance of each well was measured using a microculture plate reader (ER-8000; Sanko Junyaku Co, Ltd, Tokyo, Japan), at a test wavelength of 570 nm and a reference wavelength of 620 nm.
In vivo pharmacokinetic study
Experimental design
Pharmacokinetic studies were performed in normal, healthy, female Sprague Dawley rats (n=6 per group) weighing 180±20 g purchased from the Experimental Academy of Medical Sciences Laboratory Animal Center (Beijing, People’s Republic of China). Rats were housed at a temperature of 22°C±2°C and a relative humidity of 50%±10% with a 12-hour dark–light cycle and allowed food and water ad libitum for 1 week before the experiment.
Rats were fasted for 12 hours before intragastric administration and remained fasting during the experiment, although they were allowed water ad libitum. The formulations of realgar NPs and coarse realgar suspensions (1.6–2 mL containing 4.62 mg/mL equivalent concentration of two realgar preparations with different particle sizes) were given by the intragastric route to each of the fasted rats. Blood samples were collected in heparinized tubes by retro-orbital plexus puncture from each rat prior to drug administration and at different times after dosing. Then, the blood samples were centrifuged (12,000 rpm, 4°C for 20 minutes) immediately, and the plasma was collected in clean tubes and stored in a freezer at −20°C until analysis. The volume of the blood withdrawn at each time was recorded, and the treated samples were subjected to ICP-MS (ELAN 9000, PerkinElmer, Waltham, MA, USA) measurement, along with an injection standard.
Analytical method
Thawed frozen samples were allowed to reach room temperature, and then the following method was carried out. To each plasma sample was added an indium standard (100 μL, 100 ng/mL), followed by digestion in 3 mL concentrated nitric acid for 1 hour at 100°C (Ethos TC, Milestone; European Virtual Institute for Speciation Analysis, Münster, Germany), then the volume of acid was reduced to 0.5 mL, and finally cooled to room temperature and diluted to 10 mL with redistilled water.
Sample nebulization was performed using a concentric nebulizer for plasma. The detection mode was “scanning”. Details of the ICP-MS operating conditions are given in Table 2. Quantization was based on the mean (n=3) intensity ratios for arsenic in a calibration curve using linear regression analysis.
Table 2.
ICP-MS operating conditions
| ICP-MS | |
| Instrument | ELAN 9000 PerkinElmer Sciex ICP |
| As isotope mass | 74.9216 |
| In internal standard isotope mass | 114.904 |
| Acquisition modes | Scanning |
| Scan mode | Peak hopping |
| Dwell time | 50 ms |
| Channels/amu | 1 |
| Passes/scan | 60 |
| Scans/sample | 3 |
| Nebulizer type | Concentric |
| Sample uptake flow rate | 10 (arbitrary units) |
| Carrier gas | 0.91 L/minute |
| RF power | 1,100 W |
| Lens voltage | 7.5 V |
| Analog-stage voltage | −1,600 V |
| Pulse-stage voltage | 800 V |
| Desolvation temperature | 140°C |
Abbreviations: ICP-MS, inductively coupled plasma mass spectrometry; RF, radiofrequency; amu, atomic mass unit; As, arsenic.
Parameter analysis
Based on statistical moments of noncompartmental analysis, all pharmacokinetic parameters were evaluated by noncompartmental analysis using DAS 2.0 software (Chinese Pharmacological Society, Beijing, People’s Republic of China). Comparison of parameters for realgar NPs and coarse realgar was carried out using Student’s t-test.
In vivo biodistribution investigation
The biodistribution of the two realgar preparations with different particle sizes was studied in male Kunming mice (20±2 g) purchased from the Experimental Academy of Medical Sciences Laboratory Animal Center (Beijing, People’s Republic of China). Mice were housed under the same condition as the Sprague Dawley rats.
H22 (murine hepatoma cell line) cells were given by subcutaneous inoculation into the right axillary space at 1 × 10⁶ cells per mouse. After 7 days of implantation, mice with tumors reaching a volume of 100 mm3 were selected for the experiment. Groups each of three mice were killed at 0.5, 1, 2, and 12 hours after intragastric administration. The tumor, heart, liver, spleen, lung, and kidney were eviscerated, weighed, mixed with physiological saline, and then homogenized. All animal breeding, sample handling, and measurements were carried out in accordance with the procedures approved by the analytical method.
Results
Preparation of realgar NPs
The preparation conditions and average particle size of realgar NPs prepared under different conditions are listed in Table 3. Following mathematical processing of the data, the following conclusions were reached. Primarily, the milling speed plays a more important role compared with the milling time and the weight of realgar on every index, while the milling temperature has less influence on the results. Increasing the weight of realgar is a valid method for reducing the average particle size. Secondly, considering the expense and the machine time involved, medium levels of milling time and temperature should be considered during the preparation process. From a visual analysis, it was obvious that the optimum conditions for preparing realgar NPs were as follows: weight of realgar 40 g, milling time 9 hours; milling speed 38 Hz, and milling temperature −20°C. Furthermore, an average particle size of 78±8.3 nm was achieved using the optimized preparation process.
Table 3.
Orthogonal experiment L9 (34) of realgar nanoparticle preparation process
| Number | Factor
|
Average particle size (nm) | |||
|---|---|---|---|---|---|
| Weight of realgar (g) | Milling time (hours) | Milling speed (Hz) | Milling temperature (°C) | ||
| 1 | 160 | 3 | 28 | 0 | 1,134 |
| 2 | 160 | 6 | 33 | −10 | 1,070 |
| 3 | 160 | 9 | 38 | −20 | 640 |
| 4 | 80 | 3 | 33 | −20 | 821 |
| 5 | 80 | 6 | 38 | 0 | 328 |
| 6 | 80 | 9 | 28 | −10 | 590 |
| 7 | 40 | 3 | 38 | −10 | 209 |
| 8 | 40 | 6 | 28 | −20 | 164 |
| 9 | 40 | 9 | 33 | 0 | 290 |
| K1 | 948 | 721.3 | 629.3 | 584.0 | |
| K2 | 579.7 | 520.7 | 727.0 | 623.0 | |
| K3 | 221.0 | 506.7 | 392.3 | 541.7 | |
| Range | 727.0 | 214.7 | 334.7 | 81.3 | |
Characteristics of realgar particles
The laser particle-size analyzer was used to determine particle-size distribution. Based on preliminary tests, ethylene glycol was selected as the dispersion medium, and the test samples were examined after pretreatment by ultrasonic dispersion for 10 minutes.
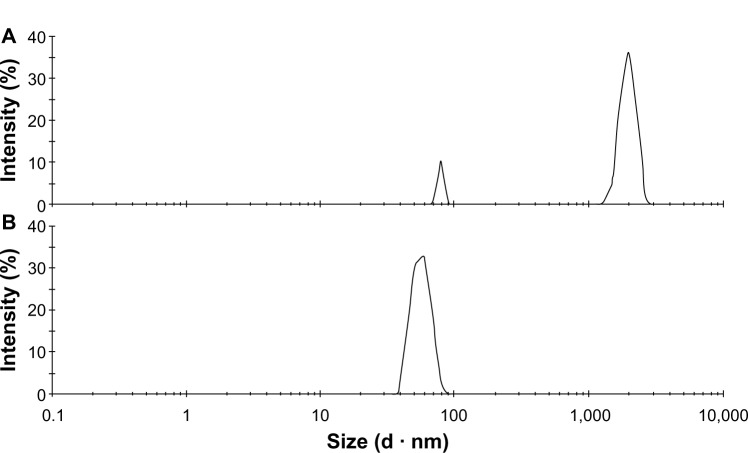
As shown in Figure 1, the particle-size distribution of untreated realgar showed two peaks: one peak of 89.5% at 1,985 nm, and the other of 10.5% at 87 nm. Also, the realgar NPs prepared under optimum conditions had only one peak – at 78 nm. After preparation under optimum conditions, the particle-size distribution became narrower and average particle size was markedly reduced.
Figure 1.
(A and B) Particle-size distribution of realgar. (A) Untreated; (B) prepared under the optimum condition.
The zeta potential is a parameter used to evaluate the stability of particles by measuring their surface charge. The measured zeta-potential values of realgar NPs and coarse realgar were −19.7±0.87 mV and −20.3±0.65 mV, respectively. The zeta potentials of realgar NPs and coarse realgar were not significantly different.
TEM and SEM were used to examine the morphologies of the two realgar preparations with different particle sizes. Figures 2 and 3 show the morphologies of the realgar NPs and coarse realgar observed by TEM and SEM. The particle sizes of realgar NPs and coarse realgar observed by TEM and SEM were about 100 nm and more than 1,000 nm, respectively.
Figure 2.
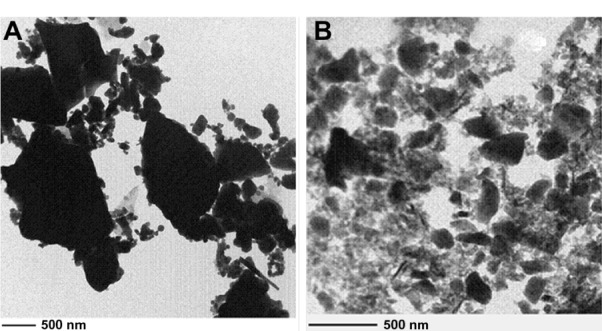
(A and B) TEM images of coarse realgar and realgar NPs prepared from the optimum condition. (A) Coarse realgar; (B) realgar NPs.
Abbreviations: TEM, transmission electron microscopy; NPs, nanoparticles.
Figure 3.
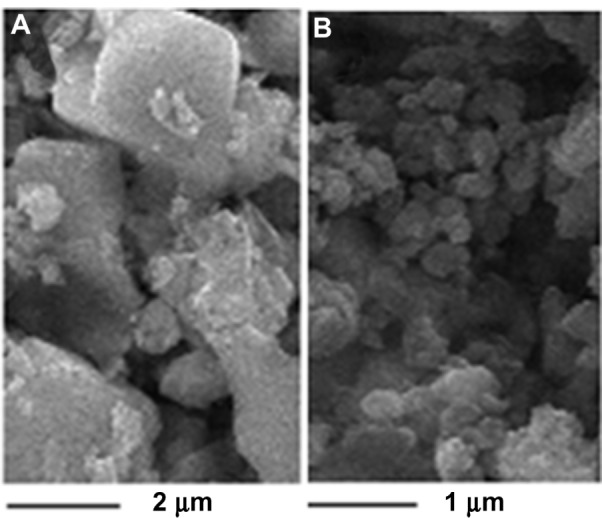
SEM images of coarse realgar and realgar NPs prepared from the optimum condition. (A) Coarse realgar; (B) realgar NPs.
Abbreviations: SEM, scanning electron microscopy; NPs, nanoparticles.
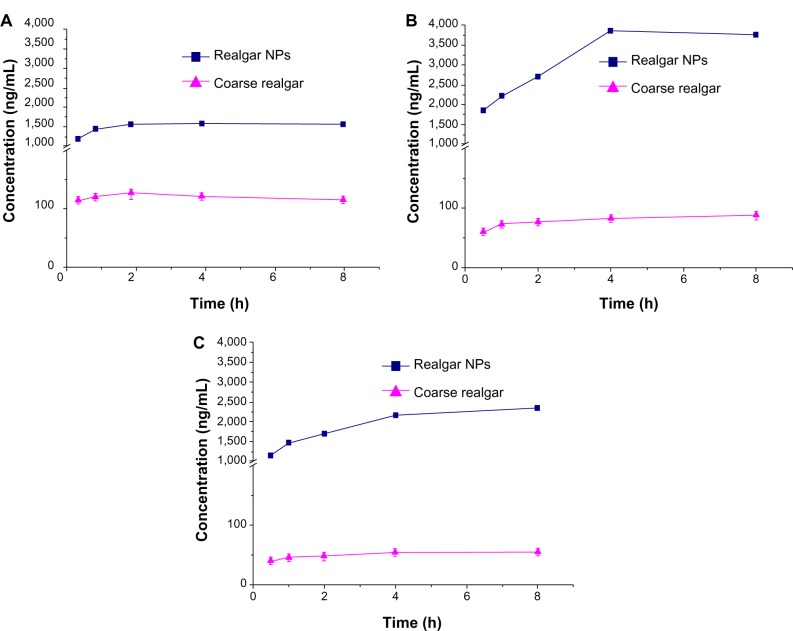
SEM-EDS was used to characterize the type and quantity of the components of realgar NPs and coarse realgar, and the results are shown in Table 4. The type and quantity of the components of realgar NPs were the same as those of coarse realgar. The dissolution results of realgar NPs and coarse realgar in different aqueous media are shown in Figure 4. The concentration of arsenic increased as the time increased, and moreover the arsenic concentration of realgar NPs was 10–45 times higher than that of coarse realgar over a period of 8 hours in different media. The results obtained indicated that reducing realgar particle size increased its solubility as well as dissolution velocity.
Table 4.
Elemental type and concentrations (wt%) of coarse realgar and realgar nanoparticles (NPs) obtained with SEM-EDS analysis
| Sample | Coarse realgar | Realgar NPs |
|---|---|---|
| As | 67.48 | 64.67 |
| S | 32.42 | 34.46 |
| Other elements | 0.11 | 0.86 |
| Total | 100.01 | 99.99 |
Abbreviations: SEM-EDS, scanning electron microscope energy-dispersive spectrometer; As, arsenic; S, sulfur.
Figure 4.
(A–C) Dissolution of arsenic from coarse realgar (triangles) and realgar NPs (squares) at different times. (A) Dissolution test in pH 1.2 media; (B) dissolution test in pH 7.4 media; (C) dissolution test in ultrapure water.
Note: Bars represent standard deviations (n=3).
Abbreviations: NPs, nanoparticles; h, hours.
Cytotoxicity of realgar NPs and coarse realgar on MCF7, HepG2, and A549 cell lines
The cytotoxicity of the two realgar preparations with different particle sizes was tested on the MCF7, HepG2, and A549 cell lines by comparing cell growth and survival. Five concentrations were selected. The cell viability of the selected cancer cell lines was inhibited in a dose-dependent manner after being exposed to the two kinds of realgar particle suspensions for 72 hours. The index-dose curves were obtained by Origin 7.5 (OriginLab, Northampton, MA, USA) by fitting data to a sigmoidal equation and the respective half-maximal inhibitory concentration (IC50) was estimated at the same time. The results are summarized in Table 5. It was found that both the realgar NPs and coarse realgar could significantly inhibit the viability of the selected cancer cell lines. By comparing the IC50 values of the respective realgar preparations on the cancer cell lines, realgar NPs were found to have higher cytotoxicity on the cell lines, with an IC50 less than 40 μM as As2S2 with insignificant differences between the different cell lines. The coarse realgar had IC50 values in the range of 100–400 μM.
Table 5.
IC50 (μM as As2S2) of coarse realgar and realgar NPs in different cell lines exposed for 72 hours
| Cell line
|
IC50 (μM as As2S2)
|
||
|---|---|---|---|
| Compound | MCF-7 | HepG2 | A549 |
| Coarse realgar | 397.34 | 104.36 | 170.92 |
| Realgar NPs | 39.88 | 34.27 | 30.32 |
Abbreviations: IC50, half-maximal inhibitory concentration; NPs, nanoparticles.
The cellular morphology changes induced by the two realgar preparations with different particle sizes were observed under a microscope. Figure 5 shows the morphologies of the representative MCF7, HepG2, and A549 cell lines at a concentration of 25 μg/mL for 48 hours. After treatment for a certain time, all cancer cells shrank and retracted from their neighbors. The number of cancer cells treated with realgar NPs decreased more markedly compared with the ones treated with coarse realgar.
Figure 5.
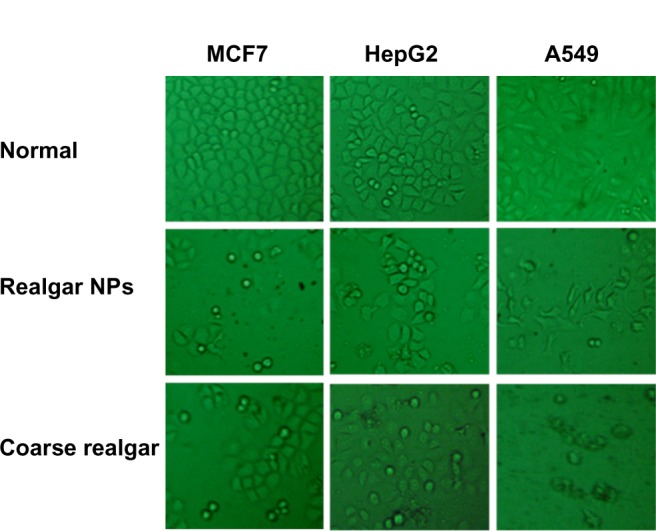
Morphologies of the representative MCF7, HepG2, and A549 cell lines (first line) and after drug (coarse realgar and realgar NPs) treatment (second and third lines) for 48 hours. All the photos were taken after removing the culture medium under a microscope.
Abbreviation: NPs, nanoparticles.
Time- and dose-dependent effects of realgar NPs and coarse realgar on MCF7, HepG2, and A549 cell lines
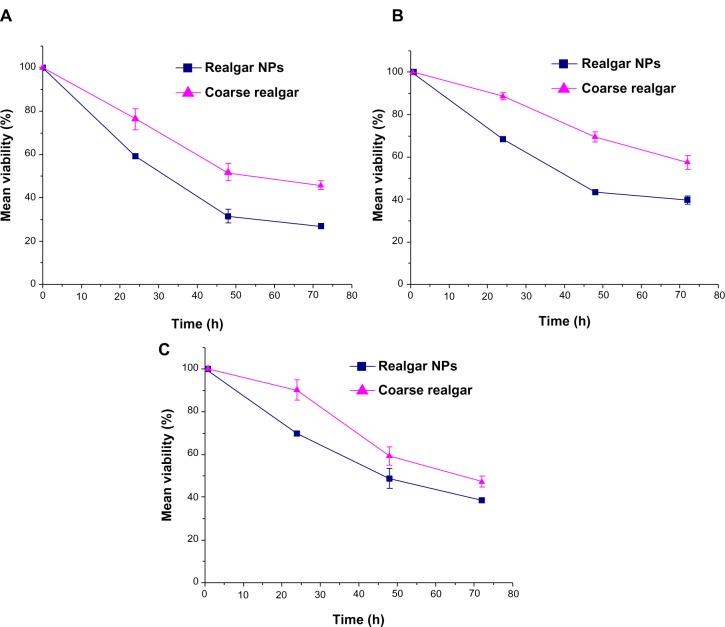
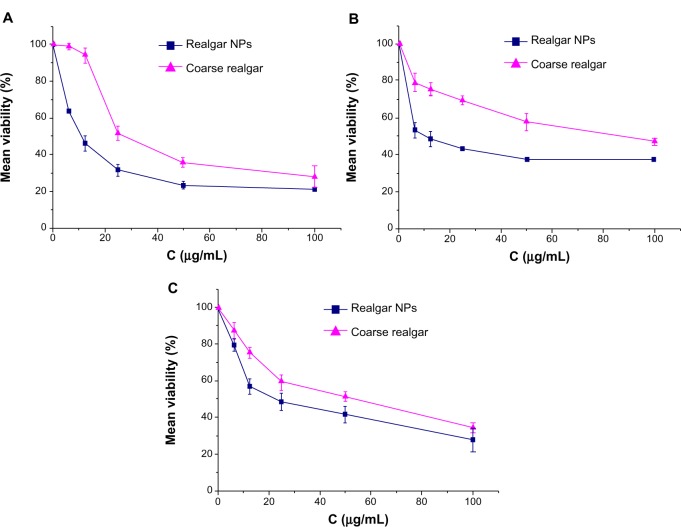
We used an MTT assay to assess the time- and dose-dependent effect of realgar NPs and coarse realgar on selected cell lines. Cell viability (%) decreased with increasing concentrations of suspensions of the two realgar preparations with different particle sizes over time, and in particular the viability of cells treated with realgar NPs decreased much more rapidly than ones treated with coarse realgar at the same concentration. As shown in Figure 6, all treatments induced statistically significant time-dependent death in selected cell lines. Likewise, cells exhibited a significant reduction in viability in response to an increase in the concentration of each treatment. Consistently, the cytotoxicity of realgar NPs was higher than that of coarse realgar at the same concentration (Figure 7).
Figure 6.
(A–C) Effect of coarse realgar (triangles) and realgar NPs (squares) on MCF7, HepG2, and A549 cell-line viability at different times. (A) Effect of coarse realgar and realgar NPs on the viability of MCF7; (B) effect of coarse realgar and realgar NPs on the viability of HepG2; (C) effect of coarse realgar and realgar NPs on the viability of A549.
Note: Bars represent standard deviations (n=3).
Abbreviations: NPs, nanoparticles; h, hours.
Figure 7.
Effect of coarse realgar (triangles) and realgar NPs (squares) on MCF7, HepG2, and A549 cell-line viability at different concentrations. (A) Effect of coarse realgar and realgar NPs on the viability of MCF7; (B) effect of coarse realgar and realgar NPs on the viability of HepG2; (C) effect of coarse realgar and realgar NPs on the viability of A549.
Note: Bars represent standard deviations (n=3).
Abbreviation: NPs, nanoparticles.
ICP-MS assay
This assay was validated (accuracy and precision within 15%) over the concentration ranges of 20–200 ng/mL for plasma and 100–1,000 ng/mL for tissue homogenate. Experiments showed that determinations in the range of 20–200 ng/mL and 100–1,000 ng/mL exhibited good linearity, accuracy, and precision.
Pharmacokinetic study
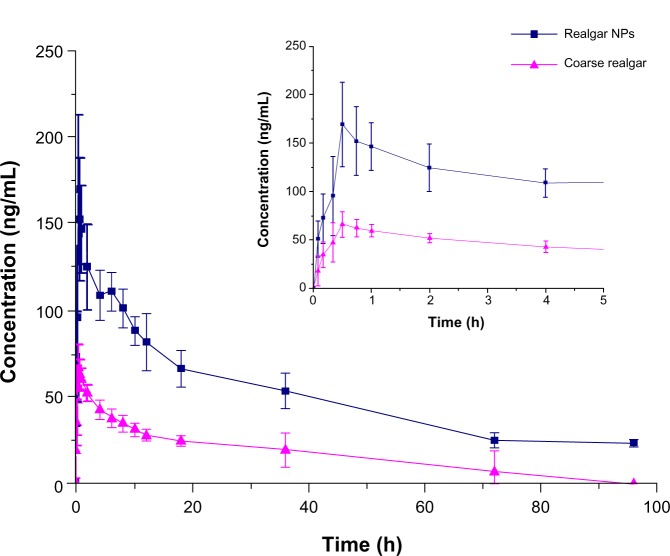
The plasma concentration–time profiles of arsenic after intragastric administration of realgar NPs and coarse realgar suspensions are shown in Figure 8, and the corresponding pharmacokinetic parameters are given in Table 6. The plasma concentration of arsenic was evaluated by ICP-MS, and is presented as nanograms of arsenic/mL plasma. After intragastric administration, arsenic was detected in rat plasma at the first blood-sampling time (5 minutes), and the plasma concentration of arsenic rapidly reached a peak at 31–38 minutes for both groups. Compared with the group given coarse realgar, a markedly higher concentration of arsenic (183.2±34.5 ng/mL) was observed in the group given realgar NPs, resulting in a prolonged presence of the arsenic in blood, with appreciable levels still present 18 hours after administration. When coarse realgar was given, the concentration of arsenic decreased to 50 ng/mL after 4 hours; the group given realgar NPs took 48 hours for the concentration of arsenic to fall to that level. The mean residence time from 0 to 24 hours (MRT0–24) values were 19.3±9.6 and 32.9±2.2 hours after administration of the two realgar preparations with different particle sizes. Meanwhile, the relative bioavailability of realgar NPs was 216.9% higher than coarse realgar. In addition, there were no significant differences in the elimination rates of realgar NPs and coarse realgar, with half-life (t½) values of 44.9±18.1 and 53.3±44.9 hours, respectively.
Figure 8.
Mean plasma concentration–time curves of arsenic in rats (n=6) following intragastric administration of 42 mg/kg of coarse realgar (triangles) and realgar NPs (squares).
Notes: Bars represent standard deviations; inset is detail with enlarged scale from 0 to 5 hours.
Abbreviations: NPs, nanoparticles; h, hours.
Table 6.
Pharmacokinetic parameters following intragastric administration of coarse realgar and realgar NPs (42 mg/kg)
| Parameter (unit) | Coarse realgar | Realgar NPs |
|---|---|---|
| AUC0–24 (ng · hour/L) | 1,282.284±586.233 | 4,796.257±479.885** |
| AUC0–∞ (ng · hour/L) | 2,829.721±2,078.491 | 6,136.348±897.428* |
| MRT0–24 (hours) | 19.295±9.619 | 32.875±2.23* |
| MRT0–∞ (hours) | 84.496±64.225 | 67.132±209.29 |
| t½ (hours) | 53.266±44.88 | 44.864±18.075 |
| Tmax (hours) | 0.514±0.134 | 0.639±0.24 |
| Cmax (ng/mL) | 68.167±10.917 | 183.15±34.466** |
Notes:
P<0.05
P<0.01 versus coarse realgar by t-test. Values are the means ± standard deviation of six rats.
Abbreviations: NPs, nanoparticles; AUC0–24, area under the concentration–time curve from 0 to 24 hours; AUC0–∞, area under the concentration curve from 0 to ∞ hours; MRT0–24, mean residence time from 0 to 24 hours; MRT0–∞, mean residence time from 0 to ∞ hours; t½, distribution half-life; Cmax, maximum concentration; Tmax, time to reach maximum concentration.
Biodistribution study
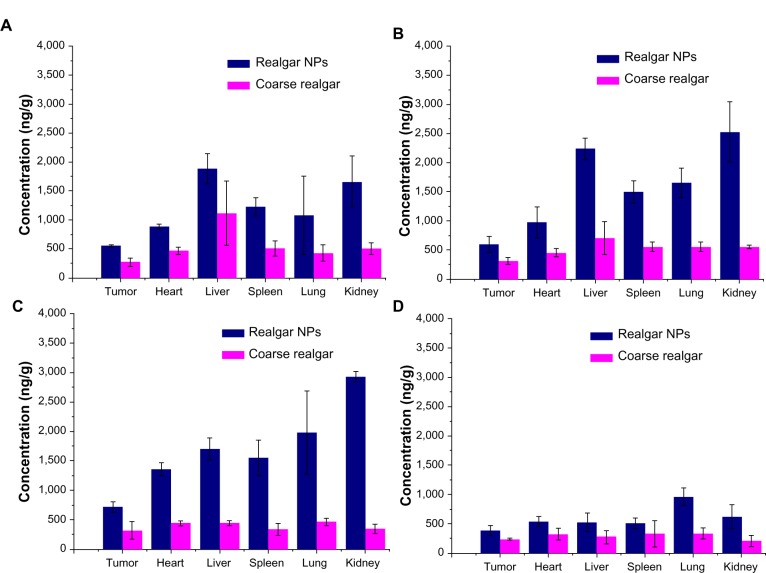
A comparison of the biodistribution of realgar NPs and coarse realgar was carried out in a tumor-bearing mouse model following intragastric administration. The concentration of arsenic in different tissues at 0.5, 1, 2, and 12 hours after intragastric administration of the two realgar preparations, with different particle sizes are presented in Figure 9. After intragastric administration of realgar NPs and coarse realgar, arsenic was rapidly distributed in different tissues, including the tumor tissue, and the concentration of arsenic after giving realgar NPs was higher than that after coarse realgar, while the maximum level of arsenic in tissues was observed 1–2 hours after administration. The arsenic concentration in tumor tissues of the realgar NP group was 2.0-fold higher than the coarse realgar group. The higher arsenic concentration in the tumors indicated that the increased bioavailability may result in higher antitumor activity with the reduction in particle size. As shown in Figure 9, it was found that the arsenic concentration in the realgar NP group in the heart, liver, spleen, and lung was 1.0–3.0-fold higher than that in the coarse realgar group, while the arsenic concentration in the kidney was 2.0–7.0-fold higher than that in the coarse realgar group, at the same time after administration, and with increasing time, the concentration gradually decreased. At 12 hours after treatment, the arsenic concentration in different tissues had fallen to a lower level.
Figure 9.
(A–D) Biodistribution of coarse realgar and realgar NPs. (A) After 0.5-hour intragastric administration; (B) after 1-hour intragastric administration; (C) after 2 hours intragastric administration; (D) after 12 hours intragastric administration.
Note: Bars represent standard deviations (n=3).
Abbreviation: NPs, nanoparticles.
Discussion
In recent years, research has found that orally administered realgar was highly effective and safe for both remission induction and maintenance at all stages of APL.5 A large number of in vitro studies have shown that realgar has a potentially curative effect in many kinds of cancers.20,24–30 At the same time, the high dosage required due to the low bioavailability prevents it from being used to treat other diseases. It has been estimated that roughly 40% of all investigated compounds fail to reach later phases of development due to poor bioavailability, often associated with poor water solubility.5 To extend the clinical use of realgar, there is an urgent need to improve the poor bioavailability due to low water solubility. Considering the properties of realgar and the possibility of mass production, the use of high-energy ball milling is the preferred method of reducing the particle size of realgar to increase its water solubility.
Materials crushed in the milling process are the result of the impact and abrasive effects of the grinding body. However, the crushing process is extremely complex, and it is generally agreed that the fundamental process during high-energy milling is repeated elastic deformation, plastic deformation, fragmentation, cold welding, microdiffusion recovery, recrystallization, amorphization crystallization, and/or chemical reactions of the powder particles. The milling process may involve subjection to repeated grinding compressive stress, resulting in inherent crack on the surface of the particles or new crack propagation, which lead to breakup or plastic deformation. Figures 2 and 3 show the surface morphology of the realgar NPs obtained by TEM and SEM. This shows that the shape of the NPs was not regular. Theories about the most basic material-crushing Griffith strength theory says that there is much solid material within the microcracks and defects, and to a certain extent when external force is applied, cracks begin to expand and produce fracture. Figure 10 schematically shows the process of crushing based on the Griffith strength theory. Due to this theory, the crushing process reduces the original material into small pieces, the shape of the NPs cannot be regular, and the regular shape of NPs prepared by the milling process needs to be confirmed.
Figure 10.
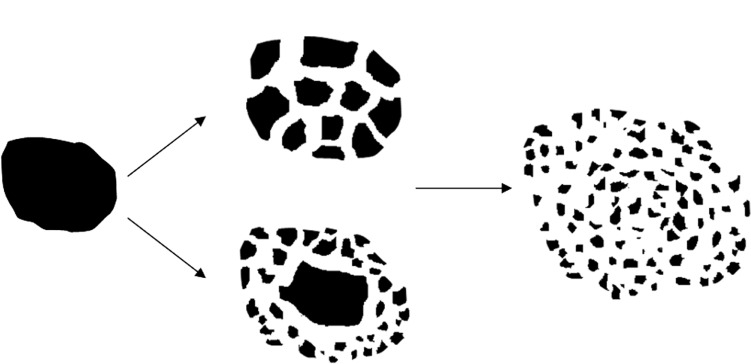
Schematic model of material crushing.
According to published results,2,16,17 the milling temperature is not a factor that affects the results most; nevertheless, we still chose −20°C to ensure rapid removal of the heat generated during the milling process to avoid realgar being oxidized by the heat. In addition, maintaining a lower temperature can also increase brittleness, making it easy to break down the material. The dissolution results showed that the solubility of realgar NPs was 10–45-fold higher than that of coarse realgar over 8 hours. Also, the SEM-EDS study showed that after milling, the nature and quantity of realgar remained unchanged, indicating that the properties of realgar could remain stable during the process of milling. Moreover, the results indicated that the increased solubility was likely due to the reduced particle size.
The results of the present studies also showed that realgar particles exhibited a size-dependent cytotoxicity effect.28 In order to establish a broader therapeutic role of realgar in cancer treatment and compare the cytotoxicity of two realgar preparations with different particle sizes, we carried out an experiment on different cancer cell lines (MCF7, HepG2, and A549). Data from an MTT assay and morphological changes produced by exposing these cancer cell lines to realgar preparations with different particle sizes showed that although coarse realgar could affect the cell viability of selected cancer cell lines, realgar NPs with a diameter of 78±8.3 nm inhibited cell viability more potently. By comparing the IC50 values of the different particle sizes of realgar on the selected cell lines, HepG2 and A549 were the cell lines that were most sensitive to realgar. Moreover, the survival index-dose curves (Figure 7) showed that realgar caused inhibition of cell viability in a dose-dependent manner. Similarly, the survival index-time curves (Figure 6) showed that the inhibition of cell viability by realgar took place in a time-dependent manner. These results indicate that realgar NPs might have a broader therapeutic role in cancer treatment. Accordingly, further experiments should be performed to study the mechanisms of cell apoptosis induced by realgar, and in addition the in vivo anticancer activity of realgar NPs and coarse realgar should be investigated in a suitable animal model that can evaluate in vivo anticancer activity.
Because of the limitations of the detection method, the bioavailability of realgar was only estimated by measuring the arsenic recovered in urine.1,2,35 In this study, ICP-MS was used, so the in vivo bioavailability of realgar was estimated from the plasma concentration of arsenic, which accurately reflects the absorption of arsenic, and the results showed that the relative bioavailability of realgar NPs was 216.9% higher than that of coarse realgar. After intragastric administration of the realgar NPs, plasma concentration significantly increased compared with that of the coarse realgar group over the same period. Peak intensity was higher, and the washout time was more prolonged than the coarse realgar over 24 hours. The studies were carried out under the same experimental conditions, so the increased bioavailability and plasma concentrations were due to the reduction in the size of the realgar particles. As seen from the plasma concentration–time curves (Figure 8), the plasma peak concentration after intragastric administration of realgar NPs was 1.7 times higher than that after administration of coarse realgar, and the concentration of arsenic was maintained at over 50 ng/mL for 18 hours. Moreover, compared with the coarse realgar group, an MRT0–24 of 32.9±2.2 hours in the realgar NP group was observed in this study. This suggests that when realgar NPs are selected as a therapeutic option, a smaller dosage given less frequently might achieve the same curative effect as that produced by coarse realgar.
H22 cells are the most common mouse tumor cell lines, widely used in mouse tumor animal models. A higher concentration of arsenic in the tumor site was observed after administration of realgar NPs. Although the tumor-bearing mouse model we chose had its limitations, the results also indicated increased bioavailability, resulting in an enhanced antitumor effect to some extent. Further studies of the in vivo anticancer activity should be carried out using more suitable animal models.
After administration of coarse realgar, the concentration of arsenic in various tissues was maintained at a low level without any obvious differences, while realgar NPs produced marked changes in the concentration of arsenic in various tissues, especially in the liver and kidney. A higher arsenic concentration improves drug efficacy, and at the same time a reduction in dosage. Our data indicated that realgar NPs can produce a higher level in the tumor and liver, so it might be an optimum drug for the treatment of some liver diseases without the need for high dosage. Therefore, a biodistribution study was performed to increase our understanding of the in vivo behavior of realgar NPs in order to help promote clinical rational drug use.
Conclusion
The influence of the weight of realgar, milling time, milling speed, and milling temperature was investigated by the orthogonal experiment method. According to the results of the orthogonal experiments, the weight of realgar had the greatest effect on the particle size, followed by milling speed and milling time. The orthogonal results showed that milling temperature had less of an effect on the particle size of the final realgar NPs, but the use of liquid nitrogen was required to maintain a low temperature to avoid the realgar being oxidized during the milling process and also help increase the brittleness of the material to make it easier to be crushed. The realgar NPs prepared under these optimized conditions possessed the smallest average particle size.
To determine arsenic in plasma, this paper used a specific and sensitive analytical technique – ICP-MS. The results obtained showed that bioavailability was enhanced and elimination time prolonged after nanosize particles were obtained. Low bioavailability limits the clinical use of realgar; however, the use of realgar NPs could overcome the limitations associated with their poor water solubility and increase the scope for their future clinical use.
Acknowledgments
We would like to thank Dr Huan Qi for her support with the cell experiments.
Footnotes
Disclosure
The authors report no conflicts of interest in this work.
References
- 1.Frankenberger WT. Environmental Chemistry of Arsenic. Boca Raton (FL): CRC; 2002. [Google Scholar]
- 2.Wu JZ, Ho PC. Evaluation of the in vitro activity and in vivo bioavailability of realgar nanoparticles prepared by cryo-grinding. Eur J Pharm Sci. 2006;29(1):35–44. doi: 10.1016/j.ejps.2006.05.002. [DOI] [PubMed] [Google Scholar]
- 3.Wu J, Shao Y, Liu J, Chen G, Ho PC. The medicinal use of realgar (As4S4) and its recent development as an anticancer agent. J Ethnopharmacol. 2011;135(3):595–602. doi: 10.1016/j.jep.2011.03.071. [DOI] [PubMed] [Google Scholar]
- 4.Lu DP, Wang Q. Current study of APL treatment in China. Int J Hematol. 2002;76(Suppl 1):316–318. doi: 10.1007/BF03165273. [DOI] [PubMed] [Google Scholar]
- 5.Lu DP, Qiu JY, Jiang B, et al. Tetra-arsenic tetra-sulfide for the treatment of acute promyelocytic leukemia: a pilot report. Blood. 2002;99(9):3136–3143. doi: 10.1182/blood.v99.9.3136. [DOI] [PubMed] [Google Scholar]
- 6.Shilin H, Aixia G, Yang X. Clinical study on the treatment of acute promyelocytic leukemia mainly with composite indigo naturalis tablets. Zhonghua Xue Ye Xue Za Zhi. 1995;16(1):26–28. [Google Scholar]
- 7.Mao JH, Sun XY, Liu JX, et al. As4S4 targets RING-type E3 ligase c-CBL to induce degradation of BCR-ABL in chronic myelogenous leukemia. Proc Natl Acad Sci U S A. 2010;107(50):21683–21688. doi: 10.1073/pnas.1016311108. [DOI] [PMC free article] [PubMed] [Google Scholar]
- 8.Offergelt J, Roels H, Buchet J, Boeckx M, Lauwerys R. Relation between airborne arsenic trioxide and urinary excretion of inorganic arsenic and its methylated metabolites. Br J Ind Med. 1992;49(6):387–393. doi: 10.1136/oem.49.6.387. [DOI] [PMC free article] [PubMed] [Google Scholar]
- 9.Dong JT, Luo XM. Effects of arsenic on DNA damage and repair in human fetal lung fibroblasts. Mutat Res. 1994;315(1):11–15. doi: 10.1016/0921-8777(94)90022-1. [DOI] [PubMed] [Google Scholar]
- 10.Lee TC, Oshimura M, Barrett JC. Comparison of arsenic-induced cell transformation, cytotoxicity, mutation and cytogenetic effects in Syrian hamster embryo cells in culture. Carcinogenesis. 1985;6(10):1421–1426. doi: 10.1093/carcin/6.10.1421. [DOI] [PubMed] [Google Scholar]
- 11.Williamson EM, Lorenc A, Booker A, Robinson N. The rise of traditional Chinese medicine and its materia medica: a comparison of frequency and safety of materials and species used in Europe and China. J Ethnopharmacol. 2013;149(2):453–462. doi: 10.1016/j.jep.2013.06.050. [DOI] [PubMed] [Google Scholar]
- 12.Beak DG, Basta NT, Scheckel KG, Traina SJ. Bioaccessibility of arsenic(V) bound to ferrihydrite using a simulated gastrointestinal system. Environ Sci Technol. 2006;40(4):1364–1370. doi: 10.1021/es0516413. [DOI] [PubMed] [Google Scholar]
- 13.Mainardes RM, Urban MC, Cinto PO, et al. Colloidal carriers for ophthalmic drug delivery. Curr Drug Targets. 2005;6(3):363–371. doi: 10.2174/1389450053765914. [DOI] [PubMed] [Google Scholar]
- 14.Bittner B, Mountfield R. Intravenous administration of poorly soluble new drug entities in early drug discovery: the potential impact of formulation on pharmacokinetic parameters. Curr Opin Drug Discov Devel. 2002;5(1):59–71. [PubMed] [Google Scholar]
- 15.Moghimi SM, Hunter AC, Murray JC. Nanomedicine: current status and future prospects. FASEB J. 2005;19(3):311–330. doi: 10.1096/fj.04-2747rev. [DOI] [PubMed] [Google Scholar]
- 16.Baláž P, Fabián M, Pastorek M, Cholujová D, Sedlák J. Mechanochemical preparation and anticancer effect of realgar As4S4 nanoparticles. Mater Lett. 2009;63(17):1542–1544. [Google Scholar]
- 17.Baláž P, Dutková E. Mechanochemistry of sulphides. J Therm Anal Calorim. 2007;90(1):85–92. [Google Scholar]
- 18.Wang XB, Gao HY, Hou BL, Huang J, Xi RG, Wu LJ. Nanoparticle realgar powders induce apoptosis in u937 cells through caspase MAPK and mitochondrial pathways. Arch Pharm Res. 2007;30(5):653–658. doi: 10.1007/BF02977662. [DOI] [PubMed] [Google Scholar]
- 19.Zhan XQ, Guo LW, Fu TM, Yuan HY. A study on preparation and diameter determination of realgar granule of micron or nanometer dimension. J Nanjing Univ Tradit Chin Med. 2003;19(1):24–25. [Google Scholar]
- 20.Ning N, Peng Z, Yuan L, Gou B, Zhang T, Wang K. Realgar nanoparticles induce apoptosis and necrosis in leukemia cell lines K562 and HL-60. Zhongguo Zhong Yao Za Zhi. 2005;30(2):136–140. Chinese. [PubMed] [Google Scholar]
- 21.Shen XC, Guo YF, Wei J, Liang H. Twenty-Fifth Chinese Chemical Society Annual Conference Abstract Book. Chinese Chemical Society; Tianjin, People’s Republic of China: 2006. Preparation and the biological effects of realgar nanoparticles. [Google Scholar]
- 22.Wang J, Loh KP, Wang Z, et al. Fluorescent nanogel of arsenic sulfide nanoclusters. Angew Chem Int Ed Engl. 2009;48(34):6282–6285. doi: 10.1002/anie.200900586. [DOI] [PubMed] [Google Scholar]
- 23.Baláž P, Bujňáková Z, Kartachova O, Fabián M, Stalder B. Properties and bioaccessibility of arsenic sulphide nanosuspensions. Mater Lett. 2013;(104):84–86. [Google Scholar]
- 24.Wang N, Wang LW, Gou BD, Zhang TL, Wang K. Realgar-induced differentiation is associated with MAPK pathways in HL-60 cells. Cell Biol Int. 2008;32(12):1497–1505. doi: 10.1016/j.cellbi.2008.08.017. [DOI] [PubMed] [Google Scholar]
- 25.Ye HQ, Gan L, Yang XL, Xu HB. Membrane toxicity accounts for apoptosis induced by realgar nanoparticles in promyelocytic leukemia HL-60 cells. Biol Trace Elem Res. 2005;103(2):117–132. doi: 10.1385/BTER:103:2:117. [DOI] [PubMed] [Google Scholar]
- 26.Luo LY, Huang J, Gou BD, Zhang TL, Wang K. Induction of human promyelocytic leukemia HL-60 cell differentiation into monocytes by arsenic sulphide: involvement of serine/threonine protein phosphatases. Leuk Res. 2006;30(11):1399–1405. doi: 10.1016/j.leukres.2006.03.016. [DOI] [PubMed] [Google Scholar]
- 27.Wu JZ, Ho PC. Comparing the relative oxidative DNA damage caused by various arsenic species by quantifying urinary levels of 8-hydroxy-2′-deoxyguanosine with isotope-dilution liquid chromatography/mass spectrometry. Pharm Res. 2009;26(6):1525–1533. doi: 10.1007/s11095-009-9865-7. [DOI] [PubMed] [Google Scholar]
- 28.Deng Y, Xu H, Huang K, Yang X, Xie C, Wu J. Size effects of realgar particles on apoptosis in a human umbilical vein endothelial cell line: ECV-304. Pharmacol Res. 2001;44(6):513–518. doi: 10.1006/phrs.2001.0885. [DOI] [PubMed] [Google Scholar]
- 29.Bode AM, Dong Z. The paradox of arsenic: molecular mechanisms of cell transformation and chemotherapeutic effects. Crit Rev Oncol Hematol. 2002;42(1):5–24. doi: 10.1016/s1040-8428(01)00215-3. [DOI] [PubMed] [Google Scholar]
- 30.Xi RG, Huang J, Li D, Wang XB, Wu LJ. Roles of PI3-K/Akt pathways in nanoparticle realgar powders-induced apoptosis in U937 cells. Acta Pharmacol Sin. 2008;29(3):355–363. doi: 10.1111/j.1745-7254.2008.00759.x. [DOI] [PubMed] [Google Scholar]
- 31.Liu J, Lu Y, Wu Q, Goyer RA, Waalkes MP. Mineral arsenicals in traditional medicines: orpiment, realgar, and arsenolite. J Pharmac Exp Ther. 2008;326(2):363–368. doi: 10.1124/jpet.108.139543. [DOI] [PMC free article] [PubMed] [Google Scholar]
- 32.Buchet J, Lauwerys R, Roels H. Urinary excretion of inorganic arsenic and its metabolites after repeated ingestion of sodium metaarsenite by volunteers. Int Arch Occup Environ Health. 1981;48(2):111–118. doi: 10.1007/BF00378431. [DOI] [PubMed] [Google Scholar]
- 33.Hansen MB, Nielsen SE, Berg K. Re-examination and further development of a precise and rapid dye method for measuring cell growth/cell kill. J Immunol Methods. 1989;119(2):203–210. doi: 10.1016/0022-1759(89)90397-9. [DOI] [PubMed] [Google Scholar]
- 34.Carmichael J, DeGraff WG, Gazdar AF, Minna JD, Mitchell JB. Evaluation of a tetrazolium-based semiautomated colorimetric assay: assessment of chemosensitivity testing. Cancer Res. 1987;47(4):936–942. [PubMed] [Google Scholar]
- 35.Cui X, Kobayashi Y, Hayakawa T, Hirano S. Arsenic speciation in bile and urine following oral and intravenous exposure to inorganic and organic arsenics in rats. Toxicol Sci. 2004;82(2):478–487. doi: 10.1093/toxsci/kfh265. [DOI] [PubMed] [Google Scholar]


