

Background: XPD is important for DNA lesion recognition by the nucleotide excision repair (NER) system.
Results: Dependent on the lesion type, XPD recognizes lesions either on the protein-translocated or on the nontranslocated DNA strand.
Conclusion: XPD employs different recognition strategies for different types of damage.
Significance: Different lesion-specific recognition approaches may enhance the remarkably broad target spectrum of NER.
Keywords: Atomic Force Microscopy, DNA Damage, DNA Helicase, DNA Repair, Single Molecule Biophysics, DNA Lesion Recognition, Protein-DNA Interactions
Abstract
Recognition and removal of DNA damages is essential for cellular and organismal viability. Nucleotide excision repair (NER) is the sole mechanism in humans for the repair of carcinogenic UV irradiation-induced photoproducts in the DNA, such as cyclobutane pyrimidine dimers. The broad substrate versatility of NER further includes, among others, various bulky DNA adducts. It has been proposed that the 5′-3′ helicase XPD (xeroderma pigmentosum group D) protein plays a decisive role in damage verification. However, despite recent advances such as the identification of a DNA-binding channel and central pore in the protein, through which the DNA is threaded, as well as a dedicated lesion recognition pocket near the pore, the exact process of target site recognition and verification in eukaryotic NER still remained elusive. Our single molecule analysis by atomic force microscopy reveals for the first time that XPD utilizes different recognition strategies to verify structurally diverse lesions. Bulky fluorescein damage is preferentially detected on the translocated strand, whereas the opposite strand preference is observed for a cyclobutane pyrimidine dimer lesion. Both states, however, lead to similar conformational changes in the resulting specific complexes, indicating a merge to a “final” verification state, which may then trigger the recruitment of further NER proteins.
Introduction
Maintenance of genomic integrity is one of the most important cellular tasks and is largely achieved by a number of different DNA repair systems targeting diverse types of DNA lesions, such as erroneous alterations in the genetic code, chemical base modifications, or bulky adducts (1, 2). Nucleotide excision repair (NER)2 is an essential DNA repair mechanism with an exceptionally large range of chemically and structurally unrelated targets. In humans, it is furthermore the only repair system for the removal of UV irradiation-induced damages, and dysfunctional NER is responsible for severe diseases including xeroderma pigmentosum (3, 4). Eukaryotic NER encompasses a total of ∼30 proteins, including the xeroderma pigmentosum group proteins (XPA–XPG). In the current model of NER, repair can either be initiated by a stalled RNA polymerase in transcription coupled NER or via global genome NER through high affinity binding of the XPC-HR23B heterotrimer to short distorted and destabilized DNA structures containing ss/dsDNA junctions (1–4). The ATPase/helicase XPB, which is part of the 10 subunit transcription factor IIH (TFIIH) complex, directly interacts with XPC (5), and ATP-dependent conformational rearrangements of XPB likely further enhance the size of the nascent DNA bubble (6). XPD, the second helicase within TFIIH, is a functional 5′-3′ helicase, and its helicase activity is exploited to further increase the size of the unpaired region (7) to permit the binding of additional NER factors. More importantly, however, XPD has been proposed to assume a central role in damage verification (8–12). Once the damage has been verified, the NER cascade proceeds with the recruitment of additional proteins including the endonucleases XPG and XPF-ERCC1, resulting in the excision of a 24–32-nt oligonucleotide containing the lesion (13–15).
Within a DNA repair mechanism, the process of verifying a target site is of paramount importance, because this step affords a mechanism the high specificity that grants efficient processing of cytotoxic or carcinogenic DNA lesions while preventing futile repair. Crystal structures of XPD from different archaeal organisms have provided valuable insight into the general architecture of this enzyme (8, 9, 16). Archaeal XPDs share high sequence homology with the human XPD protein and are exploited as model systems for analyses of the structure and function of their human counterpart (8–12, 16, 17). In our studies, we used XPD from the archaeal organism Thermoplasma acidophilum (taXPD). The enzyme consists of four domains: two RecA-like helicase domains, a domain coordinating an iron-sulfur cluster, and an arch domain. The iron-sulfur and arch domains together with helicase domain 1 comprise a narrow pore with ∼1-nm diameter (8, 9). In addition, the crystal structure of taXPD in complex with a short stretch of ssDNA, as well as reverse footprinting analysis, have led to a model of the possible path of the DNA across the enzyme (11, 18). In this model, the DNA threads through the protein pore and is in close proximity to the iron-sulfur cluster, consistent with a proposed role of such clusters in DNA damage investigation (19–23) and the recent identification of a dedicated lesion recognition pocket near the pore (12). However, the exact mechanism of lesion verification by and in particular the impressive substrate versatility of XPD remained elusive so far.
We used the single molecule technique of atomic force microscopy (AFM) to directly visualize individual XPD-DNA complexes at nanometer resolution. By introducing a specific lesion at a known position in long DNA fragments (916 base pairs), we created substrates that more closely resemble the naturally occurring in vivo substrates than the short DNA oligonucleotides utilized with other methods for the analysis of protein-DNA interactions. Importantly, the exact knowledge of the lesion position within the DNA substrate allows us to distinguish between specifically bound protein complexes (bound at the lesion site) and nonspecifically bound complexes (bound elsewhere on homoduplex DNA). We exploited this approach to investigate the ability of XPD to recognize and verify two different types of lesions and to directly visualize conformational responses of the complexes to damage verification. The lesions are representatives of two distinct classes of damages repaired by NER, a fluorescein as a representative for bulky DNA adducts (24–26), and a cyclobutane pyrimidine dimer (CPD) as the major species of DNA damage resulting from UV radiation (27, 28). Our data clearly demonstrate specific stalling of taXPD at these target sites upon ATP-driven translocation on long DNA substrates. Most notably, however, our AFM data unambiguously show different DNA strand selectivity for the two lesions, indicating that taXPD utilizes distinct verification strategies for structurally diverse types of DNA damage.
EXPERIMENTAL PROCEDURES
Protein Expression and Purification
XPD from T. acidophilum (wild-type and K170A variant) was expressed and purified as described previously (8). Briefly, expression at 14 °C for 18 h of the N-terminally His-tagged protein in Escherichia coli BL21-CodonPlus (DE3)-RIL cells (Stratagene) was induced with 0.1 mm isopropyl-β-thiogalactoside. XPD was purified by metal affinity (nickel-nitrilotriacetic acid; Invitrogen) followed by size exclusion chromatography (HiLoad 26/60 Superdex 200 prep grade; GE Healthcare) in 50 mm Tris, pH 8.0, 300 mm NaCl, and 1 mm DTT.
DNA Substrates
DNA substrates for AFM and biolayer interferometry are listed in Table 1. The plasmid pUC19N (2,729 bp), kindly provided by S. Wilson's laboratory (NIEHS, National Institutes of Health), served as circular DNA for the AFM experiments and as the basis for the 916-bp linear specific DNA substrates. The linear DNA substrates for AFM experiments were prepared as described previously (29). Details are given in the supplemental materials. Briefly, the modified DNA plasmid pUC19N contains closely spaced restriction sites of the nickase Nt.BstNBI (New England Biolabs). Incubation with Nt.BstNBI followed by heating in the presence of an excess of complementary oligonucleotide results in the removal of the ssDNA stretch between the nick positions, which can subsequently be replaced by a substrate containing a particular specific target site (listed in Table 1). Each step of the DNA substrate preparation was confirmed using restriction enzyme assay testing (supplemental Fig. S1). For AFM experiments, linear DNA fragments of 916-bp length containing either a fluorescein or a CPD lesion at 28–33% of the fragment length (depending on the presence and position of a DNA bubble directly surrounding the lesion or 5′ or 3′ of the lesion; see Table 1) were produced by digestion of the DNA with the restriction enzymes SspI and BspQI (NEB). All DNA fragments were purified by gel extraction (NucleoSpin Extract II kit; Macherey-Nagel) prior to the experiments. For biolayer interferometry, DNA oligomer A (Table 1) was obtained with a 3′ biotin modification (Integrated DNA Technologies) and annealed with complementary oligomers (Table 1, substrates B–L) at equimolar amounts.
TABLE 1.
DNA substrates for AFM and BLI experiments
The sequences that form the DNA bubbles are underlined. F, fluorescein adducted thymine; [CPD], cyclobutane pyrimidine (thymine) dimerized with 3′ thymine. For DNA substrates for AFM studies, only the insert is shown (see “Experimental Procedures”). For BLI, substrate A was purchased with a biotin group attached at the 3′ end.
| Substrate | DNA sequence | |
|---|---|---|
| A | Bottom strand | GGT CGA CTC TAG AGG ATC AGA TCT GGT ACC TCT AGA CTC GAG GCA TGC |
| B | Top −/− | GCA TGC CTC GAG TCT AGA GGT ACC AGA TCT GAT CCT CTA GAG TCG ACC |
| C | Top −/ bubble (8 nt) | GCA TGC CTC GAG TCT AGA CTC TTT CCA TCT GAT CCT CTA GAG TCG ACC |
| D | Top F/bubble (8 nt) | GCA TGC CTC GAG TCT AGA CTC FTT CCA TCT GAT CCT CTA GAG TCG ACC |
| E | Top F/bubble (14 nt) | GCA TGC CTC GAG TCT AGT CTC GT CCF ATA TAT CCT CTA GAG TCG ACC |
| F | Top F/5′ bubble (8 nt) | GCA TGC CTC GTC AAA TCT GGT ACC AGA TCT GAT CCT CTA GAG TCG FCC |
| G | Top F/3′ bubble (8 nt) | GCA TGC CFC GAG TCT AGA GGT ACC AGA TCT CTA AAG TAA GAG TCG ACC |
| H | Top F/− | GCA TGC CTC GAG TCT AGA GGT FCC AGA TCT GAT CCT CTA GAG TCG ACC |
| I | Top CPD/bubble (8 nt) | GCA TGC CTC GAG TCT AGA CTC [CPD] TT CCA TCT GAT CCT CTA GAG TCG ACC |
| J | Top CPD/5′ bubble (8 nt) | GCA TGC CTC GTC AAA TCT GGT ACC AGA TCT GAT CCT CTA GA [CPD] TCG ACC |
| K | Top CPD/3′ bubble (8 nt) | GCA TGC [CPD]TC GAG TCT AGA GGT ACC AGA TCT CTA AAG TAA GAG TCG ACC |
| L | Top CPD/− | GCA TGC CTC GAG TCT AGA GG [CPD] TCC AGA TCT GAT CCT CTA GAG TCG ACC |
Biolayer Interferometry DNA Binding Assay
DNA binding affinities were measured by biolayer interferometry (BLI) on an Octet RED system (Fortebio, Menlo Park, CA) using 50 nm DNA and 100–300 nm XPD for the DNA substrates containing ssDNA regions and 100 nm DNA and 400–500 nm XPD for fully dsDNA substrates. The binding assays were carried out in XPD incubation buffer (20 mm Tris, pH 8.5, 10 mm KCl, 5 mm MgCl2, 1 mm EDTA, 5 mm DTT) supplemented with 0.1 mg/ml BSA and were performed in at least triplicate and with three different protein batches. In BLI, the thickness of protein molecular layers bound to DNA immobilized on the surface of a streptavidin-coated fiber optic sensor (ForteBio) is determined from the interference of light reflected from the sensor surface. DNA oligomers (Table 1) were purchased with a biotin group attached to the 3′ end of the bottom strand and coupled to the sensor surface via streptavidin-biotin interaction. DNA loading concentrations were optimized in a concentration series for the individual DNA substrates. Assuming a 1:1 binding model, dissociation (kdis) and association rate constants (kass) were determined with the Octet data analysis software from increased and decreased attached protein layer thicknesses. Dissociation constants (KD; Table 2) were calculated as the ratio of dissociation and association rate constants for applied protein concentration c.
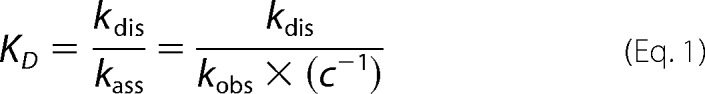 |
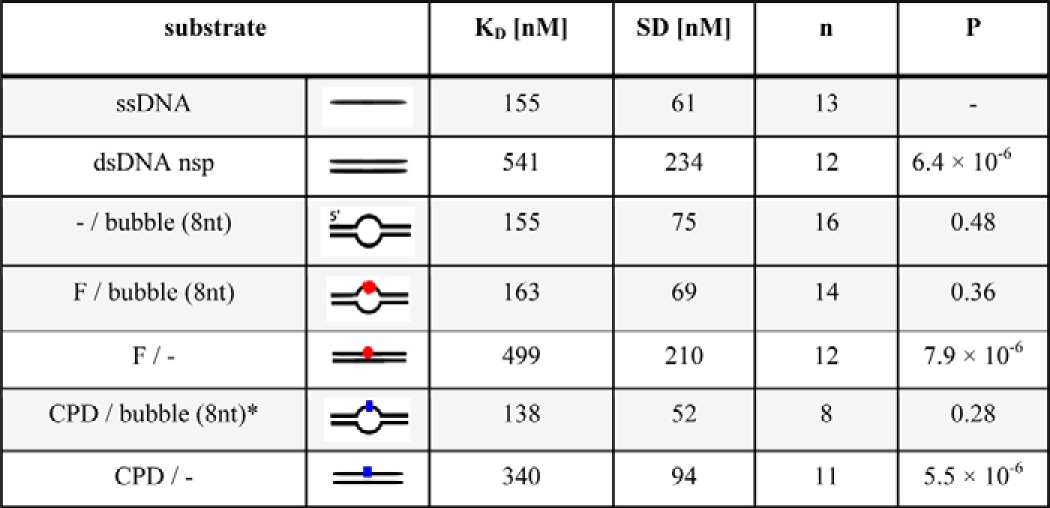
TABLE 2.
DNA binding affinities
DNA binding affinities were obtained by BLI for different DNA substrates (as schematically indicated). Equilibrium constants are given as means (KD) ± S.D. from n repeated experiments using three (or two) independent protein purifications. Although the variance in results is quite large between these types of measurements (average S.D. ∼40%), the differences between affinities to ssDNA and dsDNA that did not contain any unpaired regions (dsDNA nsp, F/−, CPD/−) was highly significant (*** between white and gray rows, P < 10−5). In contrast, affinities for ssDNA and DNA containing a bubble (−/bubble, F/bubble, CPD/bubble) were similar (gray rows, P ≥ 0.28). Interestingly, dsDNA containing a CPD modification but no unpaired region (CPD/−) was bound by XPD with significantly higher affinity than homoduplex DNA (**, P = 0.0095), indicating the presence of a small distortion in the DNA induced by the intrastrand lesion. P values in the table are given relative to ssDNA substrate.
Atomic Force Microscopy Experiments
Incubations for AFM experiments were carried out at 350 nm XPD (wild-type or K170A) and 15 nm DNA substrate (see above and Table 1) for 30 min at 37 °C in XPD incubation buffer (see “Biolayer Interferometry DNA Binding Assay” above) ± 2 mm ATP or ATPγS. DNA substrates were heated to 65 °C for 10 min and slowly cooled down to ambient temperature prior to incubation to remove salt microcrystals that may form during storage. For sample deposition, the incubations were diluted 8-fold in AFM deposition buffer (25 mm HEPES, pH 7.5, 25 mm sodium acetate, 10 mm magnesium acetate) to a final volume of 20 μl and immediately pipetted onto freshly cleaved mica (Grade V; SPI Supplies), rinsed with ultra-pure deionized water and dried in a gentle stream of nitrogen. In the rinsing step, the negatively charged DNA polymers (± bound proteins) are stably chelated to the negative charges on the mica surface (at pH 7.5) by Mg2+ ions in the applied buffer (29). Free protein molecules in the incubation also deposit and are fixed by the drying procedure on the substrate surface. For the visualization of minute protein-DNA complexes, mica is superior as an AFM substrate to all other currently known materials (29). This layered silicate provides extremely clean, flat, and smooth surface properties with typical surface roughness of 0.05 nm (root mean square) and the further advantage of rapid and easy experimental sample preparation (29). AFM images were captured with a molecular force probe 3D-Bio AFM (Asylum Research, Santa Barbara, CA) in tapping mode using OMCL-AC240TS (Olympus) noncontact/tapping mode silicon probes with spring constants of ∼2 n/m and resonance frequencies of ∼75 kHz. Images were collected at a scan speed of 2.5 μm/s with scan sizes of 2 μm × 2 μm, 4 μm × 4 μm, or 8 μm × 8 μm and pixel resolution of ∼2 nm.
AFM Data Analysis
AFM images were third order plane-fitted and flattened using Asylum Research software on Igor Pro and subsequently analyzed using ImageJ (National Institutes of Health) similarly as described previously (30, 31). Example images for several representative conditions are shown in Fig. 1 and supplemental Figs. S2 and S3. DNA aggregates and fragments that were cut off by the image margins were excluded from analysis. For quantification of DNA coverage with protein (Fig. 1B), experiments were carried out at least in triplicate for each substrate and condition, with n = 340–876 DNA bound protein peaks for each substrate type (representative images in supplemental Fig. S2). DNA fragments and XPD-DNA complexes in the AFM images were counted to obtain binding densities per bp as shown in Equation 2.
 |
To exclude the possibility that protein molecules located on DNA in the images were merely accidentally co-localized upon sample deposition instead of being bound to DNA, experiments were also repeated with a protein (of similar size) involved in the regulation of neuronal synapses. This protein is not expected to display any significant degree of DNA binding, consistent with a significantly reduced degree of DNA coverage ((0.6 ± 0.1)/1,813-bp DNA compared with (1 ± 0.2) and (1.8 ± 0.5) for XPD in the presence and absence of ATP, respectively (p = 0.000019 and 0.00015, respectively), from analyses of three to seven independent experiments; supplemental Fig. S4).
FIGURE 1.

DNA binding by XPD. A, AFM image of XPD bound to circular pUC19N plasmid DNA (for example, arrows) in the presence of ATP. B, protein coverage of different DNA substrates in the presence (black) and absence (gray) of ATP: circular, pUC19N plasmid; linear substrates: nsp, linearized full-length pUC19N (2,729 bp) and 1,813-bp fragment; bubble, 916-bp fragment containing a 8-nt DNA bubble at ∼31% of the fragment length; F/bubble, 916-bp fragment containing a fluorescein (F) within the context of a DNA bubble at ∼31% of the fragment length. Protein coverage is normalized to the number of base pairs of the different DNA substrates. Additional AFM images for the different DNA substrates and ATP conditions are shown in supplemental Fig. S2. C, AFM image of XPD bound to linear F/bubble DNA, in the presence of ATP. Arrows indicate examples for specific (at ∼31% DNA length) and nonspecific XPD-DNA complexes in yellow and white, respectively, as well as for an end bound complex in red. D, XPD binding position distributions on F/bubble DNA substrate in the presence (black, n = 231) and absence (gray, n = 398) of ATP demonstrate stable complex formation at the lesion supported by ATP-dependent transitions (+ ATP) versus a minor binding preference at the unpaired DNA region (− ATP). A slight preference of binding to the DNA fragment ends is also apparent (enhanced occupancies at 0% DNA length). Fractional occupancies are plotted for ∼33-bp-long sections of 916-bp DNA from DNA fragment ends (0%) to 50% DNA length (at the DNA center). The scale bars in A and C correspond to 200 nm.
Binding preferences for a target site are expressed as specificities (S) and were determined from Gaussian fits to the position distributions of protein peaks on DNA as described previously (30, 31) using the software Origin Pro. Briefly, DNA fragment lengths and positions of protein complexes on the DNA were measured as the length of a line along the entire DNA backbone or from the complex location to the DNA fragment ends, respectively. Position distributions were then plotted as normalized to the full length of the DNA fragment. Enhanced binding of a protein to a specific target site within a DNA fragment results in a peak in the distribution at the corresponding position: 0% for complexes bound at DNA fragment ends, 50% for complexes bound at a DNA fragment center, ∼31% for complexes bound at the lesion, and/or DNA bubble for specific DNA substrates in these experiments. Many proteins involved in DNA repair show a propensity to also bind to DNA fragment ends, likely as a result of local helix destabilization (29, 32). XPD also shows a slight preference for DNA ends (bars at 0% DNA length in position distributions of Fig. 1D). Preferential localization of XPD at DNA fragment ends, at an unpaired DNA bubble region, or at a lesion site are, however, distinct and separate effects. Because here we are interested in recognition by XPD of specific target sites in the DNA (at ∼31% of DNA length), we hence excluded complexes bound at DNA ends from the distribution histograms for statistical analysis (starting at 5% DNA length). Importantly, because of the vast excess of nonspecific sites over the one specific lesion site, we also observe many complexes at nonspecific DNA sites in the images (for example supplemental Figs. S2 and S3). However, the imbalance between the frequencies of these different types of DNA sites (>900 nonspecific sites versus 1 specific site) can still result in a considerable specificity value (site preference) as calculated from statistical analyses. Such preference is visible as a Gaussian shaped peak in the data at the specific site (∼31% DNA length). A Gaussian fit to these distributions provides the maximum position of the peak and its surface area (specific area, Asp), which reflects the fraction of specific complexes. The area of the background, which represents the fraction of complexes bound nonspecifically to the DNA fragment (Ansp), is given by the product of DNA length as a percentage and the height of the background from the Gaussian fit to the specific site. Target site specificity (S) is then given by Equation 3 (30),
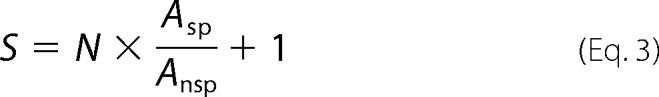 |
where N is the number of available binding sites on the DNA (here N = 914, excluding DNA fragment ends). For better comparison of specificities for different targets, Gaussian widths were all fixed at 2.6%, the width of the Gaussian fit to the substrate with highest specificity (DNA with fluorescein directly in the context of an 8-nt DNA bubble).
Statistical DNA fragment length distributions displayed a distinct maximum at ∼292 ± 11 nm, corresponding to a deviation of ∼6% from the theoretical length of a 916-bp DNA fragment of 311 nm (assuming 0.34 nm/bp). Such underestimation of DNA lengths in AFM by up to 10% is typical and likely due to limited resolution of smaller DNA backbone convolutions in the images (29). Only DNA fragments within two standard deviations from the center of a Gaussian fit to the DNA length distributions were included in the analyses to ensure correct allocation of the lesion position at 28–33% of the DNA fragment length (see “DNA Substrates” above). We distinguish between specific protein-DNA complexes (bound at the site of the lesion and/or DNA bubble at ∼31% of DNA length ± 2 S.D.) and nonspecific complexes, based on complex position. As in previous studies on other protein systems (31, 32), we avoided labeling of DNA fragment ends to allow for loading of protein at the fragment ends. As a consequence, the two fragment ends are indistinguishable, and the statistical position distributions were plotted only to 50% of DNA lengths, with the center of the fragment corresponding to 50% DNA length and the fragment ends to 0% DNA length. This approach results in a low nonspecific background at the position of the specific site in the distribution. However, because this background is present at all positions along the DNA substrate, it merely contributes noise to the distribution but does not affect the ratio of specific and nonspecific areas and hence does not change the value of S. The resolution of this specificity determination is typically limited to S >∼10 (31). Specificity results in Table 3 are given as the averages from at least three individual experiments (except for batch 2 protein experiments, which were mostly performed in duplicate) with errors derived from the standard deviations between experiments. For all DNA substrates and conditions, analysis with the pooled distributions from the individual experiments led to similar results and analytical errors comparable to the variations between the individual experiments. The position distributions shown in supplemental Fig. S5 are from pooled data from repeated experiments. The results shown in Fig. 2 are all from the same protein batch for better comparison between different substrates; results from a second batch are shown for comparison in Table 3 (in gray), clearly confirming the observed strand selectivity.
TABLE 3.
DNA binding specificities
The results are given as averages from 2–4 experiments with standard deviations between experiments. In gray below, results obtained with a second protein batch for some of the DNA substrates indicate good reproducibility. Examples of position distributions of XPD on the different DNA substrates, from which these specificities were calculated, are shown for several conditions in supplement Fig. S5.
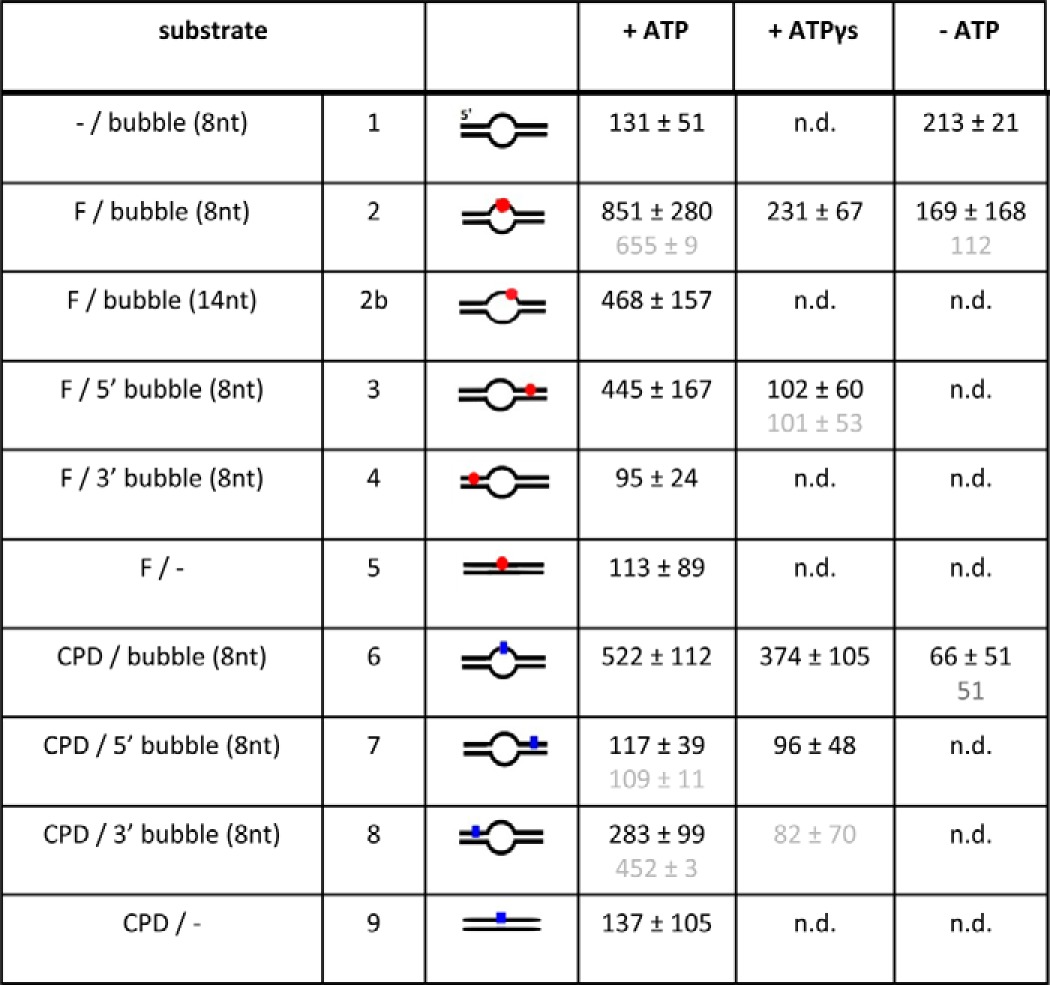
FIGURE 2.
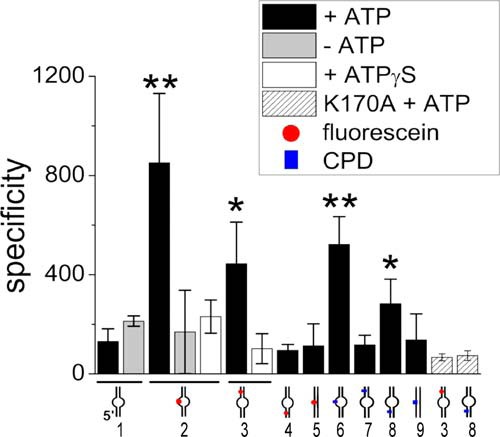
DNA translocation and lesion recognition by XPD. Localization specificities of XPD in the presence (black bars) or absence (gray bars) of ATP or in the presence of ATPγS (white bars) were obtained from Gaussian fits (supplemental Fig. S5) to the statistical AFM position distributions of XPD on different DNA substrates (schematically indicated below the plot). Numbers for DNA substrates are also given, consistent with those in Table 3, which lists specificities for all targets and ATP conditions. Striped bars show specificities of the taXPD K170A variant for the fluorescein/5′ bubble DNA and CPD/3′ bubble DNA substrate, as indicated. The red circle represents a fluorescein, and the blue rectangle represents a CPD lesion. Significance (classed as p < 0.05 (*) and p < 0.01 (**)) was calculated for differences in specificity compared with a DNA bubble without a lesion in the presence of ATP (first bar).
DNA bend angles are defined as deviation from a straight DNA backbone and were measured by manual tangent overlay as described previously (32), using ImageJ. Briefly, lines a and b were placed along the DNA backbone on each side of a protein complex. (180° − α) is the DNA bend angle, with α being the angle between a and b. For analysis using Origin Pro, complexes bound at positions within two standard deviations (based on Gaussian widths) from the center of the fit to the position distribution (at 30 ± 1% of DNA fragment length) were classed as specific, whereas complexes bound between 0 and 23% or between 37 and 50% of the DNA fragment lengths were considered nonspecific complexes. Bend angle analysis was carried out separately for specific and nonspecific XPD-DNA complexes. Bend angle distributions (for example Fig. 3) are from pooled data from repeated experiments. Significance of changes in bend angles was determined using the center positions of Gaussian fits to the data and standard deviations as given by the Gaussian fit widths (see “Statistical Analysis of Significance” below). In control experiments of intrinsic nonspecific DNA bending (supplemental Fig. S6), a mask comparable to the size of the protein was moved along the DNA fragments, and at regular intervals the bend angle was determined as described above. Intrinsic bending at lesion or bubble sites in the absence of bound protein was similarly determined using the protein sized mask at 30% of the DNA length from both of the DNA ends (producing a 50% nonspecific background population).
FIGURE 3.

XPD-DNA complex conformation. The distributions of DNA bend angles induced by XPD at a fluorescein lesion in the context of a DNA bubble indicate conformational changes in the protein-DNA complexes in the presence of ATP (B) or ATPγS (C) compared with in the absence of ATP (A). A, in the absence of ATP, nonspecific bend angles (gray bars) and bend angles at the lesion site (specific; black bars) are similar and fit by a Gaussian curve centered at ∼50° (nnsp = 174; nspec = 113). B and C, nonspecific bend angles are not affected by the presence of either ATP or ATPγS (gray bars), whereas the specific bend angle distributions show a significant shift (p < 10−11; see “Experimental Procedures” and Table 4) to an average bend angle of ∼65° in the presence of ATP or ATPγS (nnsp,ATP = 94; nspec,ATP = 137; nnsp,ATPγS = 242; nspec,ATPγS = 224). Specific bend angle distributions (DNA bending at the lesion site) are independent of the type of lesion (D, E, G, and H) or the presence or absence of a DNA bubble (further conditions in Table 4). D, fluorescein/5′ bubble; E, fluorescein/3′ bubble. G, CPD/5′ bubble. H, CPD/3′ bubble. A helicase hyperactive XPD variant (K170A) is unable to recognize the lesions and undergo conformational changes: wild-type XPD (A–E, G, and H) and K170A XPD (F and I) with fluorescein/5′ bubble (F) and CPD/3′ bubble (I) in the presence of ATP.
Statistical Analysis of Significance
Affinities to DNA, specificities for DNA sites, and DNA bend angle analyses were quantitatively compared for different DNA substrates and conditions. Significance was calculated based on a one-tailed Student's t test and is classed as p < 0.05 (*), p < 0.01 (**), and p < 0.005 (***).
RESULTS
XPD Loads Preferentially on Unpaired Regions within dsDNA
XPD has been previously shown to bind ssDNA with high affinity in the nanomolar range (10, 11, 17, 19, 33). We used BLI to analyze binding affinities of taXPD to different DNA structures, namely to dsDNA containing an unpaired region 8 nt in length, uninterrupted dsDNA, or ssDNA (see “Experimental Procedures”). To focus specifically on DNA affinity effects, BLI experiments were carried out in the absence of ATP. The results can be grouped into high affinity and low affinity binding, with dissociation constants of ∼150 and ∼500 nm, respectively, depending on the presence (high affinity) or absence (low affinity) of a single-stranded region (Table 2). Importantly, our data show similar affinities of taXPD for purely ssDNA and for dsDNA of the same length containing an 8-nt-long unpaired region, suggesting that the size of an 8-nt DNA bubble is sufficient to support loading of taXPD at this site. Consistent with the BLI results, our AFM analyses also demonstrate that taXPD can bind to fully base paired dsDNA (Fig. 1) but binds preferentially at ssDNA regions within a DNA bubble, as well as to DNA fragment ends (Fig. 1D).
Lesion Recognition and Stalling at Lesion Sites Requires ATP Hydrolysis
When adding ATP, we notice a significantly more pronounced decrease in protein coverage for linear dsDNA compared with circular dsDNA substrate (Fig. 1B, compare circular and nonspecific linear, nsp), suggestive of XPD translocation (or diffusion induced by ATP-dependent conformational changes) on the dsDNA leading to sliding off at DNA fragment ends. To examine whether the presence of a DNA lesion prevents XPD dissociation and/or sliding off the DNA fragments, we introduced a fluorescein modified thymine, a well known NER substrate (24), into the linear DNA at ∼31% of the fragment length (see “Experimental Procedures”). The fluorescein modification (F) was further placed within the context of a short, 8-nt unpaired DNA region (referred to here as the F/bubble DNA substrate) to simulate the bubble substrate as likely encountered by XPD during NER and to enhance binding at the lesion. If XPD remains stably bound to the lesion (compared with nonspecific DNA sites), the number of protein complexes should be increased on these damage-containing fragments. Indeed, in the presence of ATP, we clearly observe a significantly higher number of protein-DNA complexes for the lesion-containing DNA fragments compared with undamaged DNA of otherwise identical structure (p = 0.014; Fig. 1B, compare F/bubble and bubble). Although these studies do not allow us to distinguish between ATP-induced protein dissociation from nonspecific DNA sites and sliding off at DNA fragment ends, they clearly indicate that XPD is constrained by the lesion. In contrast, in the absence of ATP, protein coverage of DNA fragments with or without a lesion is comparable, indicating that the enhancement in the presence of a lesion is not due to differences in binding affinity, consistent with our BLI data.
To quantitate the enhancement of XPD binding stability at an NER target site, we measured the distances of XPD complexes bound to these DNA fragments (arrows in Fig. 1C) with respect to the DNA fragment ends. The resulting position distributions of XPD on the DNA fragments (Fig. 1D) revealed a high preference of XPD for the bulky fluorescein lesion (at 31% of DNA fragment length) in the context of unpaired DNA around the lesion (black bars in Fig. 1D). From the ratio of areas under the Gaussian peak at the specific site and of the nonspecific background, the localization specificity of XPD to a target site can be calculated (supplemental Fig. S5 and Equation 3; see “Experimental Procedures”), giving a specificity of S = ∼850 of XPD for the fluorescein adduct. Lesion specificity was fully dependent on the presence of ATP. In the absence of ATP (gray bars in Fig. 1D), significantly reduced, remnant specificity for the target site (S = ∼170; p = 0.027; see also supplemental Fig. S5) is likely dominated by preferential binding to the unpaired ssDNA region, consistent with the similar specificity for a DNA bubble without a lesion (−/bubble; Fig. 2) and with our BLI data. Importantly, in the presence of ATP, XPD localized to the (−/bubble) DNA structure only with low specificity (S = ∼130), clearly attributing the high specificity of XPD to the fluorescein lesion in the unpaired DNA region.
Although increasing the length of the unpaired DNA region to 14 nt did not further enhance the specificity of XPD for the lesion, the absence of a DNA bubble led to significantly reduced specificity (supplemental Fig. S5 and Table 3). XPD complex formation on DNA containing only the fluorescein lesion within completely base paired duplex DNA displayed a low binding specificity for the lesion (S = ∼110, p = 0.00028 compared with a fluorescein in the context of an 8-nt DNA bubble), which could be due to impaired loading onto the DNA, consistent with the higher affinity of XPD for ssDNA compared with dsDNA.
To separate effects of lesion recognition and of XPD loading onto DNA at an unpaired region, we further analyzed position distributions of XPD on DNA substrates containing an access site at a defined distance from the lesion site (Fig. 2, supplemental Fig. S5, and Table 3). We produced DNA substrates containing an 8-nt DNA bubble at a distance of 27 bp 5′ to the fluorescein lesion (see “Experimental Procedures”), a distance that can be overcome by the helicase activity of XPD (10). Although this separation is too close for us to distinguish in the AFM images between protein complexes localized at the DNA bubble and complexes at the lesion, these studies provide distinct information on the effects of separating loading and target recognition. When XPD was loaded at the bubble 5′ to the fluorescein lesion, the protein clearly accumulated at the target with high specificity, indicating 5′-3′ translocation on the DNA and recognition of the fluorescein lesion on the translocated DNA strand (Fig. 2). Our data also show that the process of DNA translocation that leads to lesion recognition is dependent on ATP hydrolysis because lesion localization specificity was reduced to background levels for XPD loaded at a bubble 5′ to the lesion in the presence of the nonhydrolyzable or only slowly hydrolyzable ATP analog ATPγS (S = ∼100 comparable to the specificity for (−/bubble); Fig. 2). Lesion localization specificity in the presence of ATP was approximately half for this substrate compared with the fluorescein lesion within the context of a bubble (S = ∼450 compared with S = ∼850, respectively). This reduction in specificity is likely due to ∼50% of the XPD molecules bound at the bubble moving in 5′ to 3′ direction on the DNA strand that does not contain the lesion, thus never encountering the lesion. In contrast, when loaded on the bubble directly surrounding the lesion, a stable XPD-lesion complex can form (10), leading to considerably lower losses from total protein binding.
Interestingly, our data suggest two modes of XPD translocation on our DNA substrates. Although both modes of translocation depend on ATP, they differ significantly. Nonspecific sliding of XPD on homoduplex DNA apparently can proceed over distances of hundreds of base pairs with eventual sliding off at the DNA fragment ends. In contrast, loading of XPD at ssDNA regions likely results in a complex proficient in helicase activity over short distances (34), after which the complex dissociates if it has not encountered a target site. It is currently unclear whether the protein may be able to convert between the two modes of translocation via conformational changes.
XPD Utilizes Different Mechanisms for Verification of CPD and Fluorescein Lesions
NER targets an impressive variety of diverse DNA lesions. The fluorescein adduct focused on so far is a representative of bulky DNA lesions. We further compared fluorescein recognition by XPD to that of a structurally very different NER target site, a CPD that naturally occurs through exposure to UV irradiation. AFM imaging was performed with DNA substrates containing an 8-nt DNA bubble either 5′ or 3′ to or directly surrounding either a fluorescein or a CPD lesion (Fig. 2). The DNA substrates containing the fluorescein and CPD lesions within the context of unpaired DNA produced XPD distributions with high localization specificities for the lesion position. Most notably, however, whereas the fluorescein adduct was recognized also with high specificity when loading of the protein occurred at a bubble 5′ from the damage site (see above), specificity for a CPD within this type of substrate did not exceed background levels. The small remaining specificity for the CPD/5′ bubble substrate (S = ∼120) resembled the background specificity achieved for a bubble that did not contain a lesion, indicating that the apparent specificity for this substrate was again dominated by increased loading on the DNA at the bubble site rather than by stalling at the lesion. However, when we used a DNA substrate containing a DNA bubble 3′ to either a fluorescein or a CPD, the effect was reversed. For the CPD lesion, we observed an enhanced specificity (S = ∼280) that could only be achieved through 5′-3′ translocation on the DNA strand that does not contain the lesion. In contrast to the CPD lesion, XPD specificity was low for fluorescein when located on the nontranslocated strand (S = ∼100 consistent with background level), clearly showing for the first time that the DNA damage recognition and verification process of XPD is not uniform among the structurally diverse classes of DNA lesions. The reduction in specificity for a CPD placed at a distance 5′ from a DNA bubble as compared with CPD placed directly in the context of an unpaired DNA region (S = ∼280 versus S = ∼520) is consistent with our fluorescein analysis (see above). Importantly, these results suggest stalling of taXPD at a CPD lesion when it is located on the nontranslocated strand, in contrast to the bulky fluorescein lesion, which stalls taXPD when located on the translocated strand (see “Discussion”).
Stable Complex Formation at the Lesion Involves ATP Rebinding
To investigate potentially different, independent damage recognition mechanisms, we analyzed the conformations of XPD-DNA complexes bound at nonspecific DNA positions (nonspecific complexes) and of complexes bound specifically at the lesions (specific complexes). Conformational information can be accessed from the DNA bend angles introduced by these different complexes (Fig. 3). In the absence of protein, DNA bend angle distributions showed narrow half Gaussian distributions with a maximum at 0° for nonspecific as well as specific sites (supplemental Fig. S6). Gaussian fits to the bend angle distributions of nonspecific XPD complexes (gray lines and bars in Fig. 3) consistently showed a broad maximum at ∼49° independent of the substrate used and independent of the presence or absence of ATP or ATPγS (Table 4 and Fig. 3). Variation between substrates and experiments was small, with a S.D. of <3°. In striking contrast, the bend angles of complexes located at the specific (lesion) site strongly depended on the presence of ATP (black bars in Fig. 3, A–C). In the absence of ATP (Fig. 3A), we measured an average DNA bend angle of ∼48° with small variation between the different substrates and experiments (S.D. ± 5°), similar to the bending of XPD complexes observed at nonspecific sites (see above). In the presence of ATP, bend angle distributions of XPD bound at the specific site displayed a maximum at ∼65° for all substrates containing a lesion (with S.D. ± 3°; Fig. 3 and Table 4). This constitutes a highly significant shift in DNA bend angles as compared with the average bend angle observed for nonspecific complexes (p < 10−7; see Table 4 and “Experimental Procedures”), indicative of a conformational change in the specific XPD complexes at a lesion site, which clearly is not observed in the absence of ATP. Interestingly, however, a shift to an average specific site bend angle of ∼64° (S.D. ± 2°) also occurred in the presence of the nonhydrolyzable (or only slowly hydrolyzable) ATP analog ATPγS (Fig. 3C and Table 4). These experiments thus clearly demonstrate that ATP (re)binding but not hydrolysis upon reaching and recognizing the target site is absolutely required for processing of the lesion, likely by conformational rearrangements. In addition, bend angle distributions of specific (lesion-bound) complexes in the presence of ATP or ATPγS were described better by a double Gaussian than by a single Gaussian fit (Fig. 3). According to the relative surface areas of the double Gaussians, typically ∼65% of the specific complexes display DNA bend angles of ∼65°, and ∼35% of the complexes show bending by a smaller angle of ∼30°. The second, smaller bend angle population will be further discussed below.
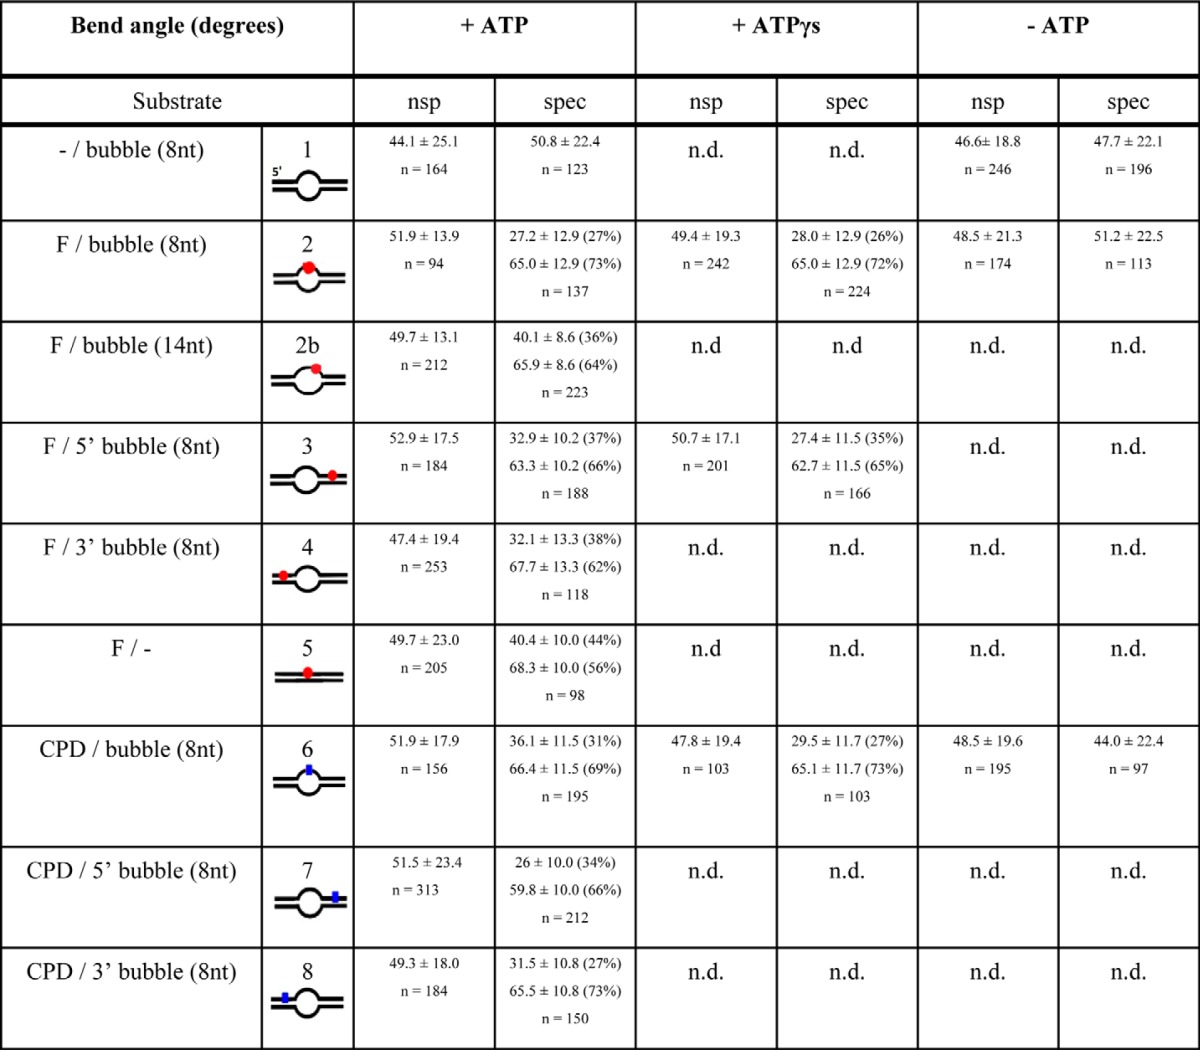
TABLE 4.
DNA bend angles
DNA bend angles measured from AFM images are given for XPD-DNA complexes bound specifically at a target site (spec) or at non-specific (nsp) positions within different DNA substrates (as indicated schematically). The given values were derived as the maxima of single or double Gaussian fits to pooled bend angle distributions from 2–4 experiments. The total number of data points is given as n. The significances of the shift in average bend angle between nonspecific and specific complexes (in the presence of ATP) were 1.6 × 10⁻¹², 4.3 × 10−51, 9.8 × 10⁻¹², 4.3 × 10⁻³¹, 5.6 × 10⁻²², 7.4 × 10⁻¹⁸, 7.4 × 10⁻⁸, and 1.4 × 10⁻²³ for the lesion containing DNA substrates 2–8, respectively. Significances of shifts in bend angles between the absence and presence of ATP (or ATPγs) for specific complexes were P = 2.2 × 10⁻⁸ (4.8 × 10⁻⁹) and 9.5 × 10⁻²⁰ (5.3 × 10⁻¹⁶) for DNA substrates 2 (fluorescein) and 6 (CPD), respectively. Exemplary bend angle distributions are shown in Fig. 3.
Lesion Recognition Is Coupled to Helicase Stalling
To further analyze the significance of the ability of XPD to recognize a lesion, we repeated the experiments using a helicase mutant of taXPD, K170A. This XPD variant harbors a mutation within the iron-sulfur cluster domain, which affects and significantly enhances its helicase activity compared with the wild-type protein, as described previously (11). Lesion specificities of taXPD-K170A obtained from AFM imaging on DNA substrates containing a DNA bubble 5′ or 3′ to a fluorescein or CPD lesion (Fig. 2, striped bars) are consistent with (and even slightly lower than) the background level resulting from a slight preference for loading at an unpaired DNA bubble site over homoduplex DNA. These data strongly argue that DNA translocation by this XPD variant is not stalled by the lesion, likely because of its increased helicase activity resulting in its scanning past potential lesion sites. We also measured DNA bend angles induced by taXPD-K170A bound at the position of the fluorescein and CPD lesions in DNA (Fig. 3, F and I). The complete absence of a shift to the specific bend angle state in these distributions strongly supports the inability of this protein variant to investigate and process target sites.
DISCUSSION
Damage recognition and verification are critical processes in DNA repair, which have to ensure the speedy detection and processing of DNA lesions yet avoid futile incisions. The helicase XPD has been proposed to play a critical role in NER damage verification. Previous studies further indicated that XPD translocation may be stalled by DNA lesions, suggesting that the protein may be involved in damage recognition (10, 35). Single molecule imaging by AFM allowed us to investigate the contributions of the XPD enzyme to the NER lesion recognition and verification process and to analyze this function in the presence of long DNA substrates (>900 bp), which mimic more closely the in vivo situation in the cell as compared with the short substrates required for other in vitro studies.
We analyzed the ability of taXPD to interact with various DNA substrates. ssDNA or ss/dsDNA junctions were bound with moderately high affinity (∼150 nm). Interestingly, the affinity to dsDNA (not containing any ssDNA regions) was only less than 1 order of magnitude weaker than to ssDNA (Table 2). Furthermore, our AFM data indicate that taXPD was not only able to bind to but also to translocate along dsDNA in the presence of ATP (Fig. 1). However, in the absence of a ssDNA region in the DNA substrate, lesions in the DNA were only poorly recognized by the enzyme (Fig. 2). It is therefore tempting to speculate that taXPD adopts at least two different binding modes upon DNA binding, in which only the second binding mode, which is induced by an initial interaction with ssDNA, is competent of dsDNA unwinding and supports successful lesion verification.
Most importantly, our analysis compared directly for the first time NER damage recognition and verification for different lesions. Introduction of a lesion into a DNA substrate within the context of an unpaired DNA region led to complex formation with high specificity both for a CPD and for a fluorescein lesion, which differ significantly in their structure. However, when the lesion was removed from the unpaired region and positioned 3′ or 5′ to this region, a clear distinction in damage recognition became apparent (model shown in Fig. 4). A bulky fluorescein adduct leads to a stalled taXPD-DNA complex when the lesion is located on the translocating strand. In contrast, a CPD lesion is preferentially recognized when it is located on the opposite strand, i.e., the nontranslocating strand.
FIGURE 4.
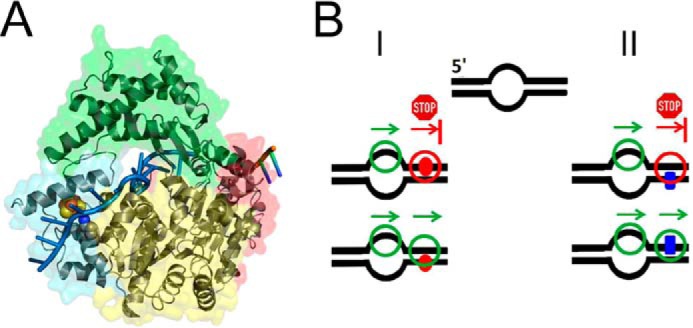
XPD damage verification model. A, XPD-ssDNA complex model based on the crystal structure with partial ssDNA bound. The RecA-like helicase domains 1 and 2 are shown in yellow and red, respectively; the iron-sulfur cluster domain in cyan, and the arch domain is in green. The modeled ssDNA strand is shown in blue, and the backbone of the DNA originally resolved from the crystal structure is in orange. The positions of Lys170 (blue, N), which is mutated in the helicase XPD variant (K170A), as well as the iron-sulfur cluster (red, iron; yellow, sulfur) are indicated. B, model of XPD damage verification for different lesions. XPD is loaded at a DNA bubble and translocates in 5′ to 3′ direction on the DNA (arrow). Panel I, translocation is stalled by a bulky lesion such as fluorescein (red circle) on the translocated strand, which acts as a mechanical road block to protein movement. Panel II, for an intrastrand pyrimidine dimer (CPD, blue rectangle), protein translocation is not majorly hindered by the presence of the lesion on the translocated strand, whereas an alternative lesion sensing mechanism, which has yet to be more thoroughly characterized, allows recognition of the lesion by XPD on the nontranslocated strand. It could be envisioned that XPD simultaneously exploits both types of lesion recognition and that the nature of the lesion determines which strategy becomes dominantly important and initiates repair competent conformational changes.
Differences in NER mechanistic details may be related to the strong observed dependence of DNA repair efficiencies on the degree of DNA helix destabilization by different lesions (36, 37). A possible explanation for the strand selectivity observed in our studies is therefore a different recognition mechanism based on the diverse structural prerequisites for different types of lesions. In our studies, the bulky fluorescein adduct may result in direct mechanical blocking of XPD translocation, but only when it is encountered on the actual strand that the protein “holds on to.” Importantly, under the conditions used in our experiments, the fluorescein adduct is most likely negatively charged and would therefore not destabilize the negatively charged DNA duplex via intercalation. Loading of XPD onto DNA carrying the type of lesion represented by a fluorescein hence requires the presence of a DNA bubble (Fig. 2), which is provided in vivo by the concerted action of XPC and XPB. A CPD lesion also does not lead to a major destabilization of the DNA double helix (38–40). However, distortion of the CPD containing ssDNA strand by the thymine dimer may be sufficient to provide an access site for XPD loading, resulting in slightly enhanced XPD localization to the lesion site in the absence of a DNA bubble (Fig. 2). When loaded at an access site (DNA bubble) at a distance from the lesion, translocation of taXPD along the lesion-containing strand appears to be feasible and is not strongly hindered by the presence of the lesion. Therefore a different, so far unidentified verification process could be envisioned. It is tempting to speculate that, when the lesion is located on the nontranslocated strand, it may be in close proximity to the iron-sulfur cluster (Fig. 4A), thus supporting the hypothesis that the iron-sulfur cluster may act as a damage detector, as has been shown for other protein systems containing such clusters (20, 22). However, the exact location of the DNA strand that XPD does not directly bind to (the nontranslocated strand) is not resolved in the crystal structure and is hence so far not known with certainty (11). Further structural studies are clearly required to elucidate the (different) mechanism(s) of lesion verification by XPD.
It should be noted that the strand selectivity observed in our AFM experiments for recognition of a CPD lesion is in contrast to a recent publication by Naegeli and co-workers (10), who reported stalling of the archaeal Ferroplasma acidarmanus XPD helicase by a CPD lesion located both in the nontranslocated and in the translocated DNA strand. Their studies provide support for the formation of a stable complex between F. acidarmanus XPD helicase and a CPD lesion in the translocated DNA strand, with interactions that are strong enough to withstand incision by the CPD processing glycosylase T4 Endo V. Both mechanistic deviations between XPD from different species and/or variations caused by different experimental approaches are conceivable and will be worth investigating in future studies. Notably, compared with the short oligonucleotides employed in these biochemical experiments, the long DNA substrates in our AFM studies provide better stability of the DNA duplex and, importantly, more closely resemble physiological conditions. Our data do not argue against such stable complex formation with CPD lesions in the translocated strand, but report a strong preference for detection of CPD lesions in the nontranslocated strand versus in the translocated strand. Importantly, once verified, lesion processing by taXPD appears to be similar for all substrates in our experiments, as suggested by vast differences in lesion specificities (Fig. 2) but comparable bend angle distributions for complexes engaged at specific lesion sites (Fig. 3).
In the context of DNA damage search, taXPD clearly requires a ssDNA region for successful stalling at a lesion site. In eukaryotic NER, XPD is part of the TFIIH complex, which is initially recruited to the damaged DNA by XPC. The presence of a destabilized DNA region (as for instance in a 3-nt DNA bubble) has been shown to be essential for XPC-induced loading of NER factors and the subsequent excision of a CPD lesion (34). Although Sugasawa et al. (34) show convincing evidence for recognition of CPD damages in the same DNA strand that the TFIIH complex is loaded on, these studies do not exclude incision competent recognition of CPD on the nontranslocated strand after XPC loading on a symmetrical DNA bubble 3′ to the lesion. Importantly, their data further corroborate a two-step (bipartite) model and the importance of TFIIH orientation for correct lesion recognition and processing.
Once taXPD has verified the presence of an NER target, processing of the lesion involves conformational changes in the stalled complex at the lesion visible by a significant shift in the maximum of the distribution of induced DNA bend angles at the site of the bound protein from ∼50° to ∼65° (Fig. 3). These transitions were independent of the lesion type and of the details of the preceding lesion recognition strategy. In the context of the eukaryotic repair cascade, this conformational change may be the prerequisite for the recruitment of the remaining NER machinery, including the endonucleases XPG and XPF for damage removal. This conformational shift is completely absent in samples of the taXPD variant K170A, which is incapable of detecting NER target sites. These results further underline the significance of stalled XPD translocation for concomitant lesion recognition as a prerequisite for lesion specific processing by XPD in NER. Fluorescein- and CPD-DNA structures have previously been shown to display intrinsic bending by 15–30° at the lesion (41, 42). However, AFM bend angle distributions obtained on the lesion sites in the absence of protein (supplemental Fig. S6) contain no major population displaying these bend angles and hence argue against an innate preformed DNA conformation that XPD binds to. It is conceivable that the ∼30° bend angle conformation observed in all specific site bend angle distributions may represent a complex conformation sampled by the protein on the path to the specific lesion repair signaling complex. However, it is the larger bend angle state (∼65°) that is dominant in the lesion-specific complexes (∼70% of all complexes) and comparable in population to the significantly less bent state (∼50°) in the nonspecific complexes at homoduplex DNA sites. We therefore interpret this bend angle conformation as the specific, lesion associated state competent for induction of subsequent DNA repair events. Interestingly, the conformational changes occurred in the presence of either ATP or ATPγS, indicating that the lesion-dependent rearrangement of the taXPD-DNA complex involves ATP binding but not hydrolysis. The requirement of ATP rebinding for lesion-dependent conformational changes is strongly reminiscent of the prokaryotic NER mechanism. In the prokaryotic NER damage search and recognition complex, UvrB is thought to undergo initial conformational changes upon ATP hydrolysis. This process leads to its localization at the lesion site, followed by ATP rebinding and concomitant formation of a stable, specific preincision complex at the lesion (43), which is required for the recruitment of the endonuclease UvrC (44). General conservation of the mechanistic NER approach between the prokaryotic UvrABC system and the eukaryotic xeroderma pigmentosum system has often been described (45–47), despite a complete lack of sequence and structural homology between the involved enzymes. This is the first example showing that an individual step within the verification process in the NER cascade may be strikingly similar between prokaryotic and eukaryotic NER, corroborating the conservation of this biologically essential DNA repair system.
Acknowledgments
We thank Samuel Wilson for providing the modified DNA plasmid for DNA substrate preparation, Stefanie Wolski for assistance with protein preparation, Jochen Kuper for preparation of the XPD-DNA model in Fig. 4A, and Hermann Schindelin and Jochen Kuper for critical reading of the manuscript.
This work was supported by the Deutsche Forschungsgemeinschaft Rudolf Virchow Center for Experimental Biomedicine Grants FZ 82 (to I. T. and C. K.) and KI-562/2 (to C. K.).

This article contains supplemental text, references, and Figs. S1–S6.
- NER
- nucleotide excision repair
- AFM
- atomic force microscopy
- BLI
- biolayer interferometry
- nt
- nucleotide(s)
- ssDNA
- single-stranded DNA
- CPD
- cyclobutane pyrimidine dimer
- TFIIH
- transcription factor IIH
- taXPD
- XPD from T. acidophilum
- ATPγS
- adenosine 5′-O-(thiotriphosphate).
REFERENCES
- 1. Friedberg E. C. (2003) DNA damage and repair. Nature 421, 436–440 [DOI] [PubMed] [Google Scholar]
- 2. Lindahl T., Wood R. D. (1999) Quality control by DNA repair. Science 286, 1897–1905 [DOI] [PubMed] [Google Scholar]
- 3. Hoeijmakers J. H. (2001) Genome maintenance mechanisms for preventing cancer. Nature 411, 366–374 [DOI] [PubMed] [Google Scholar]
- 4. Friedberg E. C. (2001) How nucleotide excision repair protects against cancer. Nat. Rev. Cancer 1, 22–33 [DOI] [PubMed] [Google Scholar]
- 5. Bernardes de Jesus B. M., Bjørås M., Coin F., Egly J. M. (2008) Dissection of the molecular defects caused by pathogenic mutations in the DNA repair factor XPC. Mol. Cell. Biol. 28, 7225–7235 [DOI] [PMC free article] [PubMed] [Google Scholar]
- 6. Oksenych V., Bernardes de Jesus B., Zhovmer A., Egly J. M., Coin F. (2009) Molecular insights into the recruitment of TFIIH to sites of DNA damage. EMBO J. 28, 2971–2980 [DOI] [PMC free article] [PubMed] [Google Scholar]
- 7. Coin F., Oksenych V., Egly J. M. (2007) Distinct roles for the XPB/p52 and XPD/p44 subcomplexes of TFIIH in damaged DNA opening during nucleotide excision repair. Mol. Cell 26, 245–256 [DOI] [PubMed] [Google Scholar]
- 8. Wolski S. C., Kuper J., Hänzelmann P., Truglio J. J., Croteau D. L., Van Houten B., Kisker C. (2008) Crystal structure of the FeS cluster-containing nucleotide excision repair helicase XPD. PLoS Biol. 6, e149. [DOI] [PMC free article] [PubMed] [Google Scholar]
- 9. Fan L., Fuss J. O., Cheng Q. J., Arvai A. S., Hammel M., Roberts V. A., Cooper P. K., Tainer J. A. (2008) XPD helicase structures and activities. Insights into the cancer and aging phenotypes from XPD mutations. Cell 133, 789–800 [DOI] [PMC free article] [PubMed] [Google Scholar]
- 10. Mathieu N., Kaczmarek N., Naegeli H. (2010) Strand- and site-specific DNA lesion demarcation by the xeroderma pigmentosum group D helicase. Proc. Natl. Acad. Sci. U.S.A. 107, 17545–17550 [DOI] [PMC free article] [PubMed] [Google Scholar]
- 11. Kuper J., Wolski S. C., Michels G., Kisker C. (2012) Functional and structural studies of the nucleotide excision repair helicase XPD suggest a polarity for DNA translocation. EMBO J. 31, 494–502 [DOI] [PMC free article] [PubMed] [Google Scholar]
- 12. Mathieu N., Kaczmarek N., Rüthemann P., Luch A., Naegeli H. (2013) DNA quality control by a lesion sensor pocket of the xeroderma pigmentosum group D helicase subunit of TFIIH. Curr. Biol. 23, 204–212 [DOI] [PubMed] [Google Scholar]
- 13. Ito S., Kuraoka I., Chymkowitch P., Compe E., Takedachi A., Ishigami C., Coin F., Egly J. M., Tanaka K. (2007) XPG stabilizes TFIIH, allowing transactivation of nuclear receptors. Implications for Cockayne syndrome in XP-G/CS patients. Mol. Cell 26, 231–243 [DOI] [PubMed] [Google Scholar]
- 14. Moggs J. G., Yarema K. J., Essigmann J. M., Wood R. D. (1996) Analysis of incision sites produced by human cell extracts and purified proteins during nucleotide excision repair of a 1,3-intrastrand d(GpTpG)-cisplatin adduct. J. Biol. Chem. 271, 7177–7186 [DOI] [PubMed] [Google Scholar]
- 15. Svoboda D. L., Taylor J. S., Hearst J. E., Sancar A. (1993) DNA repair by eukaryotic nucleotide excision nuclease. Removal of thymine dimer and psoralen monoadduct by HeLa cell-free extract and of thymine dimer by Xenopus laevis oocytes. J. Biol. Chem. 268, 1931–1936 [PubMed] [Google Scholar]
- 16. Liu H., Rudolf J., Johnson K. A., McMahon S. A., Oke M., Carter L., McRobbie A. M., Brown S. E., Naismith J. H., White M. F. (2008) Structure of the DNA repair helicase XPD. Cell 133, 801–812 [DOI] [PMC free article] [PubMed] [Google Scholar]
- 17. Rudolf J., Rouillon C., Schwarz-Linek U., White M. F. (2010) The helicase XPD unwinds bubble structures and is not stalled by DNA lesions removed by the nucleotide excision repair pathway. Nucleic Acids Res. 38, 931–941 [DOI] [PMC free article] [PubMed] [Google Scholar]
- 18. Pugh R. A., Wu C. G., Spies M. (2012) Regulation of translocation polarity by helicase domain 1 in SF2B helicases. EMBO J. 31, 503–514 [DOI] [PMC free article] [PubMed] [Google Scholar]
- 19. Pugh R. A., Honda M., Leesley H., Thomas A., Lin Y., Nilges M. J., Cann I. K., Spies M. (2008) The iron-containing domain is essential in Rad3 helicases for coupling of ATP hydrolysis to DNA translocation and for targeting the helicase to the single-stranded DNA-double-stranded DNA junction. J. Biol. Chem. 283, 1732–1743 [DOI] [PubMed] [Google Scholar]
- 20. Ren B., Duan X., Ding H. (2009) Redox control of the DNA damage-inducible protein DinG helicase activity via its iron-sulfur cluster. J. Biol. Chem. 284, 4829–4835 [DOI] [PMC free article] [PubMed] [Google Scholar]
- 21. Boal A. K., Yavin E., Lukianova O. A., O'Shea V. L., David S. S., Barton J. K. (2005) DNA-bound redox activity of DNA repair glycosylases containing [4Fe-4S] clusters. Biochemistry 44, 8397–8407 [DOI] [PubMed] [Google Scholar]
- 22. Lukianova O. A., David S. S. (2005) A role for iron-sulfur clusters in DNA repair. Curr. Opin. Chem. Biol. 9, 145–151 [DOI] [PubMed] [Google Scholar]
- 23. Mui T. P., Fuss J. O., Ishida J. P., Tainer J. A., Barton J. K. (2011) ATP-stimulated, DNA-mediated redox signaling by XPD, a DNA repair and transcription helicase. J. Am. Chem. Soc. 133, 16378–16381 [DOI] [PMC free article] [PubMed] [Google Scholar]
- 24. Hoeijmakers J. H. (2009) DNA damage, aging, and cancer. New Engl. J. Med. 361, 1475–1485 [DOI] [PubMed] [Google Scholar]
- 25. Krasikova Y. S., Rechkunova N. I., Maltseva E. A., Pestryakov P. E., Petruseva I. O., Sugasawa K., Chen X., Min J. H., Lavrik O. I. (2013) Comparative analysis of interaction of human and yeast DNA damage recognition complexes with damaged DNA in nucleotide excision repair. J. Biol. Chem. 288, 10936–10947 [DOI] [PMC free article] [PubMed] [Google Scholar]
- 26. Kisker C., Kuper J., Van Houten B. (2013) Prokaryotic nucleotide excision repair. Cold Spring Harb. Perspect. Biol. 5, a012591. [DOI] [PMC free article] [PubMed] [Google Scholar]
- 27. Reardon J. T., Sancar A. (2003) Recognition and repair of the cyclobutane thymine dimer, a major cause of skin cancers, by the human excision nuclease. Genes Dev. 17, 2539–2551 [DOI] [PMC free article] [PubMed] [Google Scholar]
- 28. Sugasawa K., Okamoto T., Shimizu Y., Masutani C., Iwai S., Hanaoka F. (2001) A multistep damage recognition mechanism for global genomic nucleotide excision repair. Genes Dev. 15, 507–521 [DOI] [PMC free article] [PubMed] [Google Scholar]
- 29. Buechner C. N., Tessmer I. (2013) DNA substrate preparation for atomic force microscopy studies of protein-DNA interactions. J. Mol. Recognit., in press [DOI] [PubMed] [Google Scholar]
- 30. Yang Y., Sass L. E., Du C., Hsieh P., Erie D. A. (2005) Determination of protein-DNA binding constants and specificities from statistical analyses of single molecules. MutS-DNA interactions. Nucleic Acids Res. 33, 4322–4334 [DOI] [PMC free article] [PubMed] [Google Scholar]
- 31. Tessmer I., Yang Y., Zhai J., Du C., Hsieh P., Hingorani M. M., Erie D. A. (2008) Mechanism of MutS searching for DNA mismatches and signaling repair. J. Biol. Chem. 283, 36646–36654 [DOI] [PMC free article] [PubMed] [Google Scholar]
- 32. Tessmer I., Melikishvili M., Fried M. G. (2012) Cooperative cluster formation, DNA bending and base-flipping by the O6-alkylguanine-DNA alkyltransferase. Nucleic Acids Res. 40, 8296–8308 [DOI] [PMC free article] [PubMed] [Google Scholar]
- 33. Pugh R. A., Lin Y., Eller C., Leesley H., Cann I. K., Spies M. (2008) Ferroplasma acidarmanus RPA2 facilitates efficient unwinding of forked DNA substrates by monomers of FacXPD helicase. J. Mol. Biol. 383, 982–998 [DOI] [PubMed] [Google Scholar]
- 34. Sugasawa K., Akagi J., Nishi R., Iwai S., Hanaoka F. (2009) Two-step recognition of DNA damage for mammalian nucleotide excision repair. Directional binding of the XPC complex and DNA strand scanning. Mol. Cell 36, 642–653 [DOI] [PubMed] [Google Scholar]
- 35. Naegeli H., Bardwell L., Friedberg E. C. (1992) The DNA helicase and adenosine triphosphatase activities of yeast Rad3 protein are inhibited by DNA damage. A potential mechanism for damage-specific recognition. J. Biol. Chem. 267, 392–398 [PubMed] [Google Scholar]
- 36. Mu D., Hsu D. S., Sancar A. (1996) Reaction mechanism of human DNA repair excision nuclease. J. Biol. Chem. 271, 8285–8294 [DOI] [PubMed] [Google Scholar]
- 37. Jain V., Hilton B., Lin B., Patnaik S., Liang F., Darian E., Zou Y., Mackerell A. D., Jr., Cho B. P. (2013) Unusual sequence effects on nucleotide excision repair of arylamine lesions. DNA bending/distortion as a primary recognition factor. Nucleic Acids Res. 41, 869–880 [DOI] [PMC free article] [PubMed] [Google Scholar]
- 38. Lee J. H., Park C. J., Shin J. S., Ikegami T., Akutsu H., Choi B. S. (2004) NMR structure of the DNA decamer duplex containing double T*G mismatches of cis-syn cyclobutane pyrimidine dimer. Implications for DNA damage recognition by the XPC-hHR23B complex. Nucleic Acids Res. 32, 2474–2481 [DOI] [PMC free article] [PubMed] [Google Scholar]
- 39. Kim S. T., Sancar A. (1995) Photorepair of nonadjacent pyrimidine dimers by DNA photolyase. Photochem. Photobiol. 61, 171–174 [DOI] [PubMed] [Google Scholar]
- 40. McAteer K., Jing Y., Kao J., Taylor J. S., Kennedy M. A. (1998) Solution-state structure of a DNA dodecamer duplex containing a Cis-syn thymine cyclobutane dimer, the major UV photoproduct of DNA. J. Mol. Biol. 282, 1013–1032 [DOI] [PubMed] [Google Scholar]
- 41. Park H., Zhang K., Ren Y., Nadji S., Sinha N., Taylor J. S., Kang C. (2002) Crystal structure of a DNA decamer containing a cis-syn thymine dimer. Proc. Natl. Acad. Sci. U.S.A. 99, 15965–15970 [DOI] [PMC free article] [PubMed] [Google Scholar]
- 42. Jaciuk M., Nowak E., Skowronek K., Tańska A., Nowotny M. (2011) Structure of UvrA nucleotide excision repair protein in complex with modified DNA. Nat. Struct. Mol. Biol. 18, 191–197 [DOI] [PMC free article] [PubMed] [Google Scholar]
- 43. Verhoeven E. E., Wyman C., Moolenaar G. F., Hoeijmakers J. H., Goosen N. (2001) Architecture of nucleotide excision repair complexes. DNA is wrapped by UvrB before and after damage recognition. EMBO J. 20, 601–611 [DOI] [PMC free article] [PubMed] [Google Scholar]
- 44. Verhoeven E. E., Wyman C., Moolenaar G. F., Goosen N. (2002) The presence of two UvrB subunits in the UvrAB complex ensures damage detection in both DNA strands. EMBO J. 21, 4196–4205 [DOI] [PMC free article] [PubMed] [Google Scholar]
- 45. Petit C., Sancar A. (1999) Nucleotide excision repair. From E. coli to man. Biochimie 81, 15–25 [DOI] [PubMed] [Google Scholar]
- 46. Batty D. P., Wood R. D. (2000) Damage recognition in nucleotide excision repair of DNA. Gene 241, 193–204 [DOI] [PubMed] [Google Scholar]
- 47. Kuper J., Kisker C. (2012) Damage recognition in nucleotide excision DNA repair. Curr. Opin. Struct. Biol. 22, 88–93 [DOI] [PubMed] [Google Scholar]