Background: Elevated glucose may cause β-cell dysfunction in type 2 diabetes, i.e., glucotoxicity.
Results: Elevated glucose, but not pyruvate, perturbed insulin secretion and content, plasma and mitochondrial membrane potentials, and proton leak, while increasing glycolytic metabolites in β-cells.
Conclusion: Early metabolism of glucose exerts a toxic effect on clonal insulin-producing cells.
Significance: Unraveling these mechanisms may provide protection of β-cells in diabetes.
Keywords: Beta Cell, Bioenergetics, Insulin Secretion, Metabolomics, Mitochondrial Metabolism, Uncoupling Proteins
Abstract
Glucotoxicity in pancreatic β-cells is a well established pathogenetic process in type 2 diabetes. It has been suggested that metabolism-derived reactive oxygen species perturb the β-cell transcriptional machinery. Less is known about altered mitochondrial function in this condition. We used INS-1 832/13 cells cultured for 48 h in 2.8 mm glucose (low-G), 16.7 mm glucose (high-G), or 2.8 mm glucose plus 13.9 mm pyruvate (high-P) to identify metabolic perturbations. High-G cells showed decreased responsiveness, relative to low-G cells, with respect to mitochondrial membrane hyperpolarization, plasma membrane depolarization, and insulin secretion, when stimulated acutely with 16.7 mm glucose or 10 mm pyruvate. In contrast, high-P cells were functionally unimpaired, eliminating chronic provision of saturating mitochondrial substrate as a cause of glucotoxicity. Although cellular insulin content was depleted in high-G cells, relative to low-G and high-P cells, cellular functions were largely recovered following a further 24-h culture in low-G medium. After 2 h at 2.8 mm glucose, high-G cells did not retain increased levels of glycolytic or TCA cycle intermediates but nevertheless displayed increased glycolysis, increased respiration, and an increased mitochondrial proton leak relative to low-G and high-P cells. This notwithstanding, titration of low-G cells with low protonophore concentrations, monitoring respiration and insulin secretion in parallel, showed that the perturbed insulin secretion of high-G cells could not be accounted for by increased proton leak. The present study supports the idea that glucose-induced disturbances of stimulus-secretion coupling by extramitochondrial metabolism upstream of pyruvate, rather than exhaustion from metabolic overload, underlie glucotoxicity in insulin-producing cells.
Introduction
Type 2 diabetes (T2D)2 has become one of the most rapidly increasing diseases of our time. An astounding 439 million people are projected to suffer from the disease by 2030 (1). T2D is caused by the combined insult of impaired insulin secretion and resistance to the actions of the hormone (2). This notwithstanding, it is also clear that as long as the pancreatic insulin-producing β-cells secrete sufficient amounts of the hormone, glucose homeostasis will remain under control (3). To understand why T2D develops, the processes leading to impaired insulin secretion need to be resolved.
The pancreatic β-cell is specialized to sense a rise in the ambient glucose level and promptly responds by releasing insulin. When glucose levels rise, uptake of the hexose is increased, and the increased pyruvate supply to the mitochondria stimulates ATP synthesis (4). The resulting increase of the cytosolic ATP/ADP ratio is the primary trigger of insulin release, causing closure of plasma membrane-embedded KATP channels (5). This initiates oscillatory plasma membrane depolarization, triggering calcium entry (6) and exocytosis of insulin granules (3). In addition, an amplifying pathway sustains the secretion of insulin, which otherwise would taper off (7). This pathway is less well characterized but seems to largely depend on mitochondrial metabolism, as does the triggering pathway (4).
In the events leading to T2D, glucose levels progressively rise until the diagnostic level of 7 mm is surpassed and frank diabetes is a fact. The pancreatic β-cells will therefore be exposed to elevated glucose levels for a prolonged time. Under such circumstances, the very same molecule that is the trigger of insulin secretion under normal conditions fails to sufficiently induce insulin release when applied acutely (8). This perturbation is referred to as glucotoxicity. There is a body of work describing mechanisms underlying the long term toxic effects of glucose on pancreatic β-cells (9, 10). Clearly, the lack of response depends on both the concentration of glucose and the duration of β-cell exposure. In fact, exceeding a certain time and concentration threshold may lead to irreversible damage of β-cells, which may undergo apoptosis (9, 10). This can probably be attributed to the intracellular formation of toxic compounds, which likely emanate from cellular metabolism, against which the β-cell defense will eventually fail. Although not definitively proven, glucose-induced formation of reactive oxygen species (ROS) in pancreatic β-cells has been suggested to be the culprit in glucotoxicity (9). If this view is accepted, there is a plethora of cellular processes that may be harmed by ROS. This includes effects on gene expression (11), protein synthesis (12), and β-cell replication and viability.
Although the role of ROS in β-cell glucotoxicity has been widely accepted (9), little is known about mitochondrial function in this pathological situation. This is surprising given the critical role of mitochondria in β-cell stimulus-secretion coupling (4) and the formation of ROS. Some years ago, it was suggested that the presence of uncoupling protein-2 (UCP2) contributes to impaired stimulus-secretion coupling in pancreatic β-cells, by blunting the rise in the ATP/ADP ratio (13) and hence restricting insulin secretion. Subsequently, it proved difficult to confirm the initial findings in properly back-crossed UCP2 knock-out mice (14), and the functional role of UCP2 in pancreatic β-cells has been challenged (15). Nevertheless, it has been found that glucose-induced hyperpolarization of the inner mitochondrial membrane and the rise in the ATP/ADP ratio are impaired in human islets in T2D (16).
Given this knowledge gap, we decided to characterize the bioenergetic changes and metabolite profiles in an experimentally induced glucotoxic condition in INS-1 832/13 cells, a clonal cell line with widespread use as a model for pancreatic β-cells (17). We observed perturbed insulin secretion, despite enhanced glycolysis and increased respiration in the glucotoxic insulin-producing cells. The responsiveness of both the mitochondrial membrane potential (Δψm) hyperpolarization and plasma membrane potential (Δψp) depolarization to glucose was dampened, while the inner mitochondrial membrane proton leak was increased. Whereas glucotoxic INS-1 832/13 cells lost responsiveness to both glucose and pyruvate, chronic exposure to a comparable concentration of pyruvate did not provoke a fuel-induced toxic condition. Thus, early alterations in glycolytic metabolism, rather than excess substrate supply, account for the glucose-specific toxic metabolic effect on clonal insulin-producing cells.
EXPERIMENTAL PROCEDURES
Materials
Unless otherwise indicated, all reagents were obtained from Sigma-Aldrich.
Cell Culture
Clonal INS-1 832/13 cells were cultured in RPMI 1640 containing 11.1 mm glucose and supplemented with 10% fetal bovine serum, 10 mm HEPES, 2 mm glutamine, 1 mm sodium pyruvate, and 50 μm β-mercaptoethanol at 37 °C in a humidified atmosphere containing 95% air and 5% CO2. For all experiments, cells were seeded in appropriate plates and maintained in culture medium for 24 h. Then cells were cultured for 48 h in medium containing 2.8 mm glucose (low-G cells), 16.7 mm glucose (high-G cells), or 2.8 mm glucose + 13.9 mm sodium pyruvate (high-P cells). Prior to measurements, cells were incubated for 2 h in the indicated buffer containing 2.8 mm glucose. For clarification, the experimental design is shown in Fig. 1.
FIGURE 1.
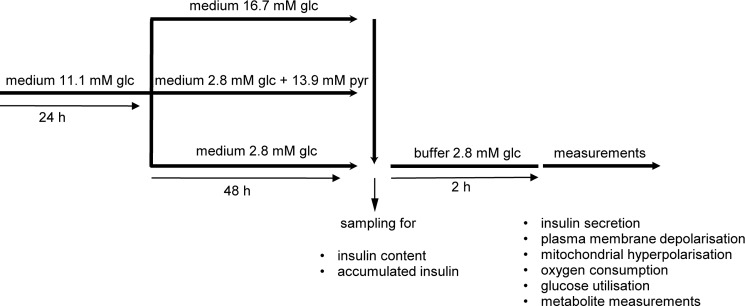
Scheme of experimental design.
Insulin Measurements
Medium was directly collected after the 48-h culture at different glucose and pyruvate concentrations to determine the total amount of insulin secreted. The insulin content was determined after extraction of cells in 95:5 (v:v) ethanol:hydrochloric acid solution. Prior to the 1-h secretion assay, cells were maintained for 2 h in secretion assay buffer containing 2.8 mm glucose, 114 mm NaCl, 4.7 mm KCl, 1.2 mm KH2PO4, 1.16 mm MgSO4, 25.5 mm NaHCO3, 20 mm HEPES, 2.5 mm CaCl2, and 0.2% BSA at pH 7.2. Subsequently, cells were stimulated with either 2.8 mm glucose, 16.7 mm glucose, or 10 mm sodium pyruvate for 1 h. Insulin was determined with the Coat-a-Count radioimmunoassay kit (DPC, Los Angeles, CA).
Monitoring Changes in Plasma Membrane Potential (Δψp)
An individual vial from the FLIPR® membrane potential assay kit, explorer format component A (catalog no. R-8042; Molecular Devices, Sunnyvale, CA) containing a proprietary plasma membrane potential indicator that we have named “PMPI” was reconstituted in 10 ml of distilled water and frozen in 1-ml aliquots (PMPI stock). Cells were seeded in poly-d-lysine coated Nunc Lab-TekTM 8-well chambers (Thermo Fisher Scientific, Roskilde, Denmark) and cultured as described above. Prior to monitoring Δψp, cells were incubated for 2 h in 400 μl of buffer containing 2.8 mm glucose, 135 mm NaCl, 3.5 mm KCl, 0.5 mm MgSO4, 0.5 mm Na2HPO4, 5 mm NaHCO3, 10 mm HEPES, and 1.5 mm CaCl2, pH 7.4. To monitor changes in Δψp, cells were loaded with 2 μl/400 μl PMPI stock for 10 min. The 8-well chamber was inserted into a temperature (37 °C) and CO2 (5%)-controlled incubation chamber on the stage of an inverted confocal fluorescence microscope (Zeiss LSM 510). Whole field PMPI fluorescence (514-nm excitation, 530-nm long pass emission) was monitored with a 40× air objective in real time. Fluorescence was collected from a monolayer of ∼200 cells. The data were corrected for background and normalized to values following addition of oligomycin, when the KATP channels would be predicted to be fully activated.
Monitoring Changes in Mitochondrial Membrane Potential (Δψm)
For Δψm measurements, cells were preincubated for 1 h with 100 nm tetramethylrhodamine methyl ester (TMRM; Invitrogen). TMRM was present in the medium throughout the experiment. Under these conditions (“quench mode”) (18), decreased whole cell fluorescence corresponds to mitochondrial hyperpolarization. TMRM fluorescence (543-nm excitation, 585-nm long pass emission) was recorded. The data were background-corrected and normalized to values following oligomycin addition.
Respiration
Cells were grown in XF24 24-well plates (Seahorse Bioscience, North Billerica, MA) as described previously (19). Measurements of oxygen consumption rates were performed with the Seahorse Extracellular Flux Analyzer XF24 (Seahorse Bioscience) as previously published (19). After 2 h of preincubation in 2.8 mm glucose, respiration was measured in low glucose (2.8 mm) for 30 min, following which 16.7 mm glucose or 10 mm pyruvate were added. After a further 60 min, oligomycin (4 μg/ml) was added to estimate the proportion of respiration driving ATP synthesis or proton leak. After a further 30 min, 4 μm carbonyl cyanide-p-trifluoromethoxyphenylhydrazone (FCCP) was added to determine maximal respiratory capacity. Finally, after a further 10 min, 1 μm rotenone was added to allow estimation of nonmitochondrial respiration.
Parallel Measurements of Proton Leak and Insulin Secretion in the Presence of Low Protonophore Concentrations
Respiration of low-G, high-G, and high-P cells was monitored as above in 2.8 mm glucose, followed by addition of secretagogue (16.7 mm glucose or 10 mm pyruvate, together with 0, 12.5, 50, 100, or 150 nm FCCP (note that the medium contains 1 mg albumin/ml)). After 60 min, oligomycin (4 μg/ml) was added to estimate mitochondrial ATP turnover and proton leak. The supernatant from the run was sampled to determine insulin release by radioimmunoassay as described above.
Glucose Utilization
Cells were cultured in 24-well plates as described above. Prior to assay, cells were maintained for 2 h in secretion assay buffer containing 2.8 mm glucose. Glucose utilization was determined by determining release of [3H]H2O, using liquid scintillation spectrometry as previously described (19) after incubation of cells with d-[5-3H]glucose (specific activity, 19.63 Ci/mmol; PerkinElmer Life Sciences) and glucose to a final concentration of 2.8 or 16.7 mm.
Lactate Release and Lactate Dehydrogenase A Expression
Lactate was measured by an enzymatic assay and lactate dehydrogenase A mRNA by quantitative PCR as previously described (19, 20).
Intracellular Metabolite Measurements
Profiling of intracellular metabolites was performed under conditions paralleling the respiration and membrane potential measurements, as previously described in detail (21). To confirm uptake and metabolism of nutrients under the experimental conditions, selected metabolites were profiled at 17, 21, 41, and 45 h after starting the culture of low-G, high-G, and high-P cells. Metabolism was rapidly quenched using methanol at −80 °C. Metabolites were then extracted, derivatized, and analyzed by GC/MS.
Statistical Analysis
The data are presented as the means ± S.D. or means ± S.E.M. Statistical significance was assessed by Student's t test, or when indicated, by one-way analysis of variance (ANOVA) followed by Tukey's or Bonferroni's post hoc test, when more than two groups were compared. p < 0.05 was considered statistically significant. Nutrient uptake experiments were compared with ANOVA and the Mann-Whitney U test.
RESULTS
Insulin Content and Release
The total insulin released into the medium was determined during a 48-h incubation under three conditions: 2.8 mm glucose (low-G), 16.7 mm glucose (high-G), and 2.8 mm glucose plus 13.9 mm pyruvate (high-P). A 48-h exposure of INS-1 832/13 cells to 16.7 mm glucose in the culture medium (high-G) led to an accumulated release of 1015 ± 86 ng insulin/mg protein (Fig. 2A and Table 1). This was only a slight increase over the basal release (742 ± 118 ng insulin/mg protein) from cells cultured in 2.8 mm glucose medium (low-G) under the same time. This modest increase contrasted with the near 14-fold enhancement of insulin secretion seen when low-G cells were acutely exposed to 16.7 mm glucose for 1 h (Fig. 2C and Table 1). This suggests that GSIS eventually fails in prolonged culture in high glucose medium, whereas basal release in low glucose may continue. Moreover, high-G cells showed greatly diminished basal and GSIS when tested 2 h after transfer to secretion assay buffer containing 2.8 mm glucose (Fig. 2C and Table 1), again confirming previous results (17). GSIS relative to stimulated secretion in the low-G control was reduced to 3.9-fold. However, basal insulin release in 2.8 mm glucose was also reduced (Fig. 2C), and thus, relative to the high-G control, 16.7 mm glucose actually elicited a ∼13.1-fold enhancement of insulin release. High-G cells therefore appeared to retain the mechanisms for basal and GSIS, but the amount of insulin secreted was less.
FIGURE 2.
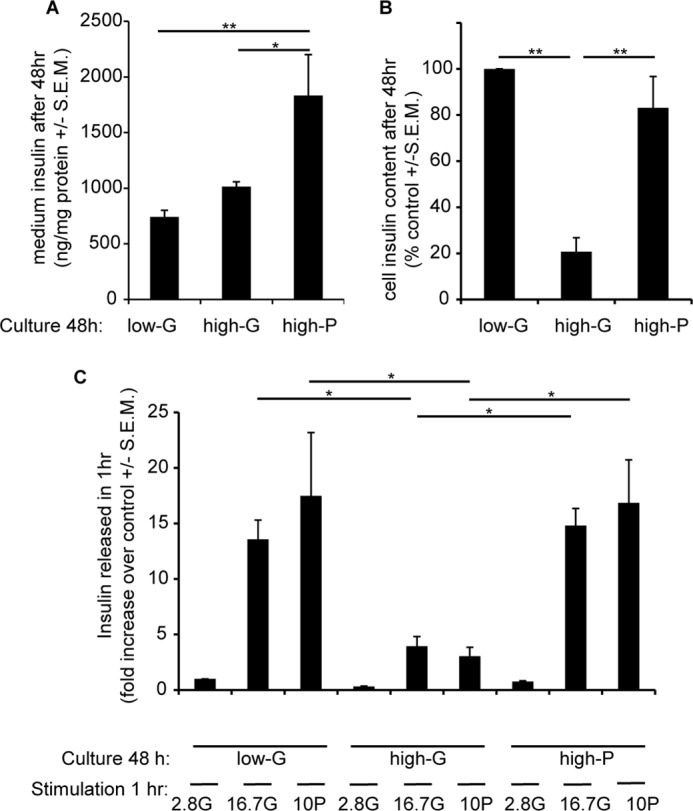
Effects of 48 h of exposure of INS-1 832/13 cells to high glucose or pyruvate on insulin content and release. Cells were cultured for 48 h at 2.8 mm glucose (low-G), 16.7 mm glucose (high-G), or 2.8 mm glucose + 13.9 mm pyruvate (high-P). A, insulin accumulated in the media after the 48-h culture period. B, insulin content after the 48-h culture period. C, fold response of insulin release after returning cells to 2.8 mm glucose medium for 2 h and then stimulating with 16.7 mm glucose or 10 mm pyruvate for 1 h. The data are means ± S.E.M. from three independent experiments performed in triplicate for each condition. *, p < 0.05; **, p < 0.01 (n = 4–5).
TABLE 1.
Effects of glucose and pyruvate concentrations in the culture medium on accumulated insulin, insulin content, and release in INS-1 831/13 cells
The data are means ± S.E.M.
| Culture condition | Accumulated insulin | Insulin content | Insulin release |
||
|---|---|---|---|---|---|
| With 2.8 mm glucose | With 16.7 mm glucose | With 10 mm pyruvate | |||
| ng/mg protein | ng/mg protein | ng/mg protein/h | |||
| 2.8 mm glucose for 48 h | 742.1 ± 58.9 | 533.2 ± 140.9 | 4.5 ± 0.6 | 62.5 ± 13.9 | 71.1 ± 29.5 |
| 16.7 mm glucose for 48 h | 1015.0 ± 42.8 | 115.4 ± 53.3 | 1.4 ± 0.5 | 18.7 ± 5.9 | 14.6 ± 5.7 |
| 2.8 mm glucose + 13.9 mm pyruvate for 48 h | 1832.7 ± 369.1 | 456.7 ± 171.0 | 3.5 ± 0.7 | 67.6 ± 13.2 | 75.4 ± 17.8 |
To investigate possible reasons for these differences, the total insulin content of the cells was determined at the end of the 48-h culture. The insulin content of high-G cells was reduced by 79% relative to the low-G controls (Fig. 2B and Table 1). Thus, one hypothesis for the diminished GSIS would be that high glucose causes a depletion of secretory vesicle numbers and/or insulin content.
One advantage of INS-1 832/13 cells is that they possess the plasma membrane monocarboxylate carrier and can thus utilize exogenous pyruvate as an efficient substrate and secretagogue (22). If the diminished insulin secretion from the high-G cells was due to prolonged high substrate availability, it would be predicted that low glucose supplemented with pyruvate, which creates similar bioenergetic conditions to high glucose (23), would reproduce the defective secretion seen in high-G cells. However, after a 48-h culture in the presence of the combination of 2.8 mm glucose and 13.9 mm pyruvate (high-P) followed by 2 h in low glucose buffer, GSIS was as robust as from the low-G cultured cells (Fig. 2C and Table 1), so the hypothesis of “bioenergetic overload” was not supported.
An alternative hypothesis is that glycolysis fails during the high-G culture and does not recover during the 2-h preincubation prior to the assay, rendering the addition of glucose for the GSIS assay ineffective. We shall deal with glycolytic activity and mitochondrial function later, but here it would be predicted that direct addition of pyruvate for the GSIS (or rather “pyruvate-stimulated insulin secretion, PSIS”) assay would bypass such a block and support secretion. However, although pyruvate was an effective secretagogue for both low-G and high-P cells, it was as ineffective as glucose as a secretagogue for the high-G cells (Fig. 2C). Thus, the hypothesis of a glycolytic block is not consistent with these results. Pyruvate does, however, greatly enhance the release of insulin during the 48-h culture (Fig. 2A and Table 1) and interestingly totally prevents the depletion of the cellular insulin content seen in high-G (Fig. 2B and Table 1), which is consistent with an insulin granule “pool size” hypothesis.
Glycolysis
To confirm that high-G conditions did not inhibit glycolysis during the subsequent GSIS assay, the activity of glycolysis was estimated from the rate of [3H]OH produced from [5-3H]glucose. One molecule of [3H]OH is formed when 2-phosphoglycerate is converted to phosphoenolpyruvate by enolase. Both basal and glucose-stimulated glycolytic rates were actually elevated for high-G (but not high-P) cultured cells when compared with low-G cells (Fig. 3A), eliminating the hypothesis that a failure of glycolysis might underlie the decreased GSIS from these cells.
FIGURE 3.
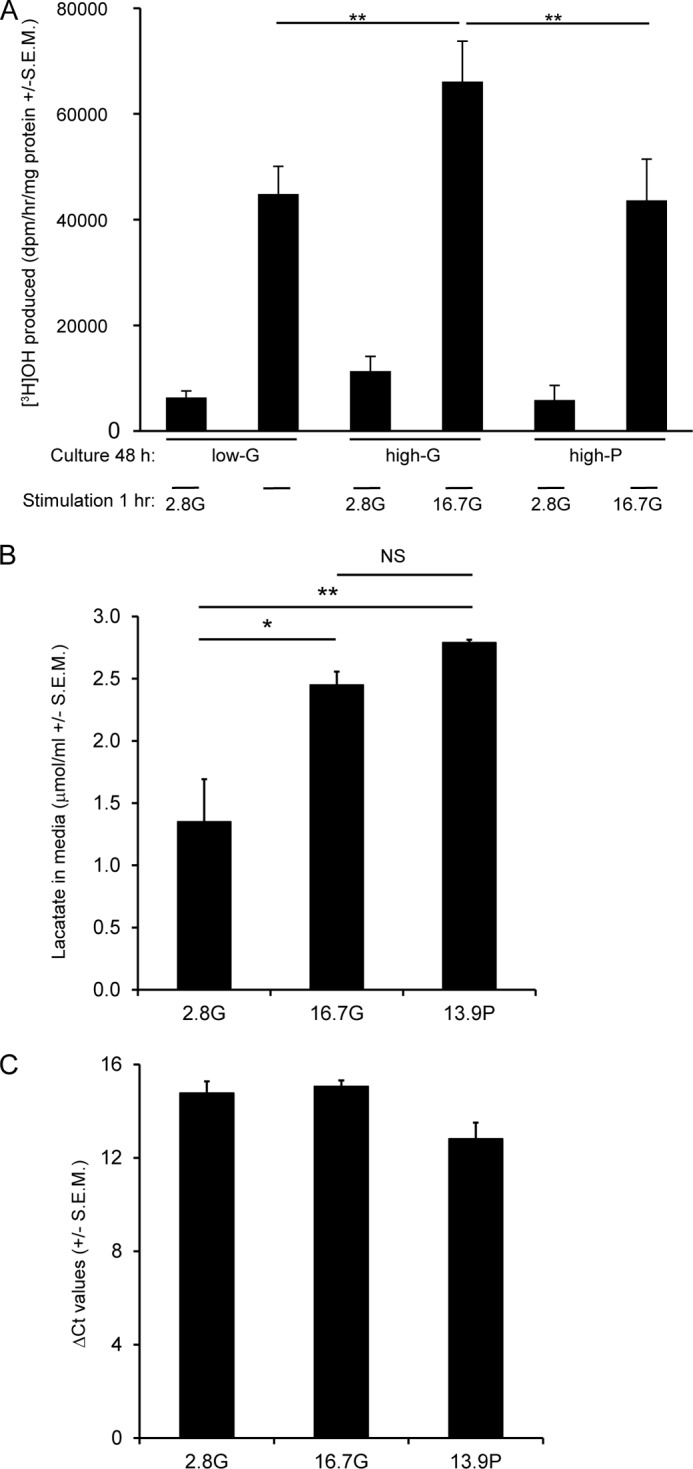
Glucose utilization and lactate release by high-G and high-P cells. A, for glucose utilization, INS-1 832/13 cells were stimulated with 2.8 or 16.7 mm glucose. B and C, lactate release (B) and expression of lactate dehydrogenase A mRNA (C) were determined after a 48-h culture. The data are means ± S.E.M. (n = 3–5). A one-way ANOVA followed by the Bonferroni post hoc test was used to compare differences between conditions in lactate release. A two-tailed Student's t test was used for analysis of glucose utilization. *, p < 0.05; **, p < 0.01 compared with low-G and high-P cells.
Another possible explanation for perturbed GSIS in high-G cells is enhanced lactate production, although β-cells do not normally express lactate dehydrogenase (24, 25). Accumulation of this glycolysis-derived metabolite could exert toxic cellular effects. Therefore, we measured lactate released into the medium during the 48-h incubation. Although there was a less than 2-fold increase in the lactate level in high-G cells, it was no different from that observed in high-P cells (Fig. 3B). Moreover, lactate dehydrogenase A mRNA expression was similar after all three culture conditions (Fig. 3C). Thus, lactate accumulation is not a likely explanation for perturbed GSIS by glucotoxicity.
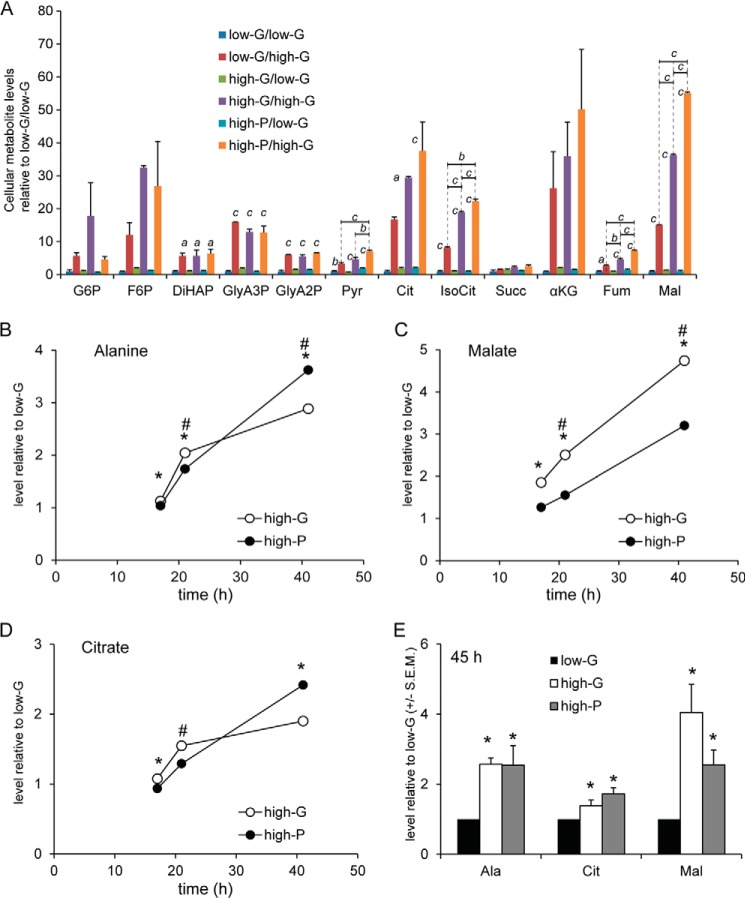
Moreover, metabolite profiling showed that high-G cells did not retain high levels of glycolytic (or TCA cycle) intermediates after 2 h in 2.8 mm glucose (Fig. 4A), eliminating the possibility that accumulated intermediates were responsible for either the deficient GSIS or the altered mitochondrial function discussed below. However, the metabolomics analysis revealed that stimulated levels of all glycolytic and TCA intermediates detected, with the interesting exception of succinate, were markedly enhanced in both low-G and high-G cells by the acute addition of 16.7 mm glucose (Fig. 4A), high-G cells showing a greater elevation in glucose-6-phosphate and fructose-6-phosphate levels when compared with low-G cells. This indicates that the glucose transporter and glucokinase were not impaired and may actually be enhanced by the 48-h high-G culture. It must be noted that the levels of glycolytic intermediates do not in themselves give information on the glycolytic flux; indeed, an elevated intermediate may be an indication of a downstream block of metabolism.
FIGURE 4.
Cellular metabolite levels in low-G, high-G, and high-P cells acutely exposed to 2. 8 mm and 16.7 mm glucose. A, data are expressed as levels relative those in low-G cells exposed to 2.8 mm glucose. Therefore, the level for each metabolite in low-G cells exposed to 2.8 mm glucose is set to the arbitrary level of 1. Comparisons between 2.8 and 16.7 mm glucose (asterisks above bars) or between low-G, high-G, and high-P cells (asterisks above lines) were made by ANOVA followed by Tukey's test. *, p < 0.05; **, p < 0.01; ***, p < 0.001. B–E, selected metabolites were profiled in low-G, high-G, and high-P cells incubated for 17, 21, 41, and 45 h without subsequent preincubation in 2.8 mm glucose and stimulation by 2.8 or 16.7 mm glucose. B–D show changes over time (17–41 h) for alanine (B), malate (C), and citrate (D) levels in high-G and high-P cells, whereas E shows a comparison of the levels of each metabolite at 45 h. At 45 h, there were no significant differences between high-G and high-P cells for any metabolite, whereas metabolite levels were increased compared with levels measured in low-G cells. The data were normalized to low-G cells and the protein level. Statistical significance was assessed by the Mann Whitney U test (B–E). *, p < 0.05 high-G versus low-G; #, p < 0.05 high-P versus low-G. LG, 2.8 mm glucose; HG, 16.7 mm glucose; Pyr, 13.9 mm pyruvate; Succ, succinate; Ala, alanine; Mal, malate; Cit, citrate; αKG, α-ketoglutarate; Fum, fumarate; IsoCit, isocitrate; G6P, glucose-6-phosphate; F6P, fructose-6-phosphate; DiHAP, dihydroxyacetonephosphate; GlyA3P, glyceraldehyde-3-phosphate 3; GlyA2P, glyceraldehyde-3-phosphate 2. Means ± S.E.M. of three independent experiments are given for all experiments.
The high-P condition was used to assess whether glucose exerted effects not mimicked by mitochondrial metabolism alone. For this analysis to be valid, pyruvate and glucose should be taken up into the cells and metabolized during the entire experiment. Therefore, we extracted metabolites at different time points during the incubation and profiled metabolites derived from pyruvate and glucose. In contrast to the data in Fig. 4A, the analysis shows metabolite levels under culture conditions, i.e., prior to preincubation and stimulation by 16.7 mm glucose or 10 mm pyruvate. Thus, Fig. 4 (B–D) shows increases over time in levels of alanine, malate, and citrate. The analysis revealed that levels of these pyruvate-derived metabolites increased during the whole experiment. Moreover, at the end of the incubation, there were no differences in levels of these selected metabolites between high-G and high-P cells (Fig. 4E). This further suggests that the load of mitochondrial metabolites was similar after culture in 16.7 mm glucose and 13.9 mm pyruvate.
Mitochondrial Respiration and Metabolite Levels
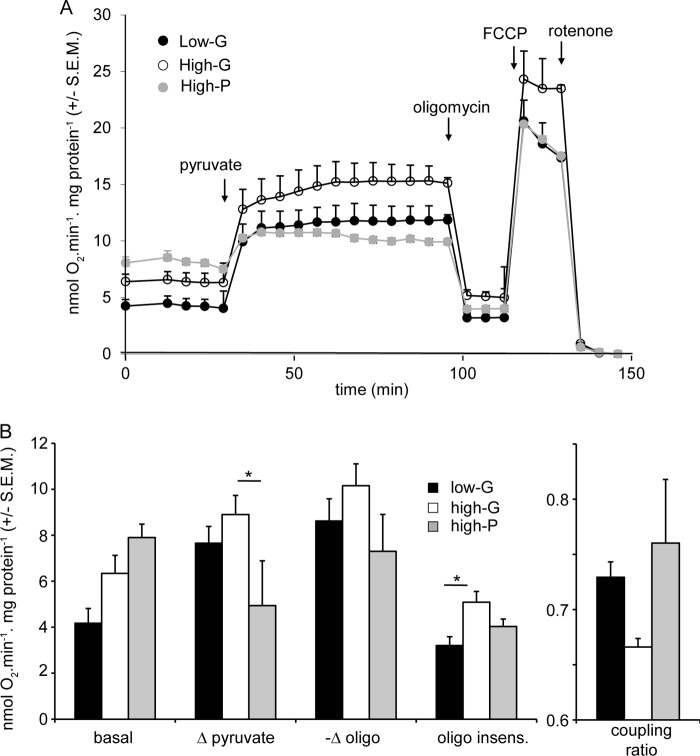
Because lactate release from INS-1 832/13 cells did not differ significantly between high-G and high-P cells (Fig. 3B), most of the pyruvate generated or added to the cells must enter the mitochondria. Therefore, the enhanced glycolysis of the high-G cells shown above (Fig. 3A) should be reflected in increased respiration. This is confirmed in Fig. 5. When normalized to cell protein and corrected for nonmitochondrial respiration, basal respiration of high-G cells in the presence of 2.8 mm glucose was increased by ∼60% relative to low-G cells. Interestingly, high-P cells showed the same elevation in basal respiration, suggesting that it is related to a change associated with high energy provision during the 48-h culture. The possibility that the increased basal respiration of the high-G cells was a consequence of accumulated metabolites retained after the 2-h preincubation could be eliminated, because no significant differences were observed in glycolytic or TCA cycle intermediates between low-G and high-G cells after 2 h in low glucose medium (Fig. 4A).
FIGURE 5.
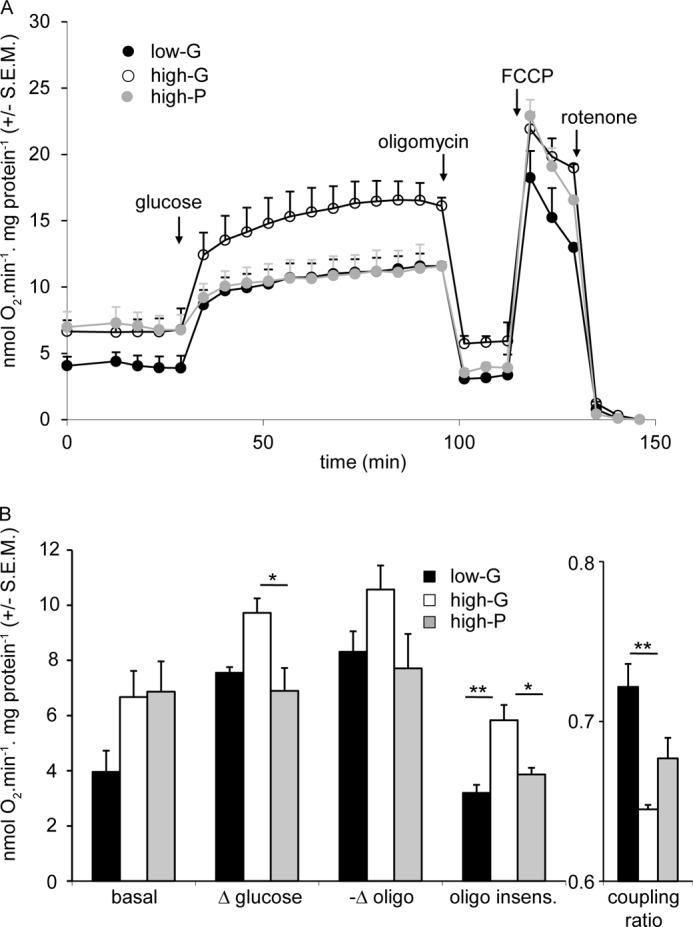
Cell respiratory control parameters of low-G, high-G, and high-P cells acutely exposed to high glucose. Cells were preincubated for 2 h in 2.8 mm glucose medium, before addition of 16.7 mm glucose, 4 μg/ml oligomycin, 4 μm FCCP, and 1 μm rotenone where indicated. A shows averaged traces from the actual experiments. B shows calculations as indicated of respiratory indices during the experiments. Δ glucose and −Δ oligomycin reports the change in respiration when glucose and oligomycin, respectively, are added. The oligomycin insensitive value (oligo insens.) reports the residual respiration after addition of the ATP synthase inhibitor. All rates are corrected for nonmitochondrial respiration. Coupling ratio is defined as oligomycin-sensitive respiration divided by respiration prior to oligomycin. The data presented are means ± S.E.M. of three independent experiments. *, p < 0.05; **, p < 0.01 as compared by ANOVA.
Confirming previous results (21), low-G cells subsequently stimulated by 16.7 mm glucose showed robust elevations in total cellular citrate, isocitrate, α-ketoglutarate, and malate levels, whereas levels of pyruvate and fumarate were less altered, and no change could be detected in succinate (Fig. 4A). The levels of these metabolites in high-G cells were even higher in response to 16.7 mm glucose. This notwithstanding, the magnitude of the responses for TCA cycle intermediates were not greater in high-G cells (i.e., fold responses). This suggests that metabolic regulation of these intermediates was not different. The elevations in metabolite concentrations upstream of α-ketoglutarate dehydrogenase suggest that this enzyme may exert significant control over TCA cycle activity in the presence of high glucose concentrations. The increase in malate is also notable and may be derived from oxaloacetate generated by pyruvate carboxylase.
The increased metabolite levels induced by 16.7 mm glucose in both low-G and high-G cells (Fig. 4A) were accompanied by a large increase in respiration of both low-G and high-G cells (Fig. 5). Much of this can be ascribed to increased ATP turnover, judged by the subsequent response to oligomycin. Interestingly, high-P cells, despite showing increased basal respiration, showed respiratory parameters in the presence of 16.7 mm glucose and following the subsequent addition of oligomycin that were indistinguishable from the low-G cells (Fig. 5). The respiratory responses of the cells to 10 mm pyruvate were similar to those to 16.7 mm glucose (Fig. 6).
FIGURE 6.
Cell respiratory control parameters of low-G, high-G, and high-P cells acutely exposed to high pyruvate. Experiments were performed in parallel to those in Fig. 5, except that cells were stimulated with 10 mm pyruvate. A shows averaged traces from the actual experiments. B shows calculations of respiratory indices during the experiments. The data presented are means ± S.E.M. of three independent experiments. *, p < 0.05; **, p < 0.01 as compared by ANOVA.
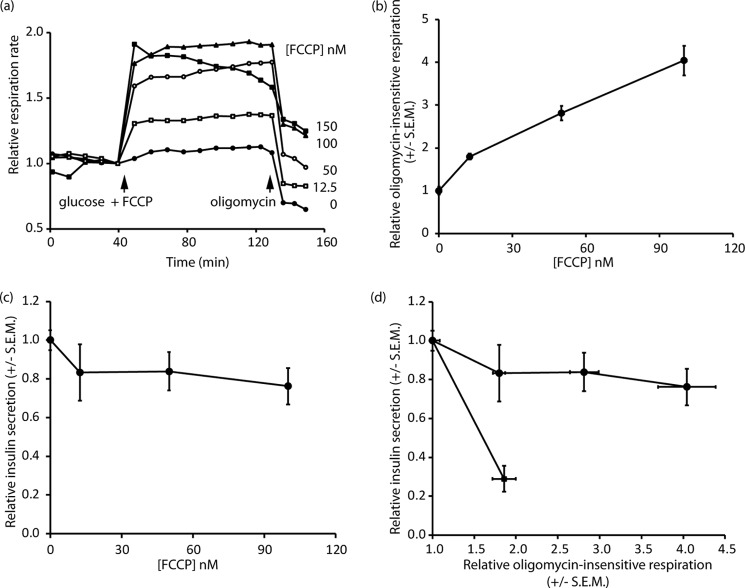
The most significant respiratory difference between low-G and high-P cells on the one hand and high-G cells on the other hand was that the latter show a raised oligomycin-insensitive respiration, indicative of an increased inner mitochondrial membrane proton conductance (Figs. 5 and 6). Because the high-G cells showed decreased GSIS and in view of the extensive literature implicating a role for a UCP2-mediated proton leak in decreasing insulin secretion (26), it was thought relevant to test the hypothesis that the increased proton leak in the high-G cells could be causative of the decreased GSIS. To this end, the respiration of low-G cells was monitored following addition of 16.7 mm glucose together with low nanomolar concentrations of the protonophore FCCP (Fig. 7A). The subsequent addition of oligomycin allowed proton leak to be quantified (Fig. 7B). At the end of the experiment, each well was sampled for insulin content (Fig. 7C), so that a correlation between protonophore-mediated proton leak and GSIS could be obtained. The results indicate that insulin secretion from INS-1 832/13 cells, at least in the presence of supramaximal glucose, was surprisingly resistant to changes in proton leak. When the changes in proton leak and insulin secretion were correlated for the high-G cells, relative to low-G cells, it was clear that the decrease in insulin secretion caused by 48 h of high glucose exposure was much too severe to be accounted for by the increased mitochondrial proton leak.
FIGURE 7.
Induced proton leak and determinations of respiration and insulin secretion. Respiration and insulin release were monitored in low-G cells in response to the addition of 16.7 mm glucose accompanied by varying concentrations of FCCP (0–150 nm). The 150 nm FCCP trace showed declining respiration and was not further considered. a, relative respiratory rates; oligomycin was added to inhibit the ATP synthase to allow the proton leak to be estimated. b, proton leak as a function of FCCP concentration. c, insulin secretion assayed from the Seahorse well supernatants as a function of FCCP concentration. d, cross-correlation between proton leak and relative insulin secretion in the presence of FCCP (circles) and for chronic high glucose cultured cells relative to low glucose controls (square). The data are means ± S.E.M. of three to six independent experiments.
Mitochondrial Membrane Potential Changes
Equilibration of INS-1 832/13 cells with 100 nm TMRM+ allows changes in mitochondrial membrane potential (Δψm) to be assessed in quench mode, where a mitochondrial hyperpolarization results in a decrease in whole cell fluorescence as the probe is further transported from the cytosol to the matrix, where its fluorescence is quenched (18). It should be noted that this condition does not allow absolute values of Δψm to be compared between different cell preparations but is a sensitive means of detecting changes in Δψm during an experiment.
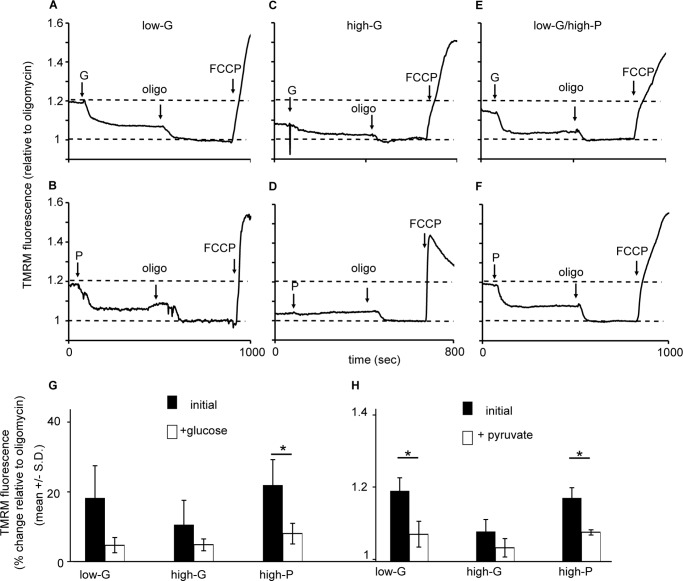
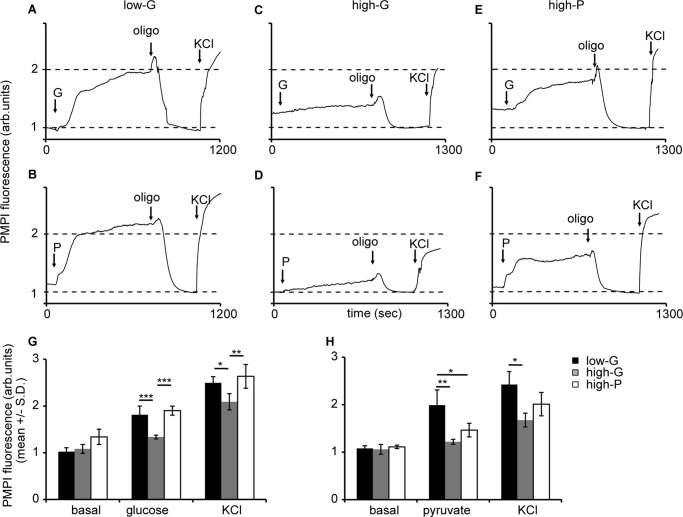
We monitored Δψm changes with TMRM+ in response to glucose and pyruvate stimulation in low- and high-G-cultured as well as high-P-cultured cells. Fig. 8 (A–F) show a gallery of representative fluorescent traces. Low-G and high-P cells showed a rapid and robust mitochondrial hyperpolarization following addition of 10 mm pyruvate or 16.7 mm glucose and a further hyperpolarization on addition of oligomycin in response to an inhibition of proton re-entry via the ATP synthase (Fig. 8). In the high-G cells, the substrate-induced hyperpolarization was attenuated and did not reach significance, whereas the oligomycin hyperpolarization was still apparent.
FIGURE 8.
Mitochondrial membrane potential responses of low-G, high-G, and high-P cells to high glucose or pyruvate, and oligomycin. A–F, cells incubated in buffer with 2.8 mm glucose for 2 h in the presence of TMRM+. At the indicated times cells were stimulated with 16.7 mm glucose (G) or 10 mm pyruvate (P), followed by 4 μg/ml oligomycin (oligo) and 4 μm FCCPs. A and B, glucose (A) and pyruvate stimulation (B) in low glucose-cultured cells. The data presented are representative examples from a total of three to seven experiments. G, means ± S.D. for glucose stimulation. H, means ± S.D. for pyruvate stimulation. *, p < 0.05.
Putting together the data from the cell respiration (Figs. 5 and 6) and TMRM+ experiment (Fig. 8), we came to a surprising conclusion: the high-G cells increase their respiration in response to elevated glucose or pyruvate (Fig. 5), but this is accompanied by a diminished change in Δψm (Fig. 6). Because TMRM+ in quench mode only reports changes in Δψm, these experiments do not establish whether the dampened Δψm response to 16.7 mm glucose in the high-G cells represents a failure to hyperpolarize from a baseline potential similar to the low-G cells or whether the mitochondria are already hyperpolarized, for example by residual endogenous substrate from the 48 h culture in high glucose, still present after the 2-h preincubation. Nevertheless, the analysis of glycolytic and TCA cycle intermediates in high-G cells preincubated for 2 h in 2.8 mm glucose incubation medium (Fig. 4A) showed no elevation relative to low-G cells under the same conditions.
Over an extended time course, changes in plasma membrane potential, Δψp, will alter the distribution of TMRM+ across the plasma membrane and hence whole cell fluorescence. Therefore, we repeated key experiments in the presence of 200 μm diazoxide to maintain the KATP channels fully open. We found that that the substrate- and oligomycin-induced changes in TMRM+ signal were not due to changes in Δψp (data not shown).
Plasma Membrane Potential Changes
The anionic cell-permeant plasma membrane potential probe PMPI is a sensitive and rapidly responding tool to monitor changes in Δψp in INS-1 832/13 cells and other cells (23). Activation of KATP channels following inhibition of mitochondrial ATP synthesis by oligomycin created a stable polarized plasma membrane potential, and we have normalized each trace to this value (Fig. 9). Both low-G and high-P cells responded promptly to elevated glucose or pyruvate with a rapid population depolarization (Fig. 9). This acute response was attenuated in the high-G cells. These results paralleled the Δψm hyperpolarization results discussed above. Interestingly, the increase in PMPI fluorescence resulting from the addition of KCl to 25 mm, which was intended to produce a standard fluorescent enhancement, showed a significantly decreased response in high-G cells (2.09 ± 0.17) relative to low-G cells (2.49 ± 0.13; p < 0.05).
FIGURE 9.
Plasma membrane potential responses of low-G, high-G, and high-P cells to high glucose or pyruvate, and oligomycin. A–F, cells incubated in buffer with 2.8 mm glucose for 2 h, following which PMPI was added (see “Experimental Procedures”). At the indicated times, cells were stimulated with 16.7 mm glucose (G) or 10 mm pyruvate (P), followed by 4 μg/ml oligomycin (oligo) and 25 mm KCl. G, means ± S.D. for glucose stimulation. H, means ± S.D. for pyruvate stimulation. * p < 0.05.
Reversibility of the Chronic High Glucose-induced Alterations
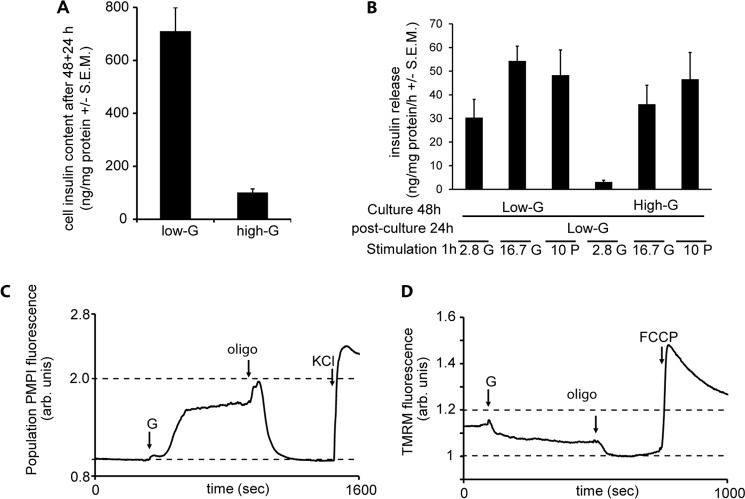
Finally, we set out to investigate whether the dramatic alterations induced by chronic high glucose in INS-1 832/13 cells could be reversed. After a 48-h incubation, high-G cells were cultured for a further 24 h in medium containing 2.8 mm glucose. When compared with low-G cells after a further 24 h of low glucose incubation, basal levels of insulin secretion remained lower, although the response to stimulation with 16.7 mm glucose or 10 mm pyruvate was restored (Fig 10B and Table 2). However, the total insulin content of the cells remained suppressed: after a 24-h post-culture in 2.8 mm glucose, the insulin content was 710 ± 89 ng/mg protein in cells previously cultured at low glucose (low-G) and 101 ± 14 ng/mg protein (means ± S.E., p < 0.001, n = 4 experiments) in cells previously cultured at high glucose (high-G) (Fig. 10A). Furthermore, 16.7 mm glucose-induced mitochondrial hyperpolarization (Fig. 10D) and plasma membrane depolarization (Fig. 10C) were largely restored. This result argues against the hypothesis that depletion in total insulin content is necessarily associated with decreased secretion.
FIGURE 10.
Secretory function and excitability of high-G cells after a 24-h recovery in low glucose medium. Low-G and high-G cells incubated for 48 h at 2.8 mm or 16.7 mm glucose were transferred to 2.8 mm glucose culture for a further 24 h. A, insulin content. B, insulin secretion in response to 2.8 or 16.7 mm glucose (G) or 10 mm pyruvate (P). C, plasma membrane potential responses to 16.7 mm glucose, 4 μg/ml oligomycin, and KCl to 25 mm. D, mitochondrial membrane potential responses to 16.7 mm glucose, 4 μg/ml oligomycin, and 4 μm FCCP. Insulin secretion data are means ± S.E. Plasma and mitochondrial membrane responses are representative for three independent experiments.
TABLE 2.
Insulin release in INS-1 831/13 cells after 24 h of recovery
The data are means ± S.E.
| Culture condition | Insulin release |
||
|---|---|---|---|
| With 2.8 mm glucose | With 16.7 mm glucose | With 10 mm pyruvate | |
| ng/mg protein/h | |||
| 2.8 mm glucose for 48 h + 2.8 mm glucose for 24 h | 17.7 ± 6.4 | 43.5 ± 5.6 | 39.7 ± 7.4 |
| 16.7 mm glucose for 48 h +2.8 mm glucose for 24 h | 2.7 ± 0.4 | 34.4 ± 7.6 | 36.3 ± 5.2 |
DISCUSSION
Glucotoxicity is a widely accepted pathogenetic process in T2D (9, 10). It is believed that excessive metabolism of glucose generates ROS, exceeding the defense mechanisms in β-cell mitochondria. The surplus of ROS may act at many different levels in the pancreatic β-cell. Most agree that effects on the transcriptional machinery are critical in the events leading to failure and, ultimately, depletion of β-cells (11). In this study, we have used an established in vitro model—prolonged culture (48 h) in elevated ambient glucose (16.7 mm) of clonal insulin-producing cells (17)—to examine metabolic processes in glucotoxicity.
The most striking finding was that although culture of the INS-1 832/13 cells at high glucose impacted several aspects of core cellular functions, culture for the same time in a comparable concentration of pyruvate left the cells functionally intact. Insulin secretion, plasma membrane depolarization, mitochondrial membrane polarization, and fuel-stimulated respiration were similar in INS-1 832/13 cells cultured in 2.8 mm glucose with or without 13.9 mm pyruvate. The implication of this finding is that mere metabolic overload, which was quite similar with the concentrations of glucose and pyruvate used here, is not sufficient to perturb cellular function. Instead, there must be a pathogenetic process in glucotoxicity linked specifically to the metabolism of glucose. Interestingly, culture in high glucose reduced insulin content. However, depletion of insulin content alone cannot account for impaired insulin secretion. This was corroborated by the recovery experiment that we performed: the high-G cells restored their bioenergetic responses, plasma membrane depolarization, and insulin secretion after a further 24-h culture in low glucose medium, while still retaining decreased insulin content (Fig. 10); this argues against insulin granule pool depletion being the sole cause of diminished secretion.
To determine which aspects of metabolism accounted for the specific toxic effect of glucose on cellular function, we profiled metabolites, using an established GC/MS-based approach (21). This analysis demonstrated that high-G cells did not retain elevated levels of glycolytic or TCA cycle intermediates following a 2-h postincubation in 2.8 mm glucose. In addition, the metabolic responses to an elevation of glucose from 2.8 to 16.7 mm were largely similar for TCA cycle metabolites extracted from low- and high-G cells as well as high-P cells. Differences, however, were observed in metabolite levels emanating from the initial part of glycolysis. Although this does not establish a causal relationship, it still highlights a marked metabolic difference between cells cultured at low and high glucose, which perform robustly or not in response to physiological stimuli. Exactly how this comes about is unclear, but it is noteworthy that the pentose phosphate pathway has recently been implicated in glucotoxic β-cell dysfunction (27). Moreover, this pathway may also play a role in β-cell stimulus-secretion coupling (28).
Exposure to elevated glucose levels leads to increased ROS production in isolated islets and clonal insulin-producing cells (29, 30). Given the assumed pathogenetic role of ROS production in mitochondria, we were surprised to find that mitochondrial respiratory responses of high-G cells to subsequent elevated glucose or pyruvate were retained or even elevated, relative to low-G cells, when expressed per mg protein.
This notwithstanding, we did observe several effects of chronic high glucose on the bioenergetics of the INS-1 832/13 cells. The high-G cells displayed a loss of responsiveness to acute elevation of glucose or pyruvate in terms of changes in Δψm, and hence Δψp, despite respiration being still stimulated to the same extent as in low-G cells, and despite a significant increase in oligomycin-insensitive respiration (proton leak). This surprising result suggests that the control exerted by respiration over Δψm (or rather protonmotive force) is decreased in the high-G cells, with a consequent loss of sensitivity of GSIS. One way this might occur would be for the inner mitochondrial membrane proton leak to change its current-voltage relationship to increase its “non-ohmicity,” the ability to increase its conductance in response to increased substrate availability with little or no change in Δψm. Such behavior has previously been described in brown adipose tissue mitochondria for the archetypal UCP1 (31).
Insulinoma-derived cells and β-cells express UCP2 (14, 15, 26, 32–34). The putative uncoupling protein has been proposed to contribute to restrained GSIS, because a UCP2 knock-out enhanced insulin secretion in the mouse (13). This has led to considerable literature based on the hypothesis that a UCP2-mediated proton leak might decrease GSIS by lowering Δψm and preventing optimal generation of cytoplasmic ATP to inhibit the KATP channel (26, 32–34). This hypothesis, however, has several weak points: first, extensive backcrossing actually reverses the phenotype, such that a UCP2 knock-out decreases GSIS, perhaps by increasing oxidative stress (14). Second, the hypothesis that the so-called novel uncoupling proteins actually have protonophoric activity is being increasingly called into doubt (35–37). Finally, as we show in this paper, insulin secretion, at least that initiated by 16.7 mm glucose, was remarkably insensitive to the addition of synthetic protonophore, sufficient to increase the proton leak by up to 300% (Fig. 7). The dramatic inhibition of GSIS from high-G cells was far too extensive to be accounted for by the relatively modest increase in proton leak observed in these cells (Figs. 5 and 6).
It has previously been described that pyruvate is transiently metabolized in primary β-cells (38). Down-regulated transport of this metabolite was suggested to underlie this phenomenon. To examine whether this can account for the lack of “toxicity” in our experiments, we performed a profiling of selected metabolites derived from pyruvate over time. These experiments showed that, alanine, citrate, and malate levels, for example, increased over time with culture in a similar fashion in high-G and high-P cells. The fact that pyruvate was an efficient secretagogue in high-P cells after 48 h as well as increased respiration, hyperpolarized the mitochondrial membrane and depolarized the plasma membrane, all in a metabolism-dependent manner, further supported that cellular transport and metabolism of pyruvate were not impaired in high-P cells.
We therefore conclude that although an increased proton leak cannot account for the decreased GSIS from the high-G cells, an altered current-voltage relationship for the endogenous leak may serve to decrease the control exerted by electron transport over Δψm and hence insulin secretion. The mechanism underlying this is currently unclear and must relate to a specific property of glucose, or one of its metabolites, because high-P cells retain sensitivity.
Footnotes
- T2D
- type 2 diabetes
- ANOVA
- analysis of variance
- FCCP
- carbonyl cyanide-p-trifluoromethoxyphenylhydrazone
- GSIS
- glucose-stimulated insulin secretion
- PMPI
- plasma membrane potential indicator
- ROS
- reactive oxygen species
- TMRM
- tetramethylrhodamine methyl ester
- UCP
- uncoupling protein.
REFERENCES
- 1. Shaw J. E., Sicree R. A., Zimmet P. Z. (2010) Global estimates of the prevalence of diabetes for 2010 and 2030. Diabetes Res. Clin. Pract. 87, 4–14 [DOI] [PubMed] [Google Scholar]
- 2. Muoio D. M., Newgard C. B. (2006) Obesity-related derangements in metabolic regulation. Annu. Rev. Biochem. 75, 367–401 [DOI] [PubMed] [Google Scholar]
- 3. Ashcroft F. M., Rorsman P. (2012) Diabetes mellitus and the beta cell. The last ten years. Cell 148, 1160–1171 [DOI] [PMC free article] [PubMed] [Google Scholar]
- 4. Wiederkehr A., Wollheim C. B. (2012) Mitochondrial signals drive insulin secretion in the pancreatic beta-cell. Mol. Cell. Endocrinol. 353, 128–137 [DOI] [PubMed] [Google Scholar]
- 5. Ashcroft F. M., Harrison D. E., Ashcroft S. J. (1984) Glucose induces closure of single potassium channels in isolated rat pancreatic beta-cells. Nature 312, 446–448 [DOI] [PubMed] [Google Scholar]
- 6. Komatsu M., Aizawa T., Takasu N., Yamada T. (1989) Glucose raises cytosolic free calcium in the rat pancreatic islets. Horm. Metab. Res. 21, 405–409 [DOI] [PubMed] [Google Scholar]
- 7. Gembal M., Gilon P., Henquin J. C. (1992) Evidence that glucose can control insulin release independently from its action on ATP-sensitive K+ channels in mouse B cells. J. Clin. Invest. 89, 1288–1295 [DOI] [PMC free article] [PubMed] [Google Scholar]
- 8. Leahy J. L., Cooper H. E., Deal D. A., Weir G. C. (1986) Chronic hyperglycemia is associated with impaired glucose influence on insulin secretion. A study in normal rats using chronic in vivo glucose infusions. J. Clin. Invest. 77, 908–915 [DOI] [PMC free article] [PubMed] [Google Scholar]
- 9. Robertson R. P., Harmon J., Tran P. O., Tanaka Y., Takahashi H. (2003) Glucose toxicity in beta-cells. Type 2 diabetes, good radicals gone bad, and the glutathione connection. Diabetes 52, 581–587 [DOI] [PubMed] [Google Scholar]
- 10. Jonas J. C., Bensellam M., Duprez J., Elouil H., Guiot Y., Pascal S. M. (2009) Glucose regulation of islet stress responses and beta-cell failure in type 2 diabetes. Diabetes Obes. Metab. 11, 65–81 [DOI] [PubMed] [Google Scholar]
- 11. Jonas J. C., Laybutt D. R., Steil G. M., Trivedi N., Pertusa J. G., Van de Casteele M., Weir G. C., Henquin J. C. (2001) High glucose stimulates early response gene c-Myc expression in rat pancreatic beta cells. J. Biol. Chem. 276, 35375–35381 [DOI] [PubMed] [Google Scholar]
- 12. Elouil H., Bensellam M., Guiot Y., Vander Mierde D., Pascal S. M., Schuit F. C., Jonas J. C. (2007) Acute nutrient regulation of the unfolded protein response and integrated stress response in cultured rat pancreatic islets. Diabetologia 50, 1442–1452 [DOI] [PubMed] [Google Scholar]
- 13. Zhang C. Y., Baffy G., Perret P., Krauss S., Peroni O., Grujic D., Hagen T., Vidal-Puig A. J., Boss O., Kim Y. B., Zheng X. X., Wheeler M. B., Shulman G. I., Chan C. B., Lowell B. B. (2001) Uncoupling protein-2 negatively regulates insulin secretion and is a major link between obesity, beta cell dysfunction, and type 2 diabetes. Cell 105, 745–755 [DOI] [PubMed] [Google Scholar]
- 14. Pi J., Bai Y., Daniel K. W., Liu D., Lyght O., Edelstein D., Brownlee M., Corkey B. E., Collins S. (2009) Persistent oxidative stress due to absence of uncoupling protein 2 associated with impaired pancreatic beta-cell function. Endocrinology 150, 3040–3048 [DOI] [PMC free article] [PubMed] [Google Scholar]
- 15. Collins S., Pi J., Yehuda-Shnaidman E. (2012) Uncoupling and reactive oxygen species (ROS). A double-edged sword for beta-cell function? “Moderation in all things.” Best Pract. Res. Clin. Endocrinol. Metab. 26, 753–758 [DOI] [PubMed] [Google Scholar]
- 16. Anello M., Lupi R., Spampinato D., Piro S., Masini M., Boggi U., Del Prato S., Rabuazzo A. M., Purrello F., Marchetti P. (2005) Functional and morphological alterations of mitochondria in pancreatic beta cells from type 2 diabetic patients. Diabetologia 48, 282–289 [DOI] [PubMed] [Google Scholar]
- 17. Krus U., Kotova O., Spégel P., Hallgard E., Sharoyko V. V., Vedin A., Moritz T., Sugden M. C., Koeck T., Mulder H. (2010) Pyruvate dehydrogenase kinase 1 controls mitochondrial metabolism and insulin secretion in INS-1 832/13 clonal beta-cells. Biochem. J. 429, 205–213 [DOI] [PubMed] [Google Scholar]
- 18. Ward M. W., Rego A. C., Frenguelli B. G., Nicholls D. G. (2000) Mitochondrial membrane potential and glutamate excitotoxicity in cultured cerebellar granule cells. J. Neurosci. 20, 7208–7219 [DOI] [PMC free article] [PubMed] [Google Scholar]
- 19. Malmgren S., Nicholls D. G., Taneera J., Bacos K., Koeck T., Tamaddon A., Wibom R., Groop L., Ling C., Mulder H., Sharoyko V. V. (2009) Tight coupling between glucose and mitochondrial metabolism in clonal beta-cells is required for robust insulin secretion. J. Biol. Chem. 284, 32395–32404 [DOI] [PMC free article] [PubMed] [Google Scholar]
- 20. Malmgren S., Spégel P., Danielsson A. P., Nagorny C. L., Andersson L. E., Nitert M. D., Ridderstråle M., Mulder H., Ling C. (2013) Coordinate changes in histone modifications, mRNA levels, and metabolite profiles in clonal INS-1 832/13 beta-cells accompany functional adaptations to lipotoxicity. J. Biol. Chem. 288, 11973–11987 [DOI] [PMC free article] [PubMed] [Google Scholar]
- 21. Spégel P., Malmgren S., Sharoyko V. V., Newsholme P., Koeck T., Mulder H. (2011) Metabolomic analyses reveal profound differences in glycolytic and tricarboxylic acid cycle metabolism in glucose-responsive and -unresponsive clonal beta-cell lines. Biochem. J. 435, 277–284 [DOI] [PubMed] [Google Scholar]
- 22. Ishihara H., Wang H., Drewes L. R., Wollheim C. B. (1999) Overexpression of monocarboxylate transporter and lactate dehydrogenase alters insulin secretory responses to pyruvate and lactate in beta cells. J. Clin. Invest. 104, 1621–1629 [DOI] [PMC free article] [PubMed] [Google Scholar]
- 23. Goehring I., Gerencser A. A., Schmidt S., Brand M. D., Mulder H., Nicholls D. G. (2012) Plasma membrane potential oscillations in insulin secreting INS-1 832/13 cells do not require glycolysis and are not initiated by fluctuations in mitochondrial bioenergetics. J. Biol. Chem. 287, 15706–15717 [DOI] [PMC free article] [PubMed] [Google Scholar]
- 24. Sekine N., Cirulli V., Regazzi R., Brown L. J., Gine E., Tamarit-Rodriguez J., Girotti M., Marie S., MacDonald M. J., Wollheim C. B., Rutter G. A. (1994) Low lactate dehydrogenase and high mitochondrial glycerol phosphate dehydrogenase in pancreatic beta-cells. Potential role in nutrient sensing. J. Biol. Chem. 269, 4895–4902 [PubMed] [Google Scholar]
- 25. Thorrez L., Laudadio I., Van Deun K., Quintens R., Hendrickx N., Granvik M., Lemaire K., Schraenen A., Van Lommel L., Lehnert S., Aguayo-Mazzucato C., Cheng-Xue R., Gilon P., Van Mechelen I., Bonner-Weir S., Lemaigre F., Schuit F. (2011) Tissue-specific disallowance of housekeeping genes. The other face of cell differentiation. Genome Res. 21, 95–105 [DOI] [PMC free article] [PubMed] [Google Scholar]
- 26. Chan C. B., Saleh M. C., Koshkin V., Wheeler M. B. (2004) Uncoupling protein 2 and islet function. Diabetes 53, S136–S142 [DOI] [PubMed] [Google Scholar]
- 27. Goehring I., Sauter N. S., Catchpole G., Assmann A., Shu L., Zien K. S., Moehlig M., Pfeiffer A. F., Oberholzer J., Willmitzer L., Spranger J., Maedler K. (2011) Identification of an intracellular metabolic signature impairing beta cell function in the rat beta cell line INS-1E and human islets. Diabetologia 54, 2584–2594 [DOI] [PubMed] [Google Scholar]
- 28. Spégel P., Sharoyko V. V., Goehring I., Danielsson A. P., Malmgren S., Nagorny C. L., Andersson L. E., Koeck T., Sharp G. W., Straub S. G., Wollheim C. B., Mulder H. (2013) Time-resolved metabolomics analysis of beta-cells implicates the pentose phosphate pathway in the control of insulin release. Biochem. J. 450, 595–605 [DOI] [PubMed] [Google Scholar]
- 29. Sakai K., Matsumoto K., Nishikawa T., Suefuji M., Nakamaru K., Hirashima Y., Kawashima J., Shirotani T., Ichinose K., Brownlee M., Araki E. (2003) Mitochondrial reactive oxygen species reduce insulin secretion by pancreatic beta-cells. Biochem. Biophys. Res. Commun. 300, 216–222 [DOI] [PubMed] [Google Scholar]
- 30. Fridlyand L. E., Philipson L. H. (2004) Does the glucose-dependent insulin secretion mechanism itself cause oxidative stress in pancreatic beta-cells? Diabetes 53, 1942–1948 [DOI] [PubMed] [Google Scholar]
- 31. Rial E., Poustie A., Nicholls D. G. (1983) Brown-adipose-tissue mitochondria. The regulation of the 32000-Mr uncoupling protein by fatty acids and purine nucleotides. Eur. J. Biochem. 137, 197–203 [DOI] [PubMed] [Google Scholar]
- 32. Affourtit C., Brand M. D. (2008) Uncoupling protein-2 contributes significantly to high mitochondrial proton leak in INS-1E insulinoma cells and attenuates glucose-stimulated insulin secretion. Biochem. J. 409, 199–204 [DOI] [PubMed] [Google Scholar]
- 33. Joseph J. W., Koshkin V., Zhang C. Y., Wang J., Lowell B. B., Chan C. B., Wheeler M. B. (2002) Uncoupling protein 2 knockout mice have enhanced insulin secretory capacity after a high-fat diet. Diabetes 51, 3211–3219 [DOI] [PubMed] [Google Scholar]
- 34. Segall L., Lameloise N., Assimacopoulos-Jeannet F., Roche E., Corkey P., Thumelin S., Corkey B. E., Prentki M. (1999) Lipid rather than glucose metabolism is implicated in altered insulin secretion caused by oleate in INS-1 cells. Am. J. Physiol. 40, E521–E528 [DOI] [PubMed] [Google Scholar]
- 35. Bouillaud F. (2009) UCP2, not a physiologically relevant uncoupler but a glucose sparing switch impacting ROS production and glucose sensing. Biochim. Biophys. Acta 1787, 377–383 [DOI] [PubMed] [Google Scholar]
- 36. Nedergaard J., Cannon B. (2003) The “novel” “uncoupling” proteins UCP2 and UCP3. What do they really do? Pros and cons for suggested functions. Exp. Physiol. 88, 65–84 [DOI] [PubMed] [Google Scholar]
- 37. Nicholls D. G. (2006) The physiological regulation of uncoupling proteins. Biochim. Biophys. Acta 1757, 459–466 [DOI] [PubMed] [Google Scholar]
- 38. Rocheleau J. V., Head W. S., Nicholson W. E., Powers A. C., Piston D. W. (2002) Pancreatic islet beta-cells transiently metabolize pyruvate. J. Biol. Chem. 277, 30914–30920 [DOI] [PubMed] [Google Scholar]


