

Abstract
Apolipoprotein E (ApoE) polymorphism has been appreciated as a valuable predictor of Alzheimer disease (AD), and the associated ε4 allele has been recognized as an indicator of susceptibility to this disease. However, serum ApoE levels have been a controversial issue in AD, due to the great variability regarding the different target detection methods, ethnicity, and the geographic variations of cohorts. The aim of this study was to validate serum ApoE levels in relation to AD, particularly using two distinct detection methods, liquid chromatography–selected reaction monitoring (SRM) mass spectrometry and microsphere-based fluorescence-activated cell sorting (FACS) analysis, to overcome experimental variations. Also, comparison of serum ApoE levels was performed between the level of protein detection by FACS and peptide level by SRM in both control and AD patients. Results from the two detection methods were cross-confirmed and validated. Both methods produced fairly consistent results, showing a significant decrease of serum ApoE levels in AD patients relative to those of a control cohort (43 control versus 45 AD, p < 0.0001). Significant correlation has been revealed between results from FACS and SRM (p < 0.0001) even though lower serum ApoE concentration values were measured in protein by FACS analysis than in peptide-level detections by SRM. Correlation study suggested that a decrease of the serum ApoE level in AD is related to the mini-mental state exam score in both results from different experimental methods, but it failed to show consistent correlation with age, gender, or clinical dementia rating.
Alzheimer disease (AD)1 is the most common neurodegenerative disorder among the elderly population and causes fatal cognitive dysfunction, including learning and memory impairment. Two distinctive features of AD, senile plaques of amyloid-β and neurofibrillary tangles in the brain, have been considered as hallmarks of the main pathological phenomena in AD (1–3). An increased number of AD patients in modern society leads to multiple problems—not only physical and emotional problems, but also societal problems regarding employment status and financial crises in the public health system (4, 5). Despite drastic increases in the number of AD patients and efforts to prevent and cure this disease, neither decisive diagnostic biomarkers nor definite therapeutic remedies have been developed. Only a few medications are available for improving AD symptoms, but these do not modify disease progress (6). Researchers agree that many candidate medications have failed in clinical trials because they were used in the later stages of AD progression, which are characterized by irreversible damage that includes amyloid-β deposits and functional impairment of neurons (7). Finding a diagnostic biomarker, especially for the early stages of AD pathology, is essential for the discovery of a valuable therapeutic target at the right stage and prevention of disease progression.
Potential risk factors for AD discovered thus far include older age, female gender, low level of education, and smoking (8). Apolipoprotein E (ApoE) polymorphism has been recognized as the most probable indicator to date (9–11). ApoE is a 34-kDa polymorphic protein representing three major isoforms of ApoE, ApoE2, ApoE3, and ApoE4 (12). These isoforms are coded by the ε2, ε3, and ε4 alleles, respectively, located on a single locus on chromosome 19. Each isoform differs by a single amino acid substitution. ApoE was originally found to be related to metabolism, especially lipid transport and redistribution, and relevant to cardiovascular disease (13, 14). However, ApoE has attracted a great deal of attention since the ε4 allele was found to indicate genetic susceptibility to AD development, in both late-onset familial AD and sporadic AD, in different ethnic cohorts, including African American, Australian, Japanese, and Korean populations (9, 15–19). Ever since ε4 allelic preferences to AD were recognized, interest has been drawn to the correlation of serum ApoE level and AD, because ApoE protein possibly has a direct connection to AD progression by playing an important role in cholesterol metabolism and amyloid-β clearance (20). The serum ApoE level in AD patients has been intensively studied, but the results have generated discrepancies and controversies. Immunoblot data revealed increased plasma ApoE levels in early and late-onset AD patients relative to a control cohort (21). In contrast, a Rotterdam study by Slooter et al. reported no increase in the serum ApoE level in AD as determined via a colorimetric method (22). The ApoEurope project collected patient and control samples from nine centers in eight European countries and demonstrated both increased occurrence of the ApoE ε4 allele and decreased serum ApoE levels in AD via ApoE quantification using an immunoturbidimetric method (23). This decrease of the ApoE concentration in AD was irrespective of the presence of the ε4 allele, age, and gender. The correlation between ApoE polymorphism and the change in serum ApoE concentration is controversial, because other findings have described the influence of ApoE polymorphism on serum ApoE levels (24, 25). Different studies suggest that the polymorphism of an ApoE gene promoter region, not the ApoE ε4 gene itself, is linked to AD (26–28). The connections among ApoE ε4 genotype, ApoE transcriptional promoter or enhancer mutation, serum ApoE level, and AD are enigmatic, possibly because of the differences in the various experimental techniques employed, as well as the ethnic groups in the samples and ApoE isoforms. The clarification of discrepancies is an important issue that could lead to scientific breakthroughs for AD diagnosis and therapy.
Recently, selected reaction monitoring (SRM) (also known as multiple reaction monitoring) mass spectrometry (MS) has been utilized for the absolute quantification of one or more targets (29–33). The targets can be selected by means of bioinformatic studies or preliminary screening via conventional experimental methods (29, 33). Compared with immuno-based assay, SRM assay makes rapid, selective, sensitive, and cost-effective bioanalysis possible. The high precision in replicate quantification makes SRM comparable with conventional ELISA-based quantification. Target proteins are enzymatically digested and ionized in a triple quadrupole MS system, and then selected precursors and product ions are filtered in the first and third quadrupole, respectively (32, 34, 35). The selectivity and sensitivity of targets are significantly improved for proteins with low to high abundance (29).
Microsphere or functional bead-based fluorescence detection technology is a newly developed protein detection method that uses flow cytometry (36–38). Each functional bead has variable intensities of two fluorophores and is identified by a certain combination of fluorescence intensities. The beads can be conjugated with capture antibody against different protein targets for multiplex detection. A target protein in a sample can be captured on the surface of a functional bead by binding to the capture antibody. Biotinylated detection antibody for ApoE can be applied to measure the target protein concentration via phycoerythrin (PE)-streptavidin treatment. Compared with the conventional ELISA method, microsphere-based fluorescence detection technology has advantages of high reproducibility, small sample amount, high sample capacity, and multiplex application of various target proteins (37–39).
In this study, we attempted to characterize the AD-related changes in serum ApoE levels using two distinct modes of detection: protein detection via microsphere-based FACS analysis and peptide detection via LC-SRM mass spectrometry. The results from the two methods were cross-validated, and experimental variations for serum ApoE quantification were minimized. Both results presented fairly consistent results, showing a significant decrease of serum ApoE levels in AD patients relative to those of a control cohort (43 control versus 45 AD, p < 0.0001).
EXPERIMENTAL PROCEDURES
Human Blood Serum from Control and AD Patients
Blood samples were collected from patients with AD (n = 45) and age-matched nondemented elderly control subjects (n = 43) at Samsung Medical Center (Seoul, Korea) with approval from the Institutional Ethical Review Board. All subjects consented to the study, and informed consent was obtained from each entrant. AD patients were diagnosed using criteria for probable AD established by the National Institute of Neurological and Communicative Disorders and the Stroke-Alzheimer's Disease and Related Disorders Association (40). Clot-activator-treated polypropylene vacuum capillary tubes (Vacuplus®, Medigene, Seoul, Korea) were used for the collection of blood samples. The tubes were incubated at room temperature for 30 min, allowing fibrinogen in the blood to aggregate, and then centrifuged at 1,100g for 15 min to separate fibrinogen aggregates and other cellular components. The supernatant was collected and frozen at −80 °C until use, and no freeze-and-thaw cycle was applied before use.
Cytometric Bead Array
Measurement of serum ApoE level was performed using a BDTM Human Soluble Protein Master Buffer Kit (Catalog No. 558265, BD Biosciences-PharMingen, San Diego, CA), and a BDTM Functional Bead Conjugation Buffer Set (Catalog No. 558556, BD Biosciences, San Diego, CA). Anti-human apolipoprotein E mAb (Catalog No. 3712-3-1000, Mabtech AB, Nacka Strand, Sweden) was used as a capture antibody, and biotinylated anti-human apolipoprotein E mAb (Catalog No. 3712-6-1000, Mabtech AB, Nacka Strand, Sweden) was used as a detection antibody. First, beads were conjugated with capture antibody for ApoE. For covalent conjugation to functional beads, antibodies were modified by sulfosuccinimidyl 4-N-maleimidomethyl cyclohexane 1-carboxylate (Catalog No. 22322, Thermo Scientific, Rockford, IL) and filtered using a Bio-Rad Spin Column (Catalog No. 732-6231, Bio-Rad, Hercules, CA). Beads were incubated with dithiothreitol (Catalog No. 15397, USB, Cleveland, OH), and conjugation was performed with modified antibodies ended by N-ethylmaleimide (Catalog No. 23030, Thermo Scientific, Rockford, IL). Proper conjugation of the capture antibody to functional beads was confirmed using PE-coupled goat anti-mouse IgG detector treatment (Catalog No. 558550, BD Biosciences, San Diego, CA), followed by the detection of PE fluorescence at 575 nm by flow cytometry. Beads were validated for proper increase of the PE fluorescence intensity according to ApoE concentration. Calibrator serum was used for validation and as an internal reference. The calibrator serum was a random mixture of multiple control serum samples, and an aliquot of calibrator was kept in a freezer.
Human serum samples were diluted to 1:80 in assay buffer, and 6 × 10³ beads/reaction were suspended in the capture bead diluent. Beads and serum samples were mixed together and incubated in the dark for 1 h at room temperature. Subsequently, biotinylated detection antibodies were added (200 ng/50 μl), and the samples were incubated in the dark for 2 h at room temperature. Then, 20 μl of streptavidin-PE (Catalog No. 349023, BD Biosciences, San Jose, CA) was added and incubated in the dark for 30 min at room temperature. The samples were washed and centrifuged, and bead pellets were suspended in 300 μl of wash buffer. A BD FACS Calibur flow cytometer (BD Biosciences, San Jose, CA) with CellQuest software was used for the detection of fluorescence after the calibration step with setup beads. The mean fluorescent intensity (MFI) of 300 events was used for the quantification of ApoE protein. The MFI of a negative control was subtracted from the MFI of the target protein in a sample. Two negative controls containing only diluents and fetal bovine serum (Catalog No. SH30406.02, Thermo Scientific, Tauranga, New Zealand) were used. Then, this background-corrected MFI was normalized by that of the calibrator serum as follows: (MFI of test samples − MFI of FBS)/MFI of calibrator serum.
Chemically Synthesized Tryptic Peptides
Chemically synthesized crude peptides, LGPLVEQGR and AATVGSLAGQPLQER, were purchased from JPT Peptide Technologies Berlin, Germany. These were used to optimize the instrumental parameters and to identify targets in clinical sera in SRM. The peptides contained ∼50 nmol crude peptides with ∼70% purity. Stock solutions (∼50 nmol/200 μl) were prepared in 20% acetonitrile (≥98%, J.T. Baker, Phillipsburg, NJ) with 1% formic acid (≥98%, Merck, Darmstadt, Germany). 5 pmol/ml of each peptide was used for optimization. Stable isotope standards, also known as heavy peptide labeled C-terminal [13C6,15N4] arginine (>98%, 21st Century Biochemicals, Marlboro, MA), were purchased for absolute quantification. For each sequence, amino acid analysis was performed, and the absolute peptide amount was given by the vendor. All stable isotope standard peptides were spiked into sera prior to tryptic digestion.
LC-SRM Sample Preparation
The concentrations of total protein in sera were measured via Bradford assay (Bio-Rad, Richmond, CA). Serial dilutions of 0, 0.2, 0.4, 0.6, 0.8, and 1 μg/μl of Bradford reagent (1 μg/μl) were prepared for the measurement, and 50- or 100-fold diluted serum was used for the quantification. 200 μg of total protein was diluted 10-fold with 25 mm ammonium bicarbonate (>99%, Sigma) prior to denaturation with a 1:1 ratio of 10% (w/v) sodium deoxycholate (>98%, Sigma). Heavy peptides (50 fmol) were spiked into the solution. The disulfide bonds of intact proteins were reduced by tris(2-carboxyethyl)phosphine (Thermo Fisher Scientific) and incubated in a Thermomixer (Eppendorf, Hamburg, Germany) for 40 min at 37 °C. To alkylate cysteins, the reactants were cooled to room temperature (25 °C), and iodoacetamide (>98%, Sigma) was added with a final concentration of 14 mm and mixed for 40 min at room temperature in dark conditions. The highly concentrated sodium deoxycholate was diluted 10-fold (<1%) with 50 mm Tris-HCl (pH 8.3, >99%, USB, Cleveland, OH). Trypsin digestion (sequencing-grade modified trypsin, Promega, Madison, WI) was performed at a concentration of 1/40 (enzyme/substrate) and followed by incubation at 37 °C for 16 h. The reaction was stopped by 0.1% TFA acidification reagent at pH < 3.0 (TFA, >99%, MercK, Darmstadt, Germany). An MCX cartridge (Waters, Milford, MA) was used to clean up the samples, and the elutions were frozen and dried via vacuum centrifugation. All the analytes were stored at 80 °C when not in use.
LC-SRM
We empirically optimized SRM parameters by directly infusing the crude peptides into a QTrap5500 hybrid linear ion-trap triple quadrupole mass spectrometer (ABSciex, Foster City, CA) equipped with a TurboSpray source. By ramping the declustering potential (DP), doubly charged dominant precursor ions were selected, and their optimized DP values were used. The collision energy (CE) and collision cell exit potential were also optimized for eight selected transitions that were collected from the GPM database (GPM 20).
SRM quantification was performed on a mass spectrometer equipped with a nano-electrospray ion source. Chromatographic separation of peptides was performed using an Eksigent nanoLC-Ultra 1D plus (Eksigent Technologies, Redwood City, CA). Each sample was injected with a full sample loop injection of 1 μl and a timed injection with mobile phase A (98% water, 2% acetonitrile, 0.1% formic acid). The protein concentration of each sample was 2 μg/μl. Samples were separated on a column (75 μm × 12 cm) packed in-house with C18 reversed-phase resin (pore size, 200 Å; particle size, 5 μm). The guard column (75 μm × 1 cm) was also equipped to protect the analytical column. A linear gradient of 2% to 30% mobile phase B (99.9% acetonitrile, 0.1% formic acid) was applied for 25 min with a flow rate of 300 nl/min for the separation, and 80% mobile phase B for was used for an additional 5 min to wash the column.
MS was operated in positive ion mode with the following parameters: ion spray voltage of 2,100 V, curtain gas at 20 p.s.i., nebulizer gas at 25 p.s.i., resolution at 0.7 Da (unit resolution) for Q1/Q3, interface temperature at 150 °C, and scan mass range of 300 to 1250 m/z. The CE, collisional exit potential, and DP were set based on the optimization results for crude peptides. Identical experimental conditions were applied for stable isotope standard peptides.
Data Analysis
Analyst software (version 1.5.1, (Applied Biosystems/MDS Sciex Foster City, CA)) was used to monitor SRM data and to interpret optimized SRM parameters. Skyline (version 1.1) was used to qualify and quantify SRM measurements from extracted ion chromatograms. MedCalc statistical software (version 12.0, MedCalc Software, Mariakerke, Belgium) was used to generate receiver operating characteristic (ROC) curves and interactive plots. SAS 9.3 was used for multiple regression and Spearman correlation, and a two-sample unequal-variance t test and regression analyses were performed with Excel 2010 (version 14.0, Microsoft).
RESULTS
LC-SRM Optimization
MS optimization was performed with two proteotypic peptides representing ApoE: LGPLVEQGR and AATVGSLAGQPLQER. These two peptides are present in three major isoforms of ApoE—ApoE2, -3, and -4—and can thus be utilized for measuring the total concentration of ApoE. Because of the variables of quantification, we excluded mutant sequences by single-nucleotide polymorphism (based on the UniProt 2012 database) (Fig 1A). For SRM measurement, tryptic peptides containing 6 to 20 amino acids were selected that showed moderate hydrophobicity during separation, and peptides with m/z values less than 1,250 Da were chosen because of the instrumental restriction for high-mass ions. Possible chemical modification during sample preparation was considered for highly precise SRM quantification. The amino acids causing deamidation (N-terminal glutamine) and oxidation (methionine and cysteine) were discounted for the selection. The final candidates were confirmed by BLAST search for their uniqueness. LGPLVEQGR is generally accepted as a representative proteotypic peptide because of its high digestion efficiency and stable SRM response (29, 41–43). After peptide selection, eight highly intense SRM transitions were collected from the GPM database, and their instrumental parameters were optimized to improve SRM sensitivity. Chemically synthesized crude peptides were used to optimize the CE, DP, and collision cell exit potential (Fig 1B). The most intense y-ions (LGPLVEQGR, y7++, m/z 484.81 → 400.00/AATVGSLAGQPLQER, y5, m/z 749.53 → 642.40) were chosen for the quantification, and the second and third most intense y-ions were used for peak assignment in SRM. Fig. 1C lists the optimized parameters of the two peptides.
Fig. 1.

A representative optimization scheme of a proteotypic peptide (LGPLVEQGR) of ApoE for SRM quantification. A, two proteotypic peptides (bold black) were selected to determine ApoE levels in sera. The peptides representing different isoforms (bold red), ApoE2 and ApoE4, and mutant sequences by single-nucleotide polymorphism (red) were excluded. Highly intense SRM transitions were collected from the GPM database (bracket with rank) and used to select the three most intense transitions for SRM quantification. The three transitions are depicted in square brackets. B, SRM optimization for highly sensitive measurement. The dominant charge state, [M+2H]2+, of the peptide was used to determine the optimized DP value by ramping DP voltage (left). Q1/Q3 scan with a CE voltage ramp was conducted to determine the optimized CE values for each selected transition (middle). Final product ions were collected after optimizing instrumental parameters (right). The three most intense y-ions, y7++, y5, and y4, were selected for further SRM quantification. C, instrumental parameters for the transitions of proteotypic peptides.
For SRM-based quantification, heavy peptides containing stable isotope [13C6,15N4]-labeled arginine were spiked into a pooled serum prior to trypsin digestion. The heavy peptide concentration was adjusted to a heavy-to-light ratio near 1:1 (Fig. 2). The heavy-to-light ratios for LGPLVEQGR and AATVGSLAGQPLQER were 1:1.12 and 1.20:1, respectively. The retention time and ion intensity of heavy peptides were compared with those of endogenous light peptides, as they are chemically and physically identical to each other. The consequent heavy concentrations were spiked into the individual sera to determine ApoE levels.
Fig. 2.

Extracted ion chromatograms of the proteotypic peptides, LGPLVEQGR (top) and AATVGSLAGQPLQER (bottom), of ApoE in a pooled serum. A, integrated intensities of y7++, y5, and y4 of light (red) and heavy (blue) LGPLVEQGR; heavy-to-light ratio was 1:1.12. Heavy peptide indicates stable isotope [13C6,15N4]-labeled arginine. The retention times of each peptide are shown above the individual peaks. For the rest of the analysis, the amount of spiked heavy peptide was fixed at 50 fmol as in A. B, extracted ion chromatogram of the three most intense transitions of light peptide. C, extracted ion chromatogram of heavy peptide with transitions identical to those in B. D–F, another selected proteotypic peptide for SRM quantification. The concentration of the spiked heavy peptide was 50 fmol, and the heavy-to-light ratio was 1.20:1.
The analytical reproducibility of SRM for ApoE levels in 88 sera was evaluated (Fig. 3). Without data normalization, 99% of sera had a CV of ≤20%, and 92% had a CV of ≤10%. After normalization to heavy peptides, the analytical precision was dramatically improved: 99% of sera had a CV of ≤10%, and all sera showed CV ≤ 12%.
Fig. 3.
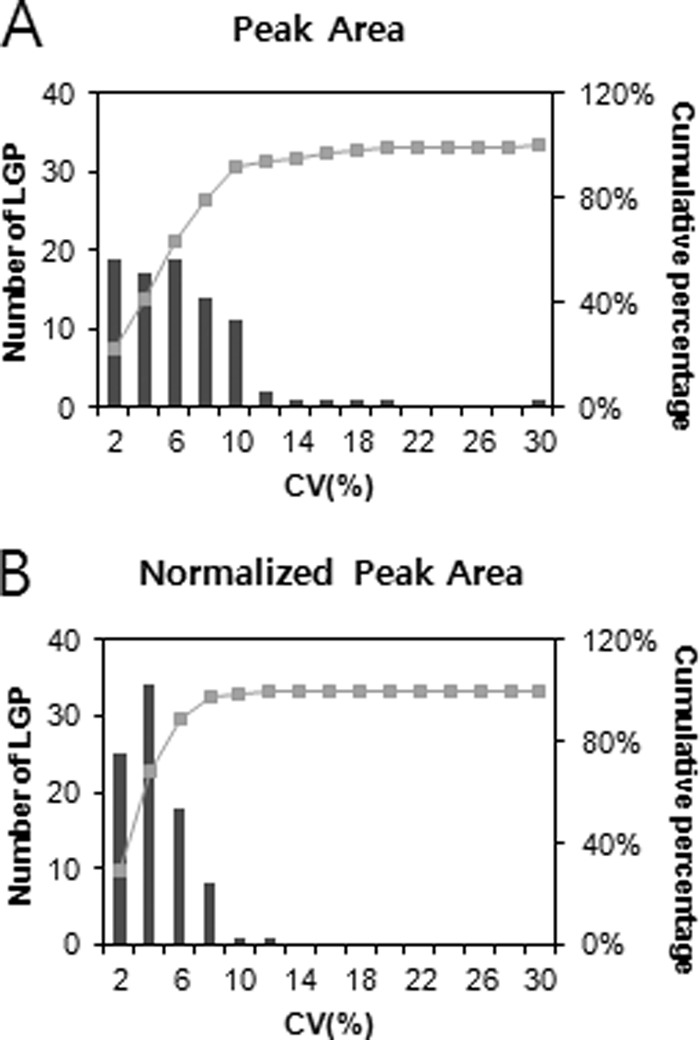
Analytical reproducibility of LGPLVEQGR for 88 samples in SRM. Cumulative frequencies of 88 samples are shown by using raw peak area (top) and normalized peak area to heavy peptide (bottom). The most intense y-ion, y7++, of LGPLVEQGR was used for the measurement.
Conjugation of ApoE Capture Antibody to Functional Bead for FACS Analysis
As another method of quantifying serum ApoE level, we used capture antibody-conjugated functional beads and detected the serum ApoE interaction with the capture antibody by FACS analysis followed by fluorescence-inducing detection antibody treatment (Fig. 4A, schematic diagram). Mouse source anti-ApoE IgG capture antibody was conjugated to the surface of functional beads containing a specific combination of two fluorescent intensities for bead identification. The proper conjugation of capture antibodies on functional beads was confirmed by the treatment of PE-conjugated antibody against mouse IgG (PE-conjugated goat anti-mouse IgG detector) followed by FACS analysis (Fig. 4B). The MFI of PE represents the amount of capture antibodies for ApoE conjugated on the surface of the functional beads. The capture antibody-conjugated functional beads demonstrated significantly high fluorescence intensity in PE-conjugated anti-mouse IgG treatment (MFI = 9910.46), whereas insignificant signals were detected in non-conjugated functional beads (naked beads) treated with PE-conjugated anti-mouse IgG and in ApoE capture antibody-conjugated functional beads without PE-conjugated anti-mouse IgG treatment (MFI = 5.74 and 4.49 respectively). An additional negative control using PE-conjugated anti-rabbit IgG failed to show significant fluorescent intensity (Fig. 4B). A validation experiment for the reactivity of ApoE capture antibody-conjugated functional beads was performed using serial dilutions of calibrator serum (Fig. 4C) and commercially available ApoE standard protein (Fig. 4D). The calibrator serum was a mixture of sera from randomly picked controls that was maintained as aliquots for one-time use in a freezer and used as a standard for the validation experiment, and also as an external reference in a sample to normalize the interexperimental error. The calibrator serum was serially diluted to concentrations of 1/40, 1/80, 1/160, 1/320, and 1/640 and treated with ApoE capture antibody-conjugated functional beads for activity validation. Then, biotinylated detection antibodies and streptavidin-conjugated PE were applied, and the MFI of PE was measured by FACS analysis. The PE fluorescence intensity increased proportionally to the amount of ApoE captured on the surface of functional beads by ApoE capture antibody. The MFI showed an inversely proportional increase of the signal to serum dilution factors according to the ApoE concentration (Fig. 4C, R2 = 0.985). The same pattern of ApoE concentration-dependent MFI was observed in an experiment using ApoE standard protein, showing a correlation coefficient of 0.972 (Fig. 4D). This result demonstrated that ApoE capture antibody-conjugated functional beads are suitable for serum ApoE quantification, showing ApoE concentration-dependent alteration of the MFI. For serum, the MFIs of samples were normalized by the MFI of the calibrator to minimize the interassay variation.
Fig. 4.

Schematic diagram, confirmation, and validation of ApoE capture antibody-conjugated functional beads using FACS analysis. A, the schematic process of target protein detection by FACS analysis using capture antibody-conjugated functional beads. B, the attachment of ApoE capture antibody to functional beads was demonstrated by PE-conjugated anti-mouse IgG treatment. Negative controls were compared, including naked beads, no antibody incubation, and PE-conjugated anti-rabbit IgG incubation. C, D, validation of ApoE capture antibody-conjugated functional beads was performed using serial dilution of calibrator serum (C) and ApoE standard protein (D), showing proportional change of MFI in an ApoE concentration-dependent manner.
Comparison of Serum ApoE Level by SRM and FACS Analysis
Two different analytical methods, protein-detecting FACS analysis and peptide-detecting SRM, were used to quantify the serum ApoE level in the control (n = 43) and AD samples (n = 45). Also, further investigation was performed to monitor the change of the serum ApoE level in regard to AD pathogenesis severity. Identical sera samples from 43 control cohorts and 45 AD patients were used in parallel for all the experiments using both FACS analysis and SRM. A detailed description of the human sera samples used in this study is presented in supplemental Table S1, which includes basic information such as gender, age, body mass index, education level, co-morbidities, mini-mental state exam (MMSE) score, clinical dementia rating (CDR) score, and ApoE genotype, as well as probable variables possibly affecting serum ApoE level, including smoking status, duration of disease, and fasting status at the time of blood collection.
According to the results from FACS analysis using functional beads conjugated with ApoE antibody, the serum ApoE level was significantly decreased in AD patients relative to that in the control cohort, with ApoE average normalized MFIs of 2.68 ± 1.13 in the control and 1.67 ± 0.90 in AD (p < 0.0001; Fig. 5A, Table I). Using the calibration curves in Fig. 4D, the serum ApoE concentrations obtained via FACS analysis were calculated as 16.1 ± 6.57 mg/l in the control and 10.2 ± 5.27 mg/l in AD (Table I). The serum ApoE concentration in FACS analysis was lower than in SRM quantification, indicating a reduction in protein quantification by about 30% in FACS analysis. There was 100% correlation between the normalized value and the calculated concentration of the serum ApoE level, so normalized values were used for further statistical analysis. The AD-related decrease of the serum ApoE level was consistent with the results from SRM, confirming the AD-related reduction in serum ApoE level in both SRM and FACS analyses (SRM LGPLVEQGR: 49.50 ± 16.97 mg/l in control, 36.41 ± 11.22 mg/l in AD; SRM AATVGSLAGQPLQER: 31.49 ± 11.26 mg/l in control, 26.27 ± 8.57 mg/l in AD). Also, the SRM results using LGPLVEQGR and AATVGSLAGQPLQER peptides (referred to hereinafter as LGP and AAT peptides, respectively) showed significant reductions of serum ApoE levels in AD (p < 0.0001 and p < 0.05, respectively). The correlation of the serum ApoE quantification results between SRM (LGP, AAT) and FACS analyses was investigated, and the coefficient was calculated (Fig. 5B). Spearman correlation coefficients were used, because the data failed to show a normal distribution pattern. Higher correlation has been shown between the FACS result and SRM using the LGP peptide, with a Spearman correlation coefficient of r = 0.53464 (p < 0.0001) in total samples of the control and AD (Fig. 5B) and a coefficient of r = 0.68248 (p < 0.0001) in AD patients only (data not shown). In SRM using the AAT peptide, the Spearman correlation coefficient r was 0.40796 (p < 0.0001) in total samples of the control and AD (Fig. 5B) and 0.62648 (p < 0.0001) in AD patients only (data not shown). The higher correlation between FACS and LGP SRM results is also clearly shown in Fig. 5A, which presents a more similar pattern between those two results. Both LGP and AAT showed significant correlation to the FACS result, and the correlation coefficient between LGP and AAT was 0.91217 (p < 0.0001). Therefore, all three experiments supported the AD-related decrease of the serum ApoE level. In a subsequent study, we investigated the correlation between the serum ApoE level and other possible factors of influence (Table II). The serum ApoE level measured by FACS and SRM LGP was correlated to the MMSE, which is an indicator of disease severity and progression (r = 0.42863, p < 0.005 for FACS; r = 0.32298, p < 0.05 for SRM LGP). The MMSE is a brief test of mental status introduced by Folstein et al. in 1975 (44), and it is widely used as one of the indicative factors to diagnose AD and to assess the severity of dementia in AD pathology (45). However, no significant correlation between the serum ApoE level and CDR score was demonstrated, even though the CDR score is related to the MMSE. For a better understanding of the relation between the serum ApoE level and MMSE, multiple regression analysis using MMSE score as a dependent variable was performed, and the result verified that the serum ApoE level in AD decreased in relation to MMSE score (p = 0.0052) when other possible affecting factors were considered, including age, body mass index, gender, education, and ApoE status (supplemental Table S3). Also, results from the ROC curve showed comparable results, presenting areas under the curve (AUCs) of 0.752, 0.731, and 0.637 for FACS, SRM using LGP, and SRM using AAT, respectively (Fig. 6A). Sensitivity and specificity values are summarized in supplemental Table S2. Furthermore, in order to examine AUC in different stages of AD pathology, we divided the 45 AD patients into three groups according to MMSE score and population distribution: a mild AD group with an MMSE score above 19, a moderate group with an MMSE score of 15 to 18, and a severe dementia group with an MMSE score lower than 14. The AUC was calculated for each group. In Figs. 6B–6D, the severe AD patients with MMSE scores less than 14 showed increased AUC relative to other groups, with AUCs of 0.884, 0.850, and 0.753 for FACS, SRM LGP, and SRM AAT, respectively. This finding agrees with the results from multiple regression analysis presented in supplemental Table S3, which exhibited decreased serum ApoE levels in AD patients according to MMSE.
Fig. 5.

Serum ApoE levels of 43 controls (black) and 45 AD patients (red) were analyzed by SRM and FACS. For SRM measurement, the highly intense y-ions, y7++ of LGPLVEQGR (LGP) and y5 of AATVGSLAGQPLQER (AAT), of two proteotypic peptides representing ApoE were used. A, serum ApoE levels of AD patients were compared with those of controls. B, correlation study between results from SRM and FACS analysis.
Table I. Average ages, MMSE scores, and serum ApoE levels determined via FACS and SRM (mean ± S.D.).
| AD |
Control |
|||||
|---|---|---|---|---|---|---|
| All (n + 45) | Male (n + 17) | Female (n + 28) | All (n + 43) | Male (n + 26) | Female (n + 17) | |
| Age (years) | 73.29 ± 9.74 | 72.71 ± 9.33 | 73.64 ± 10.13 | 73.53 ± 4.11 | 73.62 ± 4.22 | 73.41 ± 4.08 |
| MMSE score | 16.11 ± 6.49 | 17.77 ± 6.11 | 15.11 ± 6.62 | |||
| FACS (normalization) | 1.67 ± 0.90 | 1.77 ± 0.93 | 1.62 ± 0.90 | 2.68 ± 1.13 | 2.79 ± 1.04 | 2.53 ± 1.26 |
| FACS (concentration) (mg.l) | 10.22 ± 5.27 | 10.77 ± 5.43 | 9.88 ± 5.24 | 16.13 ± 6.57 | 16.73 ± 6.08 | 15.21 ± 7.36 |
| SRM (LGP) (mg/l) | 36.41 ± 11.22 | 34.48 ± 9.18 | 37.58 ± 12.31 | 49.50 ± 16.97 | 47.36 ± 15.90 | 52.76 ± 18.51 |
| SRM (AAT) | 26.27 ± 8.57 | 23.03 ± 6.24 | 28.24 ± 9.27 | 31.49 ± 11.26 | 29.37 ± 10.67 | 34.74 ± 11.69 |
ApoE FACS normalization: arbitrary quantification unit by normalized mean fluorescence intensity. LGP, LGPLVEQGR; AAT, AATVGSLAGQPLQER.
Table II. Correlation of serum ApoE levels with MMSE score, CDR score, age, and body mass index.
| Spearman correlation coefficient (p value) |
|||||
|---|---|---|---|---|---|
| MMSE score | CDR score | Age | Body mass index | Duration of disease | |
| FACS | 0.429 (0.003a) | −0.090 (0.556) | −0.207 (0.172) | 0.278 (0.071) | −0.351 (0.018a) |
| SRM LGP | 0.323 (0.031a) | −0.043 (0.780) | −0.392 (0.008a) | 0.205 (0.188) | −0.168 (0.269) |
| SRM AAT | 0.231 (0.126) | 0.040 (0.796) | −0.368 (0.013a) | 0.153 (0.327) | −0.141 (0.356) |
| MMSE | −0.377 (0.011a) | −0.270 (0.073) | 0.142 (0.365) | −0.253 (0.093) | |
| CDR | 0.252 (0.095) | −0.345 (0.024a) | −0.079 (0.605) | ||
| Age | −0.050 (0.752) | 0.234 (0.122) | |||
| Body mass index | 0.150 (0.337) | ||||
a p < 0.05.
Fig. 6.
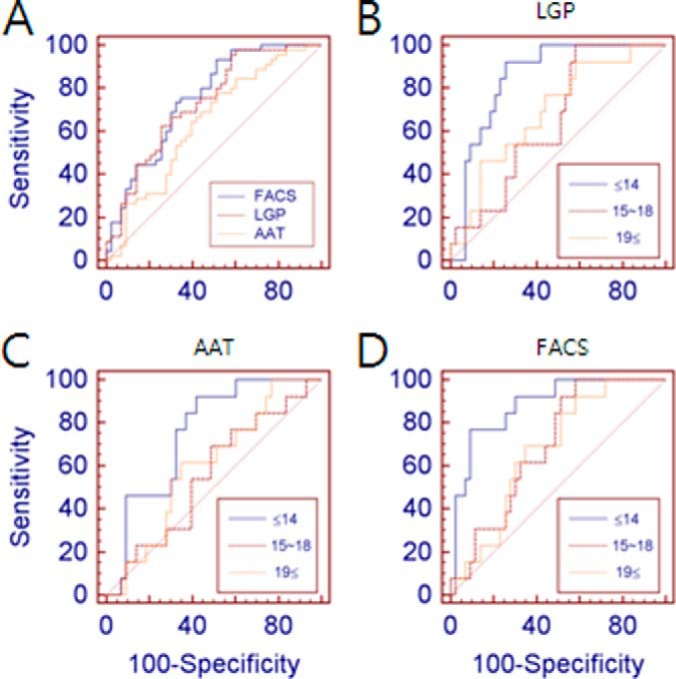
ROC curves generated based on serum ApoE levels in control and AD subjects. A, ROC curves were obtained using results from SRM (LGP, LGPLVEQGR; AAT, AATVGSLAGQPLQER) and FACS-based serum ApoE quantification. AUC-ROCs for serum ApoE levels in AD by LGP SRM, AAT SRM, and FACS analysis were 0.731, 0.637, and 0.752, respectively. B–D, ROC curves were used to investigate the correlation between serum ApoE levels and MMSE score in three sets of ApoE quantifications. AUC-ROCs of serum ApoE levels for MMSE scores ≤ 14 (severe AD) were 0.850, 0.753, and 0.884 in LGP SRM, AAT SRM, and FACS analysis, respectively.
DISCUSSION
The triangular relationship of AD pathology, ApoE polymorphism, and serum ApoE level has been controversial for many years. Even though the ApoE ε4 allele has been well known to indicate higher susceptibility to developing AD, their relation is still debated (23, 46, 47). In addition, other polymorphisms such as the promoter/enhancer region of the ApoE gene have been suggested to be associated with AD (26–28). A recent study suggested that both brain network interconnectivity and cortical thickness are lost during aging for ε4 allele carriers (48), but the underlying mechanism remains unclear.
Along with ApoE polymorphism, studies on the serum total ApoE level in AD have attracted a great deal of attention, because ApoE is suspected to be deeply implicated in AD. ApoE is the most prevalent apolipoprotein in the brain, and it binds directly to amyloid-β. It is also found in plaques and neurofibrillary tangles (20). Studies on the peripheral total ApoE level in AD generated various discrepancies, suggesting a decrease (23, 49), increase (21), or no alteration (22, 24, 50) in AD. It has also been suggested that the serum ApoE level is determined by the ApoE polymorphism, with evidence that the ε2 allele is linked to a high serum ApoE concentration and the ε4 allele is associated with a low serum ApoE level (25, 51, 52). However, another study demonstrated that the decline in the serum ApoE level in AD was not accounted for by the ε4 allele (23). Another report failed to correlate the plasma ApoE4 protein proportion with AD risk in an ApoE ε3/4 population (53).
There are a few possible reasons for these discrepancies regarding the relevance of serum ApoE levels in AD. First, the diverse experimental methods for serum ApoE detection could affect the results. Various biochemical and analytical experimental methods have been used, such as nephelometry, immunoturbidimetry, and Western blot analysis. The serum ApoE level varies from study to study according to the detection methods used. An Australian Imaging, Biomarkers and Lifestyle study showed that the average concentration of total ApoE obtained via the ELISA method ranged between 14.23 ± 2.63 and 15.43 ± 2.66 mg/dl, whereas another study presented mean serum total ApoE levels ranging from 39.0 ± 10.0 to 44.0 ± 7.0 mg/l according to nephelometry analysis (24, 54). Especially in biochemical studies using antibody–antigen interaction, the probable preference of a certain antibody for a specific ApoE isoform could be a critical factor in quantification results. Even in the case of ApoE antibody for total ApoE detection, the preference to bind to specific isoforms of ApoE is probable in different antibodies. With various allelic polymorphisms, the expression level of a particular isoform changes in AD. ApoE ε3/4 heterozygote carriers showed not only a decrease in ApoE4, but also an increase of ApoE3 expression with disease (54). In this case, the binding selectivity of an antibody to a certain isoform could influence the total ApoE quantification level in AD.
Ethnic and geographical variations are other prominent factors contributing to varying results from different countries. Ethnic variation of the ApoE genotype exists among different populations, with low ε4 allele frequency in Asian and high frequency in black African populations (12, 55). Within Europe, different frequencies of the ε4 allele have been shown between the northern and southern regions (12). As a result, in European studies by the ApoEurope project, some countries failed to show ε4 prevalence in AD, and other countries presented very low levels of serum ApoE in both control and AD populations, in contrast to other countries (23). Additionally, the ApoE ε4 allele was not found to be associated with AD in less developed countries, restricting this association to only western countries (46, 47). A gradient increase or decrease of a certain allelic form of ApoE in a region was reported to correlate with geographical variation, representing an increasing gradient of the ApoE ε2 allele and the plasma ApoE concentration from north to south among European countries, whereas a reverse pattern of the ApoE ε4 allele occurred, showing significantly higher ε4 allele frequency in northern regions (56, 57). Therefore, geographical consideration is an important factor to take into account when the peripheral ApoE level is investigated.
The present study assessed the serum ApoE level in Korean AD and a control cohort using two distinct experimental methods, including antibody binding–based protein detection and proteomic peptide analysis: microsphere-based FACS analysis and SRM. To the best of our knowledge, no previous study on serum ApoE level in AD confirmed the quantification level utilizing two separate techniques with distinct principles. The aim of this study was to minimize the technical barriers to investigating the relevance of serum ApoE level to the AD pathological process in the Korean population. Previously, the ApoE ε4 allele has been reported to be a risk factor for AD in the Korean population as well, and the lack of a protective role of the ε2 allele was revealed in disease development (19, 58). However, no study has been reported to investigate the relevance of serum ApoE level to AD in this population. Our study has clearly shown an AD-related decrease of serum ApoE concentration in results from both experimental methods. The serum ApoE level decreased according to the MMSE score in both FACS (correlation coefficient r = 0.429, p < 0.005) and SRM using LGP peptide (correlation coefficient r = 0.0.323, p < 0.05), and a fairly significant decrease of serum ApoE level at the later stages of disease progression was correlated with low MMSE score. Also, multiple regression study showed the correlation between serum ApoE level and MMSE score (supplemental Table S3), and increased AUC was demonstrated in the population with low MMSE scores relative to other groups with moderate MMSE scores (Fig. 6). However, serum ApoE level in AD failed to show correlation to CDR score, even though the MMSE is relevant to the CDR score. The MMSE is known as a cognitive measurement, whereas CDR is a clinical scale, and these two scales have been reported to show 50% agreement (59, 60). Also, MMSE correlates well with CDR 0.5, 1, 2, and 3 but distinguishes poorly between CDR 0–0.5 (60). In this study, AD patients with CDR 0–0.5 formed a considerable portion of the AD population (35.7% of total AD patients), which might be an explanation for the lack of correlation between serum ApoE level and CDR score. Other possible explanations still exist, including increased influence of age-related cognitive decline on MMSE, especially in AD patients with low education. In order to clarify the relation between serum ApoE level and MMSE, relation dynamics have to be studied among serum ApoE level, MMSE, education, and cognitive decline in a future study. Also, further study would be needed for a confirmative correlation between serum ApoE level and severity of AD pathological progress in order to expand the idea of an AD-related decrease in serum ApoE level to a claim for a possible surrogate marker for AD.
In the SRM study, the sample preparation was minimized for the target, in that neither target enrichment nor depletion was performed in order to avoid experimental variations. For accurate analysis in SRM, a C-terminal [13C6,15N4] arginine-labeled stable isotope internal standard was spiked into the sera prior to tryptic digestion (61). Therefore, the trends of AD-related decreases in serum ApoE were fairly similar, and the significance in each experiment was agreeable between SRM and FACS analysis.
In most SRM studies, quantifications by different peptides for one target protein result in different concentrations of quantified protein in a sample. For example, Pan et al. utilized three different representative peptides derived from the same protein and compared the protein quantification in plasma (62). They demonstrated that protein quantifications are completely different for the different representative peptides. It is widely accepted that different peptides have variable digestion efficacies in SRM studies, which affects the result of the final quantification of protein. Therefore, most researchers utilizing SRM put efforts into selecting a peptide with high digestion efficacy. LGP, one of the target peptides that we used, has been the most widely used peptide by SRM researchers for this reason. In addition to LGP, we used another peptide, AAT, which has not been commonly used as a representative peptide in SRM quantification. The results of serum ApoE quantifications by SRM LGP and SRM AAT showed significant correlation (Fig. 5, correlation coefficient = 0.91217, p < 0.0001), even though one result was 25% higher than the other, because of the different digestion efficacies.
Nevertheless, the methodological barriers could not be avoided completely, resulting in different quantitative values of total serum ApoE levels, with a lower protein level obtained via FACS analysis than via SRM. This result is perfectly consistent with a previous study by Pan et al. comparing antibody reaction-based ELISA and SRM quantification. Pan et al. already proved the unavoidable differences between SRM and antibody reaction-based immunoassay methods (ELISA), showing a lower concentration of the target protein in plasma with ELISA than with SRM (62). The correlation coefficient between SRM and ELISA was 0.2853. This gap between SRM and antibody-based immunoassay might occur because different intermediates are used for target detection: a protein for FACS and its representative peptide for SRM. Also, whether the target protein is in binding status or free form might be a critical factor in terms of antibody-based immunoassay. For instance, the binding of a target protein to its binding partner has a better chance of preventing the binding of a target protein to an antibody, resulting in a lower concentration according to antibody detection. It is now widely accepted that SRM quantification for tryptic peptides provides relatively higher concentrations than antibody-based protein quantification in most experiments, and this high sensitivity of SRM analysis enables the quantification of low-abundance proteins in plasma (63). The various binding statuses of serum ApoE to ApoE receptors or binding partners may affect the binding affinity to a detection antibody, which needs to be further clarified for better understanding of the serum ApoE level.
Regretfully, a recent study by Simon et al. using SRM found that neither the serum ApoE level nor the ApoE4 level is related to AD (64). An SRM approach using methionine-containing peptide for plasma ApoE was carefully established and utilized, but it is hard to interpret the finding because there is insufficient information about the control and AD cohort regarding factors such as ethnic diversity, geographical information, and AD pathological indicators like MMSE score and CDR score, as well as other factors possibly affecting serum ApoE level (25, 65). Ethnic diversity and geographical variation are critical factors that influence the results of both peripheral ApoE level and its relevance to AD in multiple studies, because several discrepancies result from these variations. Without such information, there is a limitation in interpreting the results, especially with the absence of information on age, diagnostic criteria, and MMSE score. We utilized an age-matching control and an AD cohort (average age of control subjects = 73.65; average age of AD subjects = 73.29), and the average MMSE score of AD patients was 16.11 ± 6.49. For SRM assay, LGP and AAT peptides were utilized to validate the results, and both parallel results succeeded in presenting consistent findings to indicate decreased total ApoE levels in AD. Additional validation with a biochemical experiment using microsphere-based FACS analysis confirmed the result from SRM and demonstrated an AD-related decrease in serum ApoE level in this population.
Along with recent findings for European populations (54), the present study suggests an AD-related reduction of the serum ApoE level, not only in European populations, but also in the Korean population. Further study would be necessary to establish a meaningful cutoff range to diagnose the disease and the possibility of serum ApoE level being a biomarker for multiplex biomarker detection to increase diagnostic sensitivity and specificity. Also, alteration of serum ApoE level in AD shows the probability of changes of other ApoE-related serum proteins, such as ApoE receptor and ApoE-binding proteins, along with the serum ApoE level, which needs to be examined. In future work, the relationship between serum ApoE level and AD pathological severity has to be clarified in consideration of various factors, including not only MMSE and CDR scores but also brain amyloid plaque level as determined by means of Pittsburgh compound-B positron emission tomography. In addition, the influence of various factors possibly affecting the serum ApoE level, including ApoE genetic polymorphism and the expression level of isoforms, has to be investigated for better understanding of its role in the AD pathological process.
Footnotes
Author contributions: S.H., J.S.K., C.L., and I.M. designed research; S.H., J.S.K., Y.L., and H.C. performed research; S.H., J.-W.K., D.N., and M.Y. contributed new reagents or analytic tools; S.H., J.S.K., Y.L., H.C., E.Y., and D.H. analyzed data; S.H. and J.S.K. wrote the paper.
* This study was supported by the Proteogenomic Research Program (2012M3A9B9036679) funded by the MEST and the KIST intramural program for C.J. Lee. This work was also supported by grants from the NRF (2012R1A2A1A01002881, MRC (2011-0030738)), KRIBB Research Initiative Program, KIST Institutional Program (2E24242-13-135), and KNIH ROAD R&D Program Project (A092058) for I.M.-J.
 This article contains supplemental material.
1 The abbreviations used are:
- AD
- Alzheimer disease
- AAT
- AATVGSLAGQPLQER
- ApoE
- apolipoprotein E
- AUC
- area under the curve
- CDR
- clinical dementia rating
- CE
- collision energy
- DP
- declustering potential
- FACS
- fluorescence-activated cell sorting
- SRM
- selected reaction monitoring
- LGP
- LGPLVEQGR
- MFI
- mean fluorescent intensity
- MMSE
- mini-mental state exam
- PE
- phycoerythrin
- ROC
- receiver operating characteristic.
REFERENCES
- 1. Hardy J. A., Higgins G. A. (1992) Alzheimer's disease: the amyloid cascade hypothesis. Science 256, 184–185 [DOI] [PubMed] [Google Scholar]
- 2. Hardy J., Allsop D. (1991) Amyloid deposition as the central event in the aetiology of Alzheimer's disease. Trends Pharmacol. Sci. 12, 383–388 [DOI] [PubMed] [Google Scholar]
- 3. Hardy J., Selkoe D. J. (2002) The amyloid hypothesis of Alzheimer's disease: progress and problems on the road to therapeutics. Science 297, 353–356 [DOI] [PubMed] [Google Scholar]
- 4. Alloul K., Sauriol L., Kennedy W., Laurier C., Tessier G., Novosel S., Contandriopoulos A. (1998) Alzheimer's disease: a review of the disease, its epidemiology and economic impact. Arch. Gerontol. Geriatr. 27, 189–221 [DOI] [PubMed] [Google Scholar]
- 5. Wimo A., Winblad B., Grafstrom M. (1999) The social consequences for families with Alzheimer's disease patients: potential impact of new drug treatment. Int. J. Geriatr. Psychiatry 14, 338–347 [DOI] [PubMed] [Google Scholar]
- 6. Buckholtz N. S. (2011) Perspective: in search of biomarkers. Nature 475, S8. [DOI] [PubMed] [Google Scholar]
- 7. Callaway E. (2012) Alzheimer's drugs take a new tack. Nature 489, 13–14 [DOI] [PubMed] [Google Scholar]
- 8. Launer L. J., Andersen K., Dewey M. E., Letenneur L., Ott A., Amaducci L. A., Brayne C., Copeland J. R., Dartigues J. F., Kragh-Sorensen P., Lobo A., Martinez-Lage J. M., Stijnen T., Hofman A. (1999) Rates and risk factors for dementia and Alzheimer's disease: results from EURODEM pooled analyses. EURODEM Incidence Research Group and Work Groups. European Studies of Dementia. Neurology 52, 78–84 [DOI] [PubMed] [Google Scholar]
- 9. Corder E. H., Saunders A. M., Strittmatter W. J., Schmechel D. E., Gaskell P. C., Small G. W., Roses A. D., Haines J. L., Pericak-Vance M. A. (1993) Gene dose of apolipoprotein E type 4 allele and the risk of Alzheimer's disease in late onset families. Science 261, 921–923 [DOI] [PubMed] [Google Scholar]
- 10. Tsai M. S., Tangalos E. G., Petersen R. C., Smith G. E., Schaid D. J., Kokmen E., Ivnik R. J., Thibodeau S. N. (1994) Apolipoprotein E: risk factor for Alzheimer disease. Am. J. Hum. Genet. 54, 643–649 [PMC free article] [PubMed] [Google Scholar]
- 11. Roses A. D. (1996) Apolipoprotein E alleles as risk factors in Alzheimer's disease. Annu. Rev. Med. 47, 387–400 [DOI] [PubMed] [Google Scholar]
- 12. Siest G., Pillot T., Regis-Bailly A., Leininger-Muller B., Steinmetz J., Galteau M. M., Visvikis S. (1995) Apolipoprotein E: an important gene and protein to follow in laboratory medicine. Clin. Chem. 41, 1068–1086 [PubMed] [Google Scholar]
- 13. Mahley R. W., Rall S. C., Jr. (2000) Apolipoprotein E: far more than a lipid transport protein. Annu. Rev. Genomics Hum. Genet. 1, 507–537 [DOI] [PubMed] [Google Scholar]
- 14. Eichner J. E., Dunn S. T., Perveen G., Thompson D. M., Stewart K. E., Stroehla B. C. (2002) Apolipoprotein E polymorphism and cardiovascular disease: a HuGE review. Am. J. Epidemiol. 155, 487–495 [DOI] [PubMed] [Google Scholar]
- 15. Martins R. N., Clarnette R., Fisher C., Broe G. A., Brooks W. S., Montgomery P., Gandy S. E. (1995) ApoE genotypes in Australia: roles in early and late onset Alzheimer's disease and Down's syndrome. Neuroreport 6, 1513–1516 [PubMed] [Google Scholar]
- 16. Ueki A., Kawano M., Namba Y., Kawakami M., Ikeda K. (1993) A high frequency of apolipoprotein E4 isoprotein in Japanese patients with late-onset nonfamilial Alzheimer's disease. Neurosci. Lett. 163, 166–168 [DOI] [PubMed] [Google Scholar]
- 17. Saunders A. M., Strittmatter W. J., Schmechel D., George-Hyslop P. H., Pericak-Vance M. A., Joo S. H., Rosi B. L., Gusella J. F., Crapper-MacLachlan D. R., Alberts M. J., Hulette C., Crain B., Goldgaber D., Roses A. D. (1993) Association of apolipoprotein E allele epsilon 4 with late-onset familial and sporadic Alzheimer's disease. Neurology 43, 1467–1472 [DOI] [PubMed] [Google Scholar]
- 18. Higgins G. A., Large C. H., Rupniak H. T., Barnes J. C. (1997) Apolipoprotein E and Alzheimer's disease: a review of recent studies. Pharmacol. Biochem. Behav. 56, 675–685 [DOI] [PubMed] [Google Scholar]
- 19. Kim H. C., Kim D. K., Choi I. J., Kang K. H., Yi S. D., Park J., Park Y. N. (2001) Relation of apolipoprotein E polymorphism to clinically diagnosed Alzheimer's disease in the Korean population. Psychiatry Clin. Neurosci. 55, 115–120 [DOI] [PubMed] [Google Scholar]
- 20. Martins I. J., Hone E., Foster J. K., Sunram-Lea S. I., Gnjec A., Fuller S. J., Nolan D., Gandy S. E., Martins R. N. (2006) Apolipoprotein E, cholesterol metabolism, diabetes, and the convergence of risk factors for Alzheimer's disease and cardiovascular disease. Mol. Psychiatry 11, 721–736 [DOI] [PubMed] [Google Scholar]
- 21. Taddei K., Clarnette R., Gandy S. E., Martins R. N. (1997) Increased plasma apolipoprotein E (apoE) levels in Alzheimer's disease. Neurosci. Lett. 223, 29–32 [DOI] [PubMed] [Google Scholar]
- 22. Slooter A. J., de Knijff P., Hofman A., Cruts M., Breteler M. M., Van Broeckhoven C., Havekes L. M., van Duijn C. M. (1998) Serum apolipoprotein E level is not increased in Alzheimer's disease: the Rotterdam study. Neurosci. Lett. 248, 21–24 [DOI] [PubMed] [Google Scholar]
- 23. Siest G., Bertrand P., Qin B., Herbeth B., Serot J. M., Masana L., Ribalta J., Passmore A. P., Evans A., Ferrari M., Franceschi M., Shepherd J., Cuchel M., Beisiegel U., Zuchowsky K., Rukavina A. S., Sertic J., Stojanov M., Kostic V., Mitrevski A., Petrova V., Sass C., Merched A., Salonen J. T., Tiret L., Visvikis S. (2000) Apolipoprotein E polymorphism and serum concentration in Alzheimer's disease in nine European centres: the ApoEurope study. ApoEurope group. Clin. Chem. Lab. Med. 38, 721–730 [DOI] [PubMed] [Google Scholar]
- 24. Panza F., Solfrizzi V., Colacicco A. M., Basile A. M., D'Introno A., Capurso C., Sabba M., Capurso S., Capurso A. (2003) Apolipoprotein E (APOE) polymorphism influences serum APOE levels in Alzheimer's disease patients and centenarians. Neuroreport 14, 605–608 [DOI] [PubMed] [Google Scholar]
- 25. Vincent-Viry M., Schiele F., Gueguen R., Bohnet K., Visvikis S., Siest G. (1998) Biological variations and genetic reference values for apolipoprotein E serum concentrations: results from the STANISLAS cohort study. Clin. Chem. 44, 957–965 [PubMed] [Google Scholar]
- 26. Mui S., Briggs M., Chung H., Wallace R. B., Gomez-Isla T., Rebeck G. W., Hyman B. T. (1996) A newly identified polymorphism in the apolipoprotein E enhancer gene region is associated with Alzheimer's disease and strongly with the epsilon 4 allele. Neurology 47, 196–201 [DOI] [PubMed] [Google Scholar]
- 27. Artiga M. J., Bullido M. J., Sastre I., Recuero M., Garcia M. A., Aldudo J., Vazquez J., Valdivieso F. (1998) Allelic polymorphisms in the transcriptional regulatory region of apolipoprotein E gene. FEBS Lett. 421, 105–108 [DOI] [PubMed] [Google Scholar]
- 28. Lambert J. C., Pasquier F., Cottel D., Frigard B., Amouyel P., Chartier-Harlin M. C. (1998) A new polymorphism in the APOE promoter associated with risk of developing Alzheimer's disease. Hum. Mol. Genet. 7, 533–540 [DOI] [PubMed] [Google Scholar]
- 29. Kuzyk M. A., Smith D., Yang J. C., Cross T. J., Jackson A. M., Hardie D. B., Anderson N. L., Borchers C. H. (2009) Multiple reaction monitoring-based, multiplexed, absolute quantitation of 45 proteins in human plasma. Mol. Cell. Proteomics 8, 1860–1877 [DOI] [PMC free article] [PubMed] [Google Scholar]
- 30. Whiteaker J. R., Lin C., Kennedy J., Hou L., Trute M., Sokal I., Yan P., Schoenherr R. M., Zhao L., Voytovich U. J., Kelly-Spratt K. S., Krasnoselsky A., Gafken P. R., Hogan J. M., Jones L. A., Wang P., Amon L., Chodosh L. A., Nelson P. S., McIntosh M. W., Kemp C. J., Paulovich A. G. (2011) A targeted proteomics-based pipeline for verification of biomarkers in plasma. Nat. Biotechnol. 29, 625–634 [DOI] [PMC free article] [PubMed] [Google Scholar]
- 31. Jaffe J. D., Keshishian H., Chang B., Addona T. A., Gillette M. A., Carr S. A. (2008) Accurate inclusion mass screening: a bridge from unbiased discovery to targeted assay development for biomarker verification. Mol. Cell. Proteomics 7, 1952–1962 [DOI] [PMC free article] [PubMed] [Google Scholar]
- 32. Fortin T., Salvador A., Charrier J. P., Lenz C., Lacoux X., Morla A., Choquet-Kastylevsky G., Lemoine J. (2009) Clinical quantitation of prostate-specific antigen biomarker in the low nanogram/milliliter range by conventional bore liquid chromatography-tandem mass spectrometry (multiple reaction monitoring) coupling and correlation with ELISA tests. Mol. Cell. Proteomics 8, 1006–1015 [DOI] [PMC free article] [PubMed] [Google Scholar]
- 33. Picotti P., Rinner O., Stallmach R., Dautel F., Farrah T., Domon B., Wenschuh H., Aebersold R. (2010) High-throughput generation of selected reaction-monitoring assays for proteins and proteomes. Nat. Methods 7, 43–46 [DOI] [PubMed] [Google Scholar]
- 34. Mirzaei H., McBee J. K., Watts J., Aebersold R. (2008) Comparative evaluation of current peptide production platforms used in absolute quantification in proteomics. Mol. Cell. Proteomics 7, 813–823 [DOI] [PMC free article] [PubMed] [Google Scholar]
- 35. Sherwood C. A., Eastham A., Lee L. W., Risler J., Vitek O., Martin D. B. (2009) Correlation between y-type ions observed in ion trap and triple quadrupole mass spectrometers. J. Proteome Res. 8, 4243–4251 [DOI] [PMC free article] [PubMed] [Google Scholar]
- 36. Olsson A., Vanderstichele H., Andreasen N., De Meyer G., Wallin A., Holmberg B., Rosengren L., Vanmechelen E., Blennow K. (2005) Simultaneous measurement of beta-amyloid(1–42), total tau, and phosphorylated tau (Thr181) in cerebrospinal fluid by the xMAP technology. Clin. Chem. 51, 336–345 [DOI] [PubMed] [Google Scholar]
- 37. Gordon R. F., McDade R. L. (1997) Multiplexed quantification of human IgG, IgA, and IgM with the FlowMetrix system. Clin. Chem. 43, 1799–1801 [PubMed] [Google Scholar]
- 38. Oliver K. G., Kettman J. R., Fulton R. J. (1998) Multiplexed analysis of human cytokines by use of the FlowMetrix system. Clin. Chem. 44, 2057–2060 [PubMed] [Google Scholar]
- 39. Prabhakar U., Eirikis E., Davis H. M. (2002) Simultaneous quantification of proinflammatory cytokines in human plasma using the LabMAP assay. J. Immunol. Methods 260, 207–218 [DOI] [PubMed] [Google Scholar]
- 40. McKhann G., Drachman D., Folstein M., Katzman R., Price D., Stadlan E. M. (1984) Clinical diagnosis of Alzheimer's disease: report of the NINCDS-ADRDA Work Group under the auspices of Department of Health and Human Services Task Force on Alzheimer's Disease. Neurology 34, 939–944 [DOI] [PubMed] [Google Scholar]
- 41. Simon R., Girod M., Fonbonne C., Salvador A., Clement Y., Lanteri P., Amouyel P., Lambert J. C., Lemoine J. (2012) Total ApoE and ApoE4 isoform assays in an Alzheimer's disease case control study by targeted mass spectrometry (n=669): a pilot assay for methionine-containing proteotypic peptides. Mol Cell Proteomics 11, 1389–1403 [DOI] [PMC free article] [PubMed] [Google Scholar]
- 42. Anderson L., Hunter C. L. (2006) Quantitative mass spectrometric multiple reaction monitoring assays for major plasma proteins. Mol. Cell. Proteomics 5, 573–588 [DOI] [PubMed] [Google Scholar]
- 43. Proc J. L., Kuzyk M. A., Hardie D. B., Yang J., Smith D. S., Jackson A. M., Parker C. E., Borchers C. H. (2010) A quantitative study of the effects of chaotropic agents, surfactants, and solvents on the digestion efficiency of human plasma proteins by trypsin. J. Proteome Res. 9, 5422–5437 [DOI] [PMC free article] [PubMed] [Google Scholar]
- 44. Folstein M. F., Folstein S. E., McHugh P. R. (1975) “Mini-mental state”. A practical method for grading the cognitive state of patients for the clinician. Journal of Psychiatric Research 12, 189–198 [DOI] [PubMed] [Google Scholar]
- 45. Wilcock G. K., Black S. E., Hendrix S. B., Zavitz K. H., Swabb E. A., Laughlin M. A. (2008) Efficacy and safety of tarenflurbil in mild to moderate Alzheimer's disease: a randomised phase II trial. Lancet Neurol. 7, 483–493 [DOI] [PubMed] [Google Scholar]
- 46. Hendrie H. C., Ogunniyi A., Hall K. S., Baiyewu O., Unverzagt F. W., Gureje O., Gao S., Evans R. M., Ogunseyinde A. O., Adeyinka A. O., Musick B., Hui S. L. (2001) Incidence of dementia and Alzheimer disease in 2 communities: Yoruba residing in Ibadan, Nigeria, and African Americans residing in Indianapolis, Indiana. JAMA 285, 739–747 [DOI] [PubMed] [Google Scholar]
- 47. Osuntokun B. O., Sahota A., Ogunniyi A. O., Gureje O., Baiyewu O., Adeyinka A., Oluwole S. O., Komolafe O., Hall K. S., Unverzagt F. W., Hui S. L., Yang M. S., Hendric H. C. (1995) Lack of an association between apolipoprotein E epsilon 4 and Alzheimer's disease in elderly Nigerians. Ann. Neurol. 38, 463–465 [DOI] [PubMed] [Google Scholar]
- 48. Brown J. A., Terashima K. H., Burggren A. C., Ercoli L. M., Miller K. J., Small G. W., Bookheimer S. Y. (2011) Brain network local interconnectivity loss in aging APOE-4 allele carriers. Proc. Natl. Acad. Sci. U.S.A. 108, 20760–20765 [DOI] [PMC free article] [PubMed] [Google Scholar]
- 49. Lehtimaki T., Pirttila T., Mehta P. D., Wisniewski H. M., Frey H., Nikkari T. (1995) Apolipoprotein E (apoE) polymorphism and its influence on ApoE concentrations in the cerebrospinal fluid in Finnish patients with Alzheimer's disease. Hum. Genet. 95, 39–42 [DOI] [PubMed] [Google Scholar]
- 50. Scacchi R., Gambina G., Ruggeri M., Martini M. C., Ferrari G., Silvestri M., Schiavon R., Corbo R. M. (1999) Plasma levels of apolipoprotein E and genetic markers in elderly patients with Alzheimer's disease. Neurosci. Lett. 259, 33–36 [DOI] [PubMed] [Google Scholar]
- 51. Sing C. F., Davignon J. (1985) Role of the apolipoprotein E polymorphism in determining normal plasma lipid and lipoprotein variation. Am. J. Hum. Genet. 37, 268–285 [PMC free article] [PubMed] [Google Scholar]
- 52. Berglund L., Wiklund O., Eggertsen G., Olofsson S. O., Eriksson M., Linden T., Bondjers G., Angelin B. (1993) Apolipoprotein E phenotypes in familial hypercholesterolaemia: importance for expression of disease and response to therapy. J. Intern. Med. 233, 173–178 [DOI] [PubMed] [Google Scholar]
- 53. Fukumoto H., Ingelsson M., Garevik N., Wahlund L. O., Nukina N., Yaguchi Y., Shibata M., Hyman B. T., Rebeck G. W., Irizarry M. C. (2003) APOE epsilon 3/epsilon 4 heterozygotes have an elevated proportion of apolipoprotein E4 in cerebrospinal fluid relative to plasma, independent of Alzheimer's disease diagnosis. Exp. Neurol. 183, 249–253 [DOI] [PubMed] [Google Scholar]
- 54. Gupta V. B., Laws S. M., Villemagne V. L., Ames D., Bush A. I., Ellis K. A., Lui J. K., Masters C., Rowe C. C., Szoeke C., Taddei K., Martins R. N. (2011) Plasma apolipoprotein E and Alzheimer disease risk: the AIBL study of aging. Neurology 76, 1091–1098 [DOI] [PubMed] [Google Scholar]
- 55. Hallman D. M., Boerwinkle E., Saha N., Sandholzer C., Menzel H. J., Csazar A., Utermann G. (1991) The apolipoprotein E polymorphism: a comparison of allele frequencies and effects in nine populations. Am. J. Hum. Genet. 49, 338–349 [PMC free article] [PubMed] [Google Scholar]
- 56. Haddy N., De Bacquer D., Chemaly M. M., Maurice M., Ehnholm C., Evans A., Sans S., Do Carmo Martins M., De Backer G., Siest G., Visvikis S. (2002) The importance of plasma apolipoprotein E concentration in addition to its common polymorphism on inter-individual variation in lipid levels: results from Apo Europe. Eur. J. Hum. Genet. 10, 841–850 [DOI] [PubMed] [Google Scholar]
- 57. Schiele F., De Bacquer D., Vincent-Viry M., Beisiegel U., Ehnholm C., Evans A., Kafatos A., Martins M. C., Sans S., Sass C., Visvikis S., De Backer G., Siest G. (2000) Apolipoprotein E serum concentration and polymorphism in six European countries: the ApoEurope Project. Atherosclerosis 152, 475–488 [DOI] [PubMed] [Google Scholar]
- 58. Hong Y. J., Yoon B., Shim Y. S., Cho A. H., Shin H. E., Kim Y. I., Kim S. Y., Yang D. W. (2011) APOE epsilon4 allele status in Korean dementia patients with severe white matter hyperintensities. J. Alzheimers Dis. 24, 519–524 [DOI] [PubMed] [Google Scholar]
- 59. Juva K., Sulkava R., Erkinjuntti T., Ylikoski R., Valvanne J., Tilvis R. (1994) Staging the severity of dementia: comparison of clinical (CDR, DSM-III-R), functional (ADL, IADL) and cognitive (MMSE) scales. Acta Neurol. Scand. 90, 293–298 [DOI] [PubMed] [Google Scholar]
- 60. Perneczky R., Wagenpfeil S., Komossa K., Grimmer T., Diehl J., Kurz A. (2006) Mapping scores onto stages: mini-mental state examination and clinical dementia rating. Am. J. Geriatr. Psychiatry 14, 139–144 [DOI] [PubMed] [Google Scholar]
- 61. Brun V., Dupuis A., Adrait A., Marcellin M., Thomas D., Court M., Vandenesch F., Garin J. (2007) Isotope-labeled protein standards: toward absolute quantitative proteomics. Mol. Cell. Proteomics 6, 2139–2149 [DOI] [PubMed] [Google Scholar]
- 62. Pan S., Chen R., Brand R. E., Hawley S., Tamura Y., Gafken P. R., Milless B. P., Goodlett D. R., Rush J., Brentnall T. A. (2012) Multiplex targeted proteomic assay for biomarker detection in plasma: a pancreatic cancer biomarker case study. J. Proteome Res. 11, 1937–1948 [DOI] [PMC free article] [PubMed] [Google Scholar]
- 63. Huttenhain R., Malmstrom J., Picotti P., Aebersold R. (2009) Perspectives of targeted mass spectrometry for protein biomarker verification. Curr. Opin. Chem. Biol. 13, 518–525 [DOI] [PMC free article] [PubMed] [Google Scholar]
- 64. Simon R., Girod M., Fonbonne C., Salvador A., Clement Y., Lanteri P., Amouyel P., Lambert J. C., Lemoine J. (2012) Total ApoE and ApoE4 isoform assays in an Alzheimer's disease case-control study by targeted mass spectrometry (n = 669): a pilot assay for methionine-containing proteotypic peptides. Mol. Cell. Proteomics 11, 1389–1403 [DOI] [PMC free article] [PubMed] [Google Scholar]
- 65. Doraiswamy P. M., Bieber F., Kaiser L., Krishnan K. R., Reuning-Scherer J., Gulanski B. (1997) The Alzheimer's Disease Assessment Scale: patterns and predictors of baseline cognitive performance in multicenter Alzheimer's disease trials. Neurology 48, 1511–1517 [DOI] [PubMed] [Google Scholar]