

Abstract
During development of the chick cochlea, actin crosslinkers and barbed-end cappers presumably influence growth and remodeling of the actin paracrystal of hair cell stereocilia. We used mass spectrometry to identify and quantify major actin-associated proteins of the cochlear sensory epithelium from E14 to E21, when stereocilia widen and lengthen. Tight actin crosslinkers (i.e. fascins, plastins, and espin) are expressed dynamically during cochlear epithelium development between E7 and E21, with FSCN2 replacing FSCN1 and plastins remaining low in abundance. Capping protein, a barbed-end actin capper, is located at stereocilia tips; it is abundant during growth phase II, when stereocilia have ceased elongating and are increasing in diameter. Capping protein levels then decline during growth phase III, when stereocilia reinitiate barbed-end elongation. Although actin crosslinkers are readily detected by electron microscopy in developing chick cochlea stereocilia, quantitative mass spectrometry of stereocilia isolated from E21 chick cochlea indicated that tight crosslinkers are present there in stoichiometric ratios relative to actin that are much lower than their ratios for vestibular stereocilia. These results demonstrate the value of quantitation of global protein expression in chick cochlea during stereocilia development.
The vertebrate hair bundle, an excellent exemplar of intrinsic control of cellular architecture, constitutes 30–300 actin-filled stereocilia arranged in rows of increasing length but constant diameter. The elegant descriptive studies of the development of bundles from the chick cochlea (basilar papilla) from Lew Tilney and his collaborators established this preparation as ideal for studying stereocilia morphogenesis and bundle assembly (1). They demonstrated that hair cells regulate stereocilia length, width, and number by segregating key steps into distinct phases, which allows the bundle to build itself sequentially; differential regulation and expression of key proteins accordingly must occur during these phases. Because these phases appear to overlap in time during mammalian hair bundle development (2) but are distinct in chick, the chick cochlea is a particularly useful preparation for understanding bundle assembly.
Actin filaments in developing chick cochlear stereocilia elongate in three phases (3). In phase I, stereocilia grow to a maximum of 1.5–2.0 μm; their actin filaments are initially disordered but crosslinks visible by electron microscopy progressively form and organize filaments into tight parallel bundles (paracrystals). In phase II, elongation is minimal but new actin filaments are added laterally to the stereocilum core, increasing the number of filaments more than 4-fold in apical hair cells. Finally, in phase III, elongation resumes and stereocilia grow to their mature lengths (Figs. 1A, 1B). The discrete nature of these three phases suggests that regulation of elongation and filament number are critical for stereocilia formation.
Fig. 1.

Mass spectrometric analysis of protein expression during development of chick cochlear hair bundles. A, Cartoon illustrating development of stereocilia actin filaments from E9-E21. Modified from ref (1). B, Stereocilia lengthening phases during development. Elongation halts between E12 and E17 (phase II). Data are from Fig. 5 in ref (3). C, Differential interference contrast image of chick cochlea cryosection. The sensory epithelium (orange), which sits on the basilar membrane (yellow), forms the epithelial peels used for mass spectrometry. The tectorial membrane is absent from this sample. Whole chick cochlea, used in other experiments, includes the sensory epithelium, basilar membrane, tectorial membrane, and some surrounding tissue. D, Surface preparation of E21 chick cochlea imaged with scanning electron microscopy. Hair bundles appear in a regular array, protruding from the smooth surface of hair cells; supporting cell apical surfaces are packed with microvilli and thus appear as a ruff surrounding each hair cell. Scale bar, 10 μm. Inset, one hair bundle. Scale bar, 1 μm. E, Analysis of protein profile similarities among biological samples. Colored symbols represent samples; color represents developmental age (E14, black; E16, red; E18, green; E21, blue). The distances among protein profiles of samples are shown using a multidimensional scaling plot. The distances were computed using 644 proteins that had at least two measurements per sample; missing data were imputed by 10-nearest-neighbor averaging method. Note that biological samples from a given time point cluster together (circles). F, Plot showing relationship between contaminant counts and total noncontaminant counts. Each point represents one biological sample. No correlation. G, Plot showing relationship between contaminant intensity and total noncontaminant intensity. More proteins were detected in samples with larger contaminant fractions, suggesting that increased contaminant intensity in those fractions resulted from improved mass spectrometer sensitivity, not an increase in the amount of contamination in the biological sample. H, Developmental expression profiles of chick cochlear proteins (from sensory epithelium peels at indicated ages) segregated into 10 groups by k-means clustering. Heat map on left displays all clustered proteins. Blue corresponds to decreased relative expression; yellow corresponds to increased relative expression. Black, no change; gray, missing data. Graphs in middle show averaged data for each cluster. Examples on right indicate representative actin-associated proteins in each cluster.
Timed expression of actin crosslinking proteins is thought to be essential for generating a uniformly packed actin paracrystal (3, 4). Filaments are bundled together with crosslinkers that appear at ∼12.5 nm intervals longitudinally and maintain an actin–actin separation of ∼9 nm (5). Crosslinkers that tightly bundle actin filaments, those from the plastin, fascin, and espin families, are absolutely required to produce this narrow separation (6–8).
Two actin crosslinkers have been identified in chick cochlea hair bundles. The early observation that plastin 1 (PLS11; also known as fimbrin and I-plastin) is present in mature and developing chick stereocilia led to the suggestion that it is the primary crosslinker in cochlear stereocilia (9). Later work showed that espin (ESPN), critical for stereocilia growth (10, 11), is present in chick cochlear stereocilia at early developmental times (12). The expression levels of PLS1 and ESPN in cochlear stereocilia are not known, however, and assembly of stereocilia may require additional crosslinkers.
In E21 chick vestibular hair bundles, fascin 2 (FSCN2) is the most abundant actin crosslinker (13, 14); its paralog fascin 1 (FSCN1) was also detected in bundles, albeit at much lower levels. These experiments also demonstrated that ESPN is present at low abundance in vestibular stereocilia; ESPN is unlikely to be the major crosslinker but instead exerts its effects by catalyzing filament elongation and widening of parallel actin bundles (15). In mammalian cochlea, plastin 3 (PLS3; T-plastin) appears transiently during development of hair bundles (16).
Control of actin filament elongation by timed capping of growing actin filaments is likely to be an important step in regulating actin paracrystal length during the three phases of cochlear stereocilia growth. At least three families of actin cappers are known, including capping protein (CAPZ) (17), twinfilins (18, 19), and the epidermal growth factor receptor pathway substrate 8 (EPS8) family (20, 21). Stereocilia of E21 vestibular hair cells have all three families present; mass spectrometric experiments detected CAPZ subunits (CAPZA1, CAPZA2, and CAPZB), twinfilins (TWF2 and a small amount of its paralog TWF1), and EPS8 members (a small amount of EPS8 but a much larger amount of its paralog EPS8L2) (14). Although TWF2, EPS8, and EPS8L2 have been shown to be present at stereocilia tips (19–22), CAPZ subunits have not been localized in stereocilia; similarly, they have been refractory to immunofluorescence detection in chick intestinal microvilli, despite their presence at a significant concentration (23). None of the actin cappers have been localized in stereocilia of chick cochlea.
Antibodies and purified protein standards are not available for many chicken actin crosslinkers and cappers, precluding the use of immunoblotting. By contrast, shotgun mass spectrometry permits a proteome-wide assessment of the relative concentrations of thousands of proteins in parallel. Although low-abundance proteins are detected less reliably, the profusion of stereocilia actin filaments in the chick cochlea suggests that crosslinkers and cappers responsible for assembly of the stereocilium cytoskeleton should be relatively abundant in the whole cochlear epithelium. We therefore examined the proteome of the peeled chick cochlear epithelia throughout important steps in stereocilia development. These mass spectrometry experiments highlight the importance of FSCN2 and CAPZ, and were validated by additional quantitative RT-PCR, immunoblotting, and immunocytochemistry experiments. We show here that FSCN2 expression mirrors stereocilia lengthening; moreover, we found transient expression of CAPZ (and twinfilin) that could account for halted filament elongation seen during phase II and at the end of phase III.
EXPERIMENTAL PROCEDURES
Mass Spectrometry and Data Analysis
Proteins were purified by a short SDS-PAGE separation; peptides were generated by trypsin digest using methods described previously (13, 24). Protein digests were analyzed by LC-MS/MS using an Agilent 1100 series capillary LC system (Agilent Technologies Inc., Santa Clara, CA) and a Velos linear ion trap mass spectrometer (Thermo Scientific). Electrospray ionization was performed with an ion max source fitted with a 34 gauge metal needle (Thermo Fisher, cat. no. 97144–20040) and 2.7 kV source voltage. Samples were applied at 20 μl/min to a trap cartridge (Michrom BioResources, Inc., Auburn, CA), and then switched onto a 0.5 × 250 mm Zorbax SB-C18 column with 5 μm particles (Agilent Technologies) using a mobile phase containing 0.1% formic acid, 7–30% acetonitrile gradient over 195 min, and 10 μl/min flow rate. Data-dependent collection of MS2 spectra used dynamic exclusion (repeat count equal to 1, exclusion list size of 100, exclusion duration of 30 s, and exclusion mass width of −1 to +4) to obtain MS2 spectra of the five most abundant parent ions following each survey scan from m/z 400–2000. The tune file was configured with no averaging of microscans, a maximum inject time of 200 msec, and AGC targets of 3 × 10⁴ in MS1 mode and 1 × 10⁴ in MSN mode. Three biological replicates (no technical replicates) were analyzed for each developmental time point; four biological replicates (no technical replicates) were analyzed for cochlea bundles, cochlear epithelium, utricle bundles, and utricular epithelium.
RAW data from the LTQ mass spectrometer were converted to DTA files representing individual MS2 spectra using extract_msn.exe version 5.0 included with Bioworks (version 3.3; Thermo Scientific) using default parameter values. We used SEQUEST (version 28, rev. 12) to search the Ensembl Chicken database (versions 53 or 59; 23,316 or 22,355 entries); to facilitate error estimates, entries for common contaminants were added and all forward entries appended with sequence-reversed entries. Full-length sequences for FSCN1 and FSCN2 (13) replaced the fragments present in these versions of Ensembl. SEQUEST search parameters were: parent ion tolerance of 2.5 Da, fragment ion tolerance of 1.0 Da, average parent ion masses, monoisotopic fragment ion masses, differential methionine oxidation of +16 Da, static cysteine modification of +57 Da, and no enzyme cleavage specificity. Results for peptide identifications are present in supplemental Table S1 (developmental cochlea series), S3 (cochlea bundles and epithelium), and S5 (utricle bundles and epithelium).
Using reversed databases to estimate error thresholds (25), we applied a linear discriminant transformation with the PAW pipeline to improve protein identification sensitivity from the SEQUEST analysis (26, 27). Discriminant thresholds were set independently by peptide charge, number of tryptic termini, and by modification status (unmodified and oxidized Met peptides) to control peptide false discovery rates (FDR) (27). FDR was defined as the estimated number of incorrect target peptides divided by total number of target peptides. Peptide FDR was set to 1%, the most common choice of threshold; protein FDR was 3% (cochlea development dataset), 1.5% (combined CBUN and COCH), or 2% (combined BUN and UTR). For protein assembly, standard parsimony rules were used. In supplemental Tables S2.4, S2.5, S4.4, S4.5, S6.4, and S6.5, the columns labeled “Filter” indicate additional Ensembl entries that are completely redundant to the primary entry. In the same tables, other entries that share peptides with a given identified protein are indicated in the columns labeled “OtherLoci.”
Proteins were identified in a biological sample by the presence of two or more distinct, fully tryptic peptide sequences. Different charge states of the same peptide are not considered distinct peptides. For the quantitative analysis of the cochlea developmental series (supplemental Table S2), proteins were quantified if they were identified in at least two of 12 biological samples. For the cochlea and utricle hair bundle experiments (Tables I, supplemental Tables S4, and S6), proteins were considered present in a given sample if they had two or more peptides with distinct sequences, having a unique count greater than or equal to one in the respective sample.
Table I. Chick cochlea hair-bundle proteins. Only those detected in 3 or more of 4 runs are listed. False discovery rate of 5%. Key: COCH, peeled cochlear epithelium sample; CBUN, cochlear hair bundles; Protein or protein group, Ensembl identified for single protein or group name for protein group; MW, molecular mass; Description, description of protein or proteins in group; Symbol, symbol for protein or protein group; Count, number of times protein or group identified (out of four runs each for COCH and CBUN), Mean im, normalized molar intensity; S.E., standard error for im; CBUN/COCH, ratio of im in bundles to im in epithelium.
| Protein or protein group | MW | Description | Symbol | COCH count | COCH mean im | COCH S.E. | CBUN count | CBUN mean im | CBUN S.E. | CBUN/COCH |
|---|---|---|---|---|---|---|---|---|---|---|
| ACT | 41635 | Actin (ACTA1, ACTA2, ACTB, ACTC1, ACTG1, ACTG2) | ACT | 4 | 1.20E-01 | 1.15E-02 | 4 | 4.21E-01 | 1.41E-02 | 3.5 |
| ENSGALP00000026395 | 30168 | Calbindin 1 | CALB1 | 4 | 5.99E-02 | 3.52E-03 | 4 | 1.32E-01 | 1.91E-02 | 2.2 |
| GAPDH | 34920 | Glyceraldehyde-3-phosphate dehydrogenase | GAPDH | 4 | 6.29E-02 | 4.12E-03 | 4 | 8.15E-02 | 8.03E-03 | 1.3 |
| ENOA/G | 47333 | Enolase (ENOA, ENOG) | ENOA/G | 4 | 2.54E-02 | 2.45E-03 | 4 | 5.25E-02 | 6.49E-03 | 2.1 |
| TUBA | 50761 | Tubulin alpha (TUBA1, TUBA3, TUBA4, TUBA5, TUBA8) | TUBA | 4 | 5.44E-02 | 1.69E-03 | 4 | 3.11E-02 | 7.72E-03 | 0.57 |
| ENSGALP00000023396 | 26621 | Triosephosphate isomerase 1 | TPI1 | 4 | 7.35E-03 | 8.84E-04 | 4 | 3.05E-02 | 6.63E-03 | 4.2 |
| CKB | 42975 | Creatine kinase, brain | CKB | 4 | 2.28E-03 | 4.30E-04 | 4 | 2.21E-02 | 7.02E-03 | 9.7 |
| ENSGALP00000035240 | 9079 | Peptidylprolyl isomerase A (cyclophilin A) | PPIA | 4 | 7.69E-03 | 1.52E-03 | 4 | 2.17E-02 | 3.21E-03 | 2.8 |
| ANXA5 | 36209 | Annexin A5 | ANXA5 | 4 | 3.88E-03 | 1.31E-04 | 4 | 1.79E-02 | 2.64E-03 | 4.6 |
| H4 | 12307 | Histone H4 | H4 | 4 | 5.78E-02 | 2.89E-03 | 3 | 1.35E-02 | 5.05E-03 | 0.23 |
| H2A | 13941 | Histone H2A | H2A | 4 | 2.45E-02 | 4.43E-03 | 3 | 1.23E-02 | 1.21E-03 | 0.50 |
| ENSGALP00000014374 | 36544 | Malate dehydrogenase 1, NAD (soluble) | MDH1 | 4 | 2.62E-03 | 2.13E-04 | 3 | 9.95E-03 | 3.80E-03 | 3.8 |
| ENSGALP00000040436 | 14862 | ATP synthase, H+ transporting, mitochondrial F1 complex, beta polypeptide | ATP5B | 4 | 5.50E-03 | 3.87E-04 | 3 | 8.53E-03 | 1.58E-03 | 1.5 |
| ENSGALP00000037676.1 | 54833 | Fascin 2 | FSCN2 | 4 | 1.07E-03 | 2.59E-04 | 4 | 8.47E-03 | 9.65E-04 | 7.9 |
| HSPA2/5/8/9 | 72020 | Heat shock protein 70 (HSPA2, HSPA5, HSPA8, HSPA9) | HSPA2/5/8/9 | 4 | 3.18E-02 | 2.48E-03 | 4 | 8.45E-03 | 9.08E-04 | 0.27 |
| KPYK | 58049 | Pyruvate kinase muscle isozyme | KPYK | 4 | 1.01E-02 | 1.12E-03 | 4 | 7.49E-03 | 1.81E-03 | 0.74 |
| EF1A | 50785 | Elongation factor 1-alpha 1 | EEF1A1 | 4 | 2.14E-02 | 2.01E-04 | 3 | 7.15E-03 | 2.62E-03 | 0.33 |
| GELS | 85877 | Gelsolin | GSN | 4 | 2.81E-03 | 1.75E-04 | 4 | 6.82E-03 | 1.35E-03 | 2.4 |
| GPI | 62131 | Glucose-6-phosphate isomerase | GPI | 4 | 3.40E-03 | 2.20E-04 | 4 | 6.18E-03 | 2.99E-03 | 1.8 |
| HSPCB/90AA2/90B1 | 83489 | Heat shock protein 90 (HSPCB, HSP90AA2, HSP90B1) | HSPCB/90AA2/90B1 | 4 | 2.24E-02 | 8.33E-04 | 3 | 5.52E-03 | 1.77E-03 | 0.25 |
| ENSGALP00000010167 | 36605 | Lactate dehydrogenase A | LDHA | 4 | 4.42E-03 | 8.56E-04 | 3 | 5.20E-03 | 3.41E-04 | 1.2 |
| ENSGALP00000013574 | 56183 | Protein disulfide isomerase family A, member 3 | PDIA3 | 4 | 1.29E-02 | 5.86E-04 | 3 | 4.80E-03 | 1.96E-03 | 0.37 |
| ENSGALP00000003646 | 44933 | Glutamic-oxaloacetic transaminase 2, mitochondrial (aspartate aminotransferase 2) | GOT2 | 4 | 2.05E-03 | 6.89E-05 | 4 | 4.72E-03 | 2.70E-03 | 2.3 |
| ENSGALP00000013843 | 173824 | THO complex 2 | THOC2 | 3 | 1.36E-05 | 8.60E-06 | 4 | 4.22E-03 | 1.30E-03 | 310 |
| ENSGALP00000020268 | 71030 | Protein disulfide isomerase family A, member 4 | PDIA4 | 4 | 1.09E-02 | 1.19E-03 | 3 | 3.38E-03 | 1.25E-03 | 0.31 |
| ENSGALP00000012878 | 44668 | Phosphoglycerate kinase 1 | PGK1 | 4 | 1.89E-02 | 2.12E-03 | 3 | 2.86E-03 | 4.19E-04 | 0.15 |
| ENSGALP00000021618 | 36319 | Lactate dehydrogenase B | LDHB | 4 | 9.31E-03 | 7.65E-04 | 3 | 2.85E-03 | 1.38E-04 | 0.31 |
| ATP5A1 | 59900 | ATP synthase, H+ transporting, mitochondrial F1 complex, alpha subunit 1, cardiac muscle | ATP5A1 | 4 | 5.44E-03 | 5.91E-04 | 3 | 2.73E-03 | 8.82E-04 | 0.50 |
| ACTN1/2/4 | 103163 | Alpha-actinin (ACTN1, ACTN2, ACTN4) | ACTN1/2/4 | 4 | 5.79E-04 | 3.04E-05 | 3 | 1.73E-03 | 4.61E-04 | 3.0 |
| ENSGALP00000023177 | 73720 | Solute carrier family 34 (sodium phosphate), member 2 | SLC34A2 | 4 | 1.50E-04 | 3.24E-05 | 3 | 1.70E-03 | 7.42E-04 | 11 |
| TECTA | 235350 | Tectorin alpha | TECTA | 4 | 2.20E-03 | 2.92E-04 | 4 | 1.44E-03 | 5.24E-04 | 0.66 |
| ENSGALP00000022242 | 94302 | Aminopeptidase puromycin sensitive | NPEPPS | 4 | 1.32E-03 | 6.79E-05 | 3 | 1.25E-03 | 1.96E-04 | 0.95 |
| FLN | 267344 | Filamin B | FLN | 4 | 2.74E-04 | 5.56E-05 | 4 | 1.22E-03 | 5.69E-05 | 4.4 |
We quantified proteins using normalized molar MS2 intensities of peptides identified by SEQUEST (24, 28). Peptide intensities were extracted from DTA files; the top 50 values were summed (or all values if there were between 25 and 50 values). MS2 intensities from all runs were combined to give the each protein's total intensity value. For each protein with at least one unique peptide, intensities from any peptides shared with other proteins were divided based on the relative amounts of unique peptide intensities (27, 29). For conversion of intensities to normalized molar intensities, contaminants were removed from the data table before quantitation. No other data (e.g. outliers) were excluded. Summed intensities for each protein were divided by the protein's molecular mass, then by the sum of all intensity/mass values analyzed; the resulting value is equivalent to the molar fraction of the protein in the sample. Note that this calculation assumes that the calculated molecular mass in the Ensembl database reflects each protein's actual mass; this assumption is violated in cases where Ensembl entries are incomplete, proteins are processed by proteolysis, or where the protein is mapped to the wrong splice form. For the cochlea developmental series, protein grouping was not performed. The mean ± S.E. of the normalized molar intensity for each developmental point is reported in supplemental Table S2.3.
To facilitate comparison of cochlea bundle proteins from previous vestibular bundle protein datasets (13, 14), we grouped proteins sharing peptides using a protein grouping list (supplemental Tables S4.5 and S6.5) generated before the experiments (30). The grouping list was derived from past experiments with utricle hair bundles, utricle epithelia, and cochlear epithelia (13, 14, 24). Once proteins were grouped, normalized molar intensity was calculated for single entries and groups using the approach described above; the means ± S.E., as well as the bundle/epithelium enrichment, are reported in supplemental Tables S4.2 and S6.2.
For cluster analysis of developmental stages, data were log transformed, then were centered. Using Cluster 3.0 (http://bonsai.hgc.jp/∼mdehoon/software/cluster/software.htm), an enhanced version of the Cluster program developed by Eisen (31), proteins were organized by k-means clustering (32) with ten clusters (Euclidean distance). We chose a relatively small number of clusters because of the noisiness of the data, which did not appear to warrant segregation in a larger number of clusters (e.g. 20). Fewer clusters (e.g. six) did not segregate data sufficiently. Clusters were visualized with Java TreeView.
Quantitative RT-PCR
Whole cochleas were dissected from chickens at embryonic days 7, 9, 12, 14, 16, and 21 in cold, oxygenated chicken saline (100 mm NaCl, 2 mm KCl, 2 mm CaCl2, 2 mm MgCl2·6H2O, 3 mm d-glucose, 10 mm HEPES); 500 μl Trizol was added and samples were stored at −20 °C. For each age, triplicate experiments were performed. Because the size of the cochlea increases about 10-fold over development, each triplicate contained 6–30 cochlea, based on age. The tissue was homogenized in Trizol and total RNA was purified according to the Invitrogen protocol. RNA was resuspended in 10 μl DEPC-treated water and RNA concentration and quality was determined. cDNA was synthesized with the iScript kit (Bio-Rad); 0.5 μg of RNA was used for each sample in a 20 μl reaction.
Primers were designed using the Primer3 online program at http://frodo.wi.mit.edu/primer3/(supplemental Table S7). Most primers were designed to span multiple exons so that contaminating genomic DNA would not be amplified. Two sets of primers were designed for actin-crosslinker genes to account for primer-specific effects. For SYBR Green qPCR reactions, 200 nm of each primer and 2 μl of diluted cDNA were used in 20 μl reactions. qPCR reactions were performed in triplicate and only directly compared within each plate. Each qPCR assay used 46 cycles; fluorescence thresholds were selected within the linear range of the amplification curves.
The relative abundance of each gene was compared with GAPDH by calculating 2̂[Ct(GAPDH)-Ct(gene of interest)]. Triplicates were averaged for each sample, then the results from the two primer pairs for each gene were averaged. Finally, results were averaged for the three separate cDNA preps.
Immunoblotting
Dissections were carried out as described for qPCR. After storage at −20 °C for no more than 1 week, the tissue was homogenized in BCA sample buffer (50 mm Tris pH 6.7, 1% SDS) and the protein concentration was assayed using the Pierce BCA (bicinchoninic acid) assay. Each sample was diluted into sample buffer for final concentrations of 10% glycerol, 10 mm EDTA, 0.008% bromphenol blue, 100 mm DTT, 62.5 mm Tris pH 6.7, and 2% SDS. Samples were run on 10% acrylamide gels; each sample on the gel had 20 μg of total protein. In addition, a dilution series of the E21 sample as a standard was also loaded. Proteins were transferred to Immobilon P PDVF membranes in cold transfer buffer (10 mm CAPS, 5% MeOH) at 100 V for 90 min. Membranes were rinsed twice in water twice to remove any residual SDS and total proteins were stained with India Ink in PBSt (PBS plus 0.3% Tween) for 1 h. The membrane was blocked in 2% Amersham Biosciences Liquid Block block in PBSt for 1 h and incubated with primary antibodies. Membranes were washed 3 × 5 min in PBSt, then the membrane was incubated with secondary antibody (either goat-anti-rabbit-HRP or donkey-anti-goat-HRP) for 1 h in blocking solution. After washing 7 × 5 min in PBSt, blots were developed with SuperSignal West Pico solution. Blots were visualized with a Fuji LAS-3000 imager. A standard curve was developed for the E21 sample and the amount of each protein was calculated by interpolation.
Immunohistochemistry and Immunogold Electron Microscopy
Cochleas were dissected in chicken saline and fixed with 4% formaldehyde in PBS for 20 min at room temperature. The tissue was incubated in blocking solution (3% normal goat serum, 2% bovine serum albumin, 0.2% saponin in PBS) for one hour at room temperature, then was incubated overnight at 4 °C with primary antibodies diluted in blocking solution with no saponin. Anti-FSCN2 peptide antibody #36 (13) was used at 6 μg/ml for the cochlea developmental series. Tissues were incubated with phalloidin Alexa 488 (0.3 μm) and secondary antibodies conjugated to Alexa 568 or Alexa 633 (5 μg/ml) for one hour. Tissues were washed 3 × 5 min in PBS between primary and secondary antibody incubation and 6 × 5 min after secondary antibody incubation. Cochleas were mounted in Vectashield (Vector) on glass slides with 0.12 mm Secure-Seal Imaging Spacers (Schleicher and Schuell) and #1.5 cover slips.
For FSCN2 labeling at the transmission electron microscope (TEM) level, E21 cochleas were fixed as mentioned above, cryoprotected in 30% glycerol, plunge frozen, freeze-substituted (AFS, Leica) with 1.5% uranyl acetate in methanol at −90 °C for 24 h, and embedded in Lowicryl resin. Ultra-thin sections (90 nm) were blocked and incubated with the primary antibody overnight at 4 °C and primary antibody binding was revealed with 10 nm-gold secondary antibody. Grids were observed in a JEOL 1010 TEM.
Cochlea Hair Bundle Isolation
To loosen the tectorial membrane, dissected chick cochleas were treated with 100 μg/ml subtilisin (Sigma protease XXIV) for 1 min, followed by quenching with 0.1% BSA for another 5 min. The tectorial membrane was removed and the lagena cut away, leaving only the flat section of sensory epithelium; the most proximal region was also cut away because hair bundle recovery from this region was consistently poor.
The dissected organs were then transferred to new plastic Petri dish containing chick saline. With pressure from forceps, organs were attached to the bottom of the dish with hair bundles facing up. A nylon washer was then placed around the adhered organs; a steady stream of 3% agarose at 40 °C was pipetted on the organs using a transfer pipette, displacing the saline solution. The agarose was allowed to solidify firmly at 4 °C for 10 min.
After removing extraneous agarose with a razor blade, the agarose disc was placed upside down into a chamber illuminated below, under a dissecting microscope. Hair bundles were isolated by sharply tugging the apical end of the organ perpendicular to the bundles. Often the very distal end is the only section that produced retrievable bundles. Large sections of sensory epithelium often remained in the agarose; these were gently brushed away using an eyelash to reveal the embedded bundles beneath. Because it is impossible to remove all of the contaminating cell debris from the sensory epithelium, the samples were significantly more contaminated by cell bodies as compared with bundles isolated from the utricle. The narrowness of the organ also made extraction from the agarose disc much more difficult; when scoring around the area containing the bundles, inclusion of contaminating debris adjacent to the bundles was often unavoidable. Samples were collected with a tungsten needle and transferred to a pre-weighed tube.
Other Methods
Cryosection imaging and scanning electron microscopy were performed as described (24, 33)
RESULTS
Mass Spectrometry of Developing Cochlear Epithelia
To determine the expression profile of actin crosslinkers and other actin-cytoskeleton proteins during development of the chick cochlea, we examined organs from E14 and 16, which represent the beginning and end of the diameter-widening phase (phase II), and 18 and E21, during and at the end of the renewed elongation phase (phase III). To restrict analysis to hair cells and supporting cells, we used peels of the cochlear epithelium (24), separating the sensory cells from the basilar membrane and other tissues (Fig. 1C). We were unable to successfully isolate sensory epithelium peels from cochleas younger than E14.
To identify proteins at each developmental stage, we carried out liquid chromatography-tandem mass spectrometry (LC-MS/MS) shotgun proteomics. Although this shotgun approach quantifies only those proteins expressed at moderate and high levels, we nevertheless could easily identify from the dataset those proteins that are known to regulate the actin cytoskeleton. After reduction, alkylation, and proteolysis, peptides from each time point were analyzed with a Velos ion-trap mass spectrometer. SEQUEST (34) was used to compare MS2 spectra to the chicken Ensembl v59 database; we added in full-length sequences for FSCN1 and FSCN2 (13). Identified peptides are listed in supplemental Table S1. Peptide score thresholds were set at a 1% peptide false-discovery rate, estimated using a decoy (reversed) database, and proteins were identified with the PAW pipeline (27). Combining the four developmental stages, we detected a total of 1751 proteins with two or more unique peptides (supplemental Table S2); the experiment-wide protein false discovery rate was 3%. About 1300 proteins were detected at each developmental stage; 995 proteins were detected at all four stages. Over 1500 proteins were detected in at least two of three runs for at least one developmental stage; this group of proteins was subjected to further analysis (supplemental Table S2.3). Using multidimensional scaling plots, we found that biological replicates from each developmental time clustered together (Fig. 1E). Although the low levels of inner ear protein at each time point led to significant levels of contamination (e.g. by keratin), contaminants did not affect the detection or quantitation of inner ear proteins (Figs. 1F, 1G).
Because quantitation methods that use co- or post-translational labeling, such as SILAC (35) are impractical for chicken embryos, we determined protein levels in LC-MS/MS runs using summed MS2 molar intensities, a label-free method. Intensities matching to a single protein were divided by protein molecular mass; each protein's intensity/molecular mass was then divided by the summed total of all intensity and molecular mass values in a run. This measure, normalized molar intensity (im), is nearly identical to the known mole fraction of protein standards over a substantial concentration range, albeit with significant protein-to-protein variation (24).
To highlight proteins associated with the actin cytoskeleton, we used Gene Ontology (GO) analysis. Because chicken databases are poorly annotated with GO entries, we first identified human orthologs of each protein identified in our experiments, then identified those with GO terms containing “actin.” Although we identified 46 actin-associated proteins with this strategy, chicken-human ortholog identification is imperfect and the GO database is not comprehensive; we therefore manually identified an additional 53 proteins that have a well-characterized association with the actin cytoskeleton that were not so annotated in GO (supplemental Table S2.3).
To determine which actin-associated proteins may participate in stereocilia development, and to determine which other proteins showed similar developmental regulation, we used k-means clustering (36) with Cluster 3.0 to segregate proteins into ten groups with similar developmental protein-expression profiles, as determined by mass spectrometry (Fig. 1H). Each cluster contained a variety of actin-associated proteins with similar expression patterns. Fig. 2 illustrates developmental profiles for 28 known hair-bundle proteins (14) and other proteins recognized to be associated with the actin cytoskeleton. Fig. 2A illustrates actin crosslinkers and cappers detected in the mass spectrometry experiments, whereas Fig. 2B depicts other proteins arranged by their time point for peak expression.
Fig. 2.

Expression of actin-associated proteins during cochlear development as determined by quantitative mass spectrometry. A, Normalized molar intensity profiles for actin and actin-capping or actin-crosslinking proteins. Stereocilia elongation phases are indicated in gray in the top row of panels. Mean from three biological replicates ± S.E. are plotted; some points correspond to detection in only one of three biological replicates. im = 0 indicates that the protein was not detected at that stage. In the CAPZB panel, the sum of CAPZA1 and CAPZA2 signals is shown by a dashed gray line. B, Profiles for other actin-associated proteins. The frame color indicates the developmental stage showing peak protein expression (purple, E14; green, E18; blue, E21).
The amount of actin remained at ∼10% of the total protein of the epithelium over the E14-E21 period (Fig. 2). FSCN1 and FSCN2 were the most abundant tight actin crosslinkers in chick cochlea (Fig. 2); they accounted for ∼0.1% of the total cochlear protein at their respective peaks of P14 and P18. Espin was not detected. We detected the plastins PLS1 and PLS3 but at levels much lower than the fascins. “Loose” actin crosslinking proteins were detected, including two alpha-actinins (ACTN1 and ACTN4), which were at relatively low levels, and filamin B (FLNB), which was as abundant as FSCN2. We also detected members of the CAPZ and twinfilin families. Although EPS8 was not present in our dataset, we did detect EPS8L2.
Developmental Acquisition of Actin Crosslinkers
We examined our mass spectrometry data for tight actin crosslinkers that were differentially expressed during development of the cochlea. FSCN2 levels as a fraction of total protein in the cochlear epithelium increased ∼10-fold from E14 to E18, whereas FSCN1 decreased by ∼10-fold between E14 and E21 (Fig. 2). By contrast, PLS1 peaked at E16, then declined, whereas PLS3 was highest at P14, declined at E16, then increased. FSCN2 levels were much greater than those of the plastins at all time points (Fig. 2).
We used quantitative RT-PCR (RT-qPCR) with extracts of whole chick cochlea to survey mRNA expression for the fascins and plastins between E7 and E21 (Fig. 3A). Similar to protein expression estimated from mass spectrometry, FSCN1 mRNA levels dropped continuously over this time span; by contrast, FSCN2 expression increased monotonically (Fig. 3B). PLS1, PLS2, and PLS3 mRNA levels were similar and apart from a transient increase at E12 by PLS2, were relatively stable (Fig. 3C). These mRNA levels were normalized relative to GAPDH. Although GAPDH protein levels increased during cochlear development (see below), threshold cycle times were similar for PCR reactions from each stage analyzed (Fig. 3E), suggesting that GAPDH mRNA levels remained constant.
Fig. 3.
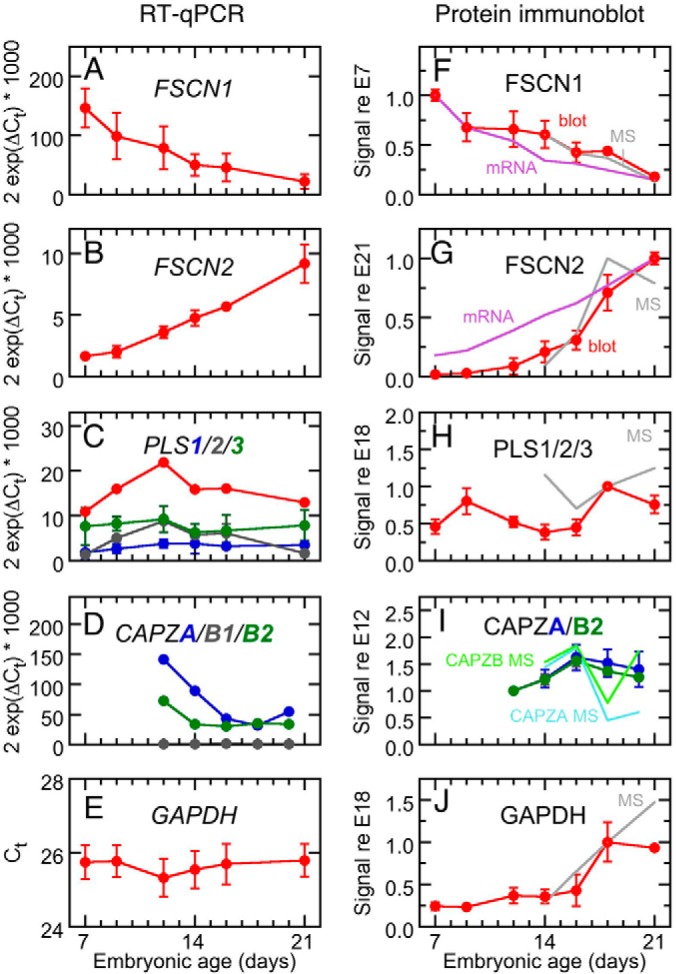
Expression analysis of tight crosslinkers and cappers during cochlear development. A–E, qPCR. F–J, protein immunoblotting. F, FSCN1 signal referenced to signal at E7. Gray line indicates mass spectrometry data (MS). G, FSCN2 referenced to E21. H, Pan-plastin referenced to E18. Note that the lack of correspondence with the mass spectrometry data. I, CAPZA (dark blue) and CAPZB (dark green), referenced to E12. Light blue and green lines show mass spectrometry data for CAPZA and CAPZB. J, GAPDH referenced to E18.
Immunoblots of whole cochleas with antibodies specific for FSCN1 and FSCN2 indicated that protein levels were similar to those determined by mass spectrometry; these levels mirrored mRNA expression, albeit with a lag of 1–2 days (Figs. 3F, 3G; supplemental Fig. S1). FSCN1 levels fell 5-fold between E7 and E21, whereas FSCN2 expression increased 50-fold. Data in Fig. 3 show immunoblot signals normalized to total protein levels for each developmental stage, so changes in size of the cochlea or hair cell volume were not responsible for the FSCN2 increase. We tested many plastin antibodies against chicken tissue, with best results with an antibody raised against mouse PLS2 (37) that reacted equivalently with chicken PLS1, PLS2, and PLS3; this antibody was therefore used as a pan-plastin antibody (supplemental Fig. S2). Total plastin immunoreactivity showed two peaks (at E9 and E18; Fig. 3H and supplemental Fig. S3), a pattern that did not resemble qPCR results. An antibody specific for PLS3 indicated that PLS3 increased sharply in concentration between E16 and E21 (supplemental Fig. S4). Although we did not detect espin with mass spectrometry, an antibody for espin (12) showed peaks at E9 and E18 for the predominant band of <25 kDa (supplemental Fig. S5). GAPDH protein expression increased ∼fourfold over development, with most of the increase occurring after P14 (Fig. 3J).
Crosslinker Localization in Developing Cochlea
Using immunocytochemistry, we confirmed chick cochlear stereocilia contain FSCN2 (Fig. 4). At E12, the earliest age examined, as well as at later time points, FSCN2 was found specifically in hair cells, progressively becoming concentrated in the stereocilia tips of taller rows and excluded from the base of the stereocilia (Fig. 4A–4M and supplemental Fig. S6). Post-embedding immunogold electron microscopy revealed a uniform distribution of FSCN2 in stereocilia of E21 cochleas (Fig. 4N and supplemental Figs. S7 and S8), however, suggesting that the concentration at tips seen with immunocytochemistry was an artifact. Specific staining was absent from supporting cells and cells outside the sensory epithelium, indicating that hair cells account for the vast majority of FSCN2 in whole cochlea preparations. Although the brightest staining was in stereocilia even at E12, at younger ages there was also substantial FSCN2 immunoreactivity in the hair cell soma (Figs. 4B–4C, 4E–4F); cell body labeling was especially pronounced in cells near the basal end of the cochlea (Figs. 4C, 4F, 4I, 4M). Cell body staining was still obvious in cells near the base through E21, whereas it is absent from apical cells by E14.
Fig. 4.

Localization of FSCN2 and FSCN1 during chick cochlear development. A–M, Immunofluorescence of FSCN2 in chick cochlea. A–C, E12 cochlea. D–F, E14 cochlea. G–I, E16 cochlea. J–M, E21 cochlea. N, Immunogold electron microscopy of FSCN2 in E21 cochlea. O–Q, Immunofluorescence of FSCN1 in chick cochlea. Scale bar in B is 10 μm and applies to panels C, E, F, H, I, K, M, P, and Q as well. Scale bar in D is 200 μm and applies to panels A, G, J, O as well. Scale bar in N is 200 nm. Color coding in A applies to B–Q as well.
FSCN1 was localized very differently within the cochlea. At P9, when expression was at its peak (Fig. 3), FSCN1 was located predominantly outside the sensory epithelium (Fig. 4O). Hair cells were not labeled (Fig. 4P). After P16, weak FSCN1 immunoreactivity was detected in hair bundles (Fig. 4Q). We were unable to find antibodies that reliably detected PLS1, PLS2, or PLS3 by immunocytochemistry during the E7-E21 time period.
Developmental Acquisition of Actin Cappers
As assessed by mass spectrometry, CAPZ subunits were by far the most abundant actin cappers in the chick cochlear epithelium (Fig. 2). Taken together, the alpha (CAPZA1 and CAPZA2) subunits exhibited a peak at E16, before stereocilia elongation in phase III, then dropped ∼4-fold at E18, during elongation; CAPZB showed a similar pattern (Fig. 2). Similarly, TWF1 and TWF2 decreased to undetectable levels at E18 but, unlike CAPZ, increased sharply by E21, when most elongation slows. EPS8L2 expression rose at E18, consistent with a role in stereocilia growth. Although the twinfilins and EPS8L2 are no doubt important for stereocilia length regulation, we focused on CAPZ, which is much more abundant.
We used RT-qPCR to determine CAPZ mRNA levels (Fig. 3D). Our assays did not distinguish CAPZA1 and CAPZA2, but did separately measure the CAPZB splice forms CAPZB1 and CAPZB2. Unlike the results with mass spectrometry, total CAPZA and CAPZB2 mRNA levels were high at E12, then decreased 2- to 4-fold by E18; CAPZB1 was present at much lower levels than the other transcripts (Fig. 3D). Immunoblotting indicated that protein levels of CAPZA and CAPZB2 in whole cochlea appeared similar to levels reported by mass spectrometric quantitation in peeled epithelia, although in whole cochlea the decline in levels after E16 was more modest (Fig. 3I). This discrepancy could reflect a constant level of CAPZ subunits, maintained during development, which is present in cell types of the cochlea not harvested in the epithelial peels. CAPZB1 was not detected by immunoblotting.
CAPZ Localization
Although CAPZ subunits have not been previously detected in stereocilia by immunocytochemistry, we reasoned that specific fixation conditions might affect accessibility of antibody epitopes. Using three specific monoclonal antibodies against CAPZ subunits (38, 39), when tissues were fixed with formaldehyde, we were completely unable to detect CAPZ in stereocilia. By contrast, we detected CAPZB2 at stereocilia tips of E20 chick cochleas that were fixed with Glyo-Fixx, a glyoxal-containing fixative (Figs. 5A, 5C). Control monoclonal antibodies used at the same concentration gave no signal in stereocilia (Fig. 5B). These results indicate that CAPZ is located in hair cell stereocilia at tips, where there is a preponderance of actin barbed ends.
Fig. 5.
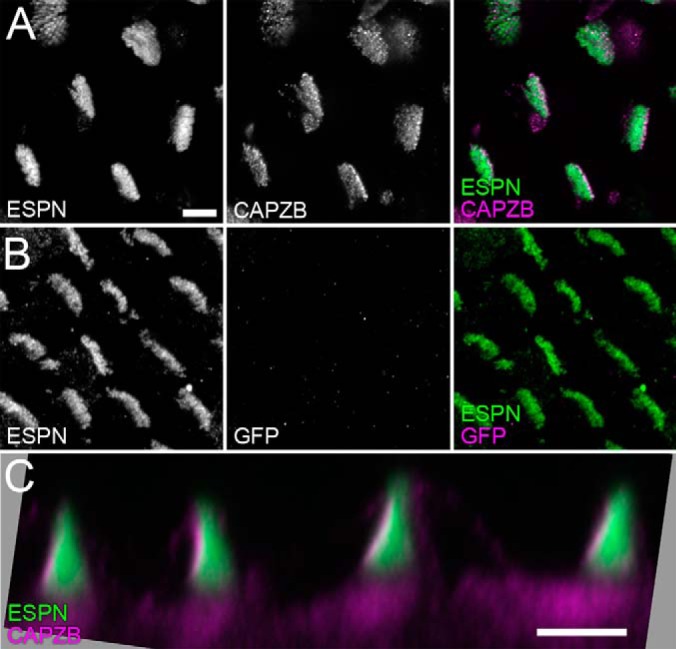
Localization of CAPZB2 in E21 chick cochlea hair bundles. A, CAPZB2 localization with ESPN counterstaining of stereocilia actin. Scale bar (5 μm) applies to B as well. B, Anti-GFP monoclonal antibody signal under identical conditions to A. C, Profile view of CAPZB2 staining. Note that the left-hand edge of each bundle, where stereocilia tips are located, is labeled strongly. Scale bar is 5 μm.
Actin Crosslinkers in Purified Cochlear Hair Bundles
To investigate more directly the composition of chick cochlear stereocilia, we adapted the “twist-off” technique for hair-bundle isolation (28, 40) to the E21 chick cochlea (Fig. 6A). Bundle isolation was much less efficient than with chick utricle, with <20% of cochlea bundles isolated, mostly in the distal (low frequency) region. By comparing the abundance of histones—absent from bundles—in purified bundles and cochlear epithelium, we estimated that the bundle preparation was only ∼65% pure.
Fig. 6.

Chick cochlea hair bundle proteins. A, Isolated chick cochlea hair bundles, stained with phalloidin (green) to highlight stereocilia and anti-tubulin (magenta) to show contamination and kinocilia. Note recovery of bundles is variable from region to region and there is significant contamination in some areas. Left panel scale bar, 100 μm; right panel scale bar, 20 μm. B, Mole fractions of proteins in cochlear epithelium (left) and bundle (right); the slope of the line connecting them represents bundle-to-epithelium enrichment. Proteins most highly enriched in the epithelium are indicated at left, whereas bundle-enriched proteins are at right. Hue represents relative enrichment (power coefficient of fit connecting points) for each protein. C, Utricle bundle proteins; the most abundant proteins that collectively account for ∼80% of the total im are labeled. The last twelve protein symbols, which overlap in the figure, are ARF1/5, ERM, YWHAB, LDHB, RAB, H4, PLS, KPYK, EEF1A1, H2A, LDHA, and TPI1. D, Cochlea bundle proteins; those accounting for ∼80% of the total im are indicated.
Using a high false-discovery rate of 5%, we identified 40 proteins in cochlea hair bundles that were detected in at least 3/4 experiments (Table I). The relative abundances (by im) of bundle proteins were distinct from those of whole cochlear epithelium (Fig. 6B), and were more similar to those of vestibular bundles (Fig. 6C, 6D). Actin was present at an molar abundance (im = 0.42) that was comparable to its abundance in vestibular bundles (im = 0.38) using the same mass spectrometer; likewise, about half of the 20 most abundant cochlea proteins were among the 20 most abundant utricle proteins. However, there were several striking differences between cochlea and utricle. For example, the calcium buffer calbindin was the second most abundant protein in cochlea, but was not detected in utricle. Moreover, the Na+/Pi transporter SLC34A2 was abundant and enriched in cochlea bundles, as compared with the cochlea epithelium, but was not detected in utricle bundles. Its role in the chick ear is specific to the auditory system; by Affymetrix microarray, SLC34A2 transcripts were enriched >800-fold in chick cochlea as compared with utricle (24).
Actin crosslinking proteins were present at conspicuously low levels in cochlea hair bundles (Table II). The im value for FSCN2 was 8.5 × 10⁻³, less than 1/3rd the concentration detected in vestibular hair bundles. Because the FSCN2 relative molar intensity detected by the Velos mass spectrometer was lower than that detected by the previously-used LTQ, the values for vestibular crosslinkers were lower than previously reported (13). The direct cochlea-utricle comparison is valid, however, as both datasets reported here were collected on the same instrument using the same conditions. Plastins were not detected in cochlear bundles, despite being present in vestibular bundles at im = 7 × 10⁻³. FSCN2 was still concentrated in stereocilia actin structures; while the actin/FSCN2 molar intensity ratio was 50 in cochlea stereocilia, it was 110 in cochlea sensory epithelium (Fig. 2B). Other actin crosslinkers were detected in cochlear epithelia, including ACTN1, ACTN4, and FLNB, which loosely crosslink actin filaments, and VILL (villin-like protein), which has not been characterized biochemically. Although FLNB and the alpha-actinins were detected in cochlea hair bundles, they were each present at an apparent concentration ∼1/10th that of FSCN2.
Table II. Actin and actin binding proteins in chick cochlea hair bundles. Key in Table I applies to Table II.
| Protein or protein group | Description | Symbol | Utricle bundles |
Cochlea bundles |
||||
|---|---|---|---|---|---|---|---|---|
| Count | Mean im ± S.E. | Actin per protein | Count | Mean im ± S.E. | Actin per protein | |||
| ACT | Actin | ACT | 4 | 0.38 ± 0.03 | 1 | 4 | 0.42 ± 0.01 | 1 |
| ENSGALP00000037676.1 | Fascin 2 | FSCN2 | 4 | 0.029 ± 0.002 | 13 | 4 | 0.0085 ± 0.0009 | 50 |
| PLS1/2/3 | Plastin | PLS1/2/3 | 4 | 0.0065 ± 0.0001 | 59 | ND | ND | ND |
| ENSGALP00000033359.1 | Fascin 1 | FSCN1 | 4 | 0.0017 ± 0.002 | 230 | ND | ND | ND |
| ACTN1/2/4 | Alpha-actinin | ACTN1/2/4 | 4 | 0.0012 ± 0.001 | 330 | 3 | 0.0017 ± 0.0004 | 250 |
| ESPN | Espin | ESPN | 4 | 0.00038 ± 0.00012 | 1000 | ND | ND | ND |
| ENSGALP00000010106 | Espin-like protein | ESPNL | 4 | 0.00032 ± 0.0003 | 1200 | ND | ND | ND |
| FLN | Filamin B | FLN | 4 | 0.00004 ± 0.00001 | 9200 | 4 | 0.0012 ± 0.0001 | 350 |
| GAPDH | Glyceraldehyde-3-phosphate dehydrogenase | GAPDH | 4 | 0.033 ± 0.001 | 12 | 4 | 0.082 ± 0.008 | 5 |
Together, all actin crosslinkers in cochlea stereocilia accounted for im = 11 × 10−3, which corresponds to one crosslink for every 37 actin monomers. By contrast, the total im for vestibular actin crosslinkers was im = 40 × 10−3, or one crosslink per 10 actin monomers. Interestingly, the weak actin crosslinker GAPDH (41) was present in cochlear stereocilia at im = 82 × 10−3, sevenfold greater than all other actin crosslinkers combined.
DISCUSSION
Quantitative proteomics using shotgun mass spectrometry allows identification and quantitation of the most abundant proteins in a complex tissue. Because hair cells account for a significant fraction of the sensory epithelium mass (42) and the hair bundle contains most of the actin in the hair cell (43), analysis of actin-associated proteins in the whole epithelium during development provides clues to the assembly of the bundle. Although analysis of the whole epithelium prevents examination of spatial segregation of cells and structures within the tissue, including hair cell-supporting cell differences, soma-bundle differential localization, and apical-basal morphology gradients (44), the basic developmental profile for a hair cell is nevertheless apparent. Stereocilia growth is likely controlled by protein expression dynamics, justifying the use of quantitative mass spectrometry on the whole epithelium.
FSCN2 as the Progressive Crosslinker of Cochlear Stereocilia
Tilney and DeRosier suggested that formation of a well-ordered actin bundle could be regulated by controlling the expression or activity of actin crosslinkers (3). They proposed that by gradually increasing the level of actin crosslinkers, stereocilia actin paracrystals could be formed progressively, with slow growth minimizing packing imperfections. Their speculation was supported by in vitro experiments, where the most orderly actin paracrystals formed over a period of several days with a relatively low fascin:actin ratio (4). In stereocilia, once the well-packed core is formed, new filaments can be readily added to the side or additional barbed-end elongation can ensue in the presence of higher levels of crosslinking proteins (3).
Our data are consistent with FSCN2 being the responsible actin crosslinker, and its concentration (or activity) may be controlled by hair cells to permit maximal actin-filament packing efficiency (3). FSCN2 expression increases progressively from E7 to E21, when it is the most abundant crosslinker in cochlear bundles (Figs. 2–3). Although at very low protein levels at early stages (only 3% at E7–9 relative to E21; Fig. 3G), FSCN2 nevertheless targets to stereocilia at that age (Fig. 4). Indeed, the total concentration of FSCN2 in the whole cochlea roughly correlates with the total length of actin filaments in stereocilia at a given stage. FSCN2 levels increase fourfold during phase II (Fig. 3), when new actin filaments are added to the stereocilia actin core; during this time, the mass of stereocilia actin filaments also increases fourfold (3). Likewise, FSCN2 levels rise another threefold during phase III (Fig. 3); during this time, the total actin filament content more than doubles in stereocilia (3).
Early in development, a substantial amount of FSCN2 was present in hair cell somas (Fig. 4); once hair cells were mature, however, nearly all FSCN2 was located in stereocilia. The timing of this shift from soma to stereocilia varied depending on cochlear position; FSCN2 of distal (low frequency) hair cells was fully concentrated in stereocilia by E14, whereas proximal (high frequency) hair cells still had FSCN2 in their somas at E16. As quantitation of FSCN2 in isolated hair bundles suggests that it is present at levels well below saturation for actin binding, the relatively large amount of soluble FSCN2 seen early in development could have the post-translational phosphorylation that prevents it from crosslinking actin (45).
FSCN1 is very abundant during early cochlea development, yet immunocytochemistry places most of it outside of hair cells. Plastins are abundant in vestibular stereocilia (13), yet they are expressed at levels in developing chick cochlear stereocilia that are much lower than those of FSCN2. Moreover, the plastins' expression profiles do not match that predicted for a major stereocilia crosslinker. Interestingly, we saw an increase in PLS3 expression late in development detected by immunoblotting and mass spectrometry that is consistent with the transient expression of PLS3 seen in developing rat cochlea stereocilia (16). Of course, without isoform-specific localization of the plastins it is impossible to say whether any of them are more prominent in certain classes of hair cells.
GAPDH as a Weak Actin Crosslinker
Glycolytic enzymes, including GAPDH, are well known to bind to actin filaments (46–48). GAPDH not only binds with a submicromolar Kd to actin, but also crosslinks actin filaments (41). In addition to actin binding, GAPDH is known to have other moonlighting functions unrelated to glycolysis, including control of transcription and apoptosis (49, 50). GAPDH is present in chick cochlear bundles at a 10-fold higher concentration (>500 μm) than the most abundant tight actin crosslinker. Although the high cochlear level of GAPDH is thought to be a response to the hypoxic cochlear environment (24), GAPDH is nevertheless also relatively high in vestibular stereocilia as well.
Because the affinity of GAPDH for actin filaments is relatively low, it could be a transient crosslinker. GAPDH is present in cochlear hair bundles at a sufficiently high ratio with actin (1:5) that it could occupy most of the possible actin crosslinking sites in the paracrystal. Because GAPDH binds weakly, however, crosslinks may detach and reform to allow a more ordered packing of actin filaments. The slow progressive rise in FSCN2, which likely dissociates much more slowly, would anchor the paracrystal arrangement in place. This hypothesis will be difficult to test, however, given the universal need for GAPDH; perhaps the molecule can be re-engineered without its actin binding sites or with its ability to heteromultimerize abolished.
Developmental Regulation of Barbed-end CAPZs
Stereocilia growth between E9 and E21 is interrupted by a period of stereocilia length stasis (phase II), during which time the stereocilia widen by adding additional actin filaments to the initial actin paracrystal. The phase II stall in stereocilia elongation could occur if barbed-end capping molecules were up-regulated, which by mass action might outcompete mechanisms that catalyze barbed-end elongation. Accordingly, resumption of elongation seen in phase III could occur when those capping molecules are reduced in concentration, for example by proteolysis. Because elongation also slows at the end of phase III, there should be a second wave of barbed-end capping activity. Other mechanisms of controlling capping included modulation of membrane tension, reduction in the availability of actin subunits, or decreased concentration of molecules that stimulate elongation.
CAPZ may be in part responsible for the elongation stall of phase II; high levels of the alpha subunits CAPZA1 and CAPZA2, as well as beta subunit CAPZB, are found at E14-E16 (Fig. 3), when elongation has ceased. CAPZ subunits then decrease notably at E18, when elongation is underway; protein levels recover by E21. The beta splice forms CAPZB1 and CAPZB2 differ only by their C-terminal ∼30 amino acids; whereas many peptides mapped to common regions, we only found peptides exclusively mapping to CAPZB2, never to CAPZB1, which was consistent with the RT-PCR results (Fig. 3D) and the predominant localization of CAPZB1 to muscle (51).
Twinfilins may be responsible for stopping elongation at the end of phase III; TWF1 and TWF2 are at modest levels from E14-E16, then subsequently peak at E18 (TWF2) and E21 (TWF1). TWF2 is only thought to cap the shorter rows of stereocilia (19); perhaps TWF1 caps the tallest row of stereocilia. The role of tall-row capper has been attributed to EPS8, which we do not detect in cochlear or vestibular epithelia by mass spectrometry; EPS8 transcripts were detected in E21 cochlea and utricle (24), however, suggesting that EPS8 protein is simply below the detection limit of our mass spectrometry experiments. By contrast, we see relatively high levels of the paralog EPS8L2 in cochlea epithelium peels (Fig. 3), as we do in vestibular stereocilia (14). Development of specific antibodies for chicken TWF1, TWF2, EPS8, and EPS8L2 will assist in determining their specific roles during stereocilia growth.
Composition of Chick Hair Bundles
Although the poor yield of chick cochlear hair bundles prevented us from describing the bundle proteome in the same depth as we have for chick vestibular bundles (14), we were able to draw several conclusions from the presence and levels of the most abundant proteins. As previously noted for the whole chick cochlear epithelium (24, 52), calbindin (CALB1) is extremely abundant in cochlear stereocilia, accounting for ∼12% of the protein by molarity. Likewise, glycolytic enzymes are present in chick cochlear bundles at ∼threefold greater levels than in vestibular bundles; this difference reflects the increased reliance of the cochlear epithelium on glycolysis, given its reduced blood supply (24). Similarly, creatine kinase B (CKB), which shuttles mitochondrially produced high-energy phosphate, is >threefold higher in abundance in bundles from utricle epithelia, which are relatively rich in mitochondria (24).
Few other actin-associated proteins were detected in cochlea bundles besides FSCN2. Improvements in the efficiency of hair bundle isolation and sensitivity of mass spectrometry detection will be required for a more complete picture of the actin cytoskeleton of cochlear bundles.
Systems Analysis of Chick Hair Bundle Development
Our experiments highlight the importance of measuring protein levels, as our data confirm that mRNA levels do not always correlate well with protein levels. Although protein and mRNA profiles of several molecules matched well (e.g. FSCN1 and FSCN2), others did not (plastins, CAPZ). Because mass spectrometry has a limited dynamic range, many of the most rare proteins—which may be regulatory proteins—may nevertheless remain difficult to detect. For this reason, developmental profiles of cochlear transcripts, obtained either with microarrays or RNA-Seq, will be valuable in generating initial hypotheses for how the cochlea generates such diversity in hair bundle structure.
The proteome profile reported for developing chick cochlea represents an initial step in the characterization of the chick cochlea using systems biology approaches. Although in our experiments we analyzed whole cochlea, different cochlear regions carry out distinct functions. The proximal cochlea encodes high frequency and contains bundles with large numbers of stereocilia, whereas distal regions encode low frequencies and cells have relatively few stereocilia. Hair cells also change morphology along the perpendicular axis; tall hair cells at the neural edge of the epithelium have many afferent contacts and are thought to provide most of the input to the brain, whereas short hair cells on the abneural side have mostly efferent contacts and are thought to act as local amplifiers (53). Improvements in mass spectrometry sensitivity will permit experiments with segregation of cochlea sensory epithelium peels into proximal, distal, neural, and abneural regions, allowing for a better understanding of the molecular distinctions among these cochlear zones.
Supplementary Material
Footnotes
Author contributions: M.R.A., K.W.S., M.R.L., J.S., and P.G.B.G. designed research; M.R.A., K.W.S., M.R.L., J.S., K.J.S., J.M.P., L.A., and B.K. performed research; P.A.W. contributed new reagents or analytic tools; M.R.A., K.W.S., M.R.L., P.A.W., D.C., L.L.D., and P.G.B.G. analyzed data; P.G.B.G. wrote the paper.
* This work was supported by National Institutes of Health grants R01 DC011034 (PGBG), R01 DC002368 (PGBG), P30 DC005983 (PGBG), and R01 EY007755 (LLD).
 This article contains supplemental Figs. S1 to S8 and Tables S1 to S6.
1 The abbreviations used are:
- PLS1
- plastin 1
- ACTN1
- alpha actinin 1
- ACTN4
- alpha actinin 4
- CALB1
- calbindin
- CAPZ
- capping protein
- CAPZA1
- CAPZ alpha subunit 1
- CAPZA2
- CAPZ alpha subunit 2
- CAPZB
- capping protein beta subunit
- CAPZB1
- capping protein beta subunit, splice form 1
- CAPZB2
- capping protein beta subunit, splice form 2
- CKB
- creatine kinase, brain
- EPS8
- epidermal growth factor receptor pathway substrate 8
- EPS8L2
- EPS8-like 2
- ESPN
- espin
- Ex
- embryonic day x
- FLNB
- filamin B
- FSCN1
- fascin 1
- FSCN2
- fascin 2
- GAPDH
- glyceraldehyde dehydrogenase
- GFP
- green fluorescent protein
- GO
- Gene Ontology
- LC-MS/MS
- liquid chromatography tandem mass spectrometry
- MS1
- parent ion mass spectrum
- MS2
- product ion mass spectrum
- PBS
- phosphate buffered saline
- PBSt
- PBS with Tween
- PDVF
- polyvinylidene difluoride
- PLS1
- plastin 1
- PLS2
- plastin 2
- PLS3
- plastin 3
- qPCR
- quantitative PCR
- RT-PCR
- reverse-transcriptase polymerase chain reaction
- RT-qPCR
- quantitative RT-PCR
- SEM
- scanning electron microscope
- SEM
- standard error of the mean
- SILAC
- stable isotope labeling by amino acids in cell culture
- SLC34A2
- solute carrier family 34 (sodium phosphate), member 2
- TEM
- transmission electron microscope
- TWF1
- twinfilin 1
- TWF2
- twinfilin 2.
REFERENCES
- 1. Tilney L. G., Tilney M. S., DeRosier D. J. (1992) Actin filaments, stereocilia, and hair cells: how cells count and measure. Ann. Rev. Cell Biol. 8, 257–274 [DOI] [PubMed] [Google Scholar]
- 2. Kaltenbach J. A., Falzarano P. R., Simpson T. H. (1994) Postnatal development of the hamster cochlea. II. Growth and differentiation of stereocilia bundles. J. Comp. Neurol. 350, 187–198 [DOI] [PubMed] [Google Scholar]
- 3. Tilney L. G., DeRosier D. J. (1986) Actin filaments, stereocilia, and hair cells of the bird cochlea. IV. How the actin filaments become organized in developing stereocilia and in the cuticular plate. Dev. Biol. 116, 119–129 [DOI] [PubMed] [Google Scholar]
- 4. Stokes D. L., DeRosier D. J. (1991) Growth conditions control the size and order of actin bundles in vitro. Biophys. J. 59, 456–465 [DOI] [PMC free article] [PubMed] [Google Scholar]
- 5. DeRosier D. J., Tilney L. G., Egelman E. (1980) Actin in the inner ear: the remarkable structure of the stereocilium. Nature. 287, 291–296 [DOI] [PubMed] [Google Scholar]
- 6. Volkmann N., DeRosier D., Matsudaira P., Hanein D. (2001) An atomic model of actin filaments cross-linked by fimbrin and its implications for bundle assembly and function. J. Cell Biol. 153, 947–956 [DOI] [PMC free article] [PubMed] [Google Scholar]
- 7. Jansen S., Collins A., Yang C., Rebowski G., Svitkina T., Dominguez R. (2011) Mechanism of actin filament bundling by fascin. J. Biol. Chem. 286, 30087–30096 [DOI] [PMC free article] [PubMed] [Google Scholar]
- 8. Purdy K. R., Bartles J. R., Wong G. C. (2007) Structural polymorphism of the actin-espin system: a prototypical system of filaments and linkers in stereocilia. Phys. Rev. Lett. 98, 058105 [DOI] [PMC free article] [PubMed] [Google Scholar]
- 9. Tilney M. S., Tilney L. G., Stephens R. E., Merte C., Drenckhahn D., Cotanche D. A., Bretscher A. (1989) Preliminary biochemical characterization of the stereocilia and cuticular plate of hair cells of the chick cochlea. J. Cell Biol. 109, 1711–1723 [DOI] [PMC free article] [PubMed] [Google Scholar]
- 10. Zheng L., Sekerkova G., Vranich K., Tilney L. G., Mugnaini E., Bartles J. R. (2000) The deaf jerker mouse has a mutation in the gene encoding the espin actin-bundling proteins of hair cell stereocilia and lacks espins. Cell 102, 377–385 [DOI] [PMC free article] [PubMed] [Google Scholar]
- 11. Sekerkova G., Richter C. P., Bartles J. R. (2011) Roles of the espin actin-bundling proteins in the morphogenesis and stabilization of hair cell stereocilia revealed in CBA/CaJ congenic jerker mice. PLoS Genet. 7, e1002032. [DOI] [PMC free article] [PubMed] [Google Scholar]
- 12. Li H., Liu H., Balt S., Mann S., Corrales C. E., Heller S. (2004) Correlation of expression of the actin filament-bundling protein espin with stereociliary bundle formation in the developing inner ear. J. Comp. Neurol. 468, 125–134 [DOI] [PubMed] [Google Scholar]
- 13. Shin J. B., Longo-Guess C. M., Gagnon L. H., Saylor K. W., Dumont R. A., Spinelli K. J., Pagana J. M., Wilmarth P. A., David L. L., Gillespie P. G., Johnson K. R. (2010) The R109H variant of fascin-2, a developmentally regulated actin crosslinker in hair-cell stereocilia, underlies early-onset hearing loss of DBA/2J mice. J. Neurosci. 30, 9683–9694 [DOI] [PMC free article] [PubMed] [Google Scholar]
- 14. Shin J. B., Krey J. F., Hassan A., Metlagel Z., Tauscher A. N., Pagana J. M., Sherman N. E., Jeffery E. D., Spinelli K. J., Zhao H., Wilmarth P. A., Choi D., David L. L., Auer M., Barr-Gillespie P. G. (2013) Molecular architecture of the chick vestibular hair bundle. Nat. Neurosci. 16, 365–374 [DOI] [PMC free article] [PubMed] [Google Scholar]
- 15. Loomis P. A., Zheng L., Sekerkova G., Changyaleket B., Mugnaini E., Bartles J. R. (2003) Espin cross-links cause the elongation of microvillus-type parallel actin bundles in vivo. J. Cell Biol. 163, 1045–1055 [DOI] [PMC free article] [PubMed] [Google Scholar]
- 16. Daudet N., Lebart M. C. (2002) Transient expression of the t-isoform of plastins/fimbrin in the stereocilia of developing auditory hair cells. Cell Motil. Cytoskeleton. 53, 326–336 [DOI] [PubMed] [Google Scholar]
- 17. Cooper J. A., Sept D. (2008) New insights into mechanism and regulation of actin capping protein. Int. Rev. Cell Mol. Biol. 267, 183–206 [DOI] [PMC free article] [PubMed] [Google Scholar]
- 18. Moseley J. B., Okada K., Balcer H. I., Kovar D. R., Pollard T. D., Goode B. L. (2006) Twinfilin is an actin-filament-severing protein and promotes rapid turnover of actin structures in vivo. J. Cell Sci. 119, 1547–1557 [DOI] [PubMed] [Google Scholar]
- 19. Peng A. W., Belyantseva I. A., Hsu P. D., Friedman T. B., Heller S. (2009) Twinfilin 2 regulates actin filament lengths in cochlear stereocilia. J. Neurosci. 29, 15083–15088 [DOI] [PMC free article] [PubMed] [Google Scholar]
- 20. Zampini V., Ruttiger L., Johnson S. L., Franz C., Furness D. N., Waldhaus J., Xiong H., Hackney C. M., Holley M. C., Offenhauser N., Di Fiore P. P., Knipper M., Masetto S., Marcotti W. (2011) Eps8 regulates hair bundle length and functional maturation of mammalian auditory hair cells. PLoS Biol. 9, e1001048. [DOI] [PMC free article] [PubMed] [Google Scholar]
- 21. Manor U., Disanza A., Grati M., Andrade L., Lin H., Di Fiore P. P., Scita G., Kachar B. (2011) Regulation of stereocilia length by myosin XVa and whirlin depends on the actin-regulatory protein Eps8. Curr. Biol. 21, 167–172 [DOI] [PMC free article] [PubMed] [Google Scholar]
- 22. Furness D. N., Johnson S. L., Manor U., Ruttiger L., Tocchetti A., Offenhauser N., Olt J., Goodyear R. J., Vijayakumar S., Dai Y., Hackney C. M., Franz C., Di Fiore P.P., Masetto S., Jones S. M., Knipper M., Holley M. C., Richardson G. P., Kachar B., Marcotti W. (2013) Progressive hearing loss and gradual deterioration of sensory hair bundles in the ears of mice lacking the actin-binding protein Eps8L2. Proc. Natl. Acad. Sci. U.S.A. 110, 13898–13903 [DOI] [PMC free article] [PubMed] [Google Scholar]
- 23. Schafer D. A., Mooseker M. S., Cooper J. A. (1992) Localization of capping protein in chicken epithelial cells by immunofluorescence and biochemical fractionation. J. Cell Biol. 118, 335–346 [DOI] [PMC free article] [PubMed] [Google Scholar]
- 24. Spinelli K. J., Klimek J. E., Wilmarth P. A., Shin J. B., Choi D., David L. L., Gillespie P. G. (2012) Distinct energy metabolism of auditory and vestibular sensory epithelia revealed by quantitative mass spectrometry using MS2 intensity. Proc. Natl. Acad. Sci. U.S.A. 109, E268–E277 [DOI] [PMC free article] [PubMed] [Google Scholar]
- 25. Elias J. E., Gygi S. P. (2007) Target-decoy search strategy for increased confidence in large-scale protein identifications by mass spectrometry. Nat. Methods. 4, 207–214 [DOI] [PubMed] [Google Scholar]
- 26. Keller A., Nesvizhskii A. I., Kolker E., Aebersold R. (2002) Empirical statistical model to estimate the accuracy of peptide identifications made by MS/MS and database search. Anal. Chem. 74, 5383–5392 [DOI] [PubMed] [Google Scholar]
- 27. Wilmarth P. A., Riviere M. A., David L. L. (2009) Techniques for accurate protein identification in shotgun proteomic studies of human, mouse, bovine, and chicken lenses. J. Ocul. Biol. Dis. Infor. 2, 223–234 [DOI] [PMC free article] [PubMed] [Google Scholar]
- 28. Shin J. B., Streijger F., Beynon A., Peters T., Gadzala L., McMillen D., Bystrom C., Van der Zee C. E., Wallimann T., Gillespie P. G. (2007) Hair bundles are specialized for ATP delivery via creatine kinase. Neuron. 53, 371–386 [DOI] [PMC free article] [PubMed] [Google Scholar]
- 29. Fei S. S., Wilmarth P. A., Hitzemann R. J., McWeeney S. K., Belknap J. K., David L. L. (2011) Protein database and quantitative analysis considerations when integrating genetics and proteomics to compare mouse strains. J. Proteome Res. 10, 2905–2912 [DOI] [PMC free article] [PubMed] [Google Scholar]
- 30. Serang O., Moruz L., Hoopmann M. R., Kall L. (2012) Recognizing uncertainty increases robustness and reproducibility of mass spectrometry-based protein inferences. J. Proteome Res. 11, 5586–5591 [DOI] [PMC free article] [PubMed] [Google Scholar]
- 31. Eisen M. B., Spellman P. T., Brown P. O., Botstein D. (1998) Cluster analysis and display of genome-wide expression patterns. Proc. Natl. Acad. Sci. U.S.A. 95, 14863–14868 [DOI] [PMC free article] [PubMed] [Google Scholar]
- 32. Garge N. R., Page G. P., Sprague A. P., Gorman B. S., Allison D. B. (2005) Reproducible clusters from microarray research: whither? BMC Bioinformatics 6 Suppl 2, S10. [DOI] [PMC free article] [PubMed] [Google Scholar]
- 33. Spinelli K. J., Gillespie P. G. (2012) Monitoring intracellular calcium ion dynamics in hair cell populations with Fluo-4 AM. PLoS One 7, e51874. [DOI] [PMC free article] [PubMed] [Google Scholar]
- 34. Eng J. K., McCormack A. L., Yates J. R. (1994) An approach to correlate tandem mass spectral data of peptides with amino acid sequences in a protein database. J. Am. Soc. Mass Spectrom. 5, 976–989 [DOI] [PubMed] [Google Scholar]
- 35. Ong S. E., Blagoev B., Kratchmarova I., Kristensen D. B., Steen H., Pandey A., Mann M. (2002) Stable isotope labeling by amino acids in cell culture, SILAC, as a simple and accurate approach to expression proteomics. Mol. Cell. Proteomics. 1, 376–386 [DOI] [PubMed] [Google Scholar]
- 36. Tavazoie S., Hughes J. D., Campbell M. J., Cho R. J., Church G. M. (1999) Systematic determination of genetic network architecture. Nat. Genet. 22, 281–285 [DOI] [PubMed] [Google Scholar]
- 37. Toyooka K., Liu F., Ishii M., Saito S., Kirikae T., Asano Y., Shinomiya H. (2006) Generation and characterization of monoclonal antibodies that specifically recognize p65/L-plastin isoform but not T-plastin isoform. Biosci. Biotechnol. Biochem. 70, 1402–1407 [DOI] [PubMed] [Google Scholar]
- 38. Hug C., Miller T. M., Torres M. A., Casella J. F., Cooper J. A. (1992) Identification and characterization of an actin-binding site of CapZ. J. Cell Biol. 116, 923–931 [DOI] [PMC free article] [PubMed] [Google Scholar]
- 39. Schafer D. A., Jennings P. B., Cooper J. A. (1996) Dynamics of capping protein and actin assembly in vitro: uncapping barbed ends by polyphosphoinositides. J. Cell Biol. 135, 169–179 [DOI] [PMC free article] [PubMed] [Google Scholar]
- 40. Gillespie P. G., Hudspeth A. J. (1991) High-purity isolation of bullfrog hair bundles and subcellular and topological localization of constituent proteins. J. Cell Biol. 112, 625–640 [DOI] [PMC free article] [PubMed] [Google Scholar]
- 41. Waingeh V. F., Gustafson C. D., Kozliak E. I., Lowe S. L., Knull H. R., Thomasson K. A. (2006) Glycolytic enzyme interactions with yeast and skeletal muscle F-actin. Biophys. J. 90, 1371–1384 [DOI] [PMC free article] [PubMed] [Google Scholar]
- 42. Hirokawa N. (1978) The ultrastructure of the basilar papilla of the chick. J. Comp. Neurol. 181, 361–374 [DOI] [PubMed] [Google Scholar]
- 43. Tilney L. G., Tilney M. S. (1988) The actin filament content of hair cells of the bird cochlea is nearly constant even though the length, width//number of stereocilia vary depending on the hair cell location. J. Cell Biol. 107, 2563–2574 [DOI] [PMC free article] [PubMed] [Google Scholar]
- 44. Tilney L. G., Saunders J. C. (1983) Actin filaments, stereocilia, and hair cells of the bird cochlea. Length, width, and distribution of stereocilia of each hair cell are related to the position of the hair cell on the cochlea. J. Cell Biol. 96, 807–821 [DOI] [PMC free article] [PubMed] [Google Scholar]
- 45. Kureishy N., Sapountzi V., Prag S., Anilkumar N., Adams J. C. (2002) Fascins, and their roles in cell structure and function. Bioessays. 24, 350–361 [DOI] [PubMed] [Google Scholar]
- 46. Arnold H., Pette D. (1968) Binding of glycolytic enzymes to structure proteins of the muscle. Eur. J. Biochem. 6, 163–171 [DOI] [PubMed] [Google Scholar]
- 47. Arnold H., Henning R., Pette D. (1971) Quantitative comparison of the binding of various glycolytic enzymes to F-actin and the interaction of aldolase with G-actin. Eur. J. Biochem. 22, 121–126 [DOI] [PubMed] [Google Scholar]
- 48. Clarke F. M., Masters C. J. (1975) On the association of glycolytic enzymes with structural proteins of skeletal muscle. Biochim. Biophys. Acta. 381, 37–46 [DOI] [PubMed] [Google Scholar]
- 49. Sirover M. A. (1999) New insights into an old protein: the functional diversity of mammalian glyceraldehyde-3-phosphate dehydrogenase. Biochim. Biophys. Acta. 1432, 159–184 [DOI] [PubMed] [Google Scholar]
- 50. Kim J. W., Dang C. V. (2005) Multifaceted roles of glycolytic enzymes. Trends Biochem. Sci. 30, 142–150 [DOI] [PubMed] [Google Scholar]
- 51. Schafer D. A., Korshunova Y. O., Schroer T. A., Cooper J. A. (1994) Differential localization and sequence analysis of capping protein beta-subunit isoforms of vertebrates. J. Cell Biol. 127, 453–465 [DOI] [PMC free article] [PubMed] [Google Scholar]
- 52. Oberholtzer J. C., Buettger C., Summers M. C., Matschinsky F. M. (1988) The 28-kDa calbindin-D is a major calcium-binding protein in the basilar papilla of the chick. Proc. Natl. Acad. Sci. U.S.A. 85, 3387–3390 [DOI] [PMC free article] [PubMed] [Google Scholar]
- 53. Beurg M., Tan X., Fettiplace R. (2013) A prestin motor in chicken auditory hair cells: active force generation in a nonmammalian species. Neuron. 79, 69–81 [DOI] [PMC free article] [PubMed] [Google Scholar]
Associated Data
This section collects any data citations, data availability statements, or supplementary materials included in this article.