Abstract
Computational fluid dynamics was used to investigate particle aspiration efficiency in low-moving air typical of occupational settings (0.1–0.4 m s−1). Fluid flow surrounding an inhaling humanoid form and particle trajectories traveling into the mouth were simulated for seven discrete orientations relative to the oncoming wind (0°, 15°, 30°, 60°, 90°, 135° and 180°). Three continuous inhalation velocities (1.81, 4.33, and 12.11 m s−1), representing the mean inhalation velocity associated with sinusoidal at-rest, moderate, and heavy breathing (7.5, 20.8, and 50.3 l min−1, respectively) were simulated. These simulations identified a decrease in aspiration efficiency below the inhalable particulate mass (IPM) criterion of 0.5 for large particles, with no aspiration of particles 100 µm and larger for at-rest breathing and no aspiration of particles 116 µm for moderate breathing, over all freestream velocities and orientations relative to the wind. For particles smaller than 100 µm, orientation-averaged aspiration efficiency exceeded the IPM criterion, with increased aspiration efficiency as freestream velocity decreased. Variability in aspiration efficiencies between velocities was low for small (<22 µm) particles, but increased with increasing particle size over the range of conditions studied. Orientation-averaged simulation estimates of aspiration efficiency agree with the linear form of the proposed linear low-velocity inhalable convention through 100 µm, based on laboratory studies using human mannequins.
Keywords: aspiration efficiency, CFD inhalability, computational fluid dynamics, continuous inhalation, inhalable particulate mass, mouth breathing, orientation averaged, particle aspiration, particle transport, ultralow velocity
Introduction
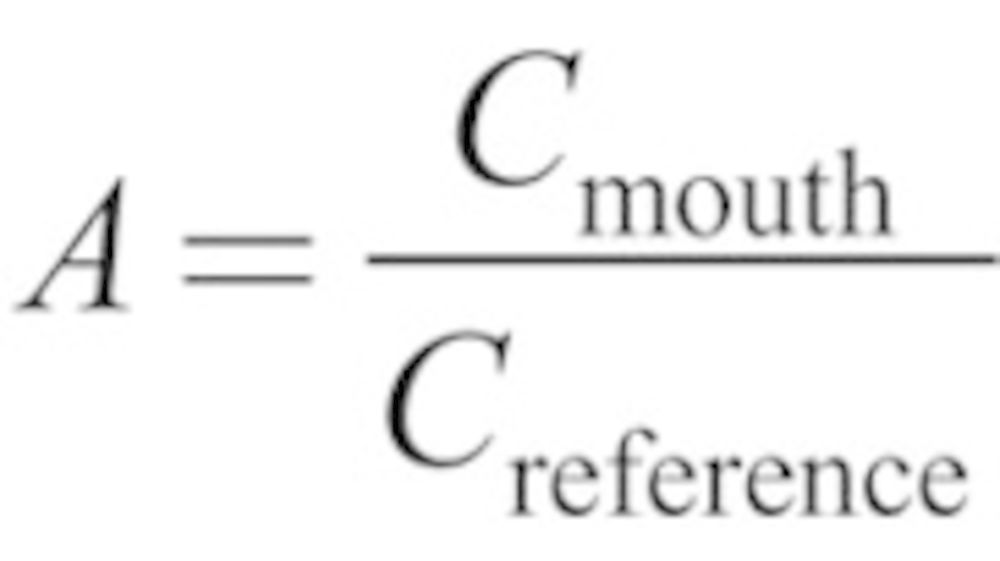
Ogden and Birkett (1975) first identified the concept of the aspiration efficiency of the human head. This aspiration efficiency is defined as the ratio of particle concentration entering into the human mouth/nose relative to the actual concentration in the air surrounding the human. To understand how humans are exposed to inhaled particles, high concentrations of particles within a small wind tunnel were generated and directed toward a tailor’s mannequin, fitted with sample filters inside the mouth. The aspiration efficiency of the human head was computed, for a given particle size, as the ratio of the concentration measured inside the mouth (Cmouth) to that measured in the wind tunnel (Creference):
 |
(1) |
This and other early studies, however, used freestream velocities larger than what we now understand exist in the typical workplace (Baldwin and Maynard, 1998). In workplaces with low air velocities, gravitational settling significantly contributes to the transport of large particles, resulting in both horizontal and vertical components to particle transport (Anthony and Flynn, 2006; King Se et al., 2010). Lidén and Harper (2006) summarize the literature that supports the conclusion that aspiration efficiencies differ significantly between calm-air studies and those at higher velocities (e.g., 1.0 m s−1).
Wind tunnel experiments investigating large-particle inhalability at slower velocities have been conducted, with initially velocities as low as 0.4 m/s (Kennedy and Hinds, 2002) and more recently 0.1 m/s (Sleeth and Vincent, 2009). Commonly, studies generate uniform concentrations of solid particles with a narrowly graded size distribution, while a cyclically breathing mannequin, rotating on its central axis, collects particles to determine an orientation-average aspiration efficiency relative to the oncoming wind (e.g., Kennedy and Hinds, 2002; Sleeth and Vincent, 2012). Others have examined aspiration efficiency in calm-air chambers, where air motion is negligible and particles are delivered to the chamber overhead to examine aspiration (Hsu and Swift, 1999) or rotated mannequins and reference samplers in calm-air chambers (Aitken et al., 1999).
Critical to obtaining aspiration efficiency measures is the quantification of reference concentrations (Creference) in experimental studies, which is the denominator of aspiration calculations. While it is relatively straightforward to quantify the concentration deposited in the mouth or nose of an experimental mannequin, generating and quantifying uniform concentrations upstream of the breathing mannequin in slow-moving air is difficult, particularly for large particles that have both horizontal and vertical velocity components affected by freestream velocity. While isokinetic samplers are employed to sample particles at velocities matching the study freestream velocity, spatial and temporal variability in particle generation might be critical to minimizing the uncertainty in aspiration efficiency calculations. For example, when examining laminar particle trajectories that terminate in a humanoid form’s mouth in previous computational fluid dynamic simulations, particles across an upstream area of 2cm diameter were tracked into the inhaling mouth (Anthony and Flynn, 2006). Maintaining uniform concentrations over this space for the duration of aspiration tests poses experimental challenges.
An alternative approach to wind tunnel experiments has incorporated computational fluid dynamics (CFD) models to simulate air and particle transport around an inhaling human form to model aspiration (e.g., Anthony, 2010; King Se et al., 2010). In this method, uniform freestream velocity and particle generation can be tightly controlled by the experimenter. However, limitations in computational resources and model complexity have limited the examination of time-dependent breathing and omni-directional orientation relative to oncoming air, limiting the full examination of human particle inhalability.
The study presented here builds on previous facing-the-wind aspiration investigations (Anthony and Flynn, 2006; Anthony, 2010) by rotating the human form through 180° and extending the range of low velocities to include ultralow flow examined by Sleeth and Vincent (2009, 2012). While three major simplifications exist in the study presented here, namely cyclical breathing is simplified as continuous mouth inhalation, orientation simulations are conducted in step-wise fashion, and simulations ignore thermal plumes associated with a heated mannequin/human, the results of this work will provide insight into air and particle behavior at discrete orientations relative to the wind. Orientation-specific and -averaged estimates of aspiration efficiency for these inhaling-mouth models will be presented and compared to wind tunnel study estimates.
METHODS
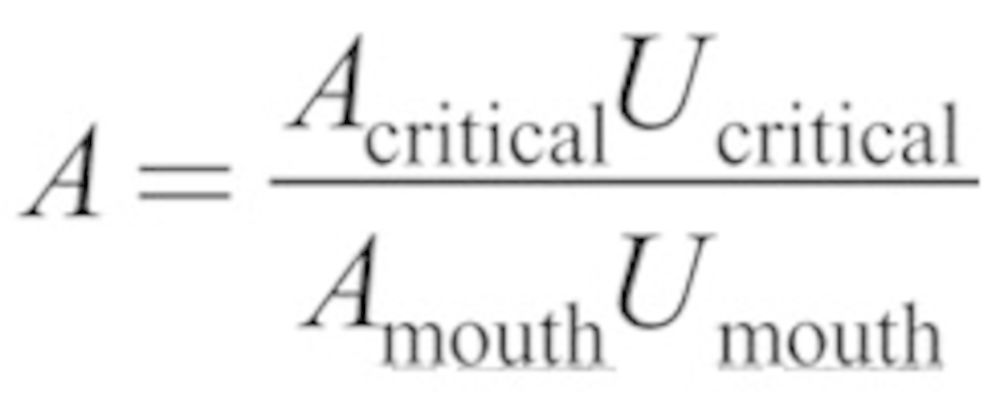
Investigations were conducted using computational fluid dynamics to generate a fluid field surrounding a simulated inhaling mannequin and analyzing subsequent particle trajectories to identify particle aspiration. Geometry, mesh generation, and fluid simulations were completed using Ansys Software (Design Modeler and Fluent 12.1 and 13.0, Ansys Inc., Lebanon, NH, USA). The process required the generation of physical representation of the inhaling mannequin and wind tunnel to be modeled, the generation of the mesh upon which the equations of fluid flow would be solved, and the simulation and verification of fluid solutions. Following these steps, particle trajectories were examined to determine the critical area upstream of the inhaling simulated human: within the critical area, all particles travel and terminate inside the mouth, allowing computation of aspiration efficiency using the ratio of critical area and upstream velocity to mouth area and suction velocity, defined by Anthony and Flynn (2006):
 |
(2) |
where Acritical is the upstream critical area, Amouth is the opening area defined as the mouth, Ucritical is the upstream freestream velocity within the critical area, and Umouth is the velocity assigned to the simulation to reflect the mouth inhalation velocity.
Table 1 identifies the simulation variables examined in this study. Fluid simulations were completed for three freestream velocities of 0.1, 0.2, and 0.4 m s−1 to explore aspiration efficiency for conditions representing indoor velocities typical of occupational settings. This work was limited to mouth breathing, represented as steady (continuous) inhalation with velocities set to 1.81, 4.33, and 12.11 m s−1, which were selected to be mathematically equivalent to the mean inhalation velocity of sinusoidal breathing at 7.5, 20.8, and 50.3 l min−1 to examine at-rest, moderate, and heavy breathing, respectively, to cover the range of both male and female inhalation rates from the literature (U.S. EPA, 2011). While most people inhale predominantly through the nose at low, at-rest breathing rates, a small percentage of the population always takes some fraction of air into the mouth when breathing (ICRP, 1994), so at-rest mouth-only breathing was included in the study conditions for two of the freestream velocities (0.2 and 0.4 m s−1) for examination.
Table 1.
Test conditions examined in study. The number of conditions examined is indicated by N.
| Parameter | Settings | N |
|---|---|---|
| Geometry | Small nose, small lip | 1 |
| Freestream velocity (m s−1) | 0.1, 0.2, 0.4 | 3 |
| Inhalation velocity (m s−1) | 1.81, 4.33, 12.11 | 3 |
| Cyclical breathing rate with equivalent mean inhalation velocity (l min−1) | 7.5, 20.8, 50.3 | — |
| Orientation (°) | 0, 15, 30, 60, 90, 135, 180 | 7 |
| Particle aerodynamic diameter (µm) | 7, 22 52, 68, 82, 100, 116 | 7 |
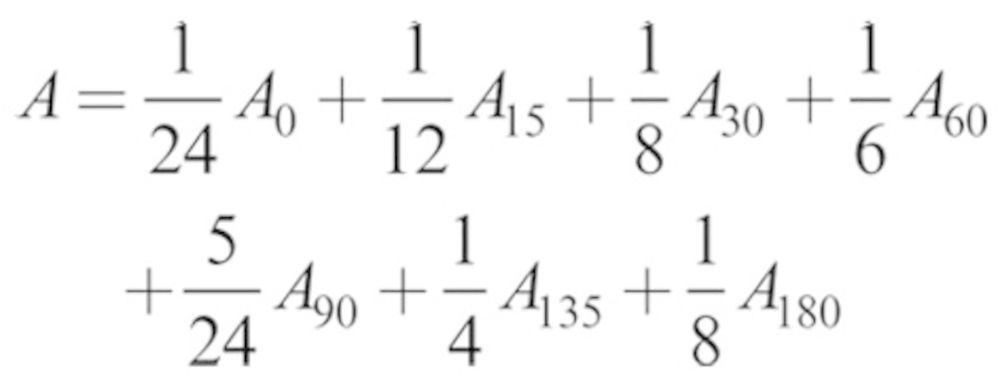
To investigate the influences of orientation on particle aspiration, simulations were performed at each set of velocity conditions with the humanoid oriented at discrete angles relative to the oncoming wind (0°, 15°, 30°, 60°, 90°, 135°, and 180°). Zero degree represents facing the wind, and 180° is back to the wind. Work by Kennedy and Hinds (2002) indicated that aspiration efficiencies were greater in the narrow range around 0°, so more discrete angles were applied near the forward-facing direction. Simulations were conducted for the individual orientations, and orientation-averaged calculations were made for each velocity condition and particle size simulated by weighting the seven individual estimates by the orientation’s average contribution to the full 360° rotation, namely:
 |
(3a) |
where the subscripts refer to the orientation relative to the oncoming wind and the weighting factor represents the proportion of the complete rotation that the study angle covers, similar to the work of Tsai et al. (1995). To examine the impact of including the back-to-the-wind simulations on the orientation-averaged aspiration efficiency, a ‘facing-forward’ estimate for aspiration was computed using only orientations through 90°, again weighted by the proportion, this time of only the 180° covered:
 |
(3b) |
Details for each of these simulation setup, solution verification, and data analysis follow.
Geometry and mesh
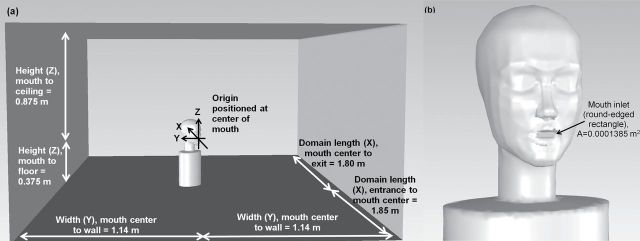
A humanoid geometry with realistic facial features (50th percentile female-US anthropometric dimensions) but simplified torso (elliptical, truncated at hip height) was used to represent the breathing human (Fig. 1). While truncation and torso simplification, relative to a complex human shape, was anticipated to identify differences in critical area positions compared to a more realistic human torso, early studies indicated that this simplification would have little effect on aspiration estimates (Anderson and Anthony, 2012). The humanoid geometry was the same as the small nose/small lip model from Anthony (2010). However, since the assumption of lateral symmetry was inappropriate at orientations other than facing-the- and back-to-the-wind orientations, midsagittal bisection was not used as the humanoid was rotated. Rather, both left and right sides of the humanoid were modeled in the full-width wind tunnel geometry.
Fig. 1.
Simulation geometry examples for (a) humanoid at 60° to oncoming wind in simulated wind tunnel and (b) humanoid at 15° to oncoming wind. Both images are oriented looking into the domain entrance, with freestream velocity directed into the page. In (a), the dark surface is the floor, the light gray rectangle in the center is the outflow of the domain, and the medium gray planes are the side and ceiling walls.
The mouth opening was positioned between lips as a round-edge rectangle (area = 0.0001385 m2). A simulated wind tunnel was constructed around the humanoid form with the center of the mouth opening positioned at the origin (0,0,0). The wind tunnel extended 0.875 m above and 0.375 m below the mouth center (Z), where a plane of symmetry was positioned at hip height. The simulated wind tunnel extended laterally (Y) from the mouth center to the walls by ±1.14 m and extended 1.85 m upstream and 1.80 m downstream (X) from the mouth center. These settings allowed sufficient distance upstream of the humanoid form for uniform velocity development and sufficient distance downstream to allow the assumption of no acceleration at the wind tunnel exit during simulations, with a blockage ratio of ~11%.
The seven discrete orientation geometries were made by rotating the humanoid form toward its left so that the center of the mouth was maintained at the origin (0,0,0), resulting in the right side (to the +Y) of the face projecting upstream (−X) as the form was rotated. At the facing-the-wind orientation, the bluff body centerline was located midsagittally at (0,0,0), but as rotation progressed through 90°, the bluff body centerline shifted in the +Y direction.
The volume within the simulated wind tunnel was then meshed using a paving algorithm (Design Modeler, Ansys, Inc.) using triangular surface and tetrahedral volume elements. Three mesh densities were generated for each test condition to solve and evaluate the quality of the solution (mesh independence) from subsequent fluid simulations. Mesh refinement ratios were on the order of 1.2 between sequentially refined meshes; where simulation convergence qualities between the three meshes were poor, an additional mesh density between the moderate and most-refined meshes were generated to assess convergence (mesh refinement ratio of 1.11). The most-refined meshes contained approximately 2.2 million nodes, at which the equations of fluid flow were solved. Data describing the mesh densities for the most-refined meshes in each geometry investigated are provided in supplementary data at Annals of Occupational Hygiene online.
Fluid simulations
Simulations were performed using Fluent software (V12.1 and 13.0, Ansys, Inc.). Boundary conditions for the simulation included setting uniform inlet velocities to both the wind tunnel and the mouth entrance surfaces as per values in Table 1. Outflow was assigned to the wind tunnel exit, assigning zero acceleration through the surface but computing velocities across the surface to assure continuity. The floor of the wind tunnel was assigned as a plane of symmetry, allowing flow across but not through the surface. All other surfaces were assigned the no-slip condition (‘wall’). Fluid flow simulations used standard k-epsilon turbulent models with standard wall functions, using pressure-based solvers (SIMPLE algorithm). Discretization methods used least squares cell-based gradient discretization and second-order pressure, momentum (upwind), and turbulence (upwind). Initial conditions assigned to the unknown nodes within the computational domain were assigned streamwise velocities equivalent to the inlet freestream under investigation and 8% turbulent intensities and viscosity ratios of 10.
Simulations were conducted to extract and examine solutions when global tolerances reached 10–3, 10–4, and 10–5. Within a given simulation setup (orientation, freestream velocity, and inhalation velocity), three-mesh error norms (R 2, Stern et al., 2001) at each of the tolerance limits were computed for each degree of freedom using 3200 data positions, which ranged in heights from 0.3 m below to 0.6 m above, laterally from ±0.75 m, and 0.75 m upstream to just in front of the mouth opening (Table 2).
Table 2.
Extraction positions for model verification for 0° orientation. Bold and italicized (X,Y) coordinates were translated with the rotating humanoid form to provide solution data at the same relative positions to the inhaling mouth.
| X (m) | Y (m) | Z (m) |
|---|---|---|
| −0.015 | −0.75 | −0.3 |
| −0.02 | −0.5 | −0.25 |
| −0.025 | −0.25 | −0.2 |
| −0.03 | −0.15 | −0.15 |
| −0.05 | −0.125 | −0.1 |
| −0.1 | −0.1 | −0.05 |
| −0.25 | −0.075 | 0 |
| −0.5 | −0.05 | 0.05 |
| −0.75 | −0.025 | 0.1 |
| 0 | 0.15 | |
| 0.025 | 0.2 | |
| 0.05 | 0.25 | |
| 0.075 | 0.3 | |
| 0.1 | 0.35 | |
| 0.125 | 0.4 | |
| 0.15 | 0.45 | |
| 0.25 | 0.5 | |
| 0.5 | 0.55 | |
| 0.75 | 0.6 |
Model verification included examination of both nonlinear iteration and mesh convergence. Mesh convergence was indicated when local R 2 was less than unity for all degrees of freedom (Stern et al., 2001). To examine the adequacy of the linear solver, within-mesh L2 error norms were computed to provide an indication of the change in value estimates between successively reduced global tolerances (Roache, 1998). A target of <5% change was established a priori. Once the global solution tolerance was determined sufficiently low (<5% change in estimated values) and mesh independence was assured (regional R 2 < 1), particle simulations were performed. While velocity measurement data in wind tunnels matching our test conditions are limited, qualitative validation was performed using streamline images from experiments conducted by Schmees et al. (2008).
Particle simulations
In wind tunnel studies, aspiration efficiency calculations require the assumption of uniform particle concentrations. For computational fluid dynamics CFD simulations, equation (2) requires the same assumption. To maintain the assumption of uniform upstream concentration, particles were injected into the solved flow field with velocities equivalent to the terminal settling velocity of the particle under investigation along with the freestream velocity in the simulated wind tunnel at that release position, with the terminal settling velocity computed from Vts = ρpd2g/(18µ), where ρp is particle density (1000kg m−3), g is gravitational acceleration (9.81 m s−2), and µ is the air viscosity (1.81e−5 N s m−2). Particle simulations were conducted to locate the upstream critical area (Acritical) that contained particles that terminate within the mouth. Particles of unit density (1000kg m−3) for 7, 22, 52, 68, 82, and 116 µm diameters were simulated, to match the size of previously published aspiration data (Kennedy and Hinds, 2002), with the addition of the 100 µm diameter to provide additional information on a maximum inhaled particle size. Spherical drag law and length scale of 5E-5 m were used; a trapezoidal high-order scheme with implicit low-order scheme was used to set up the numeric. The accuracy tolerance was 1E-6 (maximum refinement of 20) to model the particle trajectories. Sensitivity of the solutions to these parameters was assessed to determine when solutions did not change as a function of refining the parameters to subsequently smaller values. All surfaces on the humanoid form were modeled to terminate the trajectory computation for any particle that contacted the head: hence, these simulations ignored any secondary aspiration that may occur from particles that impacted the face, bounced, and then were subsequently inhaled into the humanoid mouth.
Simulations of laminar particle trajectories were conducted over a grid of upstream positions in order to define these upstream critical areas. Particles 68 µm and smaller were injected 0.75 m upstream of the mouth opening, but since gravitational settling was more significant with larger particles in low wind speeds, particles 82 µm and larger required injections at closer upstream distances (0.4 m). At the lowest freestream studied (0.1 m s−1) for 110 and 116 µm particles, injections were required at 0.2 m upstream in order to identify trajectories that entered into the inhaling mouth. At these closer distances, the vertical release positions for inhaled particles were above the head; hence in regions not influenced by the presence of the bluff body or inhalation, velocities at these positions differed from the mean freestream by less than 1%. For a given simulation, particles of a given aerodynamic diameter were released upstream of the inhaling humanoid, with vertical line releases (ΔZ) stepped through fixed lateral positions (ΔY) to locate positions associated with the critical area. For each line release, the number of particles terminated in the mouth was counted.
Aspiration efficiency calculations
The size of the critical area was determined by the following:
 |
(4) |
where ΔY is the distance between successive lateral release positions (0.0005 m), ΔZ is the spacing between particles release (100 particles across 0.01 m = 0.0001 m), and Ntrapped is the number of particles terminating within the mouth across the 0.01 m vertical distance release. Releases stepped through Y and Z positions that were sufficiently large to ensure no additional particles would enter the inhaling mouth, confirmed through both presimulation determination of critical area with coarse particle release and examination of postsimulation results to ensure at least 0.005 m of distances beyond the identified critical areas were examined. Once the critical areas were determined, the aspiration efficiencies were computed from equation (2).
The uncertainty associated with the particle release distances selected above was assessed. Additional particles that were within one ΔZ beyond the known inhaled particle might have been inhaled, so the maximum critical area was computed by assuming one additional particle at the top (+Z) and bottom (−Z) of the critical area could have been inhaled. These areas were at most 1% larger than the critical area computed from the observed aspirated particle. The mean of observed critical area and the critical area of one more particle (above and below) entering the mouth were reported as the aspiration efficiency, yielding an uncertainty in aspiration efficiency fraction estimates of ±0.005.
The shapes of these critical areas were examined by plotting the edges of the critical areas. The plots allow visualization of inhaled particle trajectories and examination of how the humanoid head’s facial features affect particle inhalation as the humanoid form was rotated away from facing the wind.
From orientation-specific aspiration estimates, the orientation-averaged aspiration was computed for each test condition using equation (3a and 3b). Comparisons were made between facing the wind, orientation averaged through ±90° (3b), and the fully rotated 360° orientation-averaged (3a) aspiration efficiencies. Resulting aspiration estimates were examined graphically and compared to previously published data of Kennedy and Hinds (2002) and Sleeth and Vincent (2009).
Mean orientation-averaged aspiration efficiencies, by freestream velocity and by mouth-breathing velocity, were computed, as was an overall aspiration efficiency for the range of freestream velocities and inhalation velocities studied here.
RESULTS AND DISCUSSION
Fluid simulations
Fluid flow estimates were generated for eight velocity conditions and seven orientations, for a total of 56 unique fluid flow models. For each of these models, a series of at least three sequentially refined meshes were generated (168 simulations). For each of these simulations, three sets of fluid solutions were generated (at global tolerances of 10–3, 10–4, and 10–5). Simulations were performed on 64-bit Windows 7 machines with 12-GB Ram and quad-core (single and dual) processors to maximize speed and computational storage during simulations. Approximately 10–12 days of simulation were required to obtain the full set of solutions for each velocity orientation under study.
Evaluation of the nonlinear convergence and mesh independence was performed (complete details in supplementary data at Annals of Occupational Hygiene online). Local L2 error norms were sufficiently below the a priori 5% level for all test conditions up to 90° orientation, indicating that estimates of velocity, pressure, and turbulence parameters were changing less than 5% with subsequently lower global solution error tolerances. However, at 90° and through 135° and 180°, velocities (particularly vertical but also lateral) were changing by more than 5% between global solution error tolerance levels of 1E-4 and 1E-5, even for the most-refined mesh. Supplementary data at Annals of Occupational Hygiene online detail the results of convergence testing. The R2 error norms, using estimates from the same positions, were below unity in most of the simulations, with exceedences identifying larger freestream velocities for vertical velocity R2 through 90° and lateral and/or dissipation of turbulence kinetic energy exceeding unity beyond 90° for unity at 0.4 m s−1 freestream velocities. While this indicates mesh independence was not assured numerically, plotting of estimates identified reasonable agreement between meshes, with estimates at one or two positions in each case not in agreement, as illustrative graphs shown in supplementary data at Annals of Occupational Hygiene online demonstrate. Finally, the y+ values on the surface of the humanoid form in the most-refined mesh were in the range of 5, sufficiently below the desirable range of 11–30, indicating possible improvements in the fluid solutions by using scalable wall functions in future simulations.
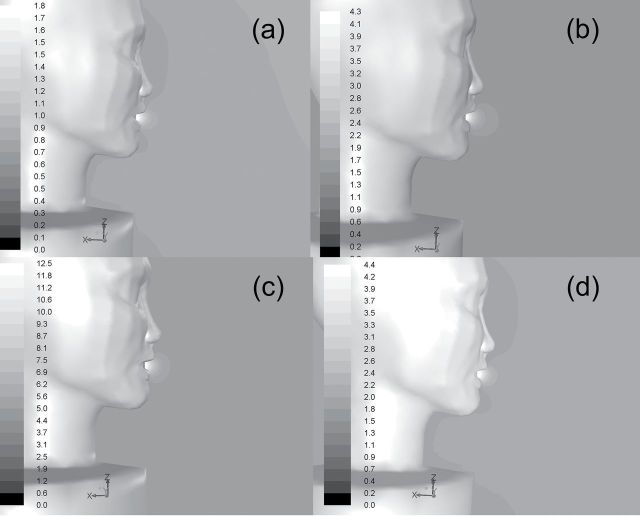
Although field-measured velocity data to validate these simulations over all orientations and breathing conditions are limited, comparisons to wind tunnel studies of breathing mannequins were made. Figure 2 contains flow visualization image for an unheated mannequin facing the wind, provided by D.K. Sleeth (described by Schmees et al., 2008), with an overlay of the simulated mannequin and resulting streamlines in the same central plane. The general velocity fields appear similar, with deviations associated with the simplified torso projecting further upstream compared to the mannequin’s upper chest. To examine the effect of velocity field differences attributed to changes in the suction velocity at the mouth, Fig. 3 is provided (0° orientation). While the velocity magnitude in front of the inhaling mouth changes by suction velocity setting, the size of the volume in which suction affects the upstream flow field is limited to at most twice the distance from mouth opening to the nose tip.
Fig. 2.
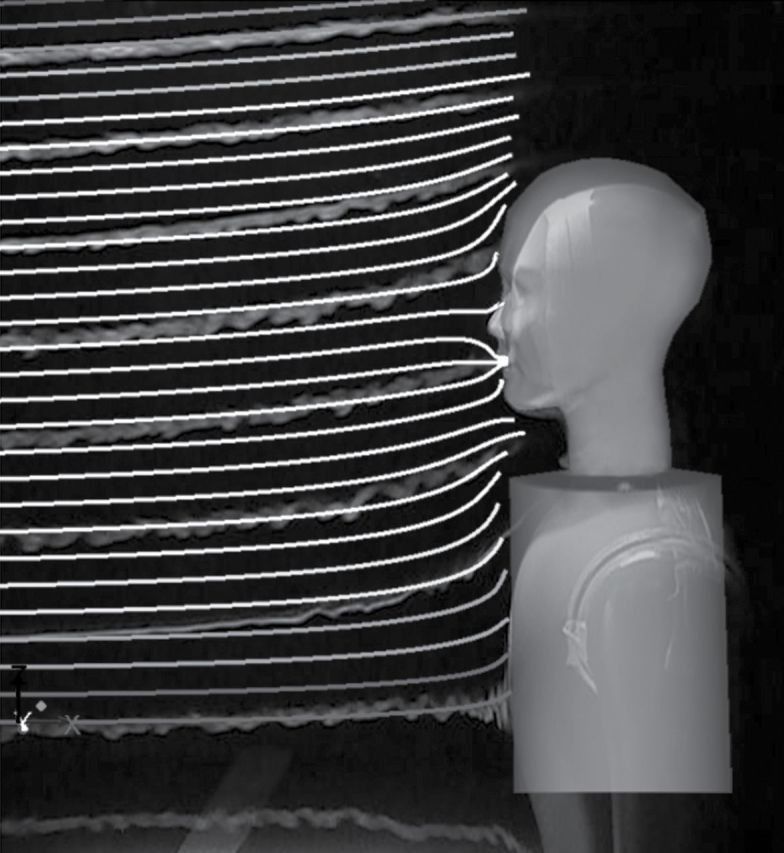
Comparison of simulated velocity profiles from simulations (0.2 m s−1 freestream, 4.33 m s−1 suction velocity) to flow visualization provided by D.K. Sleeth (0.24 m s−1 freestream, 20 l min−1 breathing).
Fig. 3.
Velocity contours near the inhaling mouth for 0.2 m s−1 freestream with (a) 1.81 m s−1, (b) 4.33 m s−1, and (c) 12.11 m s−1 suction velocities and (d) 0.4 m s−1 freestream with 4.33 m s−1 suction velocities. Legends indicate velocity in meter per second.
Particle simulations and critical areas
Particle simulations were performed using the solution provided from simulations with the most-refined mesh in the three-mesh series and with global solution tolerances of 1E-5. To complete the matrix of all velocities (8 combinations), orientations (7), and particle sizes (7), a total of 448 series of simulations were completed to determine critical areas necessary to compute aspiration efficiencies. The process was automated by generating readable journal files to step the simulations through ΔY and ΔZ positions and output transcript files from which to extract the position coordinates and number of particles terminating in the mouth. Simulations took approximately 4–8h for a given particle size in a given simulation condition, with longer times necessary for the heavy breathing, as critical areas were larger for these conditions.
To illustrate particle motion toward the inhaling humanoid, Figs 4–6 provide representative particle trajectories for the 0.4 m s−1 freestream velocity, moderate breathing simulations. (Supplementary data at Annals of Occupational Hygiene online contain video loops of additional conditions.) In each image in this series, the lines signify the path of particles, released upstream within a fixed lateral (Y) position with spacing of 0.01 m between particles. These illustrations are coarser than were used to generate critical area data, but illustrate how particles travel around the head and torso. Particles that terminated in the mouth opening indicate inhaled particle from within the upstream critical area. At 15° orientation (Fig. 4), all images were from releases at Y = 0.01 m (1cm to the right of the mouth center). To illustrate both how particles travel from within the upstream critical area as well as how particles move around the humanoid head, particle injections for 7 µm particles extended from heights (Z) of 0.15 to −0.15 m, but, as particle size increased, injections were released from higher positions, such as z = 0.35–0.15 m for 100 µm particles. For the smallest particles illustrated here, the particles released at positions 11–14 (1 = top), terminated in the mouth of the humanoid form. Particles starting at positions higher than this location traveled over or around the head and continued out of the computational domain; particles injected from lower locations travelled around the neck prior to leaving the computational domain. These figures illustrate that as particle size increases, the injection points upstream of the humanoid form were moved to higher locations as gravitational settling of particles became significant in particle trajectories when moving through slow-moving air.
Fig. 4.
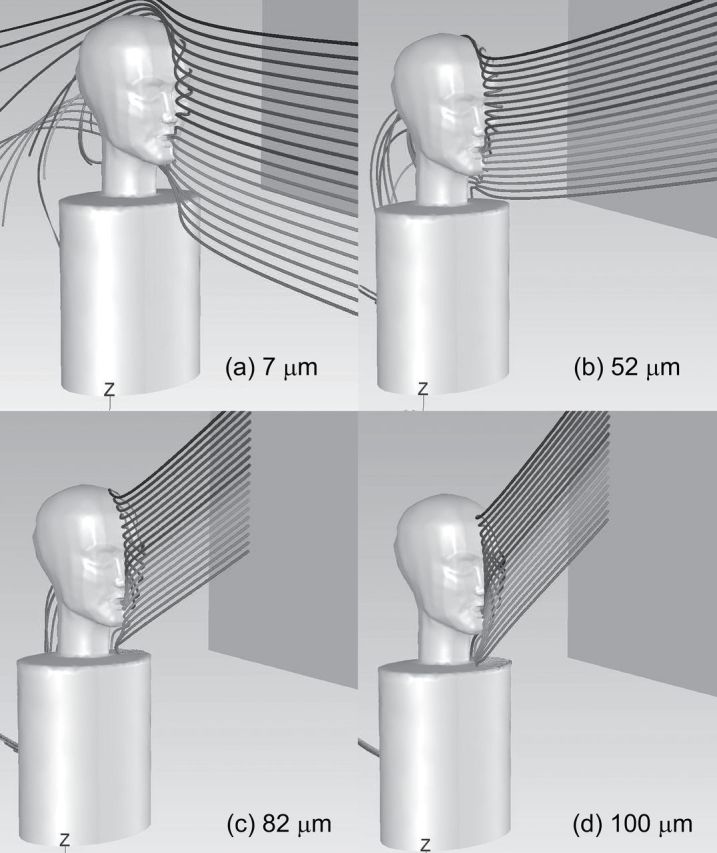
Example particle trajectories for 0.4 m s−1 freestream velocity and moderate inhalation simulations at 15° orientation. Each image shows 20 particles released upstream at 0.01 m to the right of the mouth center (Y), with the top particle 0.02 m higher than the bottom one.
Fig. 6.
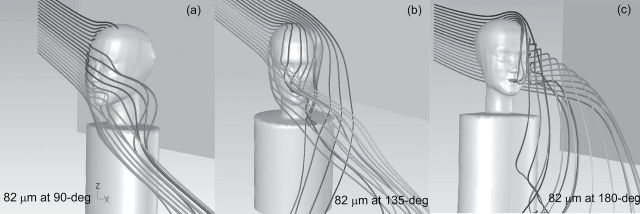
Example particle trajectories for 0.4 m s−1 freestream velocity and moderate inhalation simulations for 82 µm particles at orientations (a) 90°, (b) 135°, and (c) 180° relative to the oncoming wind. Each image shows 20 particles released upstream with the top particle 0.02 m higher than the bottom one.
Figure 5 illustrates particle trajectories for 7 µm particles as the humanoid form was rotated. At 90°, particles traveled from upstream with a slight vertical increase, associated with the upward velocity of air as it approaches the bluff body. Inhaled particles were injected near the centerline of the bluff body, traveled toward the humanoid form, and turned laterally to move around the form. Those that were transported sufficiently close to the suction of the inhaling mouth were aspirated. In this image, particles injected at positions 11–14 were inhaled into the mouth and are included in the critical area. As the humanoid rotated beyond 90° (Fig. 5b), inhaled particles traveled above the top of the head and were captured in the wake of the form (positions 3–5) as well as those that were positioned lower and traveled around the side of the bluff body into the mouth where suction was sufficient to capture particles. With the back to the wind (180°) (Fig. 5c), the small inhaled particles that were those that travel across the top of the head (positions 8–10).
Fig. 5.
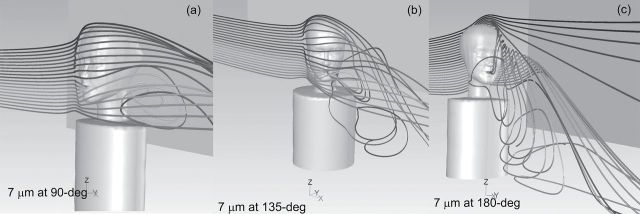
Example particle trajectories for 0.4 m s−1 freestream velocity and moderate inhalation simulations for 7 µm particles at orientations (a) 90°, (b) 135°, and (c) 180° relative to the oncoming wind. Each image shows 20 particles released upstream with the top particle 0.02 m higher than the bottom one.
Figure 6 illustrates trajectories of larger, 82 µm particles for the same conditions. The same trends as in the smaller particles were seen—particles traveling in front of the mouth were aspirated at 90°, but for rear-facing orientations, only particles that traveled over the top of the head were aspirated. However, note that the ability of suction to draw larger, more downwardly travelling particles was more difficult for the 90° orientation compared to smaller particles. As these larger particles passed in front of the mouth, suction velocity became more critical to ‘capture’ particles moving in front of the mouth.
Once regions of aspirated particles were identified, particle simulations were completed for all velocity, orientations, and particles sizes identified previously. Figure 7 illustrates the shape and positions of critical areas for select particle sizes and freestream-inhalation velocities. The critical areas for 7 µm particles for 0.4 m/s freestream and moderate breathing, with orientations facing the wind (0°) through 90°, are illustrated in Fig. 7. The symmetrical oval shape reported in previous facing-the-wind studies is shown in the 0° orientation, with the notch at the top that corresponds to the reduction in the critical area associated with particles depositing on the nose and upper lip. The symmetrical shape indicates that particles travel into the mouth equally from the left and right side of the face. As the humanoid form rotates toward its left through 90°, shape of the critical area loses symmetry as the area shifts to the form’s right (+Y) as the bluff body’s centerline also shifts to the right during these rotations. Figure 7 illustrates critical areas for the same conditions with larger particles (82 µm), where the critical areas are shifted upward due to gravitational settling, and are more narrow, which indicate the lessened ability of these particles to turn into the mouth from the suction source as the humanoid form approaches 90°. In this figure, the critical areas for 135° and 180° are included: 82 µm particles entered the mouth by passing over the top of the head, only, with symmetric results for the back-to-the-wind condition, but particles passing over the left side of the face when traveling to the mouth at 135°. For other particle sizes, the resulting critical areas for the 135° orientation result in two subareas that travel into the inhaling mouth—one from the particles travelling over the top of the head on the left and a second from those passing around the right side of the head into the mouth.
Fig. 7.
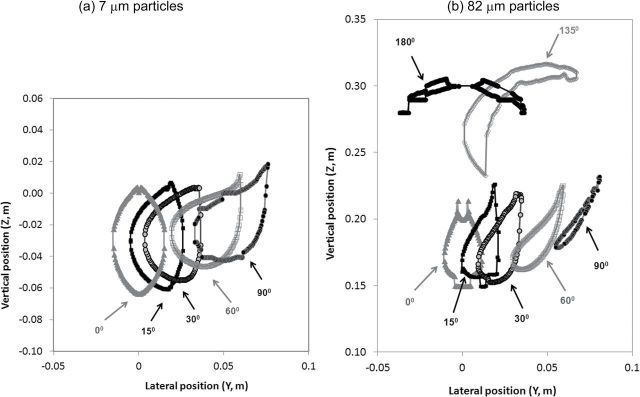
Upstream critical areas, within which all particles in the freestream will be inhaled, for (a) 7 µm and (b) 82 µm aerodynamic diameter particles injected into the freestream of 0.4 m s−1 with mouth inhalation velocity equivalent to moderate breathing (4.33 m s−1).
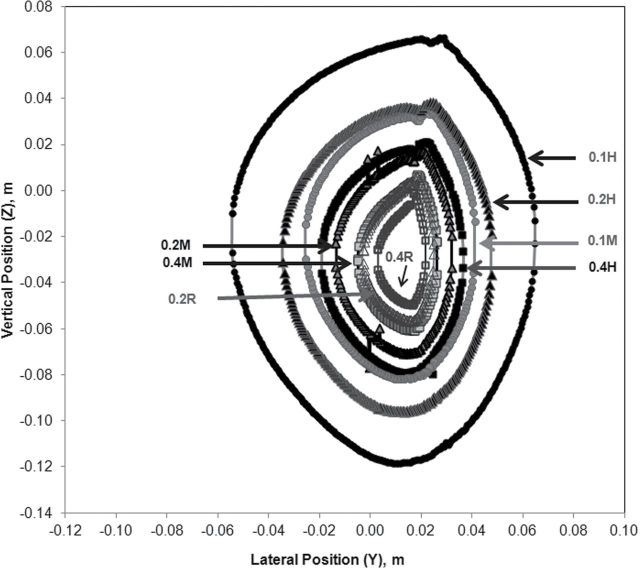
Figure 8 illustrates how the critical area changes with freestream and breathing velocity conditions studied, using the 15° orientation and 7 µm particles. Critical areas of these particles are plotted for each of the eight velocity conditions studied, with round data markers indicating the slowest freestream (0.1 m s−1) and the square indicating the fastest freestream (0.4 m s−1) in this study. Solid data markers are assigned to data from heavy breathing (12.81 m s−1) inhalation velocities, gray markers for moderate breathing (4.33 m s−1), and unfilled markers for at-rest breathing (1.81 m s−1) inhalation. The size of the critical area decreases with both (i) increased freestream velocity and (ii) decreased inhalation velocity. For the 7 µm particles, computed aspiration efficiencies approximated unity, as the majority of these particles traveled with the freestream and were little affected by gravity. Hence, with aspiration efficiency directly proportional to the freestream velocity but inversely proportional to the velocity at the mouth, the size ranking of increased area with increased velocity into the mouth and increased area with decreasing freestream were as anticipated, given the relationship between mouth velocity and critical area in equation (2).
Fig. 8.
Critical areas for 7 µm particles at 15° orientation, by velocity conditions of simulation. The number corresponds to the freestream velocity, in meter per second, and the letter indicates the inhalation velocity at the mouth (R = at-rest at 1.81 m s−1, M = moderate at 4.33 m s−1, and H = heavy at 12.11 m s−1).
Aspiration efficiencies
Table 3 presents aspiration efficiencies, as fractions, for each condition examined in this study. As anticipated, aspiration efficiency decreased with increasing particle size, over all orientations, freestream velocities, and inhalation velocities. For at-rest breathing simulations, no particles 100 µm or larger traveled into the mouth of the simulated human, regardless of freestream velocity or orientation. For moderate breathing simulations, particles with aerodynamic diameters of 100 µm were aspirated, but at fractions well below the 0.5 recommended by the American Conference of Governmental Industrial Hygienists (ACGIH) inhalable particulate mass (IPM) curve (ACGIH, 2012). For the largest particle size examined (116 µm), aspiration efficiency fractions for moderate breathing rate were less than 0.01 for all freestream velocities and orientations. Aspiration of large particles was not significant unless breathing rates were in the range of 12.11 m s−1, a value associated with the mean inhalation velocity of ‘heavy’ breathing. In these conditions, aspiration exceeded the 0.5 IPM criterion across all orientations for particles up through 82 µm and for many orientations through 100 µm. For the 116 µm particles, aspiration even for the heavy breathing reduced below the 0.5 IPM limit, providing additional indication that the human head has an upper limit for particle aspiration, when considering mean particle trajectories.
Table 3.
Aspiration efficiency fraction, by velocity, orientation, and particle size.
| Velocity conditions | Particle size (µm) | Orientation relative to oncoming wind (0 = facing the wind) | |||||||
|---|---|---|---|---|---|---|---|---|---|
| 0 | 15 | 30 | 60 | 90 | 135 | 180 | Averaged | ||
| 0.1 m s−1, moderate breathing | 7 | 1.003 | 0.994 | 0.992 | 0.989 | 0.992 | 0.942 | 0.627 | 0.93 |
| 22 | 0.998 | 0.988 | 0.983 | 0.970 | 0.983 | 0.799 | 0.785 | 0.91 | |
| 52 | 0.923 | 0.909 | 0.895 | 0.830 | 0.894 | 0.643 | 0.843 | 0.82 | |
| 68 | 0.842 | 0.823 | 0.797 | 0.736 | 0.797 | 0.637 | 0.757 | 0.75 | |
| 82 | 0.735 | 0.705 | 0.673 | 0.595 | 0.673 | 0.574 | 0.624 | 0.63 | |
| 100 | 0.112 | 0.117 | 0.105 | 0.139 | 0.105 | 0.343 | 0.102 | 0.17 | |
| 116 | 0.00 | 0.00 | 0.00 | 0.00 | 0.00 | 0.00 | 0.00 | 0.00 | |
| 0.1 m s−1, heavy breathing | 7 | 1.000 | 0.996 | 0.995 | 0.993 | 0.999 | 0.938 | 0.839 | 0.96 |
| 22 | 0.999 | 0.993 | 0.988 | 0.983 | 0.945 | 0.786 | 0.854 | 0.91 | |
| 52 | 0.947 | 0.945 | 0.938 | 0.895 | 0.821 | 0.766 | 0.614 | 0.82 | |
| 68 | 0.900 | 0.894 | 0.887 | 0.838 | 0.733 | 0.756 | 0.622 | 0.78 | |
| 82 | 0.825 | 0.823 | 0.783 | 0.761 | 0.650 | 0.699 | 0.697 | 0.73 | |
| 100 | 0.685 | 0.678 | 0.655 | 0.652 | 0.434 | 0.510 | 0.556 | 0.56 | |
| 116 | 0.267 | 0.275 | 0.291 | 0.319 | 0.097 | 0.409 | 0.329 | 0.29 | |
| 0.2 m s−1, at-rest breathing | 7 | 1.018 | 0.992 | 0.992 | 0.988 | 0.946 | 0.675 | 0.897 | 0.89 |
| 22 | 1.004 | 0.988 | 0.976 | 0.948 | 0.866 | 0.720 | 0.835 | 0.87 | |
| 52 | 0.892 | 0.842 | 0.816 | 0.671 | 0.387 | 0.409 | 0.752 | 0.60 | |
| 68 | 0.659 | 0.635 | 0.650 | 0.496 | 0.272 | 0.390 | 0.425 | 0.45 | |
| 82 | 0.257 | 0.202 | 0.258 | 0.283 | 0.106 | 0.276 | 0.038 | 0.20 | |
| 100 | 0.00 | 0.00 | 0.00 | 0.00 | 0.00 | 0.00 | 0.00 | 0.00 | |
| 116 | 0.00 | 0.00 | 0.00 | 0.00 | 0.00 | 0.00 | 0.00 | 0.00 | |
| 0.2 m s−1, moderate breathing | 7 | 1.009 | 0.999 | 0.993 | 0.990 | 0.972 | 0.759 | 0.879 | 0.92 |
| 22 | 1.006 | 0.989 | 0.983 | 0.965 | 0.905 | 0.854 | 0.749 | 0.90 | |
| 52 | 0.936 | 0.909 | 0.872 | 0.785 | 0.679 | 0.452 | 0.841 | 0.71 | |
| 68 | 0.860 | 0.819 | 0.771 | 0.653 | 0.531 | 0.421 | 0.750 | 0.62 | |
| 82 | 0.681 | 0.681 | 0.645 | 0.528 | 0.405 | 0.422 | 0.493 | 0.51 | |
| 100 | 0.152 | 0.133 | 0.137 | 0.211 | 0.179 | 0.287 | 0.072 | 0.19 | |
| 116 | 0.000 | 0.000 | 0.003 | 0.007 | 0.000 | 0.002 | 0.000 | 0.00 | |
| 0.2 m s−1, heavy breathing | 7 | 0.998 | 0.999 | 0.994 | 0.992 | 0.948 | 0.822 | 0.827 | 0.92 |
| 22 | 0.995 | 0.994 | 0.990 | 0.981 | 0.895 | 0.918 | 0.792 | 0.93 | |
| 52 | 0.940 | 0.946 | 0.938 | 0.893 | 0.669 | 0.681 | 0.643 | 0.77 | |
| 68 | 0.887 | 0.896 | 0.876 | 0.812 | 0.507 | 0.602 | 0.752 | 0.71 | |
| 82 | 0.819 | 0.829 | 0.805 | 0.727 | 0.378 | 0.571 | 0.734 | 0.64 | |
| 100 | 0.510 | 0.576 | 0.602 | 0.563 | 0.222 | 0.478 | 0.531 | 0.47 | |
| 116 | 0.281 | 0.286 | 0.302 | 0.326 | 0.097 | 0.365 | 0.231 | 0.27 | |
| 0.4 m s−1, at-rest breathing | 7 | 1.021 | 0.995 | 0.990 | 0.995 | 0.933 | 0.543 | 0.822 | 0.85 |
| 22 | 1.012 | 0.994 | 0.967 | 0.917 | 0.822 | 0.516 | 0.994 | 0.82 | |
| 52 | 0.883 | 0.868 | 0.811 | 0.572 | 0.335 | 0.309 | 0.617 | 0.53 | |
| 68 | 0.663 | 0.660 | 0.694 | 0.374 | 0.036 | 0.331 | 0.098 | 0.33 | |
| 82 | 0.356 | 0.349 | 0.347 | 0.195 | 0.000 | 0.209 | 0.011 | 0.17 | |
| 100 | 0.00 | 0.00 | 0.00 | 0.00 | 0.00 | 0.00 | 0.00 | 0.00 | |
| 116 | 0.00 | 0.00 | 0.00 | 0.00 | 0.00 | 0.00 | 0.00 | 0.00 | |
| 0.4 m s−1, moderate breathing | 7 | 1.020 | 0.993 | 0.993 | 0.991 | 0.982 | 0.914 | 0.860 | 0.96 |
| 22 | 1.000 | 0.990 | 0.980 | 0.948 | 0.878 | 0.893 | 0.795 | 0.91 | |
| 52 | 0.913 | 0.884 | 0.842 | 0.684 | 0.522 | 0.582 | 0.788 | 0.68 | |
| 68 | 0.787 | 0.786 | 0.745 | 0.535 | 0.282 | 0.437 | 0.308 | 0.49 | |
| 82 | 0.560 | 0.562 | 0.640 | 0.409 | 0.274 | 0.318 | 0.223 | 0.38 | |
| 100 | 0.156 | 0.229 | 0.224 | 0.213 | 0.000 | 0.267 | 0.011 | 0.16 | |
| 116 | 0.00 | 0.00 | 0.02 | 0.00 | 0.00 | 0.00 | 0.00 | 0.00 | |
| 0.4 m s−1, heavy breathing | 7 | 1.008 | 0.996 | 1.010 | 0.992 | 0.948 | 0.914 | 0.834 | 0.95 |
| 22 | 1.002 | 0.988 | 0.983 | 0.965 | 0.895 | 0.893 | 0.440 | 0.87 | |
| 52 | 0.920 | 0.910 | 0.872 | 0.779 | 0.669 | 0.582 | 0.617 | 0.72 | |
| 68 | 0.815 | 0.829 | 0.789 | 0.666 | 0.507 | 0.437 | 0.623 | 0.61 | |
| 82 | 0.663 | 0.697 | 0.711 | 0.571 | 0.378 | 0.318 | 0.542 | 0.50 | |
| 100 | 0.462 | 0.458 | 0.542 | 0.443 | 0.222 | 0.267 | 0.299 | 0.35 | |
| 116 | 0.336 | 0.308 | 0.311 | 0.316 | 0.097 | 0.216 | 0.084 | 0.22 | |
Aspiration efficiency estimates compared with previous forward-facing estimates (Anthony, 2010), which used different software for geometry and mesh generation and fluid simulations. For matched conditions of freestream and breathing, aspiration efficiency fraction estimate differences averaged 0.004, with estimates for 22 µm particles in this study increasing to nearly 1.00, indicating this work’s smaller spacing between particle releases improved the estimates of critical area.
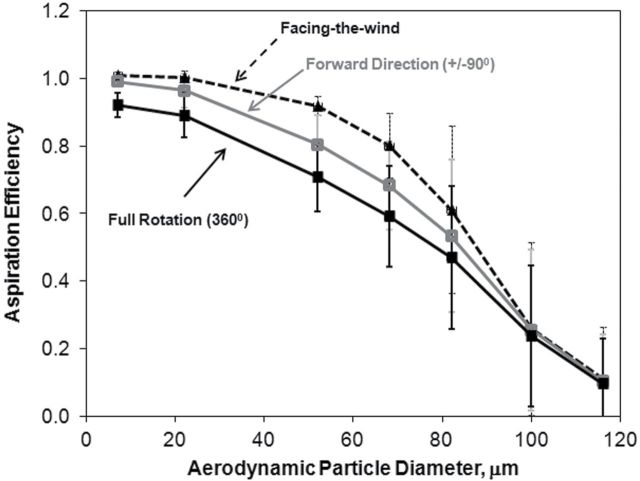
Figure 9 illustrates the mean aspiration efficiency over all test conditions, with error bars reflecting ±1 SD, with all conditions having equal weighting. Error bars were small for small particles, as aspiration fractions were nearly similar when gravitational settling of particles had little influence on particle trajectories. As particle size increased, variability in aspiration estimates increased as freestream velocity and breathing rate play a larger role in particle motion and the determination of whether particles can both pass by the bluff body and the head/facial features to be successfully inhaled into the humanoid mouth.
Fig. 9.
Mean aspiration efficiency (fraction) over all simulation conditions.
As has been postulated, aspiration efficiency was at a maximum in the forward-facing direction. With rotation away from the wind, aspiration efficiency decreased below this maximum as particle size increased, as it becomes more difficult for larger particles to travel around the head and terminate in the inhaling mouth. For the larger sizes in the inhalable range, the average aspiration efficiency estimate was similar between orientations. If only considering orientations of the humanoid head within ±90° of the oncoming wind, aspiration was larger than in the case if the humanoid rotates through the full 360°, confirming decreased aspiration in the backward-facing orientations.
Comparison to experimental data and IPM curve
Aspiration estimates were compared to published data in the literature. Sleeth and Vincent (2011) examined orientation-averaged inhalability for a mouth-breathing full-scale but truncated mannequin (background torso in Fig. 2) at 0.1, 0.24, and 0.42 m s−1 freestream velocities in a wind tunnel (1.22×1.22 m cross section, 6 m test length). Their work investigated cyclical breathing with minute volumes of 6 and 20 l, comparable to the at-rest and moderate continuous inhalation velocities simulated here. Figure 10 provides mean aspiration estimates by freestream velocity from simulations (solid lines) and experimental data from their wind tunnel studies (dashed lines). Since only one set of simulation conditions were available for the simulation plots, no error bars are available for the simulation data; error bars on Sleeth and Vincent represent the standard error provided in their Table 1. Figure 10a illustrates the at-rest breathing (two matched conditions): general agreement between the simulated and measured aspiration efficiency is indicated. Figure 10b illustrates the more physiologically relevant moderate mouth-breathing aspirations (three matched conditions): the mean estimates of aspiration efficiency for the simulations were larger than those of wind tunnel experiments, with the exception of the largest particle (89.5 µm), where the mean experimental value exceeded the simulated estimate. While the actual values of freestream and breathing velocities differed between studies, the trends identified by Sleeth and Vincent were consistent with our simulations: aspiration efficiency for slow-moving air increased with decreasing freestream velocity. Differences between the simulation and wind tunnel may be attributable to differences in breathing pattern: if so, it appears that the continuous inhalation may result in overestimation of orientation-averaged aspiration efficiency compared to the more realistic cyclical breathing. When exhalation is incorporated into the breathing cycle, Schmees et al. (2008) demonstrated that exhalation disturbs the flow field upstream of the facing-the-wind mannequin significantly for the both minute volume rates at 0.1 m s−1 freestream velocity and for the 20 l min−1 minute breathing rate at 0.24 m/s freestream velocity.
Fig. 10.
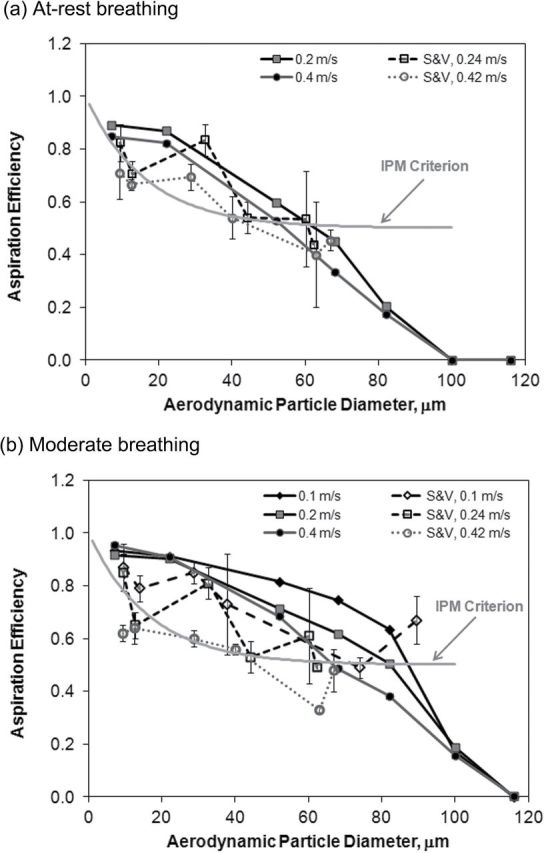
Freestream-averaged aspiration efficiency estimates for mouth breathing from simulations (solid lines and filled markers) and from Sleeth and Vincent (2011) experimental studies (dashed lines and open markers) for what we describe in this paper as (a) at-rest breathing and (b) moderate breathing. The solid gray line without data markers is the current ACGIH IPM curve.
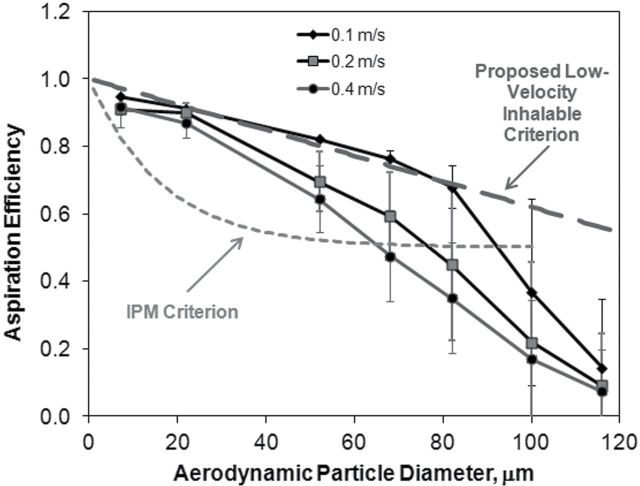
Figure 11 presents the simulated aspiration efficiency results, averaged by freestream velocities of 0.1, 0.2, and 0.4 m s−1, compared to the current ACGIH IPM criterion and the proposed low-velocity aspiration from Aitken et al. (1999). Orientation-averaged aspiration efficiencies from computational fluid dynamic simulations were estimated to be larger than the IPM criterion for particles smaller than 62 µm for all velocity conditions, but aspiration was below the IPM criterion for particles larger than 82 µm. The proposed low-velocity inhalable criterion, originally recommended by Aitken et al. (1999) and supported by wind tunnel studies of Sleeth and Vincent (2011), was established for 0.2 m s−1 freestream velocities with mannequin studies inhaling at 20 l min−1. Our simulation data at 0.1 m s−1 (examined at continuous inhalation mathematically equivalent to the mean inhalation velocities for 20.8 and 50.3 l min−1) had good agreement with this proposed curve up through 100 µm.
Fig. 11.
Aspiration efficiency from simulations (solid lines) compared to current IPM criterion and proposed low-velocity inhalable criterion (I = 1 − 0.0038d ae) from Aitken et al. (1999) (dashed lines).
Limitations
Although this study expanded the scope of CFD simulations to the understanding of large-particle inhalability in slow-moving air, there are still limitations associated with the simplifications of the model necessary to solve the three-dimensional models within a reasonable time frame. First, we acknowledge that the cyclical breathing simplification ignores the effect of exhaled air on particle transport into the human mouth, particularly by affecting the airflow patterns upstream and above the breathing head. Schmees et al. (2008) clearly indicate that the upstream airflow pattern is perturbed during inhalation following exhalation, and if large particles travel through this space to become inhaled, the airflow and subsequent particle transport patterns through this space would differ from the constant inhalation patterns modeled here. Marr et al. (2005) identified significant increases in turbulence intensity in the exhalation region, which is not captured in the simplified model presented here.
Second, the solution of steady-state fluid flow fields at discrete orientations relative to the oncoming wind simplifies the real world, where workers’ random motion prevails throughout the course of a shift. However, by examining airflow and particle transport through discrete phases of inhalation and rotation, we can evaluate the relative contribution of these individual factors in the overall contribution of real-world phenomenon of particle aspiration (e.g., temporal variation during breathing, motion). For example, this work confirmed that the forward-facing orientation overestimates orientation-averaged aspiration and that backward-facing orientations (90°–180°) reduce inhaled particle exposures via mouth breathing across the entire range of inhalable particles.
Computational concerns regarding the low y+ values on the humanoid surface indicate improvements to the fluid solutions could be achieved with enhanced wall treatments, relative to the standard wall functions used throughout this modeling. While indoor air simulations are still being reported using standard k-epsilon turbulence models (Zhang and Chen, 2007; Salmanzadeh et al., 2012), other investigators examining airflow around primarily heated bodies have also used newer turbulent models, including the Abe-Nagano low Reynolds number k-epsilon (Zhu et al., 2005), RNG k-epsilon (Ge et al., 2013): these models may improve convergence and enhanced accuracy of fluid simulations. Our simulations also ignored thermal effects, where studies indicate as much as 0.02 and 0.03 m s−1 upward velocity, on average during a breathing cycle, near the surface of an inhaling human (Marr et al., 2005; Craven and Settles, 2006), with maximum velocity reported as 0.16 m s−1. This maximum upward flow exceeds the terminal settling velocity of 68 µm and smaller particles examined in this study and may affect the upstream positions of the critical areas determined here.
Simplifications also ignored particle bounce (where a particle strikes the surface of the humanoid form and is allowed to bounce back into the freestream where it might be secondarily aspirated). Particle simulations also relied on laminar particle trajectories (where we investigated the mean path of particles within the flow field, ignoring turbulence that would better represent the random component of velocity and particle transport as it moves through turbulent air). Additional work is underway to quantify uncertainties associated with both of these computational simplifications on aspiration efficiency estimates.
Finally, it is important to clarify that these estimates of particle aspiration apply only to those particles with no significant external momentum. Particles that are generated from a source such as paint aerosol from a sprayer or metal from a grinder would not meet the underlying assumption of the uniform particle concentration inherent in this model.
CONCLUSIONS
Simulations of particle aspiration by an inhaling humanoid form, designed to match geometry and velocity conditions representative of indoor occupational exposures, were completed for mouth breathing over seven discrete orientations relative to the oncoming wind. Trends in aspiration efficiency agreed with those reported in experimental wind tunnel studies, particularly that lower velocity air is associated with higher particle aspiration than what had been incorporated into the IPM sampling criterion. At all orientations relative to the oncoming wind, heavier breathing velocities were required to transport large particle (100 and 116 µm) from the freestream into the mouth. Also at these heavy breathing rates, orientation-averaged and most of the orientation-specific aspiration efficiencies exceeded the IPM sampling criterion for all but 100 µm and larger particles. This work further supports the current consensus that the existing inhalable sampler performance convention, designed to represent human aspiration of large particles, should be updated to provide sampler design criterion that reflects aspiration efficiency of workers in environments with low-moving air. Agreement with the linear inhalable particulate mass equation proposed by Aitken et al. (1999) for slow-moving air, at least through 100 µm at 0.1 m s−1 freestream velocity, is supported.
SUPPLEMENTARY DATA
Supplementary data, including verification analysis and animation of particle trajectory simulation results, can be found at http://annhyg.oxfordjournals.org/.
FUNDING
National Institute for Occupational Safety and Health, Centers for Disease Control and Prevention (R01 OH009290).
Supplementary Material
Acknowledgments
Acknowledgements—The authors wish to acknowledge the following contributors who assisted in running CFD codes and extracting simulation data over the past 3 years: Alysha Meyers, Jacob Krzystowczyk, Kelsie Reeve, Brian Pavlonis, Guannan (Bela) Huang, and Benjamin Getschman. We also thank Dr Darrah Sleeth, from the University of Utah, for providing wind tunnel images for velocity comparison studies used to generate Fig. 2.
REFERENCES
- ACGIH 2012. Threshold limit values for chemical substances and physical agents and biological exposure indices. Cincinnati, OH: American Conference of Governmental Industrial Hygienists; [Google Scholar]
- Aitken RJ, Baldwin PEJ, Beaumont BC, et al. 1999. Aerosol inhalability in low air movement environments. J Aerosol Sci; 30: 613–26 [Google Scholar]
- Anderson KR, Anthony TR. 2012. Uncertainty in aspiration efficiency estimates from torso simplifications in computational fluid dynamics (CFD) simulations. Ann Occup Hyg; 57: 184–199 [DOI] [PMC free article] [PubMed] [Google Scholar]
- Anthony TR. 2010. Contribution of facial feature dimensions and velocity parameters on particle inhalability. Ann Occup Hyg; 54: 710–25 [DOI] [PMC free article] [PubMed] [Google Scholar]
- Anthony TR, Flynn MR. 2006. Computational fluid dynamics investigation of particle inhalability. J Aerosol Sci; 37: 750–65 [Google Scholar]
- Baldwin PE, Maynard AD. 1998. A survey of wind speeds in indoor workplaces. Ann Occup Hyg; 42: 303–13 [DOI] [PubMed] [Google Scholar]
- Craven BA, Settles GS. 2006. A computational and experimental investigation of the human thermal plume. J Fluids Eng; 128: 1251–58 [Google Scholar]
- Ge Q, Li X, Inthavong K, et al. 2013. Numerical study of hte effects of human body heat on particle transport and inhalation in indoor environment. Build Environ; 59: 1–9 [Google Scholar]
- Kennedy NJ, Hinds WC. 2002. Inhalability of large solid particles. Aerosol Sci; 33: 237–55 [Google Scholar]
- King Se CM, Inthavong K, Tu J. 2010. Inhalability of micron particles through the nose and mouth. Inhal Toxicol; 22: 287–300 [DOI] [PubMed] [Google Scholar]
- Hsu DJ, Swift DL. 1999. The measurement of human inhalability of ultralarge aerosols in calm air using mannikins. J Aerosol Sci; 30: 1331–43 [Google Scholar]
- ICRP 1994. Human respiratory tract model for radiological protection, Annals of the International Commission on Radiological Protection (ICRP); Oxford, UK: Pergamon Press; [PubMed] [Google Scholar]
- Lidén G, Harper M. 2006. Analytical performance criteria: the need for an international sampling convention for inhalable dust in calm air. J Occup Env Hyg; 3: D94–D101 [DOI] [PubMed] [Google Scholar]
- Marr D, Khan T, Glauser M, et al. 2005. On particle image velocimetry (PIV) measurements in the breathing zone of a thermal breathing manikin. ASHRAE Trans; 111: (Part 2): 299–305 [Google Scholar]
- Ogden TL, Birkett JL. 1975. The human head as a dust sampler. In Halton WH, editor. Inhaled particles IV: proceedings of an international symposium organized by the British Occupational Hygiene Society; Oxford: Pergamon Press; ISBN 0080205607 pp. 93–105 [PubMed] [Google Scholar]
- Roache PJ. (1998) Validation in Computational Science and Engineering. Albuquerque, NM: Hermosa Publishers [Google Scholar]
- Salmanzadeh M, Xahedi Gh, Ahmadi G, et al. 2012. Computational modeling of effects of thermal plume adjacent to the body in indoor airflow and particle transport. J Aerosol Sci; 53: 29–30 [Google Scholar]
- Schmees DK, Wu Y-H, Vincent JH. 2008. Visualization of the airflow around a life-sized, heated, breathing mannequin at ultralow airspeeds. Ann Occup Hyg; 52: 351–360 [DOI] [PMC free article] [PubMed] [Google Scholar]
- Sleeth DK, Vincent JH. 2009. Inhalability for aerosols at ultra-low wind speeds. J Phys Conf Ser; 151: 012062 [Google Scholar]
- Sleeth DK, Vincent JH. 2011. Proposed modification to the inhalable aerosol convention applicable to realistic workplace wind speeds. Ann Occup Hyg; 55: 476–84 [DOI] [PubMed] [Google Scholar]
- Sleeth DK, Vincent JH. 2012. Performance study of personal inhalable aerosol samplers at ultra-low wind speeds. Ann Occup Hyg; 56: 207–20 [DOI] [PubMed] [Google Scholar]
- Stern F, Wilson RV, Coleman HW, et al. 2001. Comprehensive approach to verification and validation of CFD simulations—part 1: methodology and procedures. J Fluids Eng; 123: 793–802 [Google Scholar]
- Tsai P-J, Vincent JH, Mark D, et al. 1995. Impaction models for the aspiration efficiencies of aerosol samplers in moving air under orientation-averaged conditions. Aerosol Sci Technol; 22: 271–86 [Google Scholar]
- U.S. EPA 2011. Exposure Factors Handbook 2011 Edition (Final). Inhalation rates. EPA/600/R-09/052F, 1001; Washington, DC: U.S. Environmental Protection Agency; [Google Scholar]
- Zhang Z, Chen Q. 2007. Comparison of Eulerian and Lagrangian methods for prediction particle transport in enclosed spaces. Atmos Environ; 41: 5236–48 [Google Scholar]
- Zhu S, Kato S, Murakami S, et al. 2005. Study on inhalation region by means of CFD analysis and experiment. Build Environ; 40: 1329–36 [Google Scholar]
Associated Data
This section collects any data citations, data availability statements, or supplementary materials included in this article.


