

Abstract
Because of unique linguistic characteristics, the prevalence rate of developmental dyslexia is relatively low in the Japanese language. Paradoxically, Japanese children have serious difficulty analysing phonological processes when they have dyslexia. Neurobiological deficits in Japanese dyslexia remain unclear and need to be identified, and may lead to better understanding of the commonality and diversity in the disorder among different linguistic systems. The present study investigated brain activity that underlies deficits in phonological awareness in Japanese dyslexic children using functional magnetic resonance imaging. We developed and conducted a phonological manipulation task to extract phonological processing skills and to minimize the influence of auditory working memory on healthy adults, typically developing children, and dyslexic children. Current experiments revealed that several brain regions participated in manipulating the phonological information including left inferior and middle frontal gyrus, left superior temporal gyrus, and bilateral basal ganglia. Moreover, dyslexic children showed altered activity in two brain regions. They showed hyperactivity in the basal ganglia compared with the two other groups, which reflects inefficient phonological processing. Hypoactivity in the left superior temporal gyrus was also found, suggesting difficulty in composing and processing phonological information. The altered brain activity shares similarity with those of dyslexic children in countries speaking alphabetical languages, but disparity also occurs between these two populations. These are initial findings concerning the neurobiological impairments in dyslexic Japanese children.
Keywords: developmental dyslexia, phonological awareness, functional magnetic resonance imaging, basal ganglia, Japanese language
Introduction
People with developmental dyslexia have specific difficulties in reading and writing even though general intelligence and sensory organ function are maintained (World Health Organization, 1994; Shaywitz and Shaywitz, 2005). The prevalence of developmental dyslexia depends on the prevailing linguistic system. For example, in English-speaking school-aged children prevalence ranges from 5–17.5% (Shaywitz, 1998), whereas the rate in Japanese language speakers is low and ranges from 0.98–3.8% (Makita, 1968; Ogino et al., 2011). The core symptom of the disorder is conceived as a deficit in the phonological component of language (Shaywitz, 1998), especially the ability to comprehend phonological structures of spoken or mentally recalled sounds (Seki et al., 2008) and to discriminate and/or manipulate minimal units of the phoneme. Many previous studies have reported impaired phonological awareness in dyslexic children (Liberman, 1973; Chiappe et al., 2001; Ramus, 2001). Phonological awareness is regarded as a powerful predictor for developmental dyslexia (Shaywitz, 1998), and is thought to be a major factor underlying dyslexia in the Japanese (Seki et al., 2004, 2008), who have a different linguistic system compared with alphabetical languages. Still, neurobiological deficits in Japanese dyslexia remain unclear and need to be identified, which may lead to better understanding of the commonality and diversity of this disorder in a different linguistic system.
Previous neuroimaging studies using functional MRI (Temple et al., 2001; Shaywitz et al., 2002, 2004) and PET (Zatorre et al., 1996; Paulesu et al., 2001) have uncovered the involvement of several brain regions participating in phonological awareness. Among the regions, three brain areas in the left hemisphere are mainly considered to participate in the phonological process: the superior temporal gyrus, inferior frontal gyrus and inferior parietal lobe. Although the left superior temporal gyrus is the primary neural area responsible for phonological representations based on sounds (i.e. spoken language; Buchsbaum, 2001), the left inferior frontal gyrus stores articulatory representations (Zatorre et al., 1992, 1996). The left inferior parietal lobe is assumed to participate in grapheme-to-phoneme transformations (Bitan et al., 2007) and also to tune articulate codes with the target language (Doupe and Kuhl, 1999). The left inferior parietal lobe is the interface bridging phonological representations and articulator representations (Kaneko et al., 1998). Dyslexic children and adults show hypoactivity in the left inferior parietal lobe and/or hyperactivity in the left inferior frontal gyrus compared with control subjects during phonological awareness tasks such as rhyming judgements (Paulesu et al., 2001; Temple et al., 2001; Shaywitz et al., 2002, 2004). These atypical brain activities might underpin impaired phonological awareness in dyslexic people.
However, several lesion and imaging studies suggested that subcortical areas, such as the basal ganglia, are also involved in phonological processing. For example, the putamen and caudate nuclei are considered to play an important role in learning new skills (Ullman and Pierpont, 2005), such as acquisition of spoken language (Preston et al., 2010). Both perception and production of language require phonological processes and are related to articulatory gestures as auditory and motor representations also have phonological aspects (Booth et al., 2007). A report describing a 45-year-old female with damage to bilateral putamen and heads of the caudate nuclei showed impaired sequencing in articulatory gestures (Pickett et al., 1998). Another case study of a patient with Huntington’s disease suggested that the striatum assumes a crucial role in acquiring artificial language, which requires the patient to conduct phonological processes (De Diego-Balaguer et al., 2008). These studies suggested that the basal ganglia participate in an initiation of phonological representations (Booth et al., 2007) or serve as a gateway for language proficiency to process phonological information (Preston et al., 2010). Although atypical basal ganglia activity has been reported in adult patients with developmental dyslexia (Paulesu et al., 1996; Brunswick et al., 1999), whether the basal ganglia are involved in language learning in dyslexic children has not been previously explored.
Deficits in phonological awareness can cause problems in reading and writing, especially when the correspondence between characters and phonics is unclear, such as with English and Danish (Wydell and Butterworth, 1999). By contrast, Japanese is a unique language in that it is composed of two kinds of characters, kana—a syllabary—and kanji, which are Chinese characters. The former is phonogram and serves as the base for the fundamental characters of the Japanese language, which means all Japanese words can be communicated with kana. The minimal phonological unit of Japanese is not phonic but mora, which generally constitutes one vowel and/or consonant (V or CV). Developmental dyslexia may occur less frequently in Japan compared with alphabetical countries because the relationship between the grapheme and phonological unit is very clear in the Japanese language (Wydell and Butterworth, 1999). Paradoxically, the difficulty in reading and writing is severe when children have developmental dyslexia and use the Japanese language system. Japanese children with dyslexia also have deficits in phonological awareness (Seki et al., 2008). Still, the brain functions that underlie the deficits in phonological awareness in the unique Japanese language remain unclear. Therefore, current research into developmental dyslexia should aim to reveal the neurobiological deficits of this disorder, and examine whether the deficits are derived from a common or specific function depending on the language system.
Phonological awareness is usually assessed through several tasks in countries using an alphabetical language. These include rhyming production, deletion, substitution, and discrimination (Yopp, 1992, 1995; Stahl and Murray, 1994). Another assessment tool is the phonological or sound blending task (Yopp, 1988; Chiu et al., 2005) which can be performed as either a visual or auditory task. During the blending task, subjects are requested to watch or listen to serial phonological or sound elements, and then to collect and manipulate them to make one word. The demand of the task is similar to the process of acquiring language from spoken words and of learning unfamiliar words (Chiu et al., 2005). This blending task also has higher predictive validity for language skills than does rhyming judgement (Muter, 1998), which is often used as a phonological task. Although behavioural studies using the blending task revealed impaired phonological awareness in dyslexic children (Yopp, 1988, 1992), only a few neuroimaging studies have measured changes with this task. Chiu et al. (2005) conducted a functional MRI study in normal adults using this task and reported increased activity in the left inferior frontal gyrus during sound blending. Their approach suggested that this brain region, which is also active in other phonological tasks, participated in blending the phonological information. However, they performed the task using auditory stimuli that potentially placed an unnecessary burden on the auditory working memory of the subjects, instead of focusing on phonological awareness. This potential distorting factor can be minimized in our study by presenting serial letters as visual stimuli. In the Japanese language, one character (i.e. kana) can be rapidly and automatically transformed into a phoneme (mora) even when the character is presented for a short period of time, because of the strong correspondence between grapheme and phoneme. While we use the blending task with visual stimuli to take advantage of the linguistic characteristics of the Japanese language, the neurobiological areas that underpin phonological awareness in Japanese are expected to become clear because we are cancelling out the effects of auditory working memory.
The present study investigated the underlying brain activity connected to deficits in phonological awareness in Japanese dyslexic children using functional MRI. We developed a new mora blending task to eliminate using auditory working memory and to extract phonological processing skills. Although Japanese dyslexic children may show low performance in the phonological task, they should show atypical activity in brain regions, such as the superior temporal gyrus, inferior frontal gyrus, and inferior parietal lobe in the left hemisphere, which are involved in processing phonological tasks. Moreover, subjects may demonstrate atypical activity in the basal ganglia which would support higher phonological processes when the present task is focused on cognitive abilities used for phonological processing and eliminates the influence of auditory working memory.
Materials and methods
Subjects
Fourteen Japanese children with developmental dyslexia [12 boys and two girls, 12.31 ± 1.97 years (mean age ± standard deviation, SD), 12 right-handed and two left-handed] were recruited for the current study from the National Centre Hospital of Neurology and Psychiatry (Kodaira, Japan). Two paediatric neurologists made the diagnosis based on ICD-10 criteria and a Japanese guideline for the diagnosis of specific developmental disorder (developmental dyslexia; Research Group for Formulation of Diagnostic Criteria and Medical Guideline for Specific Developmental Disorders, 2010). These children did not have a history of neurological or psychiatric disorders. Their global intelligence quotients (IQs) were evaluated with the Wechsler Intelligence Scale for Children (Third Edition) and all of their full IQs were >85. The control groups were composed of 15 typically developing Japanese children (seven boys and eight girls, 11.69 ± 2.42 years, 13 right-handed and two left-handed) and 30 Japanese healthy adults (16 males and 14 females, 22.25 ± 2.32 years, all right-handed). These control subjects also did not have any history of neurological and psychiatric illness. All subjects were Japanese native speakers and had normal or corrected vision. All subjects from the three groups and the mothers of subjects from the children and dyslexia groups gave written informed consent before the experiment. The experimental protocol was approved by the Ethics Committee of the National Centre of Neurology and Psychiatry (approval number XXXX-291).
Stimuli and tasks
A mora blending task was performed as an experimental task (Fig. 1). During the task, each subject was instructed to watch one series of three Japanese characters (kana; e.g. /YA/, /SA/, /I/). Each kana used in the current study comprises either one consonant and one vowel (CV) or only one vowel (V), which represents one mora. Each kana was presented for 2 s with three kana characters shown one after another; thus, a total of 6 s elapsed during the presentation. Then, the subject was instructed to blend and manipulate three morae and judge whether the three morae formed a real Japanese word. In this task, the subject tended to decode each character and to keep and manipulate the character information as a phonological representation ‘mora’. This is because the transformation of characters into phonological representation is easily and semi-automatically performed based on the clear correspondence between grapheme and phoneme (Paap and Noel, 1991; Frost, 1994) when each character was presented only for a short time and then disappeared. Therefore, the task took advantage of linguistic features of Japanese to demand the subjects to perform phonological manipulation from visual stimuli.
Figure 1.

Time course of one trial in the mora blending task. A black cross-hair first appeared for 2 s to engage the subject’s attention. Then, each kana was presented for 2 s, followed by the two other kana consecutively, which took a total of 6 s. After the third kana was presented, a small black circle was shown for 4 s. While the circle was exhibited, the subjects were required to judge whether the morae formed a word or not, and to press one of the two buttons depending on the judgement (word or non-word). After the circle was removed, the cross-hair appeared again and a new trial started.
We set three conditions in this task: correct order word (CRW), random order word (RDW), and non-word (NNW) conditions (Fig. 2). In the CRW condition, each of the three characters was presented in the correct order; thus, the subjects did not have to manipulate the three morae and could blend them as they were presented (e.g. /YA/, /SA/, /I/ to /YASAI/, meaning vegetable). By contrast, in the RDW condition, the subject had to manipulate the order of the three morae because they were presented in a random order (e.g. /I/, /SU/, /KA/ to /SUIKA/, meaning watermelon). In the NNW condition, the three morae did not form a word no matter how the subject manipulated the morae (/NU/, /YO/, /U/ to non-word in any order). No duplicate morae were included in any one series, meaning that the number of possible orders was six in every condition. In the CRW and RDW conditions, only one order was acceptable to form one word so that the subject had to continue manipulating the morae until he/she made a word. The words composed of the three morae in the CRW and RDW conditions are very familiar and display high imageability (Tokyo Metropolitan Institute of Gerontology and NTT Communication Science Laboratories, 2005). All subjects could understand the word easily even though some were children.
Figure 2.

Experimental conditions and examples of each condition. In the mora tasks, subjects translated kana into phonological information. While they did not have to manipulate the phonological information in the correct order word (CRW) condition, they were required to manipulate the phonological condition for the random order word (RDW) and non-word (NNW) conditions. In a separate set of experiments, subjects did not have to translate the visual stimuli into phonological information in picture fraction tasks. Similar to the mora tasks, they did not have to manipulate the visual information in random order picture (RDP) and non-picture (NNP) conditions, but they were needed to process visual information in the correct order picture condition (CRP). Note that alphabetical characters for decoding like /YA/ were used just for the illustrative figure here and only kana was presented in the actual experiment. N/A = not available.
As a control task, the blending task was also conducted with fractions of line pictures instead of a character. Similar to the character task, each of the three fractions of the line picture was presented one after another. The subject was required to blend and manipulate the fractions and to judge whether the fractions form one line picture. Similarly, for this task, three conditions were tested: the correct order (CRP), the random order (RDP), and non-picture (NNP) conditions. In this control task, the subject could not decode the fractions into phonological representations, and had to keep and manipulate the fractions as visual images. Therefore, we can demonstrate the process of phonological manipulation by contrasting the morae and picture conditions to subtract the effects of visual working memory, even though the morae condition itself adequately required the subject to perform phonological manipulations.
These tasks were prepared using Presentation 14.9 software (Neurobehavioral Systems) and all of the characters and picture fractions were presented onto a half-transparent screen placed by the head side of the MRI scanner using a liquid crystal projector (TH-L 587 JL, Panasonic Corporation). These stimuli were shown to the subject via a mirror attached to the head coil, and were presented on a white background within the visual angle 22.6° (width) by 17.1° (height).
Functional magnetic resonance imaging procedure
Detailed instruction of the experiments was provided to the subjects before functional MRI. The subjects engaged in practice trials using tasks that were not used in the main trials. The practice trials were performed both outside and inside the scanner before the experiment and continued until subjects conducted the trials correctly.
In the experiments, a black cross-hair was presented in the middle of the screen for 2 s and then each of either the three kana characters or the three picture fractions appeared one after another (for a total of 6 s). After the third character or picture fraction was presented, a small black circle was shown for 4 s. While the circle was exhibited, the subjects were required to judge whether the morae (or the picture fractions) formed a word (or a line picture) and to press one of two buttons depending on judgement (form or not-form). After the circle, the cross-hair appeared again and the next new trial was started.
The experiment was conducted with an event-related design to minimize habituation and learning effects. During functional MRI, each subject participated in three sessions, each of which consisted of 18 trials covering all six conditions, i.e. three trials in each condition were performed per one session. The order of the three sessions and also trials within each session were pseudo-randomized. In total, every subject performed 54 trials (six conditions × nine trials).
Data acquisition
Images were acquired using a 1.5 T MR scanner (Vision-Symphony; Siemens) with a T2*-weighted gradient-echo echo-planer imaging (EPI) procedure. The scanning parameters were: time of repetition = 4000 ms, time of echo = 50 ms, flip angle = 90°, field of view = 192 mm, matrix size = 64 × 64, voxel size = 3.0 × 3.0 × 3.0 mm, slice gap = 0.75 mm, number of slices = 37. Oblique scanning was used to exclude the eyeballs from the images. With this parameter, a time course series of 58 volumes was acquired in each session, which covered the entire cerebrum. The session was repeated three times and a total duration for acquisition was ∼12 min (∼4 min per session). Additionally, T1-weighted magnetization-prepared rapid-acquisition gradient-echo images were also obtained for each subject (voxel size = 1.0 × 1.0 × 1.0 mm).
After functional MRI, subjects participated in two kinds of Japanese phonological awareness tasks in a separate room from the MRI setting: a mora reversal and a mora deletion task (Seki et al., 2008). These two tasks are usually used to measure phonological awareness in Japanese children, though both tasks require phonological awareness and auditory working memory. None of the words in the two tasks were used in the functional MRI experiments, therefore the learning effect was minimized for the tasks.
All subjects underwent a reading test (Kobayashi et al., 2010) to measure their reading ability (Supplementary Fig. 1A and B). The test is used to elucidate the reading ability of Japanese kana characters (i.e. hiragana) and is helpful in making the diagnosis of developmental dyslexia in Japan (Research Group for Formulation of Diagnostic Criteria and Medical Guideline for Specific Developmental Disorders, 2010). Although kana are the fundamental characters of the Japanese language, and children are supposed to master kana as the basis of the language before they learn kanji, dyslexic Japanese children mostly have difficulty in reading kana as the initial step of language learning. The test was composed of two types of tasks: word (Supplementary Fig. 1A) and non-word (Supplementary Fig. 1B). Each task contained 30 words or non-words, and each word (or non-word) was presented with four kana characters. The subjects were asked to verbalize the 30 words or non-words as quickly and accurately as they could. Reading speed was measured for each subject. These reading speeds were transformed into Z scores using standardized values from Japanese children of similar age and sex which were established based on a large survey and published in medical guidelines (Kobayashi et al., 2010; Research Group for Formulation of Diagnostic Criteria and Medical Guideline for Specific Developmental Disorders, 2010). Error responses in each task were also noted. Additionally, the reading and writing clinical checklist (Kita et al., 2010) was performed by interviewing the mothers of each of the subjects in the control children and dyslexia groups to verify clinical findings concerning the reading and writing abilities of the subjects (Supplementary Fig. 2). This checklist is also used as one of the diagnostic procedures for Japanese developmental dyslexia (Research Group for Formulation of Diagnostic Criteria and Medical Guideline for Specific Developmental Disorders, 2010), and consists of 30 yes–no items (15 items for reading and 15 items for writing). Twelve of the 15 reading and writing items provide insight into kana literacy and the remaining items indicated abilities surrounding kanji. The 12 items for kana are placed into four categories: emotional distress (two items), speed (two items), characteristic behaviour (five items), and error pattern (three items). We counted the total number of items that apply to clinical findings for each subject. Each of the cut-off levels was set as seven positive points. The subject from the adult groups answered the checklist by themselves. We also examined difficulty in reading and writing kanji in dyslexic children using a basic kanji test. The test is used to judge whether children can read and write kanji at a level achieved two grades below current grade (i.e. for fifth grade children, the level of kanji test is set at third grade level). With this test, children without dyslexia are known to have quite high accuracy, both in reading and writing (average accuracy 98.77% and 94.26%, respectively). Z-scores for each reading and writing kanji test from each subject were calculated based on these data.
Furthermore, we performed three psychological tests to assess subject’s condition as related to their reading ability: Raven’s Coloured Progressive Matrices Test (Raven, 1976), Rey–Osterrieth Complex Figure Test (Osterrieth, 1944; Shin et al., 2006), and Japanese Rapid-Automatizing Naming Test (Kobayashi et al., 2011). The first test was used to determine non-verbal intelligence and the second test was conducted to assess cognitive ability of visual information processing. In the Rapid-Automatizing Naming Test, the subjects are required to name pictures or numbers as quickly and accurately as possible. While the tests can be a strong predictor of reading ability (Wolf et al., 2000), they are thought to reflect various cognitive components such as the automating process, visual searching, and visual sequencing. For the Rey–Osterrieth Complex Figure Test and the automatizing naming test, we calculated Z scores using the standardized values for Japanese children (Kobayashi et al., 2011).
Analysis
Behavioural performance
We measured the rate of correct response and reaction time in all conditions of the functional MRI task to verify behavioural performance of each subject. The correct response was accepted when the subjects pressed the correct key within 4 s (when the black circle appeared). Reaction time is defined as the duration from the black circle onset to the time at which the subject pressed the key. We excluded commission and omission errors to calculate the reaction times. These behavioural variables were analysed by two-way repeated measured ANOVA with a 3 (groups) × 6 (conditions) design followed by post hoc analysis using Bonferroni adjustments.
Imaging data
We excluded imaging data from subjects where head motion of >5 mm in any of the three directions (x, y, or z axial), or >4° rotation on any axial plane, occurred. The data were also discarded when the subjects did not get any correct answers in at least one condition. The remaining data were analysed.
Imaging data analysis was performed using Statistical Parametric Mapping 8 (SPM8; Wellcome Department of Cognitive Neurology, London, UK; Friston et al., 2007) implemented in Matlab 7.8 (MathWorks Inc). The first four volumes of each session were eliminated to allow for the stabilization of the magnetization, and the remaining 54 volumes per session (a total of 162 volumes per subject for three sessions) were used for analysis. Following realignment for motion correction, all EPI volumes were normalized to the MNI EPI image template using a non-linear basis function. These volumes were then spatially smoothed in three dimensions using a Gaussian kernel of 8 mm full-width at half-maximum.
The signal intensity of the images was proportionally scaled by setting the whole-brain mean value to 100 arbitrary units. The signal time course for each participant was modelled using a box-car function convolved with a haemodynamic response function, session effect and high pass filtering (128 s). To depict the activations evoked by the phonological conditions without the effect of visual working memory, we compared each of the three mora tasks with the three picture fraction tasks as follows: (i) the correct order word (CRW) versus the picture fraction task (CRP + RDP + NNP); (ii) the random order word (RDW) versus the picture fraction task; and (iii) the non-word (NNW) versus the picture fraction task.
The weighted sum of the parameter estimates in the individual analyses yielded the contrast images, which were used for the group analysis. The contrast images acquired by individual analysis represented the normalized task-related increment of the magnetic resonance signal of each participant. First, we searched brain regions for Japanese phonological manipulations through group analysis with the data from the adults group. The group analysis was performed with the contrast between (ii) and (i) (i.e. {[RDW- (CRP + RDP + NNP)] − [CRW − (CRP + RDP + NNP)]}) with a voxel level threshold set at P < 0.001 (uncorrected) and a cluster level threshold set at P < 0.05 [family wise error (FWE)] using a masking image that was acquired through the RDW condition in the adults group. Moreover, the signal intensity of the morae conditions were depicted for each subject at top-peak activation points from the abovementioned adults group analysis, and then analysed by two-way repeated measured ANOVA with a 3 (groups) × 3 (conditions: CRW, RDW and NNW) design followed by post hoc Bonferroni analysis. We also calculated the Pearson’s r-value between the signal intensity and behavioural performance in each condition. Statistical analyses were performed using Matlab 7.8 and IBM SPSS statistics 19: Japanese version (IBM Japan).
Results
All healthy adult subjects performed the experiment tasks successfully and all data from this group were used for further analysis. We excluded data of 4 of 15 typically-developing children and 3 of 14 dyslexic children for further analysis because of motion artefact (six children) and poor behavioural performance (one child). The following analyses were performed on the remaining data from 30 adults, 11 typically developing children and 11 dyslexic children.
Psychological tasks
The clinical condition for reading and writing was worse in the dyslexia group compared with those of the control children group [reading: t(20) = 3.774, P = 0.001; writing: t(20) = 4.756, P < 0.000]. The subjects in the dyslexia group did not perform as well as those in the control children group on the reading test [word test: t(20) = 2.497, P = 0.023; non-word test: t(20) = 2.475, P = 0.022] and on two phonological awareness tasks [mora reversal: t(20) = 2.131, P = 0.046; mora deletion: t(20) = 2.571, P = 0.018]. Dyslexic children showed quite low ability in kanji, in that their average scores were 6.22 and 9.14 SD below the average seen in control children on the reading and writing test, respectively, whereas four dyslexic children could not complete the tests. Task scores were not significantly different between the typically developing children and dyslexic children in the Raven’s Coloured Progressive Matrices [t(20) = 1.128, P = 0.273] and the Rapid-Automatizing Naming Test [pictures: t(20) = 1.340, P = 0.195; digits: t(20) = 0.054, P = 0.957]. While dyslexic children showed lower scores than typically developing children in the two tasks of the Rey–Osterrieth Complex Figure Test [immediate recall: t(20) = 3.076, P = 0.006; delayed recall: t(20) = 2.434, P = 0.024], their average scores were within the normal range based on the standardized values of Japanese children (Hattori et al., 2000; Table 1 and Supplementary Fig. 3).
Table 1.
Subject characteristics
| Adults | Control children | Children with dyslexia | Comparison of control and dyslexic children |
||
|---|---|---|---|---|---|
| t-value t (20) | P-value | ||||
| n | 30 | 11 | 11 | ||
| Age (years) | 22.52 ± 2.32 | 12.44 ± 2.32 | 12.49 ± 2.06 | 0.057 | 0.955 |
| Sex (n: male / female) | 16 / 14 | 3 / 8 | 9 / 2 | ||
| Dominant hand (n: right / left) | 30 / 0 | 10 / 1 | 9 / 2 | ||
| Clinical checklist (points) | |||||
| Reading | 1.13 ± 1.63 | 0.89 ± 2.67 | 5.55 ± 2.81 | 3.774 | 0.001** |
| Writing | 0.77 ± 0.86 | 1.00 ± 2.65 | 7.55 ± 3.36 | 4.756 | <0.001*** |
| Reading test (RT: Z-score) | |||||
| Word (Hiragana) | −0.42 ± 0.85 | −0.11 ± 0.97 | 2.23 ± 2.69 | 2.497 | 0.023* |
| Non-word (Hiragana) | −0.68 ± 0.98 | 0.24 ± 1.13 | 1.40 ± 1.44 | 2.475 | 0.022* |
| Reading test (error: number) | |||||
| Word (Hiragana) | 0.03 ± 0.18 | 0.09 ± 0.30 | 0.55 ± 0.82 | 1.725 | 0.100 |
| Non-word (Hiragana) | 0.57 ± 1.28 | 0.64 ± 1.21 | 2.36 ± 1.91 | 2.534 | 0.020** |
| Phonological awareness task (Z-score) | |||||
| Mora reversal | −0.11 ± 0.78 | 0.47 ± 1.73 | 2.34 ± 2.34 | 2.131 | 0.046* |
| Mora deletion | −0.41 ± 0.53 | 0.03 ± 0.67 | 1.40 ± 1.64 | 2.571 | 0.018* |
| Rapid automatizing naming Test (Z-score) | |||||
| Pictures | −0.31 ± 0.80 | −0.06 ± 1.15 | 0.67 ± 1.39 | 1.34 | 0.195 |
| Digits | −0.03 ± 1.01 | 0.29 ± 0.99 | 0.43 ± 1.27 | 0.054 | 0.957 |
| Rey–Osterrieth Complex Figure Test (Z-score) | |||||
| Copy drawing | 1.12 ± 0.06 | 1.21 ± 0.21 | 0.59 ± 1.04 | 1.933 | 0.067 |
| Immediate recall | 0.98 ± 0.68 | 1.03 ± 0.52 | 0.04 ± 0.93 | 3.076 | 0.006** |
| Delayed recall | 0.86 ± 0.75 | 0.82 ± 0.68 | −0.15 ± 1.12 | 2.434 | 0.024* |
| Kanji Test - two grades below current level- (Z-score)† | |||||
| Reading | − | − | −6.22 ± 4.86 | − | − |
| Writing | − | − | −9.14 ± 5.10 | − | − |
| Raven’s Coloured Progressive Matrices (points) | 33.77 ± 2.37 | 31.82 ± 2.79 | 29.73 ± 5.48 | 1.128 | 0.273 |
Data are represented as mean ± SD, except for n, sex, and dominant hand. Comparisons of the typically developing children and dyslexia groups were performed using Student’s t-test (two-tailed unpaired).
†Conducted only on dyslexic children, 4 of 11 children could not complete this task.
*P < 0.05, **P < 0.01, ***P < 0.001.
Behavioural performance during functional magnetic resonance imaging scanning
Concerning the rate of correct answers, a two-way repeated measured ANOVA showed both a significant main effect of groups [F(2,49) = 20.119, P < 0.000] and of conditions [F(5,245) = 38.123, P < 0.000], and also a significant interaction between these two variables [F(10,245) = 6.599, P < 0.000; Fig. 3A]. Post hoc analysis revealed that the subjects in the control and dyslexia groups committed more errors on the RDW condition test compared with the other five conditions (P < 0.05). Interestingly, the subjects in the adults group had more errors on the RDW condition than on the CRW condition. Although the adult group showed the higher percentage of correct answers compared with the children and dyslexia groups on the RDW condition, no significant differences were found between the children and dyslexia groups for all conditions. On reaction times, a main effect of conditions was significant [F(5,245) = 29.114, P < 0.000], but neither a main effect of groups nor an interaction were significant [group: F(1,49) = 0.576, P = 0.566; interaction: F(10,245) = 1.104, P = 0.360; Fig. 3B]. The reaction times in the NNW condition were the most prolonged in all conditions, followed by those in the RDW condition (P < 0.05). The subjects made judgements quicker on the CRW condition compared with most other conditions.
Figure 3.

Behavioural performance during functional MRI. (A) Rate of corrected responses. (B) Reaction time (RT). Each bar shows mean rates or reaction times in each group and error bars show standard deviation for the variables. *P < 0.05, **P < 0.01, ***P < 0.001. Children = typically developing children.
Group analysis with a random effect model
Figure 4A–C shows activated regions in each mora condition compared with the control task from the adult group. Several brain areas of the adult group exhibited significant increased activity for the phonological task with manipulation (RDW condition) compared with without manipulation (CRW condition), including the left middle frontal gyrus, bilateral midcingulate cortex, right putamen, left lingual gyrus, left superior temporal gyrus, and right medial frontal gyrus (Fig. 4D and E). The cluster including the left middle frontal gyrus covering a widespread area extending from the left precentral gyrus to left basal ganglia like putamen was very active (Table 2).
Figure 4.

Significant activation in each condition of the mora tasks compared with the picture fraction tasks (CRP + RDP + NNP). (A) Correct order word (CRW) condition. (B) Random order word (RDW) condition. (C) Non-word (NNW) condition. (D) Significant effect of phonological manipulation as depicted by the contrast of {[RDW − (CRP + RDP + NNP)] − [CRW − (CRP + RDP + NNP)]} rendered on the MNI image template, and (E) on the MNI T1-weighted image template. From (A) to (C), a voxel level threshold is set at Z > 4.88 (P < 0.05, FWE), and in (D) and (E) a voxel level threshold is set at Z > 3.09 (P < 0.001, uncorrected) and a cluster level threshold is set at k >130 (P < 0.02, FWE). R = right.
Table 2.
Task related activation of brain regions during phonological manipulation
| Cluster P | Cluster size | Z-value | Coordinates |
Side | Location | ||
|---|---|---|---|---|---|---|---|
| x | y | z | |||||
| <0.001 | 4190 | 6.19 | −30 | 6 | 48 | L | Middle frontal gyrus |
| 5.75 | −48 | 4 | 31 | L | Precentral gyrus | ||
| 5.57 | −16 | 7 | −10 | L | Putamen | ||
| <0.001 | 1530 | 6.04 | 8 | 19 | 34 | R | Midcingulate cortex |
| 5.87 | −4 | 20 | 43 | L | Supplementary motor area | ||
| 5.23 | −4 | 25 | 30 | L | Midcingulate cortex | ||
| <0.001 | 1127 | 5.78 | 16 | 10 | 1 | R | Putamen |
| 5.28 | 22 | 6 | −5 | R | Putamen | ||
| 4.92 | 14 | 8 | 14 | R | Caudate body | ||
| 0.002 | 197 | 5.02 | −12 | −84 | −1 | L | Lingural gyrus |
| 0.013 | 131 | 4.79 | 0 | −19 | 54 | L/R | Medial frontal gyrus |
| 0.011 | 135 | 4.46 | −51 | 2 | −8 | L | Superior temporal gyrus |
All P-values are corrected for multiple comparisons with a voxel level threshold of Z > 3.09 (P < 0.001, uncorrected) and with a cluster level threshold of k > 130 (P < 0.02 family wise error). The MNI coordinates were converted to Talairach coordinates using the algorithm (Lacadie et al., 2008) and the locations were from Talairach’s atlas (Talairach and Tournoux, 1988).
L = left; R = right.
Signal intensity in each subject was depicted at top-peak activated points from the areas, and then were analysed by a two-way repeated measured ANOVA. Of these points, the dyslexic children had altered brain activity in two regions, the right putamen and the left superior temporal gyrus. Statistical analysis for the right putamen reported a significant main effect of condition [F(2,98) = 20.765, P < 0.001] and a significant interaction [F(4,98) = 3.182, P < 0.017]. Post hoc analysis revealed that the signal intensity for the RDW condition significantly increased compared with those of the CRW condition for the adults group (P < 0.000) and the children group (P = 0.002), but not for the dyslexia group (P = 0.132; Fig. 5). Moreover, similar analysis on the activity of the left superior temporal gyrus showed a significant main effect of group [F(2, 49) = 3.830, P = 0.028] and a significant interaction [F(4,98) = 4.031, P = 0.005]. Post hoc analysis reported that the signal intensity in the RDW condition in adult subjects was the highest of the three groups, followed by those in the control children group, and then the dyslexia group [adults > control children (P = 0.031), adults > dyslexia (P < 0.000), control children > dyslexia (P = 0.092)]. No significant difference in the signal intensity was found for the CRW condition among the three groups (Fig. 6A). Furthermore, the correlation was significant between the signal intensity in the left superior temporal gyrus, and reaction time in the RDW condition among the children and dyslexia groups (r = −0.47, P = 0.022; Fig. 6B). No significant correlation was attained between the signal intensity and the other behavioural variables. We did not find any significant differences for the signal intensity among the conditions in the dyslexia group or among the three groups for the RDW condition (P > 0.05) for other brain regions except the right putamen and left superior temporal gyrus as noted above.
Figure 5.

Signal intensity in each condition of the mora task in the right putamen. The blue lines cross at [16, 10, 1] of Talairach’s atlas coordinates. **P < 0.01, ***P < 0.001. L = left; n.s. = not significant; children = typically developing children.
Figure 6.
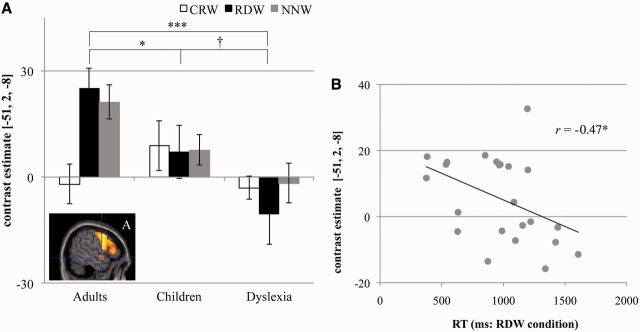
(A) Signal intensity in each condition of the mora task in the left superior temporal gyrus. The blue lines cross at [−51, 2, −8] of Talairach’s atlas coordinates. (B) Relationship between the signal intensity and reaction time (RT) for the random order word (RDW) condition. †P < 0.05, *P < 0.05, ***P < 0.001. A = anterior; children = typically developing children.
Discussion
The present study conducted a new phonological awareness task on Japanese adults and children including typically developing and dyslexic children. These subjects were not required to use auditory working memory for our phonological awareness task, distinguishing our study from previous studies. We developed the task to make use of characteristics of the Japanese language and revealed several brain regions participating in phonological manipulation, such as the left middle frontal gyrus, bilateral mid-cingulate cortex, bilateral basal ganglia, left superior temporal gyrus, right medial frontal cortex and left lingual gyrus. Of these regions, dyslexic children had altered brain activity in two regions, the basal ganglia and the left superior temporal gyrus. Only the dyslexic children showed increased activity in the basal ganglia, especially the putamen, during the CRW condition that did not require much phonological manipulation. Moreover, hypoactivity in the left superior temporal gyrus was found in the dyslexic children compared with the normal adults and children during the phonological manipulation. The present study provided initial findings concerning impaired neurological function for phonological manipulation in Japanese children with developmental dyslexia, which is relatively rare, but quite disabling.
Task design and behavioural performance
In the mora tasks, all subjects took more time to make their responses in the NNW condition, followed by the RDW condition, and then the CRW condition. The differences in reaction times reflected the presence or absence of phonological manipulation, meaning that they manipulated the phonemes in the NNW and RDW conditions, but not in the CRW condition. Another difference between NNW and RDW conditions may be because of the cognitive process of lexical decision for non-words (Perea and Pérez, 2009) in addition to the phonological manipulation. By contrast, the reaction times did not differ among the three conditions of picture fraction tasks. The similar amount of time responding to the tasks suggested that the subjects did not decode the visual stimuli into auditory information, but made decisions on the object features based on visual working memory. Considering these differences in reaction times, setting the picture fraction task as a baseline for the morae task enabled us to cancel out the influence of visual working memory. Then, the contrast between the RDW and CRW conditions reflects the function of phonological manipulation, although the contrast of the NNW and the CRW conditions would include the effects of lexical decisions besides phonological manipulation, which have been excluded.
No difference was found in all conditions between the children and dyslexia groups for the accuracy rate of the tasks. The two groups also showed similar reaction times in all conditions, suggesting that the level of difficulty for the present tasks was almost equivalent for the subjects from the two groups. The difficulty level can minimize the influence of attitudes or motivation of the subjects toward the task, such that a too difficult task would be very challenging for some people before they start, or a too easy task would be less motivating for some people to make an effort to do the task (Humphreys and Revelle, 1984). Based on the task design and behavioural performance, the findings of increased brain activity in certain brain regions can be interpreted in terms of phonological manipulation for dyslexic children.
Brain regions used in phonological manipulation of the Japanese language and altered activity in dyslexic children
Activity in the putamen of the basal ganglia was increased for healthy adults and typically developing children during high demands of phonological manipulation, while decreased activity was found when the demand was low. The putamen plays a major role in the initiation of phonological representations and participates in estimation for phonological processes (Booth et al., 2007). The region, in other words, works as a gateway for phonological processes (Preston et al., 2010) and underpins higher phonological processes like extraction, retainment, and manipulation. Booth et al. (2007) found that basal ganglia modulate activity in the left inferior frontal gyrus for phonological manipulation when a skilled reader conducts the process. The brain region is active when phonological processes are required, like during the initial stage for acquiring language (De Diego-Balaguer et al., 2008), and is less active when phonological processes are unnecessary (Friederici et al., 2006), meaning that the basal ganglia is partly responsible for language proficiency (Preston et al., 2010). In the present study, normal adults and children did not need to perform estimations for phonological processes in the CRW condition because they had to simply blend the three morae without manipulating the phonological information, and the basal ganglia showed decreased activity. On the RDW condition, however, normal adults and children had to manipulate the information, which resulted in hyperactivity of the basal ganglia. The subjects of the two groups modulated the activity of the basal ganglia depending on demand and are able to perform phonological manipulation effectively. To use phonological representation, subjects exercised the gateway function of the basal ganglia. This may reflect their language proficiency, although subjects do not always learn languages based on phonological manipulation.
In contrast, dyslexic children showed increased activity in the putamen regardless of whether or not phonological manipulation was required. This seemingly unnecessary hyperactivity was reflected in that the patients exercised the gateway function and performed the initiation of phonological representation even when the requirement for phonological manipulation was low. This atypical function may be a compensatory activity for the weakness in phonological manipulation (Liberman, 1973; Ramus, 2001), which is also demonstrated by the low scores in the psychological tasks conducted outside of the functional MRI setting. Dyslexic children are probably unable to automatically process the phonological information like normal adults and children, and perform the manipulation inefficiently, which influences the higher phonological processes occurring in the basal ganglia. The dysfunction can lead to impairments in language proficiency and requires extra time and effort to acquire language. A functional MRI study reported that atypical hyperactivity in the basal ganglia was found in family members who have a rare mutation of the FOXP2 gene, which is one of the common candidate genes for developmental dyslexia (Liegeois et al., 2003). Preston et al. (2010) hypothesized that basal ganglia dysfunction can be the root of language development disorders based on their longitudinal study. Other previous studies reported hypoactivity in the basal ganglia in dyslexic children (Paulesu et al., 1996; Brunswick et al., 1999). The hypoactivity suggested that the gateway was not exercised and the estimations for phonological processes were not performed because the previous tasks used placed burdens that were too heavy for dyslexic children. The present study set the difficulty level appropriately so that the activity in the basal ganglia could be measured, showing an actual increase compared with the control groups. Therefore, children with developmental dyslexia may always have difficulty in effectively processing phonological information and require substantial effort to process the information because of dysfunctional basal ganglia. This dysfunction may be problematic for acquiring language (De Diego-Balaguer et al., 2008) and language proficiency (Preston et al., 2010).
Altered activity was also found in the left superior temporal gyrus where the activity in the adults group was increased, followed by the control children and then the dyslexia group, on conditions requiring major phonological manipulation. Differences were not found for conditions that did not need phonological manipulation. While several previous studies indicated that the left superior temporal gyrus participates in the phonological process in alphabetical countries (Demonet et al., 1992; Zatorre et al., 1992; Burton et al., 2000; Buchsbaum, 2001), similar findings have also been reported for the Japanese language (Seki et al., 2004) where it is relatively easy to manipulate phonological information. The superior temporal area is thought to be one of the primary neural substrates for composing phonological representations (Buchsbaum, 2001) and for making representations from serial auditory information (Wise et al., 2001). In detail, the region pointed out in the present study is located from the middle to the anterior area of the left superior temporal gyrus. This region is a constitutive part of the auditory ventral stream (DeWitt and Rauschecker, 2012) and is partly responsible for auditory word processing (Wise et al., 1991; Demonet et al., 1992; Cohen et al., 2004). The present study required the subjects to manipulate phonological information and also to form a word based on the phonological information similar to auditory processes, which led to increased left superior temporal gyrus activity, especially in the middle to anterior area, for the RDW condition. This hyperactivity was not influenced by auditory working memory because we used visual stimuli, nor by visual cognitive processes, which was confirmed by no significant activation in brain areas, such as the fusiform gyrus, which involves visual processing of characters (McCandliss et al., 2003).
Dyslexic children showed low activity in the left superior temporal gyrus compared with the other two groups. The low activity has been reported by several previous studies in countries using an alphabetical language (Pugh et al., 2001; Temple et al., 2001; Shaywitz et al., 2002). Additionally, the reaction times were negatively correlated with the intensity of the activity on the phonological manipulation conditions, such that higher activity led to shorter reaction times. These findings suggested that the left superior temporal gyrus is involved in the phonological processing speed and the maturity of auditory word-form processing with the phonological manipulation. Dyslexic children are functionally impaired in the left superior temporal gyrus, which makes it difficult to process phonological information quickly. This means dyslexic children face trouble in learning or processing the phonological information of new languages. In fact, the dyslexic children in the present study took longer to process the information, as shown by their low scores in the Japanese phonological awareness task. The low-level function in this area may not be specific to dyslexia but may be remedied during development. The function in the left superior temporal gyrus is thought to mature as people age from being children into adults, which is suggested by the difference in intensity between healthy adults and typically developing children. Still, this possibility cannot be confirmed only by the present findings, and further study is needed. Therefore, dyslexic children have impairments in the left superior temporal gyrus for higher phonological processes and in the basal ganglia, which is necessary for analysing higher processes.
Subtype of developmental dyslexia in the present study
The dyslexic children in the present study had poor performance in the reading test (hiragana) and in the phonological awareness task while they showed normal performance both in the rapid automatizing naming task and in the cognitive task of visual information processing. Additionally, they also showed low ability in reading and writing kanji. These results suggested that they can be subtyped as patients who both have basic difficulty in reading kana and have severe deficit in kanji, meaning that they have neither a kana-specific nor kanji-specific disorder. Japanese children are supposed to learn hiragana as the initial step of Japanese, then to acquire kanji skills based on their ability in hiragana. Most dyslexic Japanese children have difficulty in hiragana so that they are also prone to severe problems with kanji. On the other hand, it is reported that ‘acquired’ dyslexia or alexia has broad subtypes in the Japanese, such as kana-specific and kanji-specific (Tsumoto, 2004; Sakurai et al., 2006, 2008), with the neural mechanisms underlying the acquired disorder being different from that of developmental dyslexia. Thus, the present findings of altered brain activity on functional MRI are thought to demonstrate neural mechanisms involved in a subtype of Japanese developmental dyslexia.
Based on the results of psychological tasks, the difficulty in the present dyslexic children derived from severe deficits in phonological awareness (Liberman, 1973; Chiappe et al., 2001; Ramus, 2001), not from low ability in visual processing or automatizing, and are caused by the presence of the abovementioned altered brain activity. Japanese, as mentioned above, is composed of two kinds of characters, kana (i.e. hiragana and katakana collectively termed kana) and kanji. Whereas most of the difficulty in processing kanji is also derived from weak phonological awareness like kana, some difficulties stem from other cognitive impairments such as rapid automatization as described in the double deficit theory (Wolf and Bowers, 1999), a lexical process from the dual route cascade model (Coltheart et al., 2001), deficits in visual cognitive processing (Stein and Walsh, 1997), and automaticity from cerebellar problems (Nicolson and Fawcett, 2005). The present study focused on dyslexic children who have problems in reading kana and have not acquired basic skills for learning kanji, a more advanced step in Japanese. The detailed relationship between processing kana and kanji remain unclear. Further study is expected to reveal neurological diversity between dyslexic Japanese children compared with acquired dyslexia, which has broad subtypes such as kana- or kanji-specific dyslexia.
Limitations and conclusions
Some technical points may be improved in further studies. A small number of subjects participated in the present study. We also excluded data of typically developing and dyslexic children in our analyses because of motion artefact during functional MRI scanning. Still, the present study provided initial findings for phonological manipulation in dyslexic Japanese children in which the prevalence of the disorder is quite low. Also, we did not set experimental conditions that required the subjects to use their auditory working memory as previously described. The additional condition may have revealed the role of specific brain regions identified by previous studies in countries speaking alphabetical languages and compared the findings in the view of language differences. With these improvements and the present findings, we also strictly divided the different functions between phonological manipulation and auditory working memory.
In conclusion, we developed and conducted phonological manipulation tasks on Japanese adults, typically developing children, and dyslexic children, by taking advantage of the linguistic characteristics of Japanese to minimize the effect of auditory working memory. During phonological manipulation, several brain regions participated, such as the left inferior and middle frontal gyri, left superior temporal gyrus, and bilateral basal ganglia. Dyslexic children showed altered activity in two brain regions. They had unnecessary hyperactivity in the basal ganglia which may reflect their inefficient phonological processing, and also showed hypoactivity in the left superior temporal gyrus, implying difficulty in composing and processing phonological information. The atypically altered brain activity is thought to be one of the impaired functions in dyslexic Japanese children.
Supplementary Material
Acknowledgements
The authors would like to thank Dr. Takaaki Goto, Dr. Daisuke Tanaka, Ms. Yuko Okamoto, and Ms. Rina Inagaki for their faithful assistance.
Glossary
Abbreviations
- CRP
correct order picture
- CRW
correct order word
- NNP
non-picture
- NNW
non-word
- RDP
random order picture
- RDW
random order word
Funding
This work was supported in part by an Intramural Research Grant (22-6; Clinical Research for Diagnostic and Therapeutic Innovations in Developmental Disorders) for Neurological and Psychiatric Disorders of NCNP and a Grant-in-Aid for JSPS Fellows (23-10284 to Y.K.).
Supplementary material
Supplementary material is available at Brain online.
References
- Bitan T, Burman DD, Chou TL, Lu D, Cone NE, Cao F, et al. The interaction between orthographic and phonological information in children: an fMRI study. Hum Brain Mapp. 2007;28:880–91. doi: 10.1002/hbm.20313. [DOI] [PMC free article] [PubMed] [Google Scholar]
- Booth JR, Bebko G, Burman DD, Bitan T. Children with reading disorder show modality independent brain abnormalities during semantic tasks. Neuropsychologia. 2007;45:775–83. doi: 10.1016/j.neuropsychologia.2006.08.015. [DOI] [PMC free article] [PubMed] [Google Scholar]
- Booth JR, Wood L, Lu D, Houk JC, Bitan T. The role of the basal ganglia and cerebellum in language processing. Brain Res. 2007;1133:136–44. doi: 10.1016/j.brainres.2006.11.074. [DOI] [PMC free article] [PubMed] [Google Scholar]
- Brunswick N, McCrory E, Price CJ, Frith CD, Frith U. Explicit and implicit processing of words and pseudowords by adult developmental dyslexics: a search for Wernicke’s Wortschatz? Brain. 1999;122:1901–17. doi: 10.1093/brain/122.10.1901. [DOI] [PubMed] [Google Scholar]
- Buchsbaum BR, Hickock G, Humphries C. Role of left posterior superior temporal gyrus in phonological processing for speech perception and production. Cogn Sci. 2001;25:663–78. [Google Scholar]
- Burton MW, Small SL, Blumstein SE. The role of segmentation in phonological processing: an fMRI investigation. J Cogn Neurosci. 2000;12:679–90. doi: 10.1162/089892900562309. [DOI] [PubMed] [Google Scholar]
- Chiappe P, Chiappe DL, Siegel LS. Speech perception, lexicality, and reading skill. J Exp Child Psychol. 2001;80:58–74. doi: 10.1006/jecp.2000.2624. [DOI] [PubMed] [Google Scholar]
- Chiu CY, Coen-Cummings M, Schmithorst VJ, Holland SK, Keith R, Nabors L, et al. Sound blending in the brain: a functional magnetic resonance imaging investigation. Neuroreport. 2005;16:883–6. doi: 10.1097/00001756-200506210-00002. [DOI] [PubMed] [Google Scholar]
- Coltheart M, Rastle K, Perry C, Langdon R, Ziegler J. DRC: a dual route cascaded model of visual word recognition and reading aloud. Psychol Rev. 2001;108:204–56. doi: 10.1037/0033-295x.108.1.204. [DOI] [PubMed] [Google Scholar]
- Cohen L, Jobert A, Le Bihan D, Dehaene S. Distinct unimodal and multimodal regions for word processing in the left temporal cortex. Neuroimage. 2004;23:1256–70. doi: 10.1016/j.neuroimage.2004.07.052. [DOI] [PubMed] [Google Scholar]
- De Diego-Balaguer R, Couette M, Dolbeau G, Durr A, Youssov K, Bachoud-Levi AC. Striatal degeneration impairs language learning: evidence from Huntington’s disease. Brain. 2008;131:2870–81. doi: 10.1093/brain/awn242. [DOI] [PMC free article] [PubMed] [Google Scholar]
- Demonet JF, Chollet F, Ramsay S, Cardebat D, Nespoulous JL, Wise R, et al. The anatomy of phonological and semantic processing in normal subjects. Brain. 1992;115:1753–68. doi: 10.1093/brain/115.6.1753. [DOI] [PubMed] [Google Scholar]
- DeWitt I, Rauschecker JP. Phoneme and word recognition in the auditory ventral stream. Proc Natl Acad Sci USA. 2012;109:E505–14. doi: 10.1073/pnas.1113427109. [DOI] [PMC free article] [PubMed] [Google Scholar]
- Doupe AJ, Kuhl PK. Birdsong and human speech: common themes and mechanisms. Annu Rev Neurosci. 1999;22:567–631. doi: 10.1146/annurev.neuro.22.1.567. [DOI] [PubMed] [Google Scholar]
- Friederici AD. What’s in control of language? Nat Neurosci. 2006;9:991–2. doi: 10.1038/nn0806-991. [DOI] [PubMed] [Google Scholar]
- Friston KJ, Ashburner J, Kiebel SJ, Nichols TE, Penny WD. Statistical parametric mapping: The analysis of functional brain images. London: Academic Press; 2007. [Google Scholar]
- Frost R. Prelexical and postlexical strategies in reading: evidence from a deep and a shallow orthography. J Exp Psychol Learn Mem Cogn. 1994;20:116–29. doi: 10.1037//0278-7393.20.1.116. [DOI] [PubMed] [Google Scholar]
- Hattori J, Kato Y, Yamaguchi K, Mizuno T, Nakamura N. The validity of the Rey-Osterrieth Complex Figure Test as a means of evaluating the development of Japanese children’s visual cognitive competence (in Japanese) Bulletin of Aichi Prefectural College of Nursing & Health. 2000;6:19–25. [Google Scholar]
- Humphreys MS, Revelle W. Personality, motivation, and performance: a theory of the relationship between individual differences and information processing. Psychol Rev. 1984;91:153–84. [PubMed] [Google Scholar]
- Kaneko M, Uno A, Kaga M, Matsuda H, Inagaki M, Haruhara N. Cognitive neuropsychological and regional cerebral blood flow study of a developmentally dyslexic Japanese child. J Child Neurol. 1998;13:457–61. doi: 10.1177/088307389801300909. [DOI] [PubMed] [Google Scholar]
- Kita Y, Kobayashi T, Koike T, Koeda T, Wakamiya E, Hosokawa T, et al. Relationship between clinical symptoms and Hiragana reading ability in children with difficulties in reading and writing: usefulness of a clinical-symptoms-checklist (in Japanese) No To Hattatsu. 2010;42:437–42. [PubMed] [Google Scholar]
- Kobayashi T, Inagaki M, Gunji A, Yatabe K, Kaga M, Goto T, et al. Developmental changes in reading ability of Japanese Elementary School Children—analysis of 4 kana reading tasks - (in Japanese) No To Hattatsu. 2010;42:15–21. [PubMed] [Google Scholar]
- Kobayashi T, Inagaki M, Gunji A, Yatabe K, Kita Y, Kaga M, et al. Developmental changes of rapid automatized naming and Hiragana reading of Japanese in elementary-school children (in Japanese) No To Hattatsu. 2011;43:465–70. [PubMed] [Google Scholar]
- Lacadie CM, Fulbright RK, Rajeevan N, Constable RT, Papademetris X. More accurate Talairach coordinates for neuroimaging using non-linear registration. Neuroimage. 2008 doi: 10.1016/j.neuroimage.2008.04.240. 15; 42: 717–25. [DOI] [PMC free article] [PubMed] [Google Scholar]
- Liberman IY. Segmentation of the spoken word and reading acquisition. Bull Orton Soc. 1973;23:65–77. [Google Scholar]
- Liegeois F, Baldeweg T, Connelly A, Gadian DG, Mishkin M, Vargha-Khadem F. Language fMRI abnormalities associated with FOXP2 gene mutation. Nat Neurosci. 2003;6:1230––7. doi: 10.1038/nn1138. [DOI] [PubMed] [Google Scholar]
- Makita K. The rarity of reading disability in Japanese children. Am J Orthopsychiatry. 1968;38:599–614. doi: 10.1111/j.1939-0025.1968.tb02428.x. [DOI] [PubMed] [Google Scholar]
- McCandliss BD, Cohen L, Dehaene S. The visual word form area: expertise for reading in the fusiform gyrus. Trends Cogn Sci. 2003;7:293–9. doi: 10.1016/s1364-6613(03)00134-7. [DOI] [PubMed] [Google Scholar]
- Muter V, Hulme C, Snowling M, Taylor S. Segmentation, not rhyming, predicts early progress in learning to read. J Exp Child Psychol. 1998;71:3–27. doi: 10.1006/jecp.1998.2453. [DOI] [PubMed] [Google Scholar]
- Nicolson RI, Fawcett AJ. Developmental dyslexia, learning and the cerebellum. J Neural Transm Suppl. 2005:19–36. doi: 10.1007/3-211-31222-6_2. [DOI] [PubMed] [Google Scholar]
- Ogino T, Takahashi Y, Hanafusa K, Watanabe K, Morooka T, Takeuchi A, et al. Reading skills of Japanese second-graders. Pediatr Int. 2011;53:309–14. doi: 10.1111/j.1442-200X.2010.03229.x. [DOI] [PubMed] [Google Scholar]
- Osterrieth PA. Le test de copie d’une figure complex: Contribution a l’etude de la perception et de la memoire. Archives de Psychologie. 1944;30:206–356. [Google Scholar]
- Paap KR, Noel RW. Dual-route models of print to sound: Still a good horse race. Psychological Research/Psychologische Forschung. 1991;53:13–24. [Google Scholar]
- Paulesu E, Demonet JF, Fazio F, McCrory E, Chanoine V, Brunswick N, et al. Dyslexia: cultural diversity and biological unity. Science. 2001;291:2165–7. doi: 10.1126/science.1057179. [DOI] [PubMed] [Google Scholar]
- Paulesu E, Frith U, Snowling M, Gallagher A, Morton J, Frackowiak RS, et al. Is developmental dyslexia a disconnection syndrome? Evidence from PET scanning. Brain. 1996;119:143–57. doi: 10.1093/brain/119.1.143. [DOI] [PubMed] [Google Scholar]
- Perea M, Pérez E. Beyond alphabetic orthographies: the role of form and phonology in transposition effects in Katakana. Lang Cogn Processes. 2009;24:67–88. [Google Scholar]
- Pickett ER, Kuniholm E, Protopapas A, Friedman J, Lieberman P. Selective speech motor, syntax and cognitive deficits associated with bilateral damage to the putamen and the head of the caudate nucleus: a case study. Neuropsychologia. 1998;36:173–88. doi: 10.1016/s0028-3932(97)00065-1. [DOI] [PubMed] [Google Scholar]
- Preston JL, Frost SJ, Mencl WE, Fulbright RK, Landi N, Grigorenko E, et al. Early and late talkers: school-age language, literacy and neurolinguistic differences. Brain. 2010;133:2185–95. doi: 10.1093/brain/awq163. [DOI] [PMC free article] [PubMed] [Google Scholar]
- Pugh KR, Mencl WE, Jenner AR, Lee JR, Katz L, Frost SJ, et al. Neuroimaging studies of reading development and reading disability. Learn Disabil Res Prac. 2001;16:240–9. doi: 10.1002/1098-2779(2000)6:3<207::AID-MRDD8>3.0.CO;2-P. [DOI] [PubMed] [Google Scholar]
- Ramus F. Outstanding questions about phonological processing in dyslexia. Dyslexia. 2001;7:197–216. doi: 10.1002/dys.205. [DOI] [PubMed] [Google Scholar]
- Raven JC. Coloured progressive matrices: sets A, Ab, B. Oxford: OPP Ltd; 1976. [Google Scholar]
- Research Group for Formulation of Diagnostic Criteria and Medical Guideline for Specific Developmental Disorders, editors. Diagnostic Criteria and Medical Guideline for Specific Developmental Disorders [in Japanese]. Tokyo: ShindanToChiryosha; 2010.
- Sakurai Y, Yagishita A, Goto Y, Ohtsu H, Mannen T. Fusiform type alexia: pure alexia for words in contrast to posterior occipital type pure alexia for letters. J Neurol Sci. 2006;247:81–92. doi: 10.1016/j.jns.2006.03.019. [DOI] [PubMed] [Google Scholar]
- Sakurai Y, Terao Y, Ichikawa Y, Ohtsu H, Momose T, Tsuji S, et al. Pure alexia for kana. Characterization of alexia with lesions of the inferior occipital cortex. J Neurol Sci. 2008;268:48–59. doi: 10.1016/j.jns.2007.10.030. [DOI] [PubMed] [Google Scholar]
- Seki A, Kassai K, Uchiyama H, Koeda T. Reading ability and phonological awareness in Japanese children with dyslexia. Brain Dev. 2008;30:179–88. doi: 10.1016/j.braindev.2007.07.006. [DOI] [PubMed] [Google Scholar]
- Seki A, Okada T, Koeda T, Sadato N. Phonemic manipulation in Japanese: an fMRI study. Brain Res Cogn Brain Res. 2004;20:261–72. doi: 10.1016/j.cogbrainres.2004.03.012. [DOI] [PubMed] [Google Scholar]
- Shaywitz BA, Shaywitz SE, Blachman BA, Pugh KR, Fulbright RK, Skudlarski P, et al. Development of left occipitotemporal systems for skilled reading in children after a phonologically- based intervention. Biol Psychiatry. 2004;55:926–33. doi: 10.1016/j.biopsych.2003.12.019. [DOI] [PubMed] [Google Scholar]
- Shaywitz BA, Shaywitz SE, Pugh KR, Mencl WE, Fulbright RK, Skudlarski P, et al. Disruption of posterior brain systems for reading in children with developmental dyslexia. Biol Psychiatry. 2002;52:101–10. doi: 10.1016/s0006-3223(02)01365-3. [DOI] [PubMed] [Google Scholar]
- Shaywitz SE. Dyslexia. N Engl J Med. 1998;338:307–12. doi: 10.1056/NEJM199801293380507. [DOI] [PubMed] [Google Scholar]
- Shaywitz SE, Shaywitz BA. Dyslexia (specific reading disability) Biol Psychiatry. 2005;57:1301–9. doi: 10.1016/j.biopsych.2005.01.043. [DOI] [PubMed] [Google Scholar]
- Shaywitz SE, Shaywitz BA, Pugh KR, Fulbright RK, Constable RT, Mencl WE, et al. Functional disruption in the organization of the brain for reading in dyslexia. Proc Natl Acad Sci USA. 1998;95:2636–41. doi: 10.1073/pnas.95.5.2636. [DOI] [PMC free article] [PubMed] [Google Scholar]
- Shin MS, Park SY, Park SR, Seol SH, Kwon JS. Clinical and empirical applications of the Rey-Osterrieth Complex Figure Test. Nat Protoc. 2006;1:892–9. doi: 10.1038/nprot.2006.115. [DOI] [PubMed] [Google Scholar]
- Stahl SA, Murray BA. Defining phonological awareness and its relation- ship to early reading. J Educ Psychol. 1994;86:221–34. [Google Scholar]
- Stein J, Walsh V. To see but not to read; the magnocellular theory of dyslexia. Trends Neurosci. 1997;20:147–52. doi: 10.1016/s0166-2236(96)01005-3. [DOI] [PubMed] [Google Scholar]
- Talairach J, Tournoux P. Co-planar stereotaxic atlas of the human brain. New York: Thieme; 1988. [Google Scholar]
- Temple E, Poldrack RA, Salidis J, Deutsch GK, Tallal P, Merzenich MM, et al. Disrupted neural responses to phonological and orthographic processing in dyslexic children: an fMRI study. Neuroreport. 2001;12:299–307. doi: 10.1097/00001756-200102120-00024. [DOI] [PubMed] [Google Scholar]
- Tokyo Metropolitan Institute of Gerontology, NTT Communication Science Laboratories, editors. NTT Database Series - Lexical Properties of Japanese- Volume 8: Word Imageability. Tokyo: Sanseido; 2005.
- Tsumoto S. Computational analysis of acquired dyslexia of kanji characters based on conventional and rough neural networks. In: Pal SK, Polkowski L, Skowron A, editors. Rough-neural computing: techniques for computing with words. New York: Springer Berlin Heidelberg; 2004. pp. 637–48. [Google Scholar]
- Ullman MT, Pierpont EI. Specific language impairment is not specific to language: the procedural deficit hypothesis. Cortex. 2005;41:399–433. doi: 10.1016/s0010-9452(08)70276-4. [DOI] [PubMed] [Google Scholar]
- Wise RJS, Chollet F, Hadar U, Friston K, Hoffner E, Frackowiak R. Distribution of cortical neural networks involved in word comprehension and word retrieval. Brain. 1991;114:1803–17. doi: 10.1093/brain/114.4.1803. [DOI] [PubMed] [Google Scholar]
- Wolf M, Bowers PG. The double-deficit hypothesis for the developmental dyslexias. J Ed Psych. 1999;91:415–38. [Google Scholar]
- Wolf M, Bowers PG, Biddle K. Naming-speed processes, timing, and reading: a conceptual review. J Learn Disabil. 2000;33:387–407. doi: 10.1177/002221940003300409. [DOI] [PubMed] [Google Scholar]
- Wise RJ, Scott SK, Blank SC, Mummery CJ, Murphy K, Warburton EA. Separate neural sub-systems within “Wernicke’s area”. Brain. 2001;124:83–95. doi: 10.1093/brain/124.1.83. [DOI] [PubMed] [Google Scholar]
- World Health Organization. International statistical classification of diseases and related health problems 10th revision. Geneva: World Health Organization; 1994. [Google Scholar]
- Wydell TN, Butterworth B. A case study of an English-Japanese bilingual with monolingual dyslexia. Cognition. 1999;70:273–305. doi: 10.1016/s0010-0277(99)00016-5. [DOI] [PubMed] [Google Scholar]
- Yopp HK. The validity and reliability of phonemic awareness tests. Read Res Q. 1988;23:159–77. [Google Scholar]
- Yopp HK. Developing phonemic awareness in young children. Read Teach. 1992;45:696–703. [Google Scholar]
- Yopp HK. A test for assessing phonemic awareness in young children. Read Teach. 1995;49:20–9. [Google Scholar]
- Zatorre RJ, Evans AC, Meyer E, Gjedde A. Lateralization of phonetic and pitch discrimination in speech processing. Science. 1992;256:846–9. doi: 10.1126/science.1589767. [DOI] [PubMed] [Google Scholar]
- Zatorre RJ, Meyer E, Gjedde A, Evans AC. PET studies of phonetic processing of speech: review, replication, and reanalysis. Cereb Cortex. 1996;6:21–30. doi: 10.1093/cercor/6.1.21. [DOI] [PubMed] [Google Scholar]
Associated Data
This section collects any data citations, data availability statements, or supplementary materials included in this article.