

Summary
We show here that singular loss of the Bright/Arid3A transcription factor leads to reprograming of mouse embryonic fibroblasts (MEFs) and enhancement of standard four-factor (4F) reprogramming. Bright-deficient MEFs bypass senescence and, under standard embryonic stem cell (ESC) culture conditions, spontaneously form clones that in vitro express pluripotency markers, differentiate to all germ lineages, and in vivo form teratomas and chimeric mice. We demonstrate that BRIGHT binds directly to the promoter/enhancer regions of Oct4, Sox2, and Nanog to contribute to their repression in both MEFs and ESCs. Thus, elimination of the BRIGHT barrier may provide an approach for somatic cell reprogramming.
Highlights
-
•
Loss of Bright can alone reprogram or enhance conventional four-factor reprogramming
-
•
Bright directly represses Oct4, Sox2, and Nanog
-
•
Bright may function in somatic and embryonic stem cells to enforce differentiation
Popowski et al. show that loss of the transcription factor Bright/Arid3A induces reprogramming in mouse embryonic fibroblasts (MEFs) and enhancement of standard four-factor reprograming. Bright-deficient reprogrammed cells express all pluripotency markers and are capable of forming teratomas and chimeric mice. Bright binds directly to the promoter/enhancer regions of Oct4, Sox2, and Nanog and contributes to their repression in both MEFs and embryonic stem cells.
Introduction
Cellular reprogramming from a differentiated state to a pluripotent state is an important tool for studying early development, modeling disease states, and investigating regulatory mechanisms underlying pluripotency. Enforced expression of combinations of core pluripotency-related factors in somatic cells can generate induced pluripotent stem cells (iPSCs) from a range of cell types (Anokye-Danso et al., 2011; Takahashi and Yamanaka, 2006). While iPSCs hold great promise for regenerative medicine, their efficient production is inhibited by several pathways, including lineage-specific transcription factors (Ichida et al., 2009; Li et al., 2009) and targets of the mir-34 and Let-7 family of microRNAs (Choi et al., 2011; Melton et al., 2010). Conversely, loss of p53/p21 (Kawamura et al., 2009) or overexpression of hTERT (Mathew et al., 2010) or SV40T antigen (Yu et al., 2009) can increase conventional reprogramming, largely through bypass of cellular senescence.
Bright/Arid3A is the founding member of the ARID family of transcriptions factors (Herrscher et al., 1995; Wilsker et al., 2002) and is required for hematopoietic stem cell differentiation and B cell development (Webb et al., 2011). Several somatic cell types from rare survivors of conventional Bright knockout (KO) mice were developmentally plastic, with the capacity to differentiate into multiple lineages (An et al., 2010). This plasticity was accompanied by enhanced expression of SOX2 and NANOG; however, the clones did not fulfill in vivo requirements for pluripotency.
These results prompted the hypothesis that Bright deficiency may stimulate somatic cell reprogramming. Here, we show that Bright transcription-factor-deficient mouse embryonic fibroblasts (MEFs) are enhanced for standard four-factor (4F) reprogramming and are capable of spontaneously forming stable embryonic stem-like cells. We demonstrate that BRIGHT binds directly to the promoter/enhancer regions of Oct4, Sox2, and Nanog to contribute to their repression in somatic and embryonic stem cells (ESCs).
Results
To address the potential mechanism underlying the plasticity of Bright-deficient somatic cells, we compared MEFs derived from Bright KO embryos (KO-MEFs) to sibling wild-type MEFs (WT-MEFs). KO-MEFs were morphologically similar to WT-MEFs but grew at a slower rate (Figure 1A). Further, they bypassed senescence (Figure 1B) and retained the capacity for self-renewal for more than 24 weeks (data not shown)—properties associated with stem cells. Global gene expression analyses indicated that KO- and WT-MEFs did not differ among gene signatures associated with ESC identity, including ESC core, c-MYC, PRC, and bivalently marked promoters (H3K4m3 and H3K27m3) (Bernstein et al., 2006; Kim et al., 2010) (Figure S1A available online). However, Gene Ontology analyses of global microarray data demonstrated that KO-MEFs had activated some pathways suggestive of a more plastic genetic state (Figure S1B). These data suggest that KO-MEFs might have overcome some of the hurdles to reprogramming.
Figure 1.
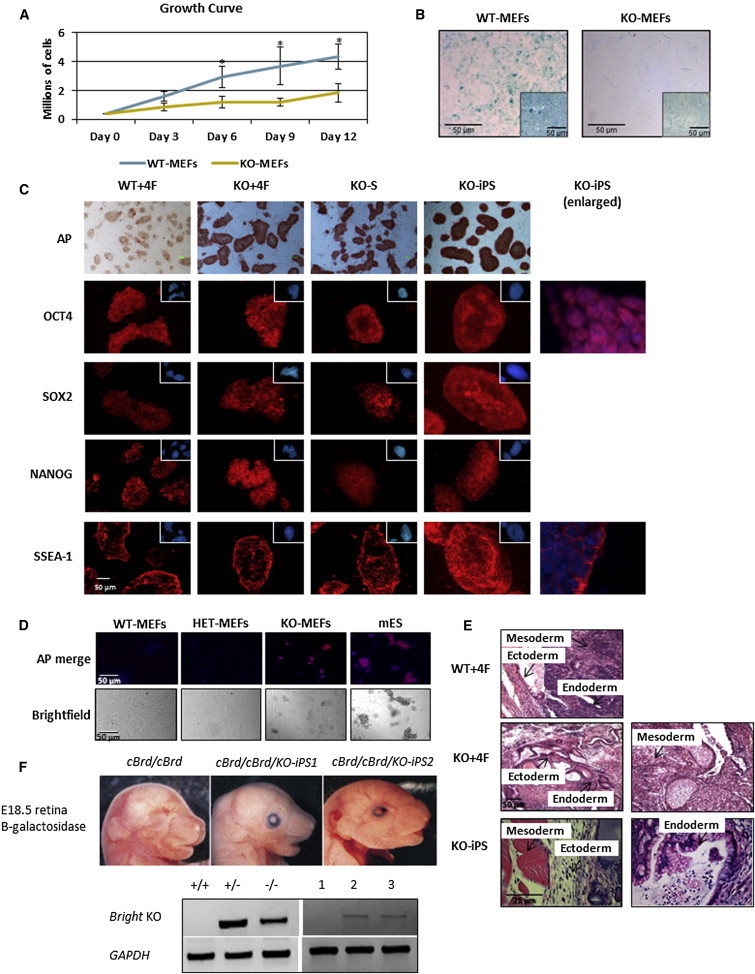
Bright−/− Mouse Embryonic Fibroblasts Bypass Senescence and Undergo Spontaneous Reprogramming
(A) Growth curves of KO-MEFs and WT-MEFs; n = 4 biological replicates; error bars show the SD. Asterisks denote statistical significance (p ≤ 0.1), as determined by Student’s t test.
(B) Senescence of WT-MEFs and KO-MEFs following <15 (WT-MEFs) and >50 (KO-MEFs) population doublings as measured by acidic β-galactosidase (blue) staining; images 20×; insets of unstained cells 10×.
(C) Immunocytochemistry (ICC) of conventional mESC markers of four-factor (4F) reprogrammed WT-MEFs (WT+4F), KO-MEFs (KO+4F), KO-MEFs without Sox2 (KO-S), and spontaneous KO-MEF colonies (KO-iPS). Insets are corresponding nuclear DAPI stains. Enlarged images of DAPI and ICC overlays of OCT4 and SSEA demonstrate appropriate localization.
(D) KO-MEFs form spontaneous alkaline phosphatase (AP)-positive colonies under standard fibroblast culture conditions. Above: merged image with AP, red; DAPI, blue. Below: bright-field, images at 10×.
(E) WT+4F, KO+4F, and KO-iPS form teratomas. The three germ layers are indicated.
(F) KO-iPS form chimeric mice. Independent Bright−/− reprogrammed C57BL/6 iPSC lines (KO-iPS1 and KO-iPS2) were injected into embryonic day 3.5 (E3.5) C57BL/6-cBrd/cBrd/Cr blastocysts. Upper: chimerism within E18.5 retina detected via expression of KO construct-associated β-galactoside activity by LacZ staining of whole-mount embryos. Lower: transfer of the Bright null allele was identified in tail preparations by the production of a 408 bp PCR product with Bright-specific and NeoR cassette primers (upper lanes); Gapdh (lower lanes) served as a loading control.
To test their potential to reprogram, WT- and KO-MEFs were transfected with standard 4F (Oct4, Sox2, Klf4, and c-Myc) lentiviral constructs. KO-MEFs (KO+4F) reprogrammed colonies developed 7–10 days earlier and more efficiently (15- to 40-fold) than WT-MEFs (WT+4F) in five independent experiments (Table S1). KO+4F gave rise to stable iPSC-like clones as defined by their ability to undergo more than four passages, to form embryoid bodies (EBs) that differentiate into all germline lineages, and to express pluripotency markers at similar levels to those observed in WT+4F clones (Table S1; Figure 1C; Figure S1C). Unlike WT-MEFs, KO-MEFs were able to bypass the requirement for Sox2 (KO-S) and Klf4 (KO-K), although they produced fewer stable clones than KO+4F clones (Table S1; Figure 1C). Consistent with the observations of KO-MEFs, reducing BRIGHT levels in WT-MEFs ectopically by small hairpin RNA (shRNA) knockdown (KD) followed by 4F lentiviral-mediated transfection (KD+4F) enhanced iPSC colony formation above that of WT+4F (Figures S1D–S1G).
We observed that KO-MEFs alone spontaneously formed alkaline phosphatase (AP)-positive colonies within 2 weeks in standard MEF culture conditions (Figure 1D). Upon culture in iPSC/mouse ESC (mESC) culture conditions, KO-MEFs underwent spontaneous reprogramming and formed stable clones within ∼4 weeks (KO-iPS; Table S1; Figures 1C and S1H). Comparisons of pluripotency marker expression (Figure 1C), in vitro differentiation capability (Figure S1C), and teratoma formation (Figure 1E; Table S2) suggested that not only the KO+4F and KO-S clones but also the KO-iPS were pluripotent. The parental KO-MEFs were unable to form either EBs via hanging drop culture or teratomas (Table S2; data not shown). Independently derived KO-iPS lines displayed normal karyotypes (data not shown) and were capable of contributing to the formation of germ lineages when introduced into preimplantation albino host embryos, as detected by expression of the β-galactosidase-marked Bright disrupted loci in embryonic day 18.5 (E18.5) retinas and by direct PCR detection of the disrupted locus in corresponding tail DNAs (Figure 1F). Thus, Bright KO-iPS are capable of contributing to chimeras in vivo, giving rise to retinal ectoderm and tail mesoderm.
Quantitative PCR (qPCR) arrays indicated that the absolute gene expression levels of pluripotency and differentiation-related genes of multiple, independent clones derived from KO-MEFs, either by standard reprogramming (KO+4F, KO-S) or spontaneous formation (KO-iPS), closely resemble mESC and WT+4F expression patterns (Figures 2A–2C, S2, and S3A–S3C). Consistent with this, CpG sites localized within 175 bp 5′ to the transcription start site (TSS) of Oct4 were completely demethylated in KO-iPS clones compared to both WT and KO-MEFs (Figure 2D). Global gene expression analysis confirmed that KO-iPS and mESCs were comparable with respect to upregulation of other conventional pluripotency genes (Figure 2E; Figures S3B and S3C) as well as expression of markers of early differentiation (Figure S3D). Global analyses further indicated that, of the few genes that have been previously observed to be differentially expressed between mESCs and epiblast stem cells (EpiSC) (De Miguel et al., 2010), KO-iPS have an intermediate gene expression pattern (Figure S3E). EpiSC are pluripotent cells, highly similar to mESCs, that are derived from the postimplantation epiblast and thus represent a later developmental stage (De Miguel et al., 2010).
Figure 2.
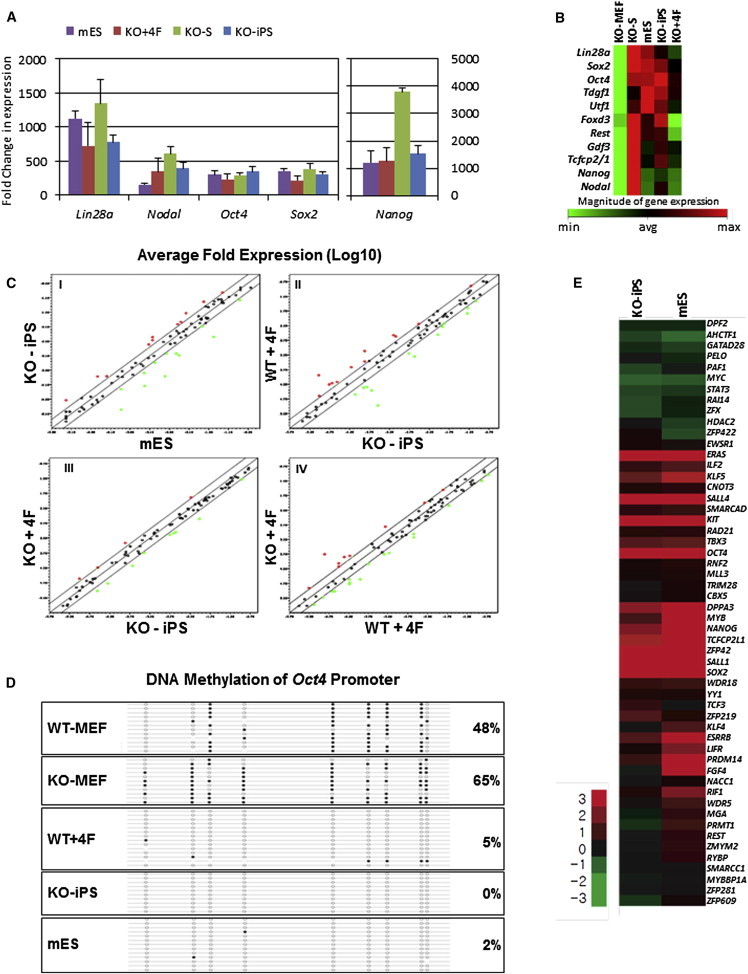
Mouse Embryonic Stem Cells and Reprogramed KO-MEF Lines Have Comparable Gene Expression Profiles
(A) qPCR array comparison of mESC expression to 4F reprogrammed KO-MEFs (KO+4F), KO-MEFs reprogrammed without Sox2 (KO-S), and spontaneous KO-MEF colonies (KO-iPS) expression. Absolute values are calculated from the average values of multiple, independent clones (shown in Figure S2) as fold-change relative to WT-MEFs (please see Supplemental Experimental Procedures for details); error bars show the SD.
(B) Heatmap of selected pluripotency factors (from full data set of Figure S2) showing average magnitudes of multiple clones.
(C) Scatterplot comparisons of qPCR array data are shown for (I) KO-iPS versus mESCs, (II) WT+4F versus KO-iPS, (III) KO+4F versus KO-iPS, and (IV) KO+4F versus WT+4F. Diagonal lines show the zero axis and 2-fold differences in expression. Each circle represents the average fold change in normalized gene expression (log 10); red circles, overexpressed; green circles, underexpressed genes. Student’s t test of the replicate values for each gene was used to calculate p values; statistically different genes among each category pair are detailed in Figure S3A.
(D) Bisulfite sequencing of 175 bp 5′ of the transcriptional start site (TSS) of Oct4 in the indicated cell types. Filled circles represent methylated CpG positions; open circles represent unmethylated CpG positions.
(E) Representative heatmap of selected pluripotency factor expression levels from global array analyses of mESCs and KO-iPS, as compared to their expression in WT-MEFs.
See also Figures S2 and S3.
The above results led us to the hypothesis that BRIGHT may function as a transcriptional repressor of key pluripotency genes. Chromatin immunoprecipitation qPCR (ChIP-qPCR) performed on WT-MEFs showed that BRIGHT was recruited to the proximal promoter regions of Oct4, Sox2, and Nanog (Figure 3A). ChIP sequencing (ChIP-seq) confirmed these sites and identified additional BRIGHT binding within extended promoter regions (∼5 kb ± to respective TSSs; Figure 3B). We next probed subregions within the proximal promoters for BRIGHT binding by electrophoretic shift assay (EMSA). Within the Oct4 promoter, BRIGHT bound to both the proximal enhancer (PE) and to a region directly downstream (Bb) that contains several BRIGHT consensus motifs (Figures 3C and 3D) but to neither the distal enhancer (DE) nor the minimal promoter (MP; data not shown). The PE has been suggested to act as a target for Oct4 repression (Yeom et al., 1996). BRIGHT bound within the Sox2 promoter to the R1 enhancer (Figure 3E), a previously identified transactivation motif in cancer stem cells (Leis et al., 2012). BRIGHT bound within the Nanog promoter to an A/T-rich region ∼350 bp upstream of the start site (Figure 3F) that was shown as the site of OCT4/SOX2 binding (Kuroda et al., 2005). These data indicate that BRIGHT is capable of binding cis-acting regions previously shown to be key to core factor gene regulation.
Figure 3.
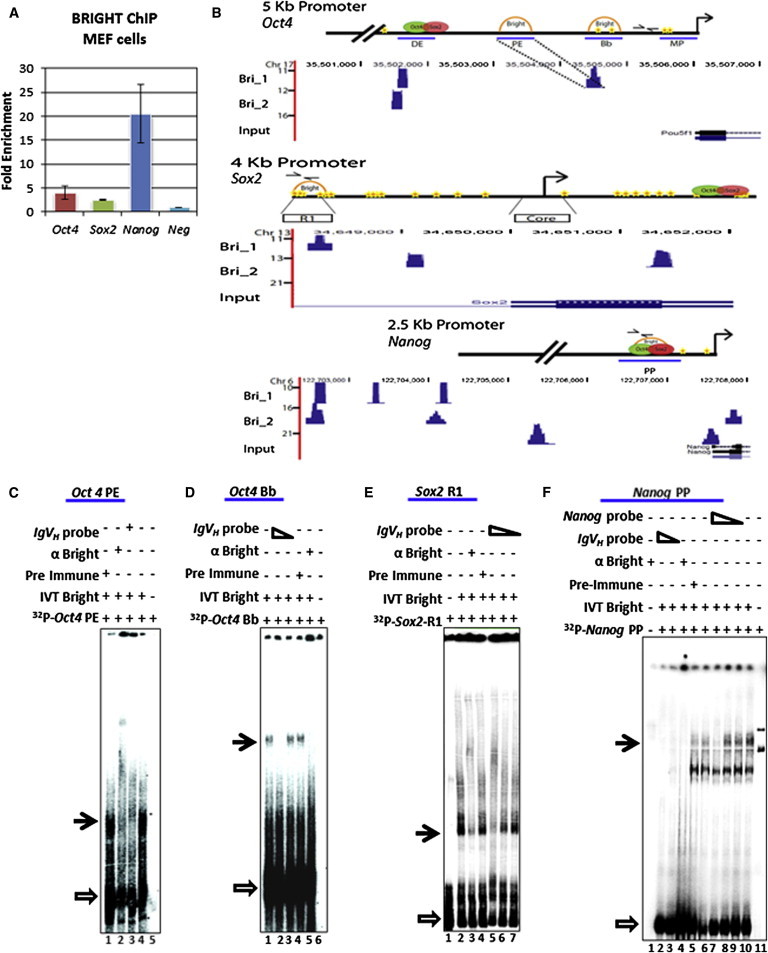
Bright Is Recruited to Promoter/Enhancer Regions of Key Pluripotency Transcription Factors
(A) Anti-BRIGHT ChIP-qPCR of WT-MEF chromatin, with primer pairs denoted in (B). n = 3 biological replicates. Error bars show the SD.
(B) Upper panels: schematics of the 5′ promoter regions of Oct4 (top), Sox2 (middle) and Nanog (bottom). Ovals, OCT4/SOX2binding sites (Chew et al., 2005; Rodda et al., 2005; Tomioka et al., 2002); stars, BRIGHT consensus binding motifs; semicircles, confirmed BRIGHT binding; arrows, ChIP primers; blue horizontal lines, EMSA probes; DE, PE, Bb, MP, R1, Core, PP denote specific binding areas of indicated promoter regions, described in (C) and Figure 4F. Lower panels: in vivo BRIGHT binding within the Oct4, Sox2, and Nanog loci (5 kb up- or downstream of corresponding TSSs), as determined by ChIP-seq in WT-MEFs in two independent experiments (Bri1 and Bri2). These data were scaled to the schematics, and dotted lines indicate BRIGHT ChIP-seq peaks confirmed by EMSA.
(C–F) Confirmation of direct BRIGHT binding in vitro by EMSA. (C) Recombinant BRIGHT binds to the proximal enhancer (PE) and to (D) the Bb region of Oct4; (E) to the R1 region of Sox2; and (F) to the proximal promoter (PP) region of Nanog. αBRIGHT, anti-BRIGHT polyclonal antibody; preimmune, sera collected prior to immunization; IVT BRIGHT, recombinant BRIGHT protein; IgVH, an established BRIGHT DNA binding motif from an immunoglobulin variable region promoter (Nixon et al., 2004). Black arrows denote specific complexes; empty arrows denotes free probe.
BRIGHT was previously identified by mass spectrometry (MS) as a secondary binding partner of enforced expression of NANOG in mESCs (Wang et al., 2006), but no follow-up analysis was performed. Employing coimmunoprecipitation in mESCs, we confirmed endogenous interactions of BRIGHT with NANOG as well as with OCT4 and SOX2 (Figure 4A). These data, along with our inability to detect any of these interactions when each was overexpressed pairwise in somatic cells (data not shown), prompted a parallel examination of BRIGHT function in mESCs. BRIGHT transcript expression increased significantly following in vitro differentiation, an inverse correlation with core factor expression (Figure 4B). Differentiation led to increased BRIGHT protein accumulation within the nuclear matrix (Figure 4C), the region shown to be the most active site of BRIGHT transcriptional activity (Zong et al., 2000). In mESCs, stable overexpression of BRIGHT at levels below those required to initiate differentiation (Figure S5A) led to its recruitment to Oct4, Sox2, and Nanog promoters (Figure 4D). Thus, reciprocal to what is observed for loss of BRIGHT in somatic cells, we reasoned that an increase in levels of BRIGHT, in association with ESC-specific interacting proteins, might repress core pluripotency factor transcription. Accordingly, the endogenous loci of Oct4, Sox2, and Nanog were downregulated following overexpression of BRIGHT in undifferentiated mESCs and in the mouse embryonic carcinoma cell line p19 (Figure 4E; Figure S4B). Employing luciferase reporters that contained the promoter/enhancer regions shown in Figure 3B, we observed strong repression following transient BRIGHT overexpression, regardless of the mESC differentiation state (Figure 4F; Figure S4C). These data indicate that BRIGHT directly represses transcription of core pluripotency factors and suggest a role for BRIGHT as an activator of differentiation.
Figure 4.
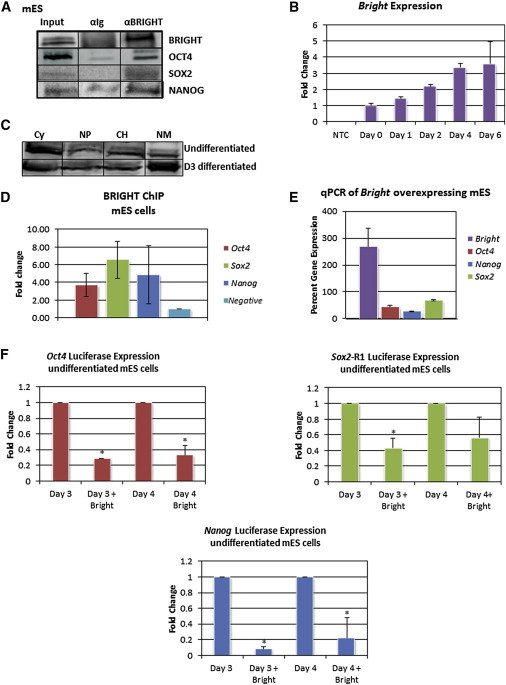
Bright Interacts with and Represses Transcription of Key Pluripotency Factors in mESCs
(A) Anti-BRIGHT coimmunoprecipitation in mESCs. Input, whole-cell lysate; αIg, preimmune serum; αBRIGHT, anti-BRIGHT polyclonal antibody.
(B) qPCR analysis of Bright endogenous expression in mESCs at the indicated days following removal from feeder cells and LIF in differentiating, adherent cultures. NTC, no template control. n = 3 biological replicates. Error bars show the SD.
(C) BRIGHT accumulates preferentially within mESC nuclear matrix during differentiation as shown by four-way fractionation/western blot analysis. Loading of equivalent protein in each fraction was confirmed (data not shown). CY, cytoplasm; NP, soluble nuclear; CH, chromatin; NM, nuclear matrix fractions.
(D) Anti-BRIGHT ChIP-qPCR of mESC chromatin following stable BRIGHT overexpression; primer pairs are denoted in Figure 3B. n = 3 biological replicates. Error bars show the SD.
(E) qPCR analysis of endogenous Oct4, Sox2, and Nanog transcripts in mESCs stably overexpressing BRIGHT relative to empty-vector control mESCs. n = 3 biological replicates. Error bars show the SD.
(F) Transient BRIGHT overexpression represses Oct4 (left), Nanog (below), and Sox2-R1 (right) promoter/enhancer-driven reporter expression. Luciferase reporters maintained the endogenous TSSs (Figure 3B, right angle arrows) for Oct4 and Nanog or the indicated section of the promoter (Figure 3B, open box) for Sox2. Three biological replicates performed with three technical replicates per experiment in which vector-only values were set to 1. Error bars show the SD. Asterisks denote statistical significance (p ≤ 0.1), as determined by Student’s t test.
See also Figure S4.
Discussion
We have demonstrated that complete loss of Bright expression in MEFs is alone sufficient for both induction of somatic cell reprogramming and for increased efficiency of conventional iPSC reprogramming. We suggest that at least three separate steps contribute to the mechanism by which Bright loss facilitates reprogramming.
First, Bright KO-MEFs are refractory to cellular senescence, promoting somatic self-renewal (Figure 1B). Telomere shortening and activation of Rb or p53 are key senescence-inducing factors (Zhao and Daley, 2008). Neither cell cycle nor signature transcripts of these families were significantly altered in KO-MEFs (data not shown). However, that BRIGHT interacts with and is activated by p53 (Lestari et al., 2012), a previously established barrier to reprogramming (Li et al., 2009), suggests that Bright loss bypasses senescence through a mechanism other than transcriptional derepression of pluripotency factors, alleviating the requirement for derepression as the initiating step to reprogramming. Unlike loss or mutation of p53, Bright KO-MEFs do not undergo genomic instability at a level detectable by karyotype (data not shown).
Second, loss of Bright leads to direct derepression of key regulators of pluripotency. This conclusion is supported by our observations that (1) BRIGHT upregulation and nuclear matrix localization (Figures 4B and 4C) accompany mESC differentiation and the well-established downregulation of OCT4, SOX2, and NANOG in mESCs (De Miguel et al., 2010), (2) BRIGHT is recruited to promoter/enhancer regions of these factors in MEFs and mESCs (Figures 3A and 4D), and (3) BRIGHT overexpression in mESCs represses both endogenous loci and reporter transcription of Oct4, Sox2, and Nanog (Figures 4E and 4F). Loss of BRIGHT repression, in conjunction with activation of the leukemia-inhibitory factor (LIF) signaling pathway, may be key to BRIGHT-mediated reprogramming.
Third, loss of Bright in MEFs might disrupt signaling pathways shown to antagonize pluripotency through core factor repression. One such pathway, Activin/TGF-β, is upstream of BRIGHT in human lung (Lin et al., 2008) and in Xenopus gastrulation, where BRIGHT is required for mesoderm differentiation (Callery et al., 2005). Likely additional, as-yet-uncharacterized signal pathways are altered by loss of Bright following transfer of KO-MEFs to LIF-augmented cultures. These data further suggest that a normal function of BRIGHT is to promote and maintain cell differentiation.
Why ectopic BRIGHT knockdown was capable of stimulating reprogramming by the conventional 4F method but not singularly is unclear. While BRIGHT levels in MEFs are modest compared to hematopoietic tissues (Webb et al., 2011), we were only able to achieve ∼75% reduction in transcript levels (Figure S1E). It is probable that the residual BRIGHT remaining under our best-optimized conditions was sufficient to prevent minimally required pluripotency gene derepression. We are currently employing CRISPR technology in an effort to achieve absolute ectopic elimination and to determine if the difference is a trivial issue of dosage or an inherited state of Bright-deficient mesenchymal progenitors.
We show here that loss of Bright increases standard reprogramming and can spontaneously lead to robust dedifferentiation to a pluripotent state. Bright functions, in part, through direct repression of key pluripotency factors, implicating Bright as a potentially key regulatory factor during cell-fate decisions and maintenance of a differentiated state. The potential for translating BRIGHT reduction/loss of function into a medically relevant technology faces additional hurdles. While Bright KO-iPS readily form teratomas in vitro and contribute to chimeras in vivo (Figures 1E and 1F), we have yet to achieve germline transmission from the chimeric mice. This may result from the relatively low levels of chimerism and/or from the restricted lineage contribution (Figure 1F). A potential contributor to low chimerism efficiency is the intermediate EpiSC gene expression pattern of KO-iPS (Figures S2F and S3E). While ESCs form chimeras in preimplantation blastocysts, EpiSCs efficiently contribute to chimeras only in postimplantation embryos (Huang et al., 2012), indicating that both pluripotent cell types require specific developmental conditions in order to properly differentiate.
Experimental Procedures
Mice were used with institutional approval and within review board-specified guidelines. Details of all experiments are provided in Supplemental Experimental Procedures. ESCs and iPSCs were grown on STO or WT-MEF feeder cells mitotically inactivated with mitomycin C with or without 10 ng/ml LIF. Cellular senescence was determined in subconfluent cultures by acidic β-galactosidase activity. Reprogramming was performed with tetracycline-inducible vectors as previously described (Takahashi and Yamanaka, 2006). Chimeras were constructed and analyzed as described elsewhere (Webb et al., 2011) through injection of KO-iPS into cBrd/cBrd blastocysts with germline transmission confirmed by β-galactosidase staining and tail-clip PCR. Global microarray analyses employed Nimblegen chips and were analyzed using Java Treeview and DAVID. Chromatin immunoprecipitation, EMSA, and subcellular fractionation were employed as described previously (Fujita and Wade, 2004; An et al., 2010; Zong et al., 2000).
Author Contributions
The project was conceptualized by C.F.W. and H.T. The manuscript was prepared by H.T., M.P., and C.F.W. MEF derivation, reprogramming, and teratoma experiments were performed by C.F.W., T.T., M.P., C.R., H.L., C.M., and J.D.D. Microarray experiments were performed by M.P. and B.L. Quantitative PCR arrays were performed by T.T. and C.M. DNA methylation was performed by S.O. and Y.B. ChIP was performed by M.P. and C.R. EMSA, immunoprecipitation, cell fractionation, and luciferase experiments were performed by M.P.
Acknowledgments
This work was funded by grants from the NIH (CA-31534, NHARP-003658-0149), Cancer Prevention Research Institute (CPRIT RP100612), and the Maria Betzner Morrow Endowment to H.T. and by an Oklahoma Center for Adult Stem Cell Research award to C.F.W. M.P. is a CPRIT scholar (CPRIT RP101501). We thank Chhaya Das, June Harriss, Maya Ghosh, Amrita Das, Charles Martin, Hongxia Liu, and Stephen Chiang for technical assistance and Jonghwan Kim for discussion and critical reading of the manuscript. We thank the CPRIT Core Facility Support group (CPRIT-RP120348) for assistance with ChIP sequencing library and sequencing.
Footnotes
This is an open-access article distributed under the terms of the Creative Commons Attribution-NonCommercial-No Derivative Works License, which permits non-commercial use, distribution, and reproduction in any medium, provided the original author and source are credited.
Contributor Information
Carol F. Webb, Email: carol-webb@omrf.org.
Haley Tucker, Email: haleytucker@austin.utexas.edu.
Accession Numbers
The NCBI Gene Expression Omnibus accession number for the data reported in this paper is GSE52692.
Supplemental Information
References
- An G., Miner C.A., Nixon J.C., Kincade P.W., Bryant J., Tucker P.W., Webb C.F. Loss of Bright/ARID3a function promotes developmental plasticity. Stem Cells. 2010;28:1560–1567. doi: 10.1002/stem.491. [DOI] [PMC free article] [PubMed] [Google Scholar]
- Anokye-Danso F., Trivedi C.M., Juhr D., Gupta M., Cui Z., Tian Y., Zhang Y., Yang W., Gruber P.J., Epstein J.A., Morrisey E.E. Highly efficient miRNA-mediated reprogramming of mouse and human somatic cells to pluripotency. Cell Stem Cell. 2011;8:376–388. doi: 10.1016/j.stem.2011.03.001. [DOI] [PMC free article] [PubMed] [Google Scholar]
- Bernstein B.E., Mikkelsen T.S., Xie X., Kamal M., Huebert D.J., Cuff J., Fry B., Meissner A., Wernig M., Plath K. A bivalent chromatin structure marks key developmental genes in embryonic stem cells. Cell. 2006;125:315–326. doi: 10.1016/j.cell.2006.02.041. [DOI] [PubMed] [Google Scholar]
- Callery E.M., Smith J.C., Thomsen G.H. The ARID domain protein dril1 is necessary for TGF(beta) signaling in Xenopus embryos. Dev. Biol. 2005;278:542–559. doi: 10.1016/j.ydbio.2004.11.017. [DOI] [PubMed] [Google Scholar]
- Chew J.-L., Loh Y.-H., Zhang W., Chen X., Tam W.-L., Yeap L.-S., Li P., Ang Y.-S., Lim B., Robson P., Ng H.H. Reciprocal transcriptional regulation of Pou5f1 and Sox2 via the Oct4/Sox2 complex in embryonic stem cells. Mol. Cell. Biol. 2005;25:6031–6046. doi: 10.1128/MCB.25.14.6031-6046.2005. [DOI] [PMC free article] [PubMed] [Google Scholar]
- Choi Y.J., Lin C.-P., Ho J.J., He X., Okada N., Bu P., Zhong Y., Kim S.Y., Bennett M.J., Chen C. miR-34 miRNAs provide a barrier for somatic cell reprogramming. Nat. Cell Biol. 2011;13:1353–1360. doi: 10.1038/ncb2366. [DOI] [PMC free article] [PubMed] [Google Scholar]
- De Miguel M.P., Fuentes-Julián S., Alcaina Y. Pluripotent stem cells: origin, maintenance and induction. Stem Cell Rev. 2010;6:633–649. doi: 10.1007/s12015-010-9170-1. [DOI] [PubMed] [Google Scholar]
- Fujita N., Wade P.A. Use of bifunctional cross-linking reagents in mapping genomic distribution of chromatin remodeling complexes. Methods. 2004;33:81–85. doi: 10.1016/j.ymeth.2003.10.022. [DOI] [PubMed] [Google Scholar]
- Herrscher R.F., Kaplan M.H., Lelsz D.L., Das C., Scheuermann R., Tucker P.W. The immunoglobulin heavy-chain matrix-associating regions are bound by Bright: a B cell-specific trans-activator that describes a new DNA-binding protein family. Genes Dev. 1995;9:3067–3082. doi: 10.1101/gad.9.24.3067. [DOI] [PubMed] [Google Scholar]
- Huang Y., Osorno R., Tsakiridis A., Wilson V. In vivo differentiation potential of epiblast stem cells revealed by chimeric embryo formation. Cell Rep. 2012;2:1571–1578. doi: 10.1016/j.celrep.2012.10.022. [DOI] [PubMed] [Google Scholar]
- Ichida J.K., Blanchard J., Lam K., Son E.Y., Chung J.E., Egli D., Loh K.M., Carter A.C., Di Giorgio F.P., Koszka K. A small-molecule inhibitor of tgf-β signaling replaces sox2 in reprogramming by inducing nanog. Cell Stem Cell. 2009;5:491–503. doi: 10.1016/j.stem.2009.09.012. [DOI] [PMC free article] [PubMed] [Google Scholar]
- Kawamura T., Suzuki J., Wang Y.V., Menendez S., Morera L.B., Raya A., Wahl G.M., Izpisúa Belmonte J.C. Linking the p53 tumour suppressor pathway to somatic cell reprogramming. Nature. 2009;460:1140–1144. doi: 10.1038/nature08311. [DOI] [PMC free article] [PubMed] [Google Scholar]
- Kim J., Woo A.J., Chu J., Snow J.W., Fujiwara Y., Kim C.G., Cantor A.B., Orkin S.H. A Myc network accounts for similarities between embryonic stem and cancer cell transcription programs. Cell. 2010;143:313–324. doi: 10.1016/j.cell.2010.09.010. [DOI] [PMC free article] [PubMed] [Google Scholar]
- Kuroda T., Tada M., Kubota H., Kimura H., Hatano S.Y., Suemori H., Nakatsuji N., Tada T. Octamer and Sox elements are required for transcriptional cis regulation of Nanog gene expression. Mol. Cell. Biol. 2005;25:2475–2485. doi: 10.1128/MCB.25.6.2475-2485.2005. [DOI] [PMC free article] [PubMed] [Google Scholar]
- Leis O., Eguiara A., Lopez-Arribillaga E., Alberdi M.J., Hernandez-Garcia S., Elorriaga K., Pandiella A., Rezola R., Martin A.G. Sox2 expression in breast tumours and activation in breast cancer stem cells. Oncogene. 2012;31:1354–1365. doi: 10.1038/onc.2011.338. [DOI] [PubMed] [Google Scholar]
- Lestari W., Ichwan S.J.A., Otsu M., Yamada S., Iseki S., Shimizu S., Ikeda M.-A. Cooperation between ARID3A and p53 in the transcriptional activation of p21WAF1 in response to DNA damage. Biochem. Biophys. Res. Commun. 2012;417:710–716. doi: 10.1016/j.bbrc.2011.12.003. [DOI] [PubMed] [Google Scholar]
- Li H., Collado M., Villasante A., Strati K., Ortega S., Cañamero M., Blasco M.A., Serrano M. The Ink4/Arf locus is a barrier for iPS cell reprogramming. Nature. 2009;460:1136–1139. doi: 10.1038/nature08290. [DOI] [PMC free article] [PubMed] [Google Scholar]
- Lin L., Zhou Z., Zheng L., Alber S., Watkins S., Ray P., Kaminski N., Zhang Y., Morse D. Cross talk between Id1 and its interactive protein Dril1 mediate fibroblast responses to transforming growth factor-beta in pulmonary fibrosis. Am. J. Pathol. 2008;173:337–346. doi: 10.2353/ajpath.2008.070915. [DOI] [PMC free article] [PubMed] [Google Scholar]
- Mathew R., Jia W., Sharma A., Zhao Y., Clarke L.E., Cheng X., Wang H., Salli U., Vrana K.E., Robertson G.P. Robust activation of the human but not mouse telomerase gene during the induction of pluripotency. FASEB J. 2010;24:2702–2715. doi: 10.1096/fj.09-148973. [DOI] [PMC free article] [PubMed] [Google Scholar]
- Melton C., Judson R.L., Blelloch R. Opposing microRNA families regulate self-renewal in mouse embryonic stem cells. Nature. 2010;463:621–626. doi: 10.1038/nature08725. [DOI] [PMC free article] [PubMed] [Google Scholar]
- Nixon J.C., Rajaiya J., Webb C.F. Mutations in the DNA-binding domain of the transcription factor Bright act as dominant negative proteins and interfere with immunoglobulin transactivation. J. Biol. Chem. 2004;279:52465–52472. doi: 10.1074/jbc.M403028200. [DOI] [PubMed] [Google Scholar]
- Rodda D.J., Chew J.-L., Lim L.-H., Loh Y.-H., Wang B., Ng H.-H., Robson P. Transcriptional regulation of nanog by OCT4 and SOX2. J. Biol. Chem. 2005;280:24731–24737. doi: 10.1074/jbc.M502573200. [DOI] [PubMed] [Google Scholar]
- Takahashi K., Yamanaka S. Induction of pluripotent stem cells from mouse embryonic and adult fibroblast cultures by defined factors. Cell. 2006;126:663–676. doi: 10.1016/j.cell.2006.07.024. [DOI] [PubMed] [Google Scholar]
- Tomioka M., Nishimoto M., Miyagi S., Katayanagi T., Fukui N., Niwa H., Muramatsu M., Okuda A. Identification of Sox-2 regulatory region which is under the control of Oct-3/4-Sox-2 complex. Nucleic Acids Res. 2002;30:3202–3213. doi: 10.1093/nar/gkf435. [DOI] [PMC free article] [PubMed] [Google Scholar]
- Wang J., Rao S., Chu J., Shen X., Levasseur D.N., Theunissen T.W., Orkin S.H. A protein interaction network for pluripotency of embryonic stem cells. Nature. 2006;444:364–368. doi: 10.1038/nature05284. [DOI] [PubMed] [Google Scholar]
- Webb C.F., Bryant J., Popowski M., Allred L., Kim D., Harriss J., Schmidt C., Miner C.A., Rose K., Cheng H.-L. The ARID family transcription factor bright is required for both hematopoietic stem cell and B lineage development. Mol. Cell. Biol. 2011;31:1041–1053. doi: 10.1128/MCB.01448-10. [DOI] [PMC free article] [PubMed] [Google Scholar]
- Wilsker D., Patsialou A., Dallas P.B., Moran E. ARID proteins: a diverse family of DNA binding proteins implicated in the control of cell growth, differentiation, and development. Cell Growth Differ. 2002;13:95–106. [PubMed] [Google Scholar]
- Yeom Y.I., Fuhrmann G., Ovitt C.E., Brehm A., Ohbo K., Gross M., Hübner K., Schöler H.R. Germline regulatory element of Oct-4 specific for the totipotent cycle of embryonal cells. Development. 1996;122:881–894. doi: 10.1242/dev.122.3.881. [DOI] [PubMed] [Google Scholar]
- Yu J., Hu K., Smuga-Otto K., Tian S., Stewart R., Slukvin I.I., Thomson J.A. Human induced pluripotent stem cells free of vector and transgene sequences. Science. 2009;324:797–801. doi: 10.1126/science.1172482. [DOI] [PMC free article] [PubMed] [Google Scholar]
- Zhao R., Daley G.Q. From fibroblasts to iPS cells: induced pluripotency by defined factors. J. Cell. Biochem. 2008;105:949–955. doi: 10.1002/jcb.21871. [DOI] [PubMed] [Google Scholar]
- Zong R.T., Das C., Tucker P.W. Regulation of matrix attachment region-dependent, lymphocyte-restricted transcription through differential localization within promyelocytic leukemia nuclear bodies. EMBO J. 2000;19:4123–4133. doi: 10.1093/emboj/19.15.4123. [DOI] [PMC free article] [PubMed] [Google Scholar]
Associated Data
This section collects any data citations, data availability statements, or supplementary materials included in this article.