

Summary
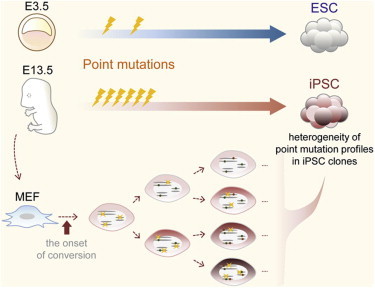
A large number of point mutations have been identified in induced pluripotent stem cell (iPSC) genomes to date. Whether these mutations are associated with iPSC generation is an important and controversial issue. In this study, we approached this critical issue in different ways, including an assessment of iPSCs versus embryonic stem cells (ESCs), and an investigation of variant allele frequencies and the heterogeneity of point mutations within a single iPSC clone. Through these analyses, we obtained strong evidence that iPSC-generation-associated point mutations occur frequently in a transversion-predominant manner just after the onset of cell lineage conversion. The heterogeneity of the point mutation profiles within an iPSC clone was also revealed and reflects the history of the emergence of each mutation. Further, our results suggest a possible approach for establishing iPSCs with fewer point mutations.
Graphical Abstract
Highlights
-
•
iPSCs versus ESCs—an obvious difference in the frequency and mode of point mutations
-
•
A large number of iPSC generation-associated, not preexisting, point mutations
-
•
Heterogeneity of point mutation profiles in an iPSC clone
-
•
No common point mutations among iPSC clones
Sugiura et al. have obtained strong evidence that iPSC generation-associated point mutations occur frequently in a transversion-predominant manner just after the onset of cell lineage conversion. The heterogeneity of the point mutation profiles within an iPSC clone was also revealed and reflects the history of the emergence of each mutation.
Introduction
Induced pluripotent stem cells (iPSCs) hold great promise for regenerative medicine (Lowry et al., 2008; Maherali et al., 2007; Okita et al., 2007; Park et al., 2008; Takahashi et al., 2007; Takahashi and Yamanaka, 2006; Wernig et al., 2007; Yu et al., 2007), but their underlying molecular mechanisms have remained elusive and several concerns have arisen over their genomic integrity (Hussein et al., 2013; Martins-Taylor and Xu, 2012; Puri and Nagy, 2012). Thus far, investigators have studied the genomic stability of iPSCs using various approaches (Hussein et al., 2011; Laurent et al., 2011; Martins-Taylor et al., 2011; Mayshar et al., 2010; Quinlan et al., 2011; Taapken et al., 2011), and point mutation analyses of these cells were recently reported (Cheng et al., 2012; Gore et al., 2011; Howden et al., 2011; Ji et al., 2012; Young et al., 2012). A considerable number of point mutations have been identified in iPSC genomes, but a significant number of preexisting single nucleotide variations (SNVs) have also been revealed in the genomes of the parental somatic cells used to generate iPSCs (Cheng et al., 2012; Gore et al., 2011; Ji et al., 2012; Young et al., 2012). These results raise the question as to whether the mutations identified in iPSC genomes are age accrued and/or are due to reprogramming-associated mechanisms. To date, most reports have supported the notion of age-accrued, preexisting SNVs in parent somatic cells (Cheng et al., 2012; Quinlan et al., 2011; Young et al., 2012), although Ji et al. (2012) suggested that the substantial mutations found in iPSCs cannot be accounted for by preexisting mutations. To facilitate the clinical use of these stem cells and enhance our understanding of the molecular mechanisms underlying the genome reprogramming process, it is crucial to elucidate whether iPSC generation causes a substantial number of point mutations. To address this issue in our current study, we compared the point mutation profiles in iPSCs with those in embryonic stem cells (ESCs), and investigated variant allele frequencies and the heterogeneity of point mutation profiles within an iPSC clone to precisely determine the timing of the occurrence of each point mutation.
Results
iPSCs versus ESCs—a Considerable Difference in the Frequency and Mode of Point Mutations
We compared the point mutation profiles in iPSCs with those in ESCs. To exclude factors that could influence this point mutation analysis, such as virus integration, age, cell division, developmental ability, and culture conditions (Martins-Taylor and Xu, 2012), we established ESC and genome-integration-free iPSC lines (Okita et al., 2008) under identical conditions, apart from the use of feeder cells during ESC generation (Figure 1A). We examined three iPSC lines (2A-4F-118, 2A-4F-119, and 2A-4F-136 [iPS118, iPS119, and iPS136]) and four ESC lines (B6ES2-2, B6ES2-7, B6ES2-9, and B6ES2-11 [ES2-2, ES2-7, ES2-9, and ES2-11]; Table S1 available online). These clones showed the expression of stem cell markers, and germline transmission was verified for most lines (Figures S1A and S1B; Araki et al., 2013).
Figure 1.

Point Mutation Load in iPSCs versus ESCs
(A) Preparation of iPSC and ESC lines for point mutation analysis. Integration-free iPSCs were generated from a single mouse embryo at E13.5. Plasmids encoding the four required reprogramming factors were transfected into these cells and ESC lines were established from E3.5 blastocysts. After three to four passages, the generated iPSCs and ESCs were collected.
(B) Distribution of base substitutions across mouse chromosomes. The dots indicate the positions of the point mutations identified in each line across the chromosomes. Analysis of X and Y chromosomes could not be performed effectively due to the huge number of redundant sequences.
(C) Mutation rates. The bar graph represents the number of mutations identified within the 1 × 10⁹ bp genome of iPSC lines (red) and ESC lines (blue).
(D) Mutation profiles of iPSCs and ESCs. The frequencies of transitions and transversions are indicated by the pie charts.
See also Figures S1, S2, and Tables S1–S5.
To identify point mutations in a genome-wide fashion, genome sequencing of the corresponding parent cells is essential. In the case of ESC analysis, however, obtaining the parental cells is quite difficult and in humans in particular is usually not feasible. Even in the case of mouse ESCs, the use of an indirect control, such as an individual belonging to the same strain, can create a number of false positives during point mutation analysis, including intrastrain SNPs. We therefore newly established fully potent ESC lines and recovered the genomes from both parents in advance (Figure 1A), which enabled us to identify the point mutations that occurred during ESC generation.
For the analysis of iPSCs, we used a mouse embryonic fibroblast (MEF) fraction prepared from a single embryo (Figure 1A). MEFs have been widely used in mouse iPSC generation studies, and MEF fractions are always prepared from multiple embryos, such as littermates, rather than from a single embryo. This is due to the limited cell numbers that can be obtained from a single embryo. However, the use of MEFs prepared from multiple embryos frequently causes severe difficulties for subsequent point mutation analysis because even in inbred strains, a number of intrastrain SNPs will exist in the embryos. Hence, the use of a MEF fraction from a single embryo is crucial for point mutation analysis. We used MEF fractions prepared from a single embryo for each iPSC generation: MEF2 (embryonic day 13.5 [E13.5] embryo: No. 2) to establish lines iPS118 and iPS119, and MEF7 (E13.5 embryo: No. 7) for line iPS136. In addition, to facilitate efficient sequence analysis, we employed C57BL/6J mice, for which whole-genome sequences have already been determined.
We performed genome sequencing using a paired-end method with HiSeq 2000. More than 300 million reads were obtained for each genome involving 94 or 100 bases each, and more than 90% of the entire genome could be covered using this method. In addition, 55% of each genome could be sequenced with a high degree of redundancy, by at least 10-fold (Figures S1C and S1D). Using these sequences, we first predicted SNV candidates in each genome through a comparison with reference sequences of C57BL/6 (NCBI37/mm9), followed by a comparison of SNV candidates in the cell lines against those in their corresponding parent cells. We found that 54.9%–61.0% of the entire genomes were comparable, with a high degree of redundancy (13.9–23.1 of the average read depth; Figure S1C), and known SNPs were removed (Gore et al., 2011; Wang et al., 2011).
Although it has been suggested that this level of read depth is insufficient to remove false positives in a comprehensive identification of SNVs with bioinformatics only, accurate identification is possible if additional criteria are met (Ji et al., 2012). We therefore employed CLC software and adopted some of its criteria to remove false positives (Doan et al., 2012; Ghosh et al., 2012; Hayashida et al., 2013; see Experimental Procedures; Figure S2A). Then, to test our informatics screening, we performed Sanger sequencing of 106 SNVs randomly selected from the pool of candidates. All candidates were detected only in iPSCs or ESCs in a heterozygous fashion, but none were observed in their corresponding parent cells. We also performed additional sequencing of some of the clones and their parent cells. Although the depth of each read reached 29.9, 32.0, and 31.4 for iPS118, iPS136, and ES2-2, respectively, the results did not differ from those obtained in our first round of analysis with fewer redundancies (Table S2), indicating that our sequencing approaches are sufficient for genome-wide SNV identification from inbred mouse genomes (Wartman et al., 2011). Moreover, we also confirmed our results using GATK software, which is currently widely used and is becoming a standard tool in this field (McKenna et al., 2010; Table S3). The quality scores of our SNV candidates and the SNP controls are shown in Figure S2B. We thus concluded that almost all of our candidates were true SNVs.
We finally identified 248 sites (per 1.41 × 10⁹ bp) in iPS118, 215 sites (per 1.56 × 10⁹ bp) in iPS119, 281 sites (per 1.42 × 10⁹ bp) in iPS136, 37 sites (per 1.41 × 10⁹ bp) in ES2-2, 14 sites (per 1.42 × 10⁹ bp) in ES2-7, 13 sites (per 1.47 × 10⁹ bp) in ES2-9, and 28 sites (per 1.50 × 10⁹ bp) in ES2-11 as candidate point mutations (Figures 1B and S2A). Our data thus suggest the presence of a markedly higher number of point mutations in iPSCs compared with ESCs (Figure 1C). It must be noted, however, that even the small number of mutations observed in ESCs could be an overestimation since the livers of both parents were employed as references. Although the remaining cells, such as trophectoderm cells in the blastocyst from which ESCs were established, would be an ideal reference control, experiments using such cells are beyond current technical capabilities. If such experiments can be achieved in the future, the mutation number in ESCs may in fact be found to be lower than our current result.
A large number of mutations were also identified in the intergenic regions, and little regional bias was observed for the point mutations in the iPSC genomes (Figure S2C). Details of the mutations we identified within the gene regions of the stem cells analyzed are summarized in Table S4. Importantly, only a few mutations were observed within exons. We next performed a detailed breakdown of all SNVs identified and then successfully identified unique mutation profiles in the iPSC genomes. Only 21.6%–50.0% of the point mutations were found to be transversions in ESCs. In contrast, more than 50% of the point mutations detected in iPSCs were observed to be transversions (54.0% for iPS118, 60.5% for iPS119, and 60.1% for iPS136 cells; Figure 1D). This is quite an intriguing finding because most known point mutations, including SNPs, exhibit transition-predominant profiles (Figure S2D, right).
Variant Allele Frequency Analysis Reveals the Heterogeneity of Point Mutation Profiles in iPSC clones
We performed ultradeep-sequencing analysis on 26 of the mutations identified in the iPS136 genome that were randomly chosen to examine whether they existed in the parent somatic cells (Gore et al., 2011; Ji et al., 2012). We found that only one possible SNV out of the 26 analyzed was detectable in the parental genome (Table S5). This finding was not surprising given that the accumulation of spontaneous mutations depends on the duration after fertilization. Indeed, previous studies have reported ratios of preexisting SNVs of 17/35 in newborns to 82-year-old adults (human) (Gore et al., 2011), 8/46 in newborns (human) (Ji et al., 2012), and 1/26 in E13.5 mouse embryos (this study). Our current results thus strongly suggest that substantial numbers of SNVs arise during iPSC generation. However, it must be noted that even using ultradeep sequencing, the number of somatic mutations in parental somatic cells could be underestimated due to technical difficulties involved in performing this genotyping assay. In addition, our ultradeep sequencing is limited by the amount of starting materials due to the use of MEFs derived from a single embryo. Indeed, only 10,000 somatic cells could be used for the analysis of each SNV candidate, limiting the sensitivity of our analysis. Hence, to ascertain whether iPSC generation processes cause point mutations, methods other than the measurement of mutation incidence in parental somatic cells were needed.
Therefore, we next conducted an allele frequency analysis of the iPSC clone iPS136, in which 43 SNV candidates were examined by amplicon sequencing (Figure S3A). Our aim was to identify the SNVs present at a <50% allele frequency, which are considered to not be preexisting. As anticipated, most SNVs showed ∼50% allele frequency; however, significant numbers of SNVs (nine out of the 43 examined) were still observed at ∼12.5%–25% frequencies (Figure S3A). Similar results were also observed in the iPS118 genome (Figure S3B). Clearly, therefore, this is not a rare event. Subsequently, to validate the presence of ∼25% SNVs and to estimate how many such SNVs exist in iPSC genomes, we performed additional whole-genome sequencing on the iPS136 cells up to a 25.2 redundancy level on average, and expanded the lower limit of our filtering from 35% to 10% to screen for ∼25% SNV candidates (Figure S3C). From this sequencing, we successfully identified a new peak of ∼25% in addition to the peak at the ∼50% frequency (Figure 2A), and the number of 25% SNV candidates was appreciable (105 candidates, ∼1/3 of the number of 50% SNVs; Figure 2D). Subsequent amplicon sequencing confirmed this finding: when 46 of the 25% SNV candidates were randomly examined, almost all (95.7%) exhibited a <50% allele frequency (groups II and III; Figures 2B–2D).
Figure 2.
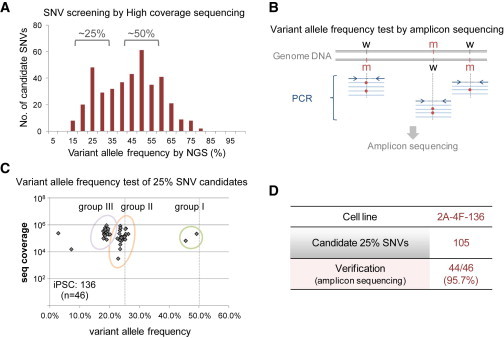
A Large Number of 25% SNVs Are Present in the iPSC Genome
(A) Variant allele frequencies for SNV candidates screened using high-coverage, whole-genome sequencing data. The histogram indicates the variant allele frequencies by sequence coverage.
(B) Schematic representation of the variant allele frequency test by amplicon sequencing. The targeted variants were amplified by PCR and assessed by deep sequencing using an Illumina MiSeq.
(C) Variant allele frequency plots of 25% SNV candidates in the iPS136 clone. The plots show variant allele frequencies by sequence coverage of amplicon sequencing. The number of SNV candidates examined is indicated in parentheses.
(D) Verification of candidate 25% SNVs.
The presence of a large number of ∼25% SNVs strongly implied the heterogeneity of these variants within the iPSC clone and indicated the occurrence of point mutations during iPSC generation. To confirm this, we attempted to establish subclones of single-cell origin from the iPS136 iPSC clone, which would enable us to investigate individual cells within this clone. An additional aim of this experiment was to exclude the possibility that 25% SNVs identified in our screening were due to the contamination of some preexisting iPSCs. We picked 96 single cells from the colony of cells using a microcapillary pipette under a microscope, and successfully established ten sublines from these cells (Figure 3A). Using Sanger sequencing, we examined these ten lines for five of the 50% SNVs, including two SNV candidates (group I) as controls; 11 of the 25% SNV candidates (group II); and ten of the <25% candidates (group III) (Figures 2C and 3B). As anticipated, each 50% SNV was observed in all sublines, indicating that all subclones harbor wild/mutant alleles. In contrast, no 25% SNVs were observed in any of the ten sublines. Each candidate was observed only in about five of the sublines. Nine out of the 11 25% SNVs were detected only in the 136-A7, 136-A9, 136-B7, 136-D6, 136-E9, and 136-G2 sublines, but the remaining two candidates were identified only in the remaining four sublines (136-A3, 136-D1, 136-F4, and 136-G11). Thus, the 25% SNV candidates form two groups. The former nine candidates were always observed together; however, although the latter two candidates were also always observed together, each subline had one of the two groups, but not both. Importantly, no subline had neither of the two groups, strongly suggesting that these mutations arose just after the onset of iPSC generation. Furthermore, all of the candidates in group III, with a <25% allele frequency, existed in only three sublines: 136-D1, 136-F4, and 136-G11.
Figure 3.
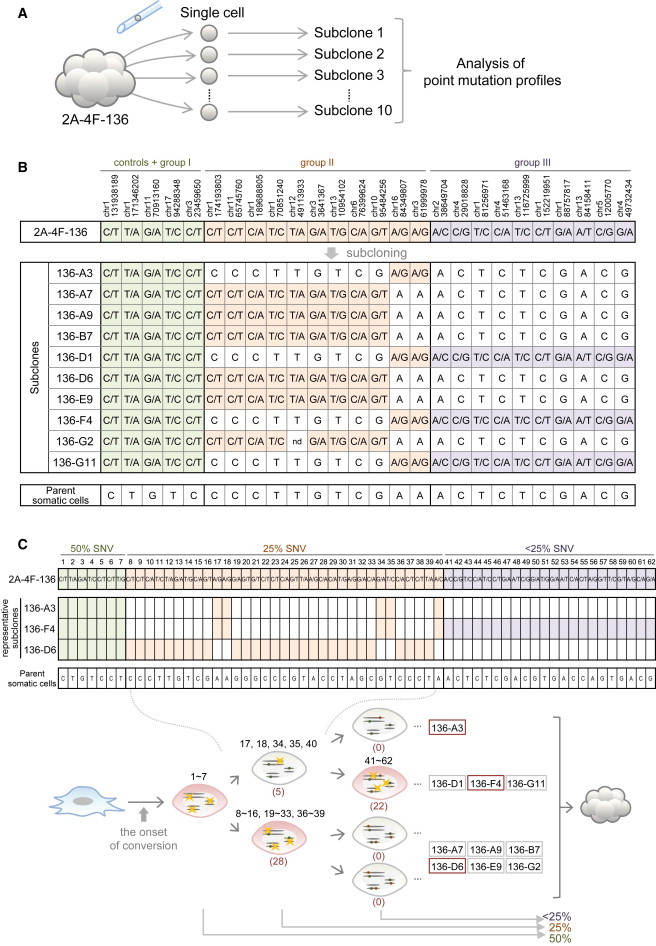
Heterogeneity of Point Mutation Profiles in an iPSC Clone
(A) Single-cell isolation and establishment of sublines from a single iPSC clone.
(B) Point mutation profiles of each subline. The positions of five 50% SNVs (controls + group I), 11 25% SNVs (group II), and ten <25% SNVs (group III) were examined through sequence patterns (Sanger sequencing) in sublines of iPS136 (136-A3, A7, A9, B7, D1, D6, E9, F4, G2, and G11), original iPS136 cells, and parental somatic cells. The positions in which mutant alleles were detected are indicated with different colors (green, controls + group I; orange, group II; purple, group III). nd, not determined.
(C) Time course of point mutation occurrence in iPSCs. Upper panel: sequence patterns of a total of 62 positions that were examined in three representative sublines of the iPS136 clone (136-A3, F4, and D6). Lower panel: conclusions from the point mutation profile analysis in iPS136 sublines. These point mutation profiles indicate that 50% SNVs (Nos. 1–7) were potentially preexisting parental SNVs or mutations that had occurred just after the onset of stem cell conversion. In contrast, 25% SNVs (Nos. 8–40) and <25% SNVs (Nos. 41–62) were generated after the first and second cell divisions, respectively. The values in parentheses indicate the total number of mutations that occurred and were detectable in this experiment.
See also Table S1.
We examined additional SNV candidates (62 in total) for which PCR primers had been designed using three representative sublines: 136-A3, 136-F4, and 136-D6 (Figure 3C, upper panel). Whereas all 50% SNVs could be detected in all sublines, 28 of the 25% SNV candidates were detected in only one subline, 136-D6. The remaining five 25% SNV candidates were observed in the other two sublines, 136-A3 and 136-F4, and all 22 of the <25% SNV candidates were detected only in the 136-F4 subline. Thus, the time course of point mutation occurrence in iPSCs was revealed, and the possibility of contamination could be excluded (Figure 3C, lower panel).
Our results thus reveal that 25% SNVs are generated just after the first cell division from the onset of cell lineage conversion from the parent somatic cell to iPSC. Furthermore, each of the 12.5% SNVs was detectable in some of the sublines, at roughly a 25% frequency, indicating that these SNVs arise after the second cell division (Figure 3C, lower panel). Moreover, the identification of more than one hundred ∼25% SNVs strongly suggests the presence of at least 158 of these SNVs in the iPS136 genome in total, because the actual coverage of our current whole-genome sequencing was approximately 63%.
To validate our observations using the iPS136 clone, we examined another integration-free iPSC clone, iPS118 (Figures 4A–4C). Fifty-nine 25% SNV candidates were identified by further sequencing of this additional clone, with a 23.5 level of redundancy on average (Figures 4A and S3C). Twenty-three of these candidates were randomly selected for subsequent amplicon sequencing, and most clearly exhibited a <50% allele frequency, although four candidates exhibited an ∼50% frequency (Figure 4B). Finally, the presence of ∼25% SNVs was assessed through analysis of 13 sublines established from an iPS118 colony (Figure 4C). We also investigated three additional iPSC clones (iPS119 [Figure 4D], R (retro)-4F-28 [iPS28; Figure 4E], and R-4F-29 [iPS29; Figure 4F]), including retrovirus-mediated iPSC clones (Figure S4), using this subclone analysis. The results confirmed that an appreciable number of ∼25% SNVs exist in all iPSC clones.
Figure 4.
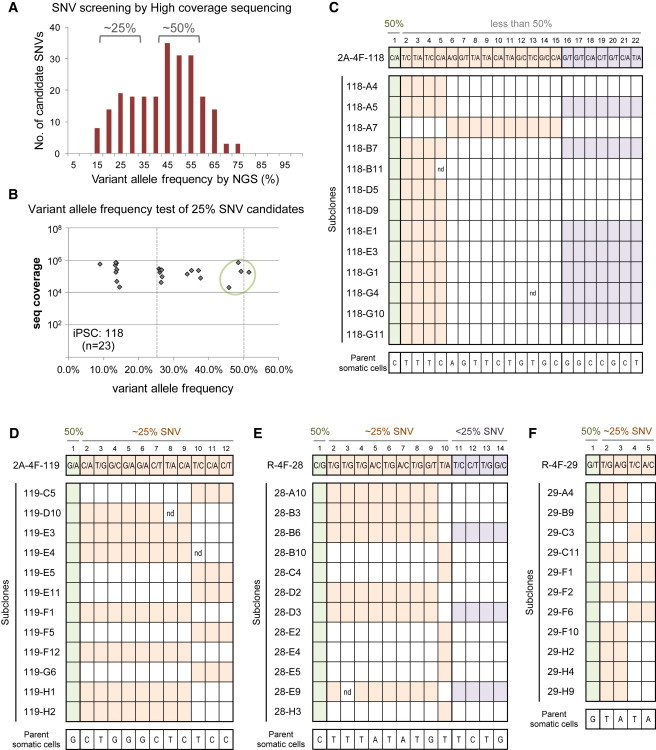
Heterogeneity of the Point Mutation Profiles in Other iPSC Clones
(A) Variant allele frequencies for SNV candidates screened using high-coverage, whole-genome sequencing data for the iPS118 line.
(B) Variant allele frequency plots of 25% SNV candidates of iPS118 cells. The plots show variant allele frequencies determined by sequence coverage of amplicon sequencing. The number of SNV candidates examined is indicated in parentheses.
(C) Point mutation profiles of sublines of iPS118. Sequence patterns of a total of 22 positions were examined in 13 subclones of iPS118.
(D) Point mutation profiles in sublines of iPS119. Sequence patterns of a total of 12 positions were examined in 12 subclones of iPS119.
(E) Point mutation profiles in sublines of iPS28. Sequence patterns of a total of 14 positions were examined in 12 subclones of iPS28.
(F) Point mutation profiles in sublines of iPS29. Sequence patterns of a total of five positions were examined in 11 subclones of iPS29.
See also Table S1.
Discussion
After the identification of a large number of single-nucleotide mutations in iPSC genomes, and regardless of the procedures used for their generation, the central question regarding point mutations in iPSC genomes has shifted to whether they arise through the actual generation process or whether they can be explained by classical spontaneous mutation events that occur mainly in their parental cells (Hussein et al., 2013). Indeed, ultradeep-sequencing analysis of the parent cells of iPSCs has revealed the preexistence of a proportion of SNV candidates (Gore et al., 2011; Ji et al., 2012). In addition, a quite recent analysis of sister iPSC clones also suggested the presence of many preexisting SNVs in parental somatic cells (Young et al., 2012).
In our current study, we approached the issue of iPSC point mutations from a series of unique angles, using whole-genome sequencing as follows: (1) an assessment of iPSCs versus ESCs, (2) an investigation of variant allele frequencies, and (3) an investigation of the heterogeneity of point mutation profiles in cells within an iPSC clone. Taken together, our findings indicate that a substantial number of point mutations in iPSCs occur in a transversion-predominant manner during the conversion process, especially at the initiation steps, from somatic cell to iPSC. Our conclusion is consistent with the previous observation that ∼74% of the mutations found in iPSCs cannot be accounted for by preexisting mutations or by acquisition during passage in culture (Ji et al., 2012).
To verify our present findings obtained by variant allele frequency testing using extensive whole-genome sequencing, and following amplicon sequencing, we developed a procedure to investigate the variant alleles in each cell within an iPSC clonal population. This was achieved by preparing single-cell-derived subclones from one iPSC clone, and the results clearly demonstrated that point mutations still arose after conversion to stem cells, and particularly just after conversion from a somatic cell, at a remarkably high rate. Interestingly, we also observed a strong bias in the frequency of 25% and <25% SNVs among sublines derived from the iPS136 clone: 28 in the 136-D6 subline and 27 in 136-F4, but only five in 136-A3 (Figure 3C). This tendency was also observed in other iPSCs examined by subclone analysis (Figures 4C–4F). Thus, we believe that our approach of focusing on single-cell-derived subclones will shed light on the mechanisms underlying the genetic aberrations associated with genome reprogramming.
To further determine the generality of our finding that iPSCs harbor unique transversion-predominant point mutation profiles (Figure S2D, left), we analyzed previously reported point mutation profiles in 27 different iPSC lines that had been established by various methods, including retrovirus, plasmid, and mRNA methods (Gore et al., 2011; Ji et al., 2012; Young et al., 2012; Figure S2E). We hypothesized that only the point mutations caused by iPSC generation would exhibit a transversion-predominant profile, and that other point mutations that arose before and after iPSC generation would be transition predominant. When we compared the SNVs whose origin was revealed (preexisting or occurring in prolonged culture) with the remaining SNVs whose origin was not revealed, we clearly observed a transversion preference in the remaining SNVs, but not in somatic cells prior to reprogramming or in iPSCs in prolonged culture (Figure S2E). Hence, the fact that an iPSC-generation-associated, transversion-predominant point mutation profile is widely observed in iPSCs of various origins indicates that this is a general iPSC-generation-associated phenomenon that is not limited to our current investigation (Figure S2D, left).
In this study, we employed single-embryo-derived MEF lines (MEF2 and MEF7) for iPSC generation. This is an ideal system for identifying de novo point mutations because novel intrastrain SNPs will not be incorrectly designated as point mutations. In our analyses, we performed whole-genome sequencing for two and four iPSC clones derived from the MEF2 and MEF7 lines, respectively. A large number of SNV candidates (2,169) were identified in total, but, interestingly, no common SNV was observed among the six iPSC clones. Although two common SNVs, chr1_54465821 and chrX_30378169, were suggested between the iPS136 and iPS28 lines, both candidates turned out to be located in the repetitive regions LTR and LINE, strongly suggesting that these SNVs were detected by mapping errors. Thus, all SNVs identified in our analysis were clone specific (Figures 5 and S4). Our results strongly suggest that all of the SNV candidates we identified in iPSC genomes, including 50% SNVs for which we could not directly demonstrate an association with iPSC generation by variant allele frequency analysis or subclone analysis, are also not preexisting. In addition, our observations do not support the elite hypothesis that iPSCs can be converted from certain somatic cells.
Figure 5.
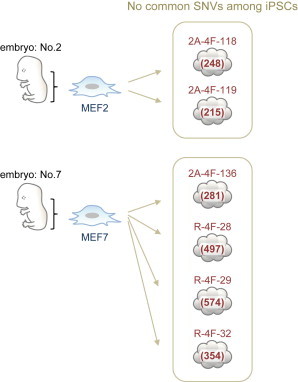
No Common SNVs Exist among iPSCs Generated from Single Embryo-Derived MEFs
The number of SNVs identified is shown in parentheses.
To enable future medical applications of these cells, it is crucial to determine the entire mutation load of iPSC genomes. Although we initially focused on 50% SNVs (Figure 1), since we could not expect a presence of 25% SNVs in the early stages of our study, this resulted in a substantial underestimation of the point mutation load per genome. Subsequently, we successfully identified a substantial number of ≤25% SNVs, although this was smaller than the number of 50% SNVs (Figures 2A and 4A). Needless to say, even with our current estimation, the number of SNVs, especially those of ≤25% frequency, could be underestimated due to read-depth limitations. Thus, the SNVs reported herein represent a conservative estimate and the true SNV number per cell line could well be higher. Determining the entire point mutation load in iPSC genomes thus remains an important and challenging goal.
Our present findings raise serious concerns regarding the potential clinical use of iPSCs. In fact, several iPSC point mutations were identified within exons (n = 2–4 SNVs for integration-free iPSCs and 5–9 SNVs for the iPSCs generated using retrovirus vector), and most SNVs within gene-coding regions were found to be nonsynonymous, which supports previous findings (Gore et al., 2011; Howden et al., 2011; Figure S2C; Table S4). Although all of these SNVs were found to be heterozygous in nature, we cannot completely rule out the possibility that these SNVs can cause abnormalities such as tumors. Hence, careful investigations of these variants are still needed. Based on our findings, we propose an approach to enable the production of iPSCs with fewer point mutations that involves the selection of sublines that harbor only small numbers of such mutations.
Experimental Procedures
Establishment of iPSCs and ESCs
Animal experiments were performed in accordance with the guidelines of the National Institute of Radiological Sciences Animal Care and Use Committee. We employed the mouse inbred strain C57BL/6J for the preparation of all cell lines. We used MEF fractions prepared from a single embryo for iPSC generation. The four iPSC lines prepared from MEF7 were iPS136, iPS28, iPS29, and R-4F-32 (iPS32), and the two lines derived from MEF2 were iPS118 and iPS119 (Figure 5; Table S1). Yamanaka factors Oct4, Sox2, KLF4, and c-Myc (4F) were introduced using either plasmid or retrovirus vectors. Establishment of the integration-free iPSC lines iPS118, iPS119, and iPS136, and the ESC lines ES2-2 and ES2-9 has been reported elsewhere (Araki et al., 2013). Other ESC lines were established as previously described (Nagy et al., 1993). The iPS28, iPS29, and iPS32 clones were established with 4F in retroviral vector (Takahashi and Yamanaka, 2006).
After the establishment of clones, we confirmed the integration of all retroviral transgenes into the genome of each clone, and the independence of the clones. Stem cell markers and karyotypes were confirmed for all lines, and germline transmission of the chimeric mice was confirmed for most of the lines, including ESCs, shown in Figure 1 (iPS118, iPS119, iPS136, ES2-2, and ES2-9; Araki et al., 2013).
Immunocytochemistry
For immunocytochemical staining, anti-Nanog (1:50; ReproCELL), anti-Oct3/4 h-134 (1:100; Santa Cruz Biotechnology), and anti-Sox-2 Y-17 (1:100; Santa Cruz) antibodies were used.
Whole-Genome Sequencing
DNA was extracted using the DNeasy Blood & Tissue Kit (QIAGEN). Illumina libraries were prepared and all sequencing was performed using a HiSeq 2000 sequencer (Illumina) with 94 or 100 bases × 2 (paired-end) reads.
Read Mapping and SNV Calling
The obtained reads were mapped onto the mouse reference genome (NCBI37/mm9) using BWA (version 0.5.9; Li and Durbin, 2009). We permitted 2 base mismatch mapping, and only uniquely mapped reads were retained for SNV analysis. SNV calling was carried out on a CLC Genomics Workbench (CLC bio). The parameters were set as follows: window length, 11; maximum gap and mismatch count, 2; minimum quality of central base, 30; minimum average quality of surrounding bases, 15. To detect as many candidates as possible, genomic regions with at least 4 × coverage were targeted, and positions with a mutant allele frequency of >35% were listed as an SNV candidate in the iPSC and ESC lines. To detect the presence of possible SNVs in donor embryo and parental mice genomes, positions with a mutant allele frequency of >10% were listed. SNVs that appeared within the unordered sequences (random sequences) of the reference mouse genome, which are known to be on a particular chromosome but could not be ordered, were excluded from the panel of candidates.
To detect SNVs with a frequency of <25%, SNV calling was performed using high-coverage sequencing data for both the iPSC and donor embryo genomes. The parameters were set as follows: window length, 11; maximum gap and mismatch count, 2; minimum quality of central base, 35; minimum average quality of surrounding bases, 25; minimum coverage, 10; and minimum variant frequency (%), 10.
To validate our analysis using the CLC Genomics Workbench, we also performed SNV detection using GATK (Genome Analysis Toolkit v.1.6). The quality scores for the mapped reads were recalibrated, and PCR duplicates were removed using Picard (v.1.74). We then realigned the reads and identified SNVs under a minimal quality (QUAL in GATK) of 30.
Identification of Mutations Generated during the Derivation of iPSCs and ESCs
Candidate mutations were defined as variants present in the iPSC or ESC genome, but not in the donor embryo or parental mice, respectively. As a first screening step, we discarded candidates if they were present in the genome of the corresponding reference (the donor embryo for iPSCs and the parental mice for ESCs) with a frequency of >10%. To reduce the false-positive rate, variants present in the mouse dbSNP database (v. 128) were excluded. In addition, because a novel mutation acquired during reprogramming is unlikely to occur homozygously, we selected the positions in which the mutant alleles have been detected at a frequency of 35%–65%. Because low sequencing depth can lead to false positives, variants that were positioned in genomic regions sequenced at a minimal read depth of 10–17× in both samples (iPSC or ESC) and in the corresponding reference genome (donor embryo or parental mice) were used for the comparison between iPSC and ESC lines. To remove SNVs that probably had occurred due to sequencing and mapping errors, we discarded candidates that were detected near the beginning and end of the reads and were located close to simple repeat sequences. To reduce the number of false positives introduced by mapping error, variants coded only by single (broken-paired) reads and mapped reads, including two-linked variants within a 94–100 bases read were removed. Finally, sites in which the embryo or parental genome included even one read with a mutant allele were removed as candidates for novel mutation sites, and several positions were identified in which the mouse iPSC or ESC samples showed a heterozygous pattern but their parental sample showed a homozygous pattern in a shared high-quality sequenced region. The mutation rate was expressed as the number of mutations per 109 bp of each iPSC or ESC genome.
To identify mutations present at low frequencies in the iPSC genome, we screened candidates in a similar manner as described above, with two modifications: (1) we selected the variants that were positioned in genomic regions sequenced at a minimum read depth of 21× in both the iPSC and donor embryo genomes, and (2) a screening step based on the frequency of the mutant alleles was omitted, and the positions in which the number of mutant allele reads was >5× were targeted as candidates for mutation sites.
Sanger Validation of Candidate Mutations
Genomic DNAs were amplified using primer sets that had been specifically designed around the candidate mutation sites. PCR reactions were performed using Titanium Taq DNA polymerase (TAKARA BIO), and PCR products were directly sequenced using a 3730 DNA Analyzer (Life Technologies).
Deep Sequencing
Amplicon sequencing was performed as previously described (Gore et al., 2011). Target regions were amplified with high-fidelity Taq polymerase, PrimeSTAR GXL DNA Polymerase (TAKARA BIO). Mixed PCR products were ligated to Illumina paired-end sequencing adapters and sequenced using the HiSeq 2000 sequencer.
Variant Allele Frequency Analysis
Genomic regions containing target SNV sites were amplified with Titanium Taq DNA polymerase (TAKARA BIO). PCR products were mixed and purified using the MinElute PCR Purification Kit (QIAGEN), and the sequences were determined using the Ion Torrent PGM sequencer with the Ion 316 chip (Life Technologies) and MiSeq sequencer (Illumina).
Subclone Analysis
iPSCs were trypsinized and single cells were transferred one by one with a microcapillary pipette to individual wells of a 96-well plate with feeder cells. After 1 week in culture, single colonies were transferred into new 24-well plates without feeder cells. Genomic DNAs were then prepared from the cells and used for Sanger sequencing.
Acknowledgments
We are grateful to S. Yamanaka (University of Kyoto) for providing the plasmid and retroviral vectors through Addgene, and to T. Kitamura (University of Tokyo) for providing PlatE cells. We thank A. Nifuji, H. Ideno, and T. Kamada for helpful discussions, and H. Yoshida, K. Nishikawa, A. Ishibashi, R. Watanabe, K. Douzono, Y. Shindo, M. Nakamura, and Y. Jincho for technical assistance. We also thank Illumina and Life Technologies for technical support on the variant allele frequency test, and H. Yunokawa and S. Sato for computational support. This work was partially funded by a research grant from Precursory Research for Embryonic Science and Technology (PRESTO, JST) and a Grant-in-Aid for Scientific Research (25290068, JSPS).
Footnotes
This is an open-access article distributed under the terms of the Creative Commons Attribution-NonCommercial-No Derivative Works License, which permits non-commercial use, distribution, and reproduction in any medium, provided the original author and source are credited.
Contributor Information
Ryoko Araki, Email: a_ryo@nirs.go.jp.
Masumi Abe, Email: abemasum@nirs.go.jp.
Accession Numbers
Raw Illumina sequencing reads are available from the DDBJ Sequence Read Archive under accession number DRA000524.
Supplemental Information
References
- Araki R., Uda M., Hoki Y., Sunayama M., Nakamura M., Ando S., Sugiura M., Ideno H., Shimada A., Nifuji A., Abe M. Negligible immunogenicity of terminally differentiated cells derived from induced pluripotent or embryonic stem cells. Nature. 2013;494:100–104. doi: 10.1038/nature11807. [DOI] [PubMed] [Google Scholar]
- Cheng L., Hansen N.F., Zhao L., Du Y., Zou C., Donovan F.X., Chou B.K., Zhou G., Li S., Dowey S.N., NISC Comparative Sequencing Program Low incidence of DNA sequence variation in human induced pluripotent stem cells generated by nonintegrating plasmid expression. Cell Stem Cell. 2012;10:337–344. doi: 10.1016/j.stem.2012.01.005. [DOI] [PMC free article] [PubMed] [Google Scholar]
- Doan R., Cohen N.D., Sawyer J., Ghaffari N., Johnson C.D., Dindot S.V. Whole-genome sequencing and genetic variant analysis of a Quarter Horse mare. BMC Genomics. 2012;13:78. doi: 10.1186/1471-2164-13-78. [DOI] [PMC free article] [PubMed] [Google Scholar]
- Ghosh P., Hsu C., Alyamani E.J., Shehata M.M., Al-Dubaib M.A., Al-Naeem A., Hashad M., Mahmoud O.M., Alharbi K.B., Al-Busadah K. Genome-wide analysis of the emerging infection with Mycobacterium avium subspecies paratuberculosis in the Arabian camels (Camelus dromedarius) PLoS ONE. 2012;7:e31947. doi: 10.1371/journal.pone.0031947. [DOI] [PMC free article] [PubMed] [Google Scholar]
- Gore A., Li Z., Fung H.L., Young J.E., Agarwal S., Antosiewicz-Bourget J., Canto I., Giorgetti A., Israel M.A., Kiskinis E. Somatic coding mutations in human induced pluripotent stem cells. Nature. 2011;471:63–67. doi: 10.1038/nature09805. [DOI] [PMC free article] [PubMed] [Google Scholar]
- Hayashida K., Abe T., Weir W., Nakao R., Ito K., Kajino K., Suzuki Y., Jongejan F., Geysen D., Sugimoto C. Whole-genome sequencing of Theileria parva strains provides insight into parasite migration and diversification in the African continent. DNA Res. 2013;20:209–220. doi: 10.1093/dnares/dst003. [DOI] [PMC free article] [PubMed] [Google Scholar]
- Howden S.E., Gore A., Li Z., Fung H.L., Nisler B.S., Nie J., Chen G., McIntosh B.E., Gulbranson D.R., Diol N.R. Genetic correction and analysis of induced pluripotent stem cells from a patient with gyrate atrophy. Proc. Natl. Acad. Sci. USA. 2011;108:6537–6542. doi: 10.1073/pnas.1103388108. [DOI] [PMC free article] [PubMed] [Google Scholar]
- Hussein S.M., Batada N.N., Vuoristo S., Ching R.W., Autio R., Närvä E., Ng S., Sourour M., Hämäläinen R., Olsson C. Copy number variation and selection during reprogramming to pluripotency. Nature. 2011;471:58–62. doi: 10.1038/nature09871. [DOI] [PubMed] [Google Scholar]
- Hussein S.M., Elbaz J., Nagy A.A. Genome damage in induced pluripotent stem cells: assessing the mechanisms and their consequences. Bioessays. 2013;35:152–162. doi: 10.1002/bies.201200114. [DOI] [PubMed] [Google Scholar]
- Ji J., Ng S.H., Sharma V., Neculai D., Hussein S., Sam M., Trinh Q., Church G.M., McPherson J.D., Nagy A., Batada N.N. Elevated coding mutation rate during the reprogramming of human somatic cells into induced pluripotent stem cells. Stem Cells. 2012;30:435–440. doi: 10.1002/stem.1011. [DOI] [PubMed] [Google Scholar]
- Laurent L.C., Ulitsky I., Slavin I., Tran H., Schork A., Morey R., Lynch C., Harness J.V., Lee S., Barrero M.J. Dynamic changes in the copy number of pluripotency and cell proliferation genes in human ESCs and iPSCs during reprogramming and time in culture. Cell Stem Cell. 2011;8:106–118. doi: 10.1016/j.stem.2010.12.003. [DOI] [PMC free article] [PubMed] [Google Scholar]
- Li H., Durbin R. Fast and accurate short read alignment with Burrows-Wheeler transform. Bioinformatics. 2009;25:1754–1760. doi: 10.1093/bioinformatics/btp324. [DOI] [PMC free article] [PubMed] [Google Scholar]
- Lowry W.E., Richter L., Yachechko R., Pyle A.D., Tchieu J., Sridharan R., Clark A.T., Plath K. Generation of human induced pluripotent stem cells from dermal fibroblasts. Proc. Natl. Acad. Sci. USA. 2008;105:2883–2888. doi: 10.1073/pnas.0711983105. [DOI] [PMC free article] [PubMed] [Google Scholar]
- Maherali N., Sridharan R., Xie W., Utikal J., Eminli S., Arnold K., Stadtfeld M., Yachechko R., Tchieu J., Jaenisch R. Directly reprogrammed fibroblasts show global epigenetic remodeling and widespread tissue contribution. Cell Stem Cell. 2007;1:55–70. doi: 10.1016/j.stem.2007.05.014. [DOI] [PubMed] [Google Scholar]
- Martins-Taylor K., Xu R.H. Concise review: genomic stability of human induced pluripotent stem cells. Stem Cells. 2012;30:22–27. doi: 10.1002/stem.705. [DOI] [PubMed] [Google Scholar]
- Martins-Taylor K., Nisler B.S., Taapken S.M., Compton T., Crandall L., Montgomery K.D., Lalande M., Xu R.H. Recurrent copy number variations in human induced pluripotent stem cells. Nat. Biotechnol. 2011;29:488–491. doi: 10.1038/nbt.1890. [DOI] [PubMed] [Google Scholar]
- Mayshar Y., Ben-David U., Lavon N., Biancotti J.C., Yakir B., Clark A.T., Plath K., Lowry W.E., Benvenisty N. Identification and classification of chromosomal aberrations in human induced pluripotent stem cells. Cell Stem Cell. 2010;7:521–531. doi: 10.1016/j.stem.2010.07.017. [DOI] [PubMed] [Google Scholar]
- McKenna A., Hanna M., Banks E., Sivachenko A., Cibulskis K., Kernytsky A., Garimella K., Altshuler D., Gabriel S., Daly M., DePristo M.A. The Genome Analysis Toolkit: a MapReduce framework for analyzing next-generation DNA sequencing data. Genome Res. 2010;20:1297–1303. doi: 10.1101/gr.107524.110. [DOI] [PMC free article] [PubMed] [Google Scholar]
- Nagy A., Rossant J., Nagy R., Abramow-Newerly W., Roder J.C. Derivation of completely cell culture-derived mice from early-passage embryonic stem cells. Proc. Natl. Acad. Sci. USA. 1993;90:8424–8428. doi: 10.1073/pnas.90.18.8424. [DOI] [PMC free article] [PubMed] [Google Scholar]
- Okita K., Ichisaka T., Yamanaka S. Generation of germline-competent induced pluripotent stem cells. Nature. 2007;448:313–317. doi: 10.1038/nature05934. [DOI] [PubMed] [Google Scholar]
- Okita K., Nakagawa M., Hyenjong H., Ichisaka T., Yamanaka S. Generation of mouse induced pluripotent stem cells without viral vectors. Science. 2008;322:949–953. doi: 10.1126/science.1164270. [DOI] [PubMed] [Google Scholar]
- Park I.H., Zhao R., West J.A., Yabuuchi A., Huo H., Ince T.A., Lerou P.H., Lensch M.W., Daley G.Q. Reprogramming of human somatic cells to pluripotency with defined factors. Nature. 2008;451:141–146. doi: 10.1038/nature06534. [DOI] [PubMed] [Google Scholar]
- Puri M.C., Nagy A. Concise review: embryonic stem cells versus induced pluripotent stem cells: the game is on. Stem Cells. 2012;30:10–14. doi: 10.1002/stem.788. [DOI] [PubMed] [Google Scholar]
- Quinlan A.R., Boland M.J., Leibowitz M.L., Shumilina S., Pehrson S.M., Baldwin K.K., Hall I.M. Genome sequencing of mouse induced pluripotent stem cells reveals retroelement stability and infrequent DNA rearrangement during reprogramming. Cell Stem Cell. 2011;9:366–373. doi: 10.1016/j.stem.2011.07.018. [DOI] [PMC free article] [PubMed] [Google Scholar]
- Taapken S.M., Nisler B.S., Newton M.A., Sampsell-Barron T.L., Leonhard K.A., McIntire E.M., Montgomery K.D. Karotypic abnormalities in human induced pluripotent stem cells and embryonic stem cells. Nat. Biotechnol. 2011;29:313–314. doi: 10.1038/nbt.1835. [DOI] [PubMed] [Google Scholar]
- Takahashi K., Yamanaka S. Induction of pluripotent stem cells from mouse embryonic and adult fibroblast cultures by defined factors. Cell. 2006;126:663–676. doi: 10.1016/j.cell.2006.07.024. [DOI] [PubMed] [Google Scholar]
- Takahashi K., Tanabe K., Ohnuki M., Narita M., Ichisaka T., Tomoda K., Yamanaka S. Induction of pluripotent stem cells from adult human fibroblasts by defined factors. Cell. 2007;131:861–872. doi: 10.1016/j.cell.2007.11.019. [DOI] [PubMed] [Google Scholar]
- Wang W., Yang J., Liu H., Lu D., Chen X., Zenonos Z., Campos L.S., Rad R., Guo G., Zhang S. Rapid and efficient reprogramming of somatic cells to induced pluripotent stem cells by retinoic acid receptor gamma and liver receptor homolog 1. Proc. Natl. Acad. Sci. USA. 2011;108:18283–18288. doi: 10.1073/pnas.1100893108. [DOI] [PMC free article] [PubMed] [Google Scholar]
- Wartman L.D., Larson D.E., Xiang Z., Ding L., Chen K., Lin L., Cahan P., Klco J.M., Welch J.S., Li C. Sequencing a mouse acute promyelocytic leukemia genome reveals genetic events relevant for disease progression. J. Clin. Invest. 2011;121:1445–1455. doi: 10.1172/JCI45284. [DOI] [PMC free article] [PubMed] [Google Scholar]
- Wernig M., Meissner A., Foreman R., Brambrink T., Ku M., Hochedlinger K., Bernstein B.E., Jaenisch R. In vitro reprogramming of fibroblasts into a pluripotent ES-cell-like state. Nature. 2007;448:318–324. doi: 10.1038/nature05944. [DOI] [PubMed] [Google Scholar]
- Young M.A., Larson D.E., Sun C.W., George D.R., Ding L., Miller C.A., Lin L., Pawlik K.M., Chen K., Fan X. Background mutations in parental cells account for most of the genetic heterogeneity of induced pluripotent stem cells. Cell Stem Cell. 2012;10:570–582. doi: 10.1016/j.stem.2012.03.002. [DOI] [PMC free article] [PubMed] [Google Scholar]
- Yu J., Vodyanik M.A., Smuga-Otto K., Antosiewicz-Bourget J., Frane J.L., Tian S., Nie J., Jonsdottir G.A., Ruotti V., Stewart R. Induced pluripotent stem cell lines derived from human somatic cells. Science. 2007;318:1917–1920. doi: 10.1126/science.1151526. [DOI] [PubMed] [Google Scholar]
Associated Data
This section collects any data citations, data availability statements, or supplementary materials included in this article.