Abstract
Thymidine kinase 1 (TK1) is an enzyme involved in nucleic acid synthesis and is therefore considered to be an important tumor proliferation marker. The aim of the present study was to determine the diagnostic role of TK1 measurement in cancer. An extensive electronic search was performed in PubMed, EMBASE and the Cochrane Library using the keywords ‘thymidine kinase 1’ and ‘tumor’ and synonyms. This study was conducted as part of a project to establish evidence-based guidelines for the diagnosis and treatment of cancer. A total of 453 abstracts were screened, after which the full text of 40 studies were selected for further investigation, including screening of the references cited by studies in the original search. Fifteen studies were enrolled following full-text evaluation. The areas under the receiver operating characteristic curves for the radioenzymatic assay (REA), the chemiluminescence immunoassay (CLIA) and the total were 0.88, 0.75 and 0.8, respectively. These results were all between <0.9 and >0.7, which suggested a moderate diagnostic efficacy. The positive likelihood ratio of the CLIA method was the highest (10.229), which demonstrated that CLIA exhibited a satisfactory specificity in tumor diagnosis. However, TK1 as a single diagnostic tumor marker was not of significant value and the combination of more tumor markers in the diagnosis of tumors may be preferable.
Keywords: thymidine kinase 1, diagnostic test, tumor marker, meta-analysis
Introduction
Malignant tumors are characterized by uncontrolled cell proliferation. The proliferative activity of neoplastic cells is key to the clinical course of several neoplasms (1–3). Thus, indicators of proliferation are attractive candidates as prognostic markers. Among these, thymidine kinase 1 (TK1), a cellular enzyme involved in a salvage pathway for DNA synthesis, has attracted interest. TK1 is located at chromosome 17q25, is exclusively expressed in the cytoplasm of dividing cells and is absent in resting cells (4–7). TK1 activity increases during the G1/S phase and decreases through the G2/mitosis phase (8–10). TK1 activity is essential for the balance of the intracellular TTP levels. In the beginning of G1 the cellular concentration of TK1 is not measurable. Transcriptional and translational mechanisms control the increased expression in the early S phase (11–14). Its activity has been shown to be correlated with the proliferative activity of tumor cells. Therefore, it may be useful for the early detection of tumor cell division and proliferation.
Appearance of TK1 in the serum results from tumor cell death by disintegration and it may be correlated with the size of the tumor, as a larger tumor contains more TK1 compared to a smaller one. TK1 has been extensively studied, primarily as a diagnostic biomarker for a variety of cancer types. The first assay for TK detection was developed by Gronowitz and Kallander (15). As a biomarker, higher serum TK1 activity levels are correlated with a more advanced cancer stage and grade (16). Serum TK1 levels also show prognostic potential, as they may help predict future relapse at the time of primary diagnosis in several cancer patients, including those with solid and non-solid tumors. It is almost undetectable in normal serum, but increases to varying degrees in malignant tumors (17), depending on their type, stage, growth rate (18) and presence or absence of treatment (19). The majority of the studies on TK1 included in the present meta-analysis assessed the diagnostic accuracy in different methods and different types of tumors (1,9,12,16). Initial studies investigating the prognostic significance of serum TK1 levels in patients with chronic lymphocytic leukemia (CLL) were conducted using a radioenzymatic assay (REA) (20–22). Although the results appeared promising, technical difficulties and the use of radioactivity resulted in limited acceptance of the serum TK1 analysis. A significant correlation showing that high serum TK1 levels predict poorer patient survival was detected by a novel chemiluminescence immunoassay (CLIA) technique (20). This novel method does not require radioactivity and is convenient and rapid. The results of the two methods are highly concordant. In addition, the enzyme-linked immunosorbent assay (ELISA) (21) and immunohistochemistry (IHC) (23) were used to detect serum and tissue TK1 levels.
In general, the role of TK1 as a tumor marker has not yet been elucidated in traditional studies. Therefore, a pooled analysis is required. The aim of this meta-analysis was to evaluate the results of previous studies and compare the diagnostic role of TK1 in patients with untreated solid and non-solid tumors.
Materials and methods
Study search protocol
A total of 15 studies were identified by primary search strategies using the keywords ‘thymidine kinase’ combined with ‘tumor’ and synonyms in Pubmed, EMBASE and the Cochrane Library.
Inclusion criteria and data extraction
Studies were included if they met the following criteria: i) sensitivity and specificity were described or could be calculated from tables or figures; ii) detection was performed prior to any treatment; and iii) only healthy individuals were recruited as controls. Meeting abstracts not accompanied by full articles and other incomplete reports were excluded. Two authors independently reviewed the study titles and abstracts identified by the search, evaluated each study for inclusion and retrieved potentially eligible studies for full-text evaluation. Any discrepancies were settled by a third author. Two authors independently extracted data from each eligible study. When studies provided ≥2 tables for ≥2 tumors (e.g., breast and lung cancer), the available tables were separately reconstructed.
Quality assessment
Seven variables were regarded as potential confounders for explaining heterogeneity and interstudy variability: i) variety of detection methods; ii) proportion of patients with different clinical grade and level; iii) year of publication; iv) study design, cohort or case-control study; v) blinding: whether final diagnosis of tumor was performed independently from the test result; vi) consecutive recruitment of patients; and vii) existence of verification bias: whether only patients with positive test results received the reference standard. The latter five variables were introduced to assess the quality of studies according to the guidelines of Preferred Reporting Items for Systematic Reviews and Meta-Analyses (PRISMA) (24).
Statistical analysis
The sensitivity, specificity, negative likelihood ratio (LR), positive LR and diagnostic odds ratio (DOR) of each tumor, which represent the comprehensive ability of a diagnostic test, were assessed. Since there is an inverse association between sensitivity and specificity, it is inappropriate to estimate their means separately (25,26). In addition, another approach was applied to combine the results of primary studies, i.e., to draw a summary receiver operating characteristic (SROC) curve. Weighted linear regression analysis was applied and SROC curves were drawn. The area under the curve (AUC) was also calculated by Stata statistical software version 12.
The likelihood ratio positive (LRP) was assessed on the hypothesis that a positive result may lead to a confirming test which is always discussed with likelihood ratios negative (LRN), expressing how much more frequent the positive results are among subjects with the disease than among those without disease, independent from pretest probability or disease prevalence. LRPs >10 and <10 are considered to provide strong evidence to include or dismiss diagnoses, respectively, in the majority of circumstances (27,28). The pooled DORs and LRs and their 95% confidence intervals (CIs) were calculated for random-effect models and the heterogeneity of the odds ratio (OR) was assessed using a homogeneity Chi-square test by Stata statistical software version 12.0.
Publication bias
To assess the presence of publication bias, funnel plots were created for each diagnostic test. The inverse of the standard error of the natural logarithm of the DOR was plotted against the natural logarithm of the DOR. Its asymmetry was assessed by a significance test using the linear regression method suggested by Egger et al (29,30). In this regression method, the standardized effect, defined as the effect divided by its standard error, is regressed against the precision of the effect, defined as the inverse of the standard error. The intercept α provides a quantitative measure of the asymmetry and is of interest (31). The more the intercept deviates from zero, the more pronounced the asymmetry. Negative values of α indicate that less precise studies have a more pronounced effect compared to more precise studies, suggesting publication bias. However, a positive intercept does not suggest a selection bias but rather heterogeneity of the included studies. P<0.05 of zero intercept is considered to indicate a statistically significant difference.
Results
Study characteristics
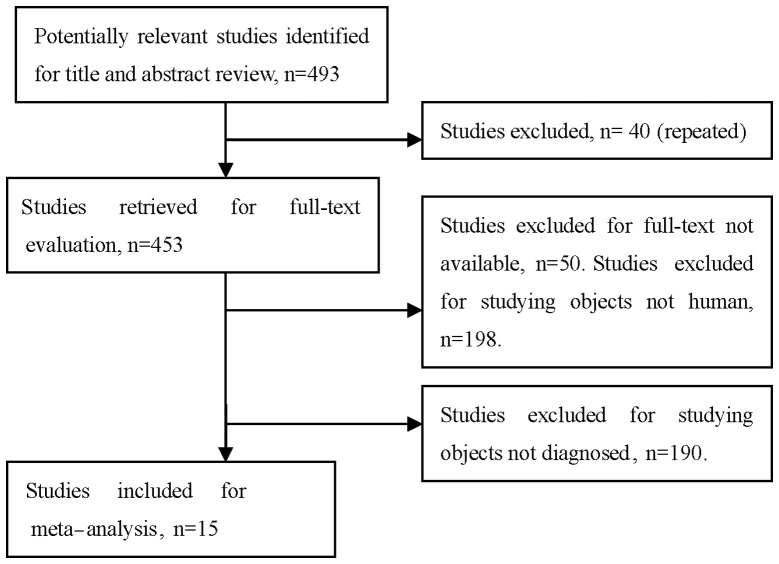
After reviewing the titles and abstracts of the 493 studies, 478 were excluded: 40 due to repetition, 190 recruited patients in whom TK1 was detected following chemotherapy or surgery, the full text was unavailable for 50 studies and 198 studies were not conducted on human subjects. A total of 15 eligible studies involving 1,840 patients and 1,664 controls were included in the pooled analyses (12,19,32–44) (Fig. 1). Among these, 12 investigated solid tumors (8,12,32–40,42,44) and included 1,538 patients and 1,484 controls and 3 investigated non-solid tumors (19,40,42) and included 302 patients and 180 controls. The solid tumors included 7 breast carcinomas (33,35–39,43), 2 renal carcinomas (12,34), 1 lung (35), 1 ovarian (42) and 1 head and neck cancer (31). Six studies used CLIA (12,19,33–36), five studies used REA (32,41–44) and two studies used ELISA (37,38) and two studies used IHC (37–39,41). The characteristics of the selected studies are summarized in Table I.
Figure 1.
Studies identified with criteria for inclusion and exclusion.
Table I.
Characteristics of the eligible studies included in the meta-analysis.
| Author | Year | Tp | Fp | Fn | Tn | Disease | Method | Threshold | Ref. |
|---|---|---|---|---|---|---|---|---|---|
| Xu | 2008 | 88 | 7 | 136 | 754 | Breast cancer | CLIA | 2 pmol/l | (33) |
| Xu | 2009 | 51 | 12 | 29 | 88 | CLL | CLIA | 2 pmol/l | (19) |
| Luo | 2009 | 15 | 1 | 12 | 29 | RCC | CLIA | 2 pmol/l | (12) |
| Nisman | 2010 | 63 | 2 | 100 | 18 | RCC | CLIA | 2 pmol/l | (34) |
| Li | 2010 | 63 | 8 | 38 | 87 | Lung cancer | CLIA | 2 pmol/l | (9) |
| Nisman | 2010 | 91 | 14 | 70 | 106 | Breast cancer | CLIA | 2 pmol/l | (36) |
| Carlsson | 2009 | 34 | 11 | 71 | 89 | Breast cancer | ELISA | 12.3 U/l | (37) |
| McKenna | 1988 | 44 | 112 | 26 | 63 | Breast cancer | ELISA | 12.3 U/l | (38) |
| Alegre | 2012 | 79 | 6 | 18 | 12 | Breast cancer | IHC | (39) | |
| Romain | 2000 | 169 | 10 | 42 | 15 | Breast cancer | IHC | (40) | |
| Walther | 1993 | 10 | 2 | 16 | 18 | Head and neck cancer | REA | 5 U/l | (32) |
| Di Raimondo | 2001 | 173 | 7 | 15 | 23 | CLL | REA | 5 U/l | (41) |
| Vrzalova | 2009 | 10 | 1 | 9 | 19 | Ovarian cancer | REA | 5 U/l | (42) |
| Votava | 2007 | 27 | 10 | 17 | 40 | ALL | REA | 5 U/l | (43) |
| Svobodova | 2007 | 181 | 5 | 154 | 95 | Breast cancer | REA | 5 U/l | (44) |
Tp, true-positive; Fp, false-positive; Fn, false-negative; Tn, true-negative; CLIA, chemiluminescence immunoassay; CLL, chronic lymphocytic leukemia; RCC, renal cell carcinoma; ELISA, enzyme-linked immunosorbent assay; IHC, immunohistochemistry; REA, radioenzymatic assay; ALL, acute lymphoblastic leukemia.
Sensitivity, specificity and DOR
Sensitivity and specificity, DOR and LRs with 95% confidence intervals were recalculated for each primary study from the contingency tables of true-positive, false-positive, true-negative and false-negative results. Sensitivity and specificity are shown in Table II. DORs calculated were stratified by cut-off values and combined (Table II).
Table II.
Estimated sensitivity, specificity and DOR of REA, CLIA and their combinations regarding TK1.
| Estimate | 95% CI | |||||
|---|---|---|---|---|---|---|
|
|
|
|||||
| Parameter | Total | CLIA | REA | Total | CLIA | REA |
| Sensitivity | 0.601 | 0.519 | 0.643 | 0.497–0.696 | 0.436–0.601 | 0.424–0.815 |
| Specificity | 0.882 | 0.949 | 0.891 | 0.790–0.936 | 0.889–0.978 | 0.798–0.944 |
| Positive likelihood ratio | 5.072 | 10.229 | 5.902 | 2.979–8.635 | 5.171–20.234 | 3.521–9.893 |
| Negative likelihood ratio | 0.453 | 0.506 | 0.401 | 0.363–0.564 | 0.440–0.583 | 0.236–0.680 |
| Diagnostic score | 2.416 | 3.005 | 2.690 | 1.836–2.997 | 2.395–3.616 | 1.968–3.412 |
| DOR | 11.202 | 20.196 | 14.734 | 6.268–20.020 | 10.966–37.195 | 7.159–30.325 |
| ROC area, AUC | 0.80 | 0.75 | 0.88 | 0.76–0.83 | 0.71–0.78 | 0.85–0.91 |
DOR, diagnostic odds ratio; REA, radioenzymatic assay; CLIA, chemiluminescence immunoassay; TK1, thymidine kinase; ROC, receiver operating characteristic; AUC, area under the curve.
SROC analysis
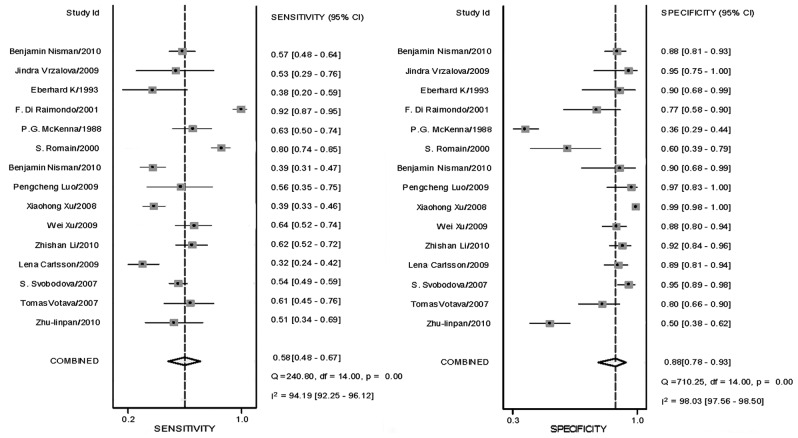
ROC curves were plotted and the AUCs were compared for specificity and sensitivity in the three detection method groups. The SROC and analysis of the combinations are shown in Table II and Fig. 2. The AUC shows the reliability of the TK1 assay when used to discriminate between healthy individuals and patients with malignancies. A value >0.7 and <0.9 indicates that the REA and the REA + CLIA TK1 assays are of moderate reliability. The AUC for CLIA was 0.75, suggesting that the ECL TK1 assay is of moderate reliability.
Figure 2.
Funnel plot of sensitivity and specificity of thymidine kinase. Summary graphs were created with study-specific (box) and overall (diamond) point estimates and confidence intervals (CIs) for each performance index pair using graph combine. The squares and horizontal lines correspond to the study-specific odds ratio (OR) and 95% CI, respectively. The area of the squares reflects the study-specific weight. The diamond represents the pooled OR and 95% CI.
LRP and LRN
LRP and LRN were also calculated. LRs are used to determine whether any given test result raises or lowers the probability that a disease exists. For high diagnostic informativeness, an LR of >10 or <0.1 would be required for a positive and negative test result, respectively. Moderate informational value may be achieved with LR values of 5-10 and 0.1–0.2; LRs of 2–5 and 0.2–0.5 are of limited informational value (26). LRPs were calculated and combined (Table II). To assess the optimal detection method, we compared LRPs calculated by ECL, since ≤3 studies used REA and IHC/ELISA. Among these studies, the ability of the STK1 assay to discriminate between malignant and non-malignant groups was assessed by ROC analysis.
Assessment for publication bias
The P-values of TK1 in Begg’s and Egger’s tests were 0.529 and 0.917, respectively (data not shown). The Begg’s funnel plot may be used to investigate whether all studies come from a single population and to search for publication bias (Fig. 9) and it suggested that all studies came from a single population (30).
Figure 9.
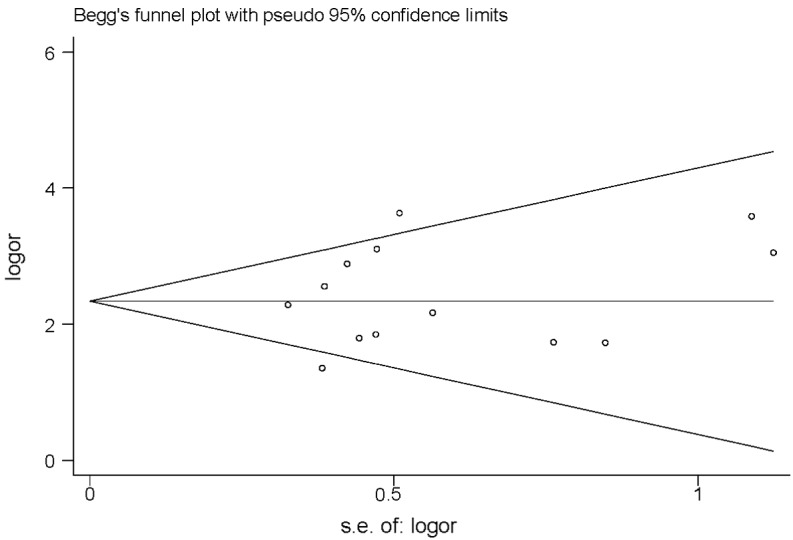
Begg’s funnel plot of thymidine kinase 1.
Discussion
The clinical or patient-relevant utility of diagnostic tests is evaluated using the sensitivity, specificity, positive and negative LRs and DOR. In our study, the sensitivity of REA was slightly higher compared to that of CLIA (0.643 and 0.519, respectively; Table II). By contrast, the specificity, the LRPs and the DOR of CLIA were higher compared to those of REA, although the ROC of REA was slightly higher compared to that of CLIA (Table II). Therefore, the CLIA method is valuable for tumor diagnosis.
The likelihood ratios (LRs) determine whether any given test result raises or lowers the probability that a disease exists. In order for diagnostic informativeness to be high, an LR of >10 or <0.1 is required for a positive or negative test result, respectively (25). Moderate informational value may be achieved with LR values of 5–10 and 0.1–0.2, while LR of 2–5 and 0.2–0.5 are of small informational value (26). In our study, the positive and negative LR values were 5.072 and 0.453 in total, 10.229 and 0.506 in CLIA and 5.902 and 0.401 in REA, respectively. It was observed that CLIA was of high diagnostic value in the positive test results and all the methods were of low diagnostic value in the negative test results.
The ROC analysis of the TK1 assay in the present study resulted in an AUC of >0.7 and <0.9, suggesting that the TK1 assay is a test of moderate ability of discrimination between healthy individuals and patients with pre-malignancies or malignancies. The AUC is the average true positive rate of the entire range of false-positive rate values. The following guidelines have been suggested for interpretation of AUC values: low (0.5≥AUC≤0.7), moderate (0.7≥AUC≤0.9), or high (0.9≥AUC≤1) accuracy (45). In our study, AUC was 0.78 in total, 0.67 in ECL and 0.88 in REA. The diagnostic accuracy of REA was found to be inferior to that of CLIA. The higher diagnostic specificity of CLIA compared to that of REA (Table II), suggests that CLIA may improve the efficacy of surveillance programs. The higher AUC of REA compared to that of CLIA (Table II), suggests that REA may improve the accuracy of surveillance programs. However, both are of moderate diagnostic value.
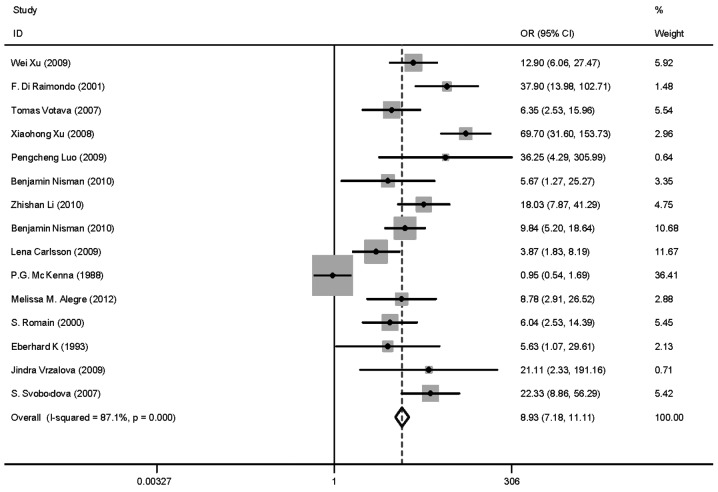
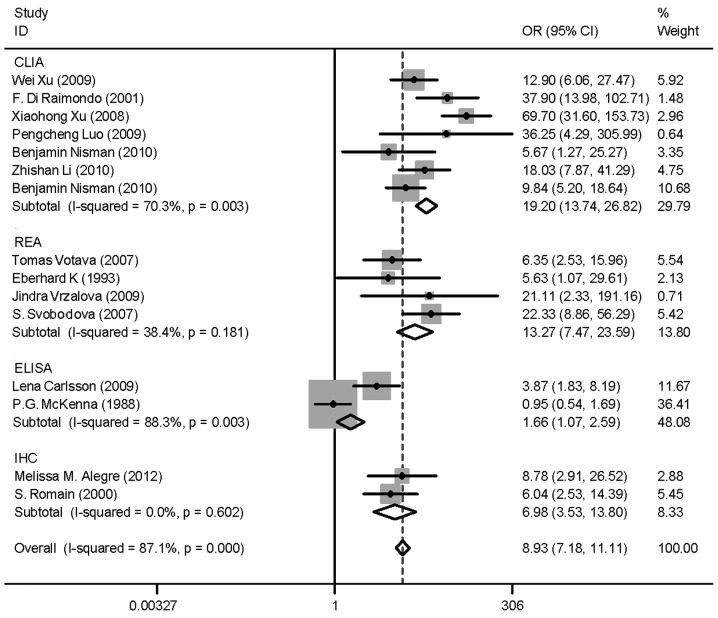
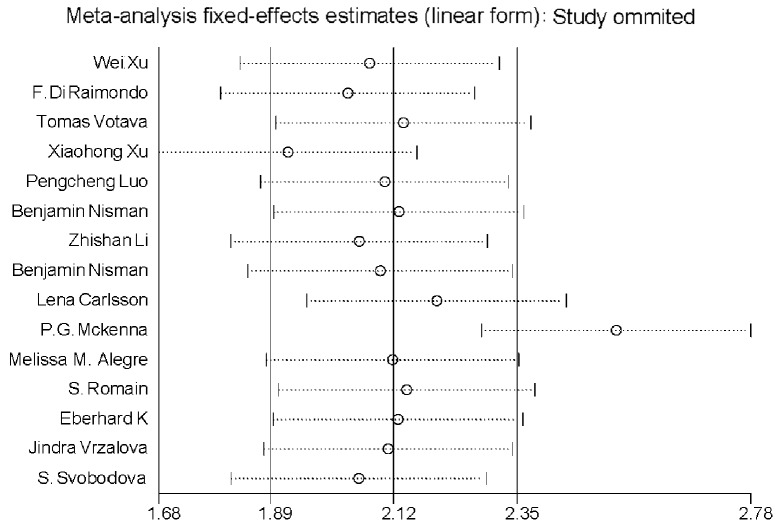
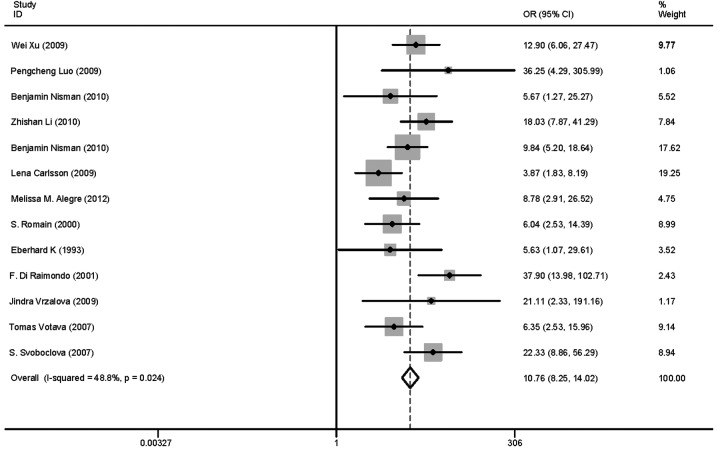
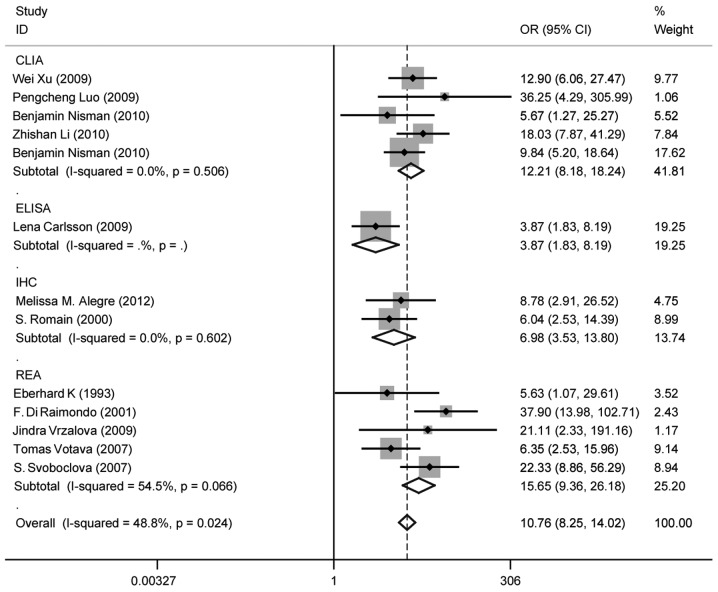
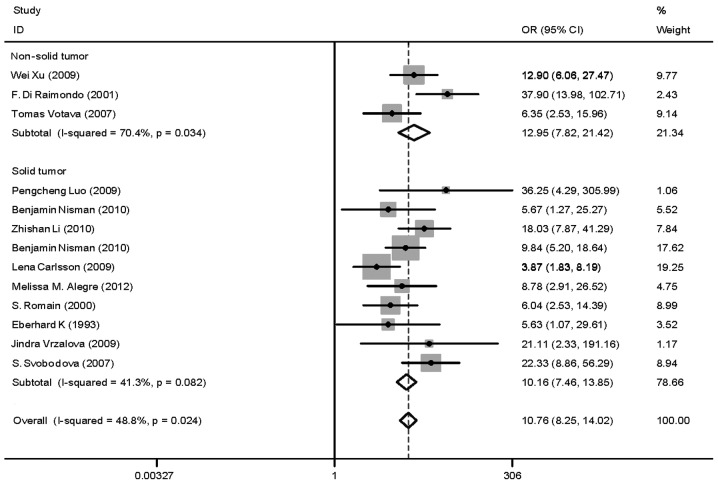
Heterogeneity (or absence of homogeneity) of the results among the studies is assessed graphically by forest plots and statistically using the quantity I2 that describes the percentage of total variation across studies. A value of 0% indicates no observed heterogeneity and values >50% indicate substantial heterogeneity. In our study, the I2 was 87.1% (Fig. 3). There was significant heterogeneity among studies. Numerous sources of heterogeneity may occur, such as characteristics of the study population, variations in the study design, different statistical methods and adjustment for different covariates (if relevant) (47). Therefore, the 15 studies were divided into four groups according to the different methods. The I2 value of CLIA and ELISA remained >50% (Fig. 4). Subsequently, a meta-regression analysis was conducted and two studies were identified as responsible for the heterogeneity. One study was by McKenna et al (38), which used ELISA to detect TK1 activity and the other was by Xu et al (33), which used CLIA to perform health screening. The reasons for the heterogeneity were the different detection target and different population (Fig. 5). The two studies were deleted from our meta-analysis and the I2 value was again calculated (Figs. 6 and 7). The I2 value had been reduced to 48.8%. According to certain studies, the TK1 was suitable for non-solid tumor diagnosis (43). The 13 remaining studies were grouped into non-solid and solid tumor groups and I2 was calculated again. The I2 value indicated that there was obvious heterogeneity in the non-solid tumor group (Fig. 8). However, additional studies on non-solid tumors are required to reach a definitive conclusion.
Figure 3.
Odds ratio (OR) funnel plot of total studies on thymidine kinase 1. Summary graphs were created with OR (box) and overall (diamond) point estimates and 95% confidence interval (CI) for each performance index pair using graph combine.
Figure 4.
Odds ratio (OR) funnel plot of thymidine kinase 1 (TK1) subgroups according to different method. The methods used included chemiluminescence immunoassay (CLIA), radioenzymatic assay (REA), enzyme-linked immunosorbent assay (ELISA) and ELISA. There was no change in I2; however, it appears that the main heterogeneity may be attributed to CLIA and ELISA. CI, confidence interval.
Figure 5.
Meta-regression analysis on sensitivity. Variance analysis of thymidine kinase 1 concentration levels in patients with solid carcinoma and other types of carcinoma prior to therapy. A cumulative meta-analysis investigates the effect of each individual study on the overall meta-analysis summary estimate. It is evident that two studies are out of the range of sensitivity. These are Xu et al (33) and McKenna et al (38).
Figure 6.
Odds ratio (OR) funnel plot of thymidine kinase 1 following deletion of the two studies which were recognized as the main source of heterogeneity. Although P<0.05, I2 was decreased from 87.1 to 48.8%. CI, confidence interval.
Figure 7.
Odds ratio (OR) funnel plot of thymidine kinase 1 subgroups according to different methods following deletion of the two studies mentioned above. [Xu et al (33) and McKenna et al (38)]. One of these used the chemiluminescence immunoassay (CLIA) and the other one the enzyme-linked immunosorbent assay (ELISA) method. P-value >0.05. No I2 or P-value could be calculated for ELISA as there was only one study. CI, confidence interval.
Figure 8.
Odds ratio (OR) funnel plot of thymidine kinase 1 subgroups according to non-solid and solid tumor. P>0.05, in solid tumors and P<0.05 in non-solid tumors. CI, confidence interval.
Publication bias was assessed visually by using a scatter plot (Fig. 9) and Begg’s and Egg’s tests. In a meta-analysis, such a plot may be used to test the assumption of normality, investigate whether all studies originate from a single population and identify publication bias (47). The Begg’s and Egg’s tests did not reveal the existence of such publication bias; therefore, the conclusion is considered reliable.
In conclusion, the TK1 biomarker exhibits moderate specificity and sensitivity and thus is moderately reliable as a marker for tumor diagnosis. It may be more useful to combine TK1 with other tumor markers for the diagnosis and monitoring of the tumor therapy outcome. The results of this meta-analysis were not in accordance with those of other meta-analyses, possibly due to the limited number of the studies included. Additional studies are required to integrate TK1 in existing risk calculators to enhance their prognostic value.
Acknowledgments
This study was supported by the Research project A2010166, Department of Science and Technology of Guangdong, Guangzhou, P.R. China.
References
- 1.Xu Y, Shi QL, Ma H, et al. High thymidine kinase 1 (TK1) expression is a predictor of poor survival in patients with pT1 of lung adenocarcinoma. Tumour Biol. 2012;33:475–483. doi: 10.1007/s13277-011-0276-0. [DOI] [PubMed] [Google Scholar]
- 2.Rauhala A, Rantalaiho V, Almqvist A, Putkonen M. Serum thymidine kinase in the monitoring of lymphoma patients. Duodecim. 1995;111:428–434. (In Finnish) [PubMed] [Google Scholar]
- 3.Sampi K, Takagi T, Sakai C, Kuraishi Y, Ishige K. Clinical application of thymidine kinase activity in patients with acute non-lymphocytic leukemia. Gan To Kagaku Ryoho. 1991;18:69–73. (In Japanese) [PubMed] [Google Scholar]
- 4.Shintani M, Urano M, Takakuwa Y, et al. Immunohistochemical characterization of pyrimidine synthetic enzymes, thymidine kinase-1 and thymidylate synthase in various types of cancer. Oncol Rep. 2010;23:1345–1350. doi: 10.3892/or_00000770. [DOI] [PubMed] [Google Scholar]
- 5.Mao Y, Wu J, Wang N, et al. A comparative study: immunohistochemical detection of cytosolic thymidine kinase and proliferating cell nuclear antigen in breast cancer. Cancer Invest. 2002;20:922–931. doi: 10.1081/cnv-120005905. [DOI] [PubMed] [Google Scholar]
- 6.Aufderklamm S, Hennenlotter J, Todenhoefer T, et al. Xpa-210: a new proliferation marker determines locally advanced prostate cancer and is a predictor of biochemical recurrence. World J Urol. 2012;30:547–552. doi: 10.1007/s00345-011-0768-y. [DOI] [PubMed] [Google Scholar]
- 7.Stalhandske P, Wang L, Westberg S, et al. Homogeneous assay for real-time and simultaneous detection of thymidine kinase 1 and deoxycytidine kinase activities. Anal Biochem. 2013;432:155–164. doi: 10.1016/j.ab.2012.08.004. [DOI] [PubMed] [Google Scholar]
- 8.He Q, Zhang P, Zou L, et al. Concentration of thymidine kinase 1 in serum (S-TK1) is a more sensitive proliferation marker in human solid tumors than its activity. Oncol Rep. 2005;14:1013–1019. [PubMed] [Google Scholar]
- 9.Li Z, Wang Y, Ma J, et al. Transient increase in serum thymidine kinase 1 within one week after surgery of patients with carcinoma. Anticancer Res. 2010;30:1295–1299. [PubMed] [Google Scholar]
- 10.Aufderklamm S, Todenhofer T, Gakis G, et al. Thymidine kinase and cancer monitoring. Cancer Lett. 2012;316:6–10. doi: 10.1016/j.canlet.2011.10.025. [DOI] [PubMed] [Google Scholar]
- 11.Sakamoto S, Hirai H, Taga H, et al. Thymidine kinase and alpha-fetoprotein as biochemical markers of hepatocarcinogenesis induced by 3′-methyl-4-dimethylaminoazobenzene treatment in rats. Carcinogenesis. 1990;11:145–150. doi: 10.1093/carcin/11.1.145. [DOI] [PubMed] [Google Scholar]
- 12.Luo P, He E, Eriksson S, et al. Thymidine kinase activity in serum of renal cell carcinoma patients is a useful prognostic marker. Eur J Cancer Prev. 2009;18:220–224. doi: 10.1097/CEJ.0b013e328329d817. [DOI] [PubMed] [Google Scholar]
- 13.O’Neill KL, Zhang F, Li H, Fuja DG, Murray BK. Thymidine kinase 1-a prognostic and diagnostic indicator in ALL and AML patients. Leukemia. 2007;21:560–563. doi: 10.1038/sj.leu.2404536. [DOI] [PubMed] [Google Scholar]
- 14.Zhang J, Jia Q, Zou S, et al. Thymidine kinase 1: A proliferation marker for determining prognosis and monitoring the surgical outcome of primary bladder carcinoma patients. Oncol Rep. 2006;15:455–461. [PubMed] [Google Scholar]
- 15.Gronowitz JS, Kallander CF. Optimized assay for thymidine kinase and its application to the detection of antibodies against herpes simplex virus type 1- and 2-induced thymidine kinase. Infect Immun. 1980;29:425–434. doi: 10.1128/iai.29.2.425-434.1980. [DOI] [PMC free article] [PubMed] [Google Scholar]
- 16.Kemik O, Kemik AS, Purisa S, Tuzun S. Serum thymidine kinase is associated with gastric adenocarcinoma. Bratisl Lek Listy. 2011;112:510–511. [PubMed] [Google Scholar]
- 17.Rivkina A, Vitols G, Murovska M, Lejniece S. Identifying the stage of new CLL patients using TK, ZAP-70, CD38 levels. Exp Oncol. 2011;33:99–103. [PubMed] [Google Scholar]
- 18.Barth RF, Yang W, Wu G, et al. Thymidine kinase 1 as a molecular target for boron neutron capture therapy of brain tumors. Proc Natl Acad Sci USA. 2008;105:17493–17497. doi: 10.1073/pnas.0809569105. [DOI] [PMC free article] [PubMed] [Google Scholar]
- 19.Xu W, Cao X, Miao KR, et al. Serum thymidine kinase 1 concentration in Chinese patients with chronic lymphocytic leukemia and its correlation with other prognostic factors. Int J Hematol. 2009;90:205–211. doi: 10.1007/s12185-009-0380-8. [DOI] [PubMed] [Google Scholar]
- 20.Konoplev SN, Fritsche HA, O’Brien S, et al. High serum thymidine kinase 1 level predicts poorer survival in patients with chronic lymphocytic leukemia. Am J Clin Pathol. 2010;134:472–477. doi: 10.1309/AJCPHMYT93HUIZKW. [DOI] [PubMed] [Google Scholar]
- 21.von Euler HP, Ohrvik AB, Eriksson SK. A non-radiometric method for measuring serum thymidine kinase activity in malignant lymphoma in dogs. Res Vet Sci. 2006;80:17–24. doi: 10.1016/j.rvsc.2005.05.001. [DOI] [PubMed] [Google Scholar]
- 22.Magnac C, Porcher R, Davi F, et al. Predictive value of serum thymidine kinase level for Ig-V mutational status in B-CLL. Leukemia. 2003;17:133–137. doi: 10.1038/sj.leu.2402780. [DOI] [PubMed] [Google Scholar]
- 23.Brockenbrough JS, Morihara JK, Hawes SE, et al. Thymidine kinase 1 and thymidine phosphorylase expression in non-small- cell lung carcinoma in relation to angiogenesis and proliferation. J Histochem Cytochem. 2009;57:1087–1097. doi: 10.1369/jhc.2009.952804. [DOI] [PMC free article] [PubMed] [Google Scholar]
- 24.Raman G, Gaylor JM, Rao M, et al. Quality of reporting in systematic reviews of implantable medical devices [Internet] Rockville (MD): Agency for Healthcare Research and Quality (US); 2012. Report No.: 12(13)-EHC116-EF. [PubMed] [Google Scholar]
- 25.Li F, Tie R, Chang K, et al. Does risk for ovarian malignancy algorithm excel human epididymis protein 4 and CA125 in predicting epithelial ovarian cancer: a meta-analysis. BMC Cancer. 2012;12:258. doi: 10.1186/1471-2407-12-258. [DOI] [PMC free article] [PubMed] [Google Scholar]
- 26.Zhang J, Xv Z, Wu X, Li K. Potential diagnostic value of serum p53 antibody for detecting esophageal cancer: a meta-analysis. PLoS One. 2012;7:e52896. doi: 10.1371/journal.pone.0052896. [DOI] [PMC free article] [PubMed] [Google Scholar]
- 27.Wang XW, Xiong YH, Zen XQ, Lin HB, Liu QY. Diagnostic accuracy of ultrasonograph guided fine-needle aspiration cytologic in staging of axillary lymph node metastasis in breast cancer patients: a meta-analysis. Asian Pac J Cancer Prev. 2012;13:5517–5523. doi: 10.7314/apjcp.2012.13.11.5517. [DOI] [PubMed] [Google Scholar]
- 28.Galhardo AP, da Costa Leite C, Gebrim EM, et al. The correlation of research diagnostic criteria for temporomandibular disorders and magnetic resonance imaging: a study of diagnostic accuracy. Oral Surg Oral Med Oral Pathol Oral Radiol. 2013;115:277–284. doi: 10.1016/j.oooo.2012.10.020. [DOI] [PubMed] [Google Scholar]
- 29.Egger M, Smith GD, Phillips AN. Meta-analysis: principles and procedures. BMJ. 1997;315:1533–1537. doi: 10.1136/bmj.315.7121.1533. [DOI] [PMC free article] [PubMed] [Google Scholar]
- 30.Egger M, Smith GD. Meta-analysis. Potentials and promise. BMJ. 1997;315:1371–1374. doi: 10.1136/bmj.315.7119.1371. [DOI] [PMC free article] [PubMed] [Google Scholar]
- 31.Egger M, Davey SG, Schneider M, Minder C. Bias in meta-analysis detected by a simple, graphical test. BMJ. 1997;315:629–634. doi: 10.1136/bmj.315.7109.629. [DOI] [PMC free article] [PubMed] [Google Scholar]
- 32.Walther EK, Dahlmann N, Gorgulla HT. Tumor markers in the diagnosis and follow-up of head and neck cancer: role of CEA, CA 19-9, SCC, TK, and dTTPase. Head Neck. 1993;15:230–235. doi: 10.1002/hed.2880150310. [DOI] [PubMed] [Google Scholar]
- 33.Xu XH, Zhang YM, Shu XH, et al. Serum thymidine kinase 1 reflects the progression of pre-malignant and malignant tumors during therapy. Mol Med Report. 2008;1:705–711. doi: 10.3892/mmr_00000017. [DOI] [PubMed] [Google Scholar]
- 34.Nisman B, Yutkin V, Nechushtan H, et al. Circulating tumor m2 pyruvate kinase and thymidine kinase 1 are potential predictors for disease recurrence in renal cell carcinoma after nephrectomy. Urology. 2010;76:513.e1–513.e6. doi: 10.1016/j.urology.2010.04.034. [DOI] [PubMed] [Google Scholar]
- 35.Li Z, Wang Y, He J, et al. Serological thymidine kinase 1 is a prognostic factor in oesophageal, cardial and lung carcinomas. Eur J Cancer Prev. 2010;19:313–318. doi: 10.1097/CEJ.0b013e32833ad320. [DOI] [PubMed] [Google Scholar]
- 36.Nisman B, Allweis T, Kaduri L, et al. Serum thymidine kinase 1 activity in breast cancer. Cancer Biomark. 2010;7:65–72. doi: 10.3233/CBM-2010-0148. [DOI] [PubMed] [Google Scholar]
- 37.Carlsson L, Larsson A, Lindman H. Elevated levels of thymidine kinase 1 peptide in serum from patients with breast cancer. Ups J Med Sci. 2009;114:116–120. doi: 10.1080/03009730802688835. [DOI] [PMC free article] [PubMed] [Google Scholar]
- 38.McKenna PG, O’Neill KL, Abram WP, Hannigan BM. Thymidine kinase activities in mononuclear leukocytes and serum from breast cancer patients. Br J Cancer. 1988;57:619–622. doi: 10.1038/bjc.1988.141. [DOI] [PMC free article] [PubMed] [Google Scholar]
- 39.Alegre MM, Robison RA, O’Neill KL. Thymidine kinase 1 upregulation is an early event in breast tumor formation. J Oncol. 2012;2012:575647. doi: 10.1155/2012/575647. [DOI] [PMC free article] [PubMed] [Google Scholar]
- 40.Romain S, Spyratos F, Descotes F, et al. Prognostic of DNA-synthesizing enzyme activities (thymidine kinase and thymidylate synthase) in 908 T1-NT2, N0-N1, M0 breast cancers: a retrospective multicenter study. Int J Cancer. 2000;87:860–868. [PubMed] [Google Scholar]
- 41.Di Raimondo F, Giustolisi R, Lerner S, et al. Retrospective study of the prognostic role of serum thymidine kinase level in CLL patients with active disease treated with fludarabine. Ann Oncol. 2001;12:621–625. doi: 10.1023/a:1011138825593. [DOI] [PubMed] [Google Scholar]
- 42.Vrzalova J, Prazakova M, Novotny Z, et al. Test of ovarian cancer multiplex xMAP technology panel. Anticancer Res. 2009;29:573–576. [PubMed] [Google Scholar]
- 43.Votava T, Topolcan O, Holubec LJ, et al. Changes of serum thymidine kinase in children with acute leukemia. Anticancer Res. 2007;27:1925–1928. [PubMed] [Google Scholar]
- 44.Svobodova S, Topolcan O, Holubec L, et al. Prognostic importance of thymidine kinase in colorectal and breast cancer. Anticancer Res. 2007;27:1907–1909. [PubMed] [Google Scholar]
- 45.Swets JA. Measuring the accuracy of diagnostic systems. Science. 1988;240:1285–1293. doi: 10.1126/science.3287615. [DOI] [PubMed] [Google Scholar]
- 46.Dinnes J, Deeks J, Kirby J, Roderick P. A methodological review of how heterogeneity has been examined in systematic reviews of diagnostic test accuracy. Health Technol Assess. 2005;9:1–113. doi: 10.3310/hta9120. [DOI] [PubMed] [Google Scholar]
- 47.Hwang Y, Wang B, Bushman FD. Molluscum contagiosum virus topoisomerase: purification, activities, and response to inhibitors. J Virol. 1998;72:3401–3406. doi: 10.1128/jvi.72.4.3401-3406.1998. [DOI] [PMC free article] [PubMed] [Google Scholar]


