

Abstract
The activation of mTOR signaling is necessary for mechanically-induced changes in skeletal muscle mass, but the mechanisms that regulate the mechanical activation of mTOR signaling remain poorly defined. In this study, we set out to determine if changes in the phosphorylation of Raptor contribute to the mechanical activation of mTOR. To accomplish this goal, mouse skeletal muscles were subjected to mechanical stimulation via a bout of eccentric contractions (EC). Using mass spectrometry and Western blot analysis, we found that ECs induced an increase in Raptor S696, T706, and S863 phosphorylation, and this effect was not inhibited by rapamycin. This observation suggested that changes in Raptor phosphorylation might be an upstream event in the pathway through which mechanical stimuli activate mTOR. To test this, we employed a phospho-defective mutant of Raptor (S696A/T706A/S863A) and found that the EC-induced activation of mTOR signaling was significantly blunted in muscles expressing this mutant. Furthermore, mutation of the three phosphorylation sites altered the interactions of Raptor with PRAS40 and p70S6k, and it also prevented the EC-induced dissociation of Raptor from p70S6k. Combined, these results suggest that changes in the phosphorylation of Raptor play an important role in the pathway through which mechanical stimuli activate mTOR signaling.
Keywords: mTOR, Raptor, Hypertrophy, Mechanotransduction, Skeletal Muscle, Exercise
INTRODUCTION
Skeletal muscles make up the largest proportion of the body's mass, and they are not only the motors that drive locomotion, but they also play a crucial role in whole body metabolism [1, 2]. Accordingly, it has been well recognized that the maintenance of skeletal muscle mass contributes significantly to disease prevention and issues associated with the quality of life [3].
Skeletal muscle mass is known to be regulated by a variety of stimuli, one of which is mechanical loading. For instance, chronic mechanical loading induces an increase in muscle mass, while chronic mechanical unloading results in a loss of muscle mass [4]. Although it is well recognized that mechanical loads play a role in the regulation of muscle mass, the molecular mechanisms that regulate these changes remain poorly defined [5].
One molecule that has been widely implicated in the regulation of skeletal muscle mass is the Serine/Threonine kinase called the mammalian [or mechanistic] Target of Rapamycin (mTOR). For example, previous studies have shown that mechanically-induced muscle hypertrophy is associated with increases in mTOR signaling, while atrophy resulting from mechanical unloading is associated with decreased mTOR signaling [6, 7]. Furthermore, recent studies have provided genetic evidence which indicates that the activation of mTOR is sufficient to induce skeletal muscle hypertrophy, and that signaling through mTOR is necessary for a mechanically-induced hypertrophic response [8, 9].
mTOR exists in at least two distinct multi-protein complexes called mTORC1 and mTORC2 and signaling by mTORC1, but not mTORC2, can be inhibited by the drug rapamycin [10]. This is important because rapamycin has been shown to inhibit mechanical load-induced increases in mTOR-dependent signaling events, protein synthesis, and growth [9, 11, 12]. Thus, it has been widely concluded that signaling by mTORC1 is critical for mechanically-induced changes in muscle mass.
The mTORC1 complex contains mTOR and other accessory proteins such as Raptor and PRAS40 [13–16]. Previous studies have shown that Raptor, which binds directly to mTOR, acts as a scaffold protein and is important in the regulation of mTOR-dependent signaling events. For example, knockdown of Raptor using RNAi results in a reduction of cell size in-vitro. Furthermore, it has been demonstrated that skeletal muscle specific ablation of Raptor in-vivo results in the loss of muscle mass, and it also prevents mechanical load-induced hypertrophy [17–19]. Hence, it seems apparent that Raptor plays an important role in the regulation of mTOR signaling and muscle mass, but a complete understanding of the mechanisms through which Raptor regulates these processes is only beginning to be established.
Changes in the phosphorylation state of Raptor appear to be one mechanism through which Raptor can regulate mTOR signaling. For example, alterations in Raptor phosphorylation have been implicated in the regulation of mTOR signaling that occurs in response to insulin, osmotic stress and energetic stress [20–23]. It has also been shown that signaling through the Ras/MAPK pathway can induce changes in mTOR signaling by promoting alterations in the phosphorylation of Raptor [24, 25]. Combined, these studies have provided strong evidence to support the conclusion that mTOR signaling can be regulated through alterations in the phosphorylation state of Raptor. However, to date, the potential role of Raptor phosphorylation in the regulation of mTOR by mechanical stimuli has not been explored. Thus, the goal of this study was to determine if changes in the phosphorylation of Raptor contribute to the mechanical activation of mTOR signaling.
EXPERIMENTAL PROCEDURES
Materials
Primary antibodies, anti-total p70S6k (#2708), phospho Serine/Threonine – Proline (S*/T*-P) (#9391), phospho Akt substrate (RxRxxS*/T*) (#10001), total Raptor (#2280), phospho Raptor (S792) (#2083), total mTOR (#2972) and PRAS40 (#2691) were purchased from Cell Signaling Technology (Danvers, MA, USA). The primary antibody anti-phospho p70S6k(T389) (#sc-11759-R) was purchased from Santa Cruz Biotechnology (Santa Cruz, CA, USA). Phospho-specific Raptor antibodies (S696, T706, S859, S863, and S877) have been previously described [20] and were kindly provided by Dr. Diane Fingar (University of Michigan Medical School, Ann Arbor, Michigan, USA). The peroxidase labeled anti-rabbit IgG (H+L) secondary antibody (#PI-1000) was purchased from Vector Laboratories Inc. (Burlingame, CA, USA). Peroxidase labeled anti-rabbit IgG (Light Chain Specific) (#211-032-171) and anti-mouse IgG (Light Chain Specific) (#115-035-174) antibodies were purchased from Jackson ImmnunoResearch Laboratories Inc. (West Grove, PA, USA).
Animals
C57BL6 mice (Jackson Laboratories, Bar Harbor, MA, USA) 8–10 weeks of age were randomly assigned to different experimental groups. Before all surgical procedures, the mice were anaesthetized with an intraperitoneal injection of ketamine (100 mg/kg) and xylazine (10 mg/kg). After tissue extraction, the mice were sacrificed by cervical dislocation. All animals were housed in a room maintained with a 12-12 hr light–dark cycle and received food and water ad libitum. The Institutional Animal Care and Use Committee at the University of Wisconsin-Madison approved all of the methods employed in this study.
Plasmid Constructs and Purification
The GFP and GST-p70S6k plasmid constructs have been previously described [8]. Wild type FLAG-Raptor and FLAG-Raptor (S696A, T706A, S863A) have been previously described [21] and were kindly provided by Dr. Sung Ho Ryu (Pohang University of Science and Technology, Pohang, Kyungbuk, Korea). Myc-p70S6k was generated by using the QuickChange II Site-Directed Mutagenesis Kit (Agilent Technologies, Santa Clara, CA, USA) to insert a stop codon before the region that encodes for the GST tag on the Myc-p70S6k-GST plasmid that has been previously described [8]. All plasmid DNA was grown in DH5α E. Coli, purified with an Endofree plasmid kit (Qiagen, Valencia, CA) and resuspended in sterile phosphate buffered saline (PBS).
Skeletal Muscle Transfection (Electroporation)
As previously described [8], a small incision was made through the skin covering the TA muscle and then a 27-gauge needle was used to inject 12 μl of plasmid DNA solution containing 7.5–25 μg of GFP, wild type FLAG-Raptor (WT) or mutant FLAG-Raptor (S696A, T706A, S863A) (3A) and, when indicated, 2 μg of GST-or Myc-tagged p70S6k. After the injections, electric pulses were applied through two stainless steel pin electrodes (1-cm gap; Harvard Apparatus, Holliston, MA, USA) laid on top of the proximal and distal myotendinous junctions. Eight 20 ms square-wave electric pulses at a frequency of 1 Hz were delivered with an ECM 830 electroporation unit (BTX; Harvard Apparatus) at a field strength of 160 V/cm. After the electroporation procedure, the incision was closed with Vetbond surgical glue (3M Animal Care Products, St. Paul, MN, USA). Following the surgery, mice were given an intraperitoneal injection of buprenorphine (0.05 μg/g) dissolved in 100 μl of PBS.
Eccentric Contractions and Insulin Injections
The model previously described by O'Neil et al (2009) was used to induce eccentric contractions (EC) in the TA muscle [26]. Specifically, electrodes were placed on the sciatic nerve of the right leg and contractions were elicited by stimulating the sciatic nerve with an SD9E Grass stimulator (Grass Instruments, Quincy, MA, USA) at 100 Hz, 4–8 V pulse, for 10 sets of 6 contractions. Each contraction lasted 3 sec and was followed by a 10 sec rest period, and a 1 min rest period was provided between each set. The left (control) TA muscle and the right (EC) TA muscle were collected 40 min after the last set of contractions. When indicated, mice were also given an intraperitoneal injection of 20 U/kg Novolog® insulin (Novo Nordisk, Princeton, NJ, USA) dissolved in 100 μl of PBS at 30 min prior to the collection.
Rapamycin Injections
Rapamycin was purchased from LC laboratories (Woburn, MA, USA) and was dissolved in DMSO to generate a 5 μg/μl stock solution. Rapamycin was administered at a dose of 2.0 mg/kg and dissolved in a final volume of 200 μl PBS. For the vehicle condition, an equal amount of DMSO was dissolved in a final volume of 200 μl PBS. The vehicle or rapamycin solutions were administered via an intraperitoneal injection 100 min prior to the initiation of the EC protocol.
Sample Preparation for Immunoprecipitations and Western Blot Analysis
Upon collection, TA muscles were either immediately homogenized or frozen in liquid nitrogen. In some cases, the samples were homogenized with a Polytron for 20 sec in ice-cold buffer A (40 mM Tris (pH 7.5), 1 mM EDTA, 5 mM EGTA, 0.5% Triton X-100, 25 mM β-glycerophosphate, 25 mM NaF, 1 mM Na3VO4, 10 mg/ml leupeptin, and 1 mM PMSF) and the whole homogenate was used for further analysis. In other cases (e.g. preservation of the mTORC1 complex) the samples were homogenized with a Polytron for 20 sec in ice-cold CHAPS lysis buffer (40 mM HEPES (pH. 7.4), 2 mM EDTA, 0.3% CHAPS, 10 mM sodium pyrophosphate, 10 mM β-glycerophosphate, and 1 tablet of EDTA-free protease inhibitors (Roche) per 25 mL) and the whole homogenate was used for further analysis. Sample protein concentration was determined with a DC protein assay kit (Bio-Rad, Hercules, CA, USA), and unless otherwise noted (e.g. immunoprecipitation), equivalent amounts of protein from each sample were dissolved in 2x Laemmli buffer, heated to 100°C for 5 min and then subjected to Western blot analysis as described below.
Immunoprecipitation
Whole muscle homogenates were centrifuged at 2500 g for 5 min and equal amounts of protein from the supernatant were diluted to a volume of 0.5 ml with fresh ice-cold buffer A or ice-cold CHAPS lysis buffer. The samples were then incubated with 20–40 μl of EZview red ANTI-FLAG M2 or 25 μl of ANTI-Myc agarose affinity gel beads (Sigma-Aldrich) with gentle rocking at 4°C for 2 hr. Following the incubation, the beads were pelleted by centrifugation at 500 g for 30 sec and washed 4 times with fresh ice-cold buffer A (for samples collected in buffer A) or 4 times with ice-cold CHAPS lysis buffer containing 150 mM NaCl (for samples collected in CHAPS lysis buffer). The samples that were used to analyze the phosphorylation of Raptor on the consensus motifs (e.g. S*/T*-P) were washed an additional 3 times with ice-cold CHAPS lysis buffer containing 400 mM NaCl. After the washes, the beads were dissolved in 2x Laemmli buffer and heated to 100°C for 5 min. The beads were again pelleted by centrifugation at 500 g for 30 sec and the supernatant was subjected to Western blot analysis as described below. For samples being analyzed for Raptor / p70S6k interaction, FLAG-Raptor immunoprecipitates were washed 4 times with ice-cold buffer A and then eluted from the agarose by incubating samples with 50 μl of ice-cold FLAG peptide solution [0.3 μg/μl (Sigma-Aldrich, St. Louis, MO, USA) in 25 mM Tris (pH 7.5)] with gentle rocking at 4°C for 30 min. The eluate was collected and dissolved in 3x Laemmli buffer and heated to 100°C for 5 min and then subjected to Western blot analysis as described below.
λ Phosphatase Treatment
FLAG-tagged Raptor was immunoprecipitated as described above. The beads were then washed 4 times with ice-cold buffer A, 3 times with ice-cold CHAPS lysis buffer containing 400 mM NaCl followed by 2 additional washes with ice-cold TBS [50 mM Tris (pH 7.5) and 150 mM NaCl]. The beads were then resuspended in 50 μl of phosphatase buffer [50 mM Tris (pH 7.5), 100 mM NaCl, 2 mM DTT, 0.01% Brij35, 2 mM MnCl2, and 400 units λ phosphatase (New England Biolabs, Ipswich, MA, USA)] and incubated at 30°C for 1 hr. The reaction was terminated by the addition of 2x Laemmli buffer and the samples were heated to 100°C for 5 min and then subjected to Western blot analysis as described below.
Western Blot Analysis
Western blot analyses were performed as previously described [9]. Briefly, samples were subjected to electrophoretic separation by SDS-PAGE. Following electrophoretic separation, proteins were transferred to a PVDF membrane, blocked with 5% powdered milk in TBS containing 0.1% Tween 20 (TBST) for 1 hr. followed by an overnight incubation at 4°C with primary antibody dissolved in TBST containing 1% bovine serum albumin (BSA). After an overnight incubation, the membranes were washed for 30 min in TBST and then probed with a peroxidase-conjugated secondary antibody for 1 hr at room temperature. Following 30 min of washing in TBST, the blots were developed on film or with a Chemi410 camera mounted to a UVP Autochemi system (UVP, Upland, CA, USA) using regular enhanced chemiluminescence (ECL) reagent (Pierce, Rockford, IL, USA) or ECL Prime reagent (Amersham, Piscataway, NJ, USA). Once the appropriate image was captured, the membranes were stained with Coomassie Blue to verify equal loading in all lanes. Images were quantified using ImageJ software (U.S. National Institutes of Health, Bethesda, MD; http://rsb.info.nih.gov/nih-image/).
Mass Spectrometric Analysis
FLAG-tagged Raptor was immunoprecipitated as described above. The beads were washed 4 times with ice-cold CHAPS lysis buffer plus 150 mM NaCl. After the washes, the beads were dissolved in 2x Laemmli buffer and heated to 100°C for 5 min, and the samples were then resolved on a SDS-PAGE gel. The gel was stained with Coomassie Blue and the band corresponding to Raptor was cut out of the gel and subjected to in-gel trypsin digestion followed by LC/MS/MS.
In-gel digestion and mass spectrometric analysis was done at the Mass Spectrometry Facility [Biotechnology Center, University of Wisconsin-Madison, Madison, WI, USA]. Specifically, Coomassie stained gel pieces were de-stained completely in MeOH/H20/NH4HCO3 (50%:50%:100 mM), dehydrated for 2 min in ACN/H20/NH4HCO3 (50%:50%:25 mM) then once more for 30 sec in 100% ACN. After dehydration, the gel was dried in a Speed-Vac for 1 min, reduced in 25 mM DTT (Dithiotreitol in 25 mM NH4HCO3) for 30 min at 56°C, alkylated with 55 mM IAA (Iodoacetamide in 25 mM NH4HCO3) in darkness at room temperature for 30 min, and then washed once in H20. Next, the gel was dehydrated for 2 min in ACN/H20/NH4HCO3 (50%:50%:25 mM) then once more for 30 sec in 100% ACN, dried again and rehydrated with 20 μl of trypsin solution with 0.01% ProteaseMAX surfactant [10 ng/μl trypsin (Trypsin Gold from PROMEGA Corp.) in 25 mM NH4HCO3/0.01% w/v of ProteaseMAX (Promega Corp.)]. After sitting for 2 min at room temperature, an additional 30 μl of overlay solution [25 mM NH4HCO3/0.01% w/v of ProteasMAX (Promega Corp.)] was added to keep gel pieces immersed throughout the digestion. The digestion was conducted for 3 hr at 42°C and peptides generated from the digestion were transferred to a new Protein LoBind tube (~50 μl volume) where digestion was terminated by acidification with 2.5% TFA [Trifluoroacetic Acid] to a final concentration of 0.3% (7 μl added). The sample was then spun down for 10 min at max speed in a table centrifuge to pellet down any debris and the supernatant was transferred to a new Protein LoBind tube.
Peptides were analyzed by LC/MS/MS using the Agilent 1100 nanoflow system (Agilent, Palo Alto, CA, USA) connected to a hybrid linear ion trap-orbitrap mass spectrometer (LTQ-Orbitrap, Thermo Fisher Scientific, Bremen, Germany) equipped with a nanoelectrospray ion source. Chromatography of peptides prior to mass spectral analysis was accomplished using C18 reverse phase HPLC trap column (Zorbax 300SB-C18, 5 μM, 5×0.3 mm, Agilent) and capillary emitter column (in-house packed with MAGIC C18, 3 μM, 150×0.075 mm, Michrom Bioresources, Inc.) onto which 8 μl of extracted peptides were automatically loaded. NanoHPLC system delivered solvents A: 0.1% (v/v) formic acid in water, and B: 95% (v/v) acetonitrile, 0.1% (v/v) formic acid at either 10 μL/min, to load sample, or 0.20 μL/min, to elute peptides directly into the nanoelectrospray over 1 hr 1% (v/v) B to 60% (v/v) B followed by 10 min 60% (v/v) B to 100% (v/v) B gradient. As peptides eluted from the HPLC-column/electrospray source survey MS scans were acquired in the Orbitrap with a resolution of 100,000 and up to 5 most intense peptides per scan were fragmented and detected in the ion trap over the 300 to 2000 m/z; redundancy was limited by dynamic exclusion. Raw MS/MS data were converted to mgf file format using Trans Proteomic Pipeline (Seattle Proteome Center, Seattle, WA). Resulting mgf files were used to search against user defined database consisting of the target protein plus common contaminants (106 protein entries) with Cysteine carbamidomethylation as fixed modification and methionine oxidation, Asparagine/Glutamine deamidation and Serine/Threonine phosphorylation as variable modifications. Peptide mass tolerance was set at 20 ppm and fragment mass at 0.8 Da. Due to the low number of protein entries for statistical determination of significance in peptide matches, all relevant hits were manually reviewed. Furthermore, all of the predicted phosphopeptides were manually investigated to confirm proper phosphoresidue assignment.
In-vitro mTOR Kinase Activity Assay
Mouse C2C12 myoblasts stably expressing FLAG-tagged mTOR were maintained in DMEM containing 0.2 mg/ml of the antibiotic G418 (HyClone). G418 was not included in the media after the cells had been plated for the experiments. Upon confluence, cells were serum-starved overnight and subsequently collected in ice-cold buffer A (to disrupt mTOR/Raptor interaction) or ice-cold CHAPS lysis buffer (to preserve mTOR/Raptor interaction). Fresh cell lysates were centrifuged at 2500 g for 5 min and 400 μg of protein from the supernatant was diluted to a volume of 0.5 mL with fresh ice-cold buffer A or CHAPS lysis buffer. Samples were immunoprecipitated for the FLAG tag by incubating with 10 μL of EZview red ANTI-FLAG agarose gel beads and gentle rocking at 4°C for 2 hr. Following the incubation, the beads were pelleted by centrifugation at 500 g for 30 sec and washed 3 times with fresh ice-cold CHAPS lysis buffer containing 150 mM NaCl. The beads were then washed 2 times with ice-cold Kinase Wash buffer [25 mM HEPES (pH 7.4), 20 mM KCl]. As previously described [27], mTOR kinase activity towards purified GST-p70S6k was initiated by adding 15 μL of mTOR kinase assay buffer [25 mM HEPES (pH 7.4), 50 mM KCl, 10 mM MgCl2, 250 μM ATP, 50 ng GST-p70S6k] and incubating the mixture at 30°C. After 20 min, the kinase reaction was terminated by the addition of 25 μL of 2x Laemmli Buffer. Samples were then boiled for 5 min and subjected to Western blot analysis.
Statistical Analysis
All values are expressed as means (+ SEM in graphs). Statistical significance was determined by using Student's t-test or ANOVA, followed by Student–Newman–Keuls post hoc analysis, or Dunn's procedure for planned comparisons. Differences between groups were considered significant when P ≤ 0.05. All statistical analyses were performed on SigmaStat software (San Jose, CA, USA).
RESULTS
Mechanical Stimulation Activates mTOR Signaling and Induces an Increase in the Phosphorylation of Raptor on Proline-Directed Motifs
To determine if the mechanical activation of mTOR signaling is associated with alterations in the phosphorylation state of Raptor, mouse TA muscles were subjected to mechanical stimulation via a bout of eccentric contractions (EC). Consistent with previous studies, ECs robustly activated mTOR signaling as revealed by changes in the phosphorylation of p70S6k on the T389 residue [9, 27]. Intriguingly, the increase in mTOR signaling was accompanied by an upward mobility shift of Raptor (Fig. 1A). This was intriguing because upward mobility shifts are often observed in proteins that have become hyper-phosphorylated. Therefore, to determine if ECs induced an increase in the phosphorylation of Raptor, we expressed a FLAG-tagged construct of Raptor in mouse TA muscles and then subjected the muscles to ECs. Raptor phosphorylation was analyzed by probing immunoprecipitated Raptor with antibodies that recognize the phosphorylated consensus motifs RxRxxS*/T* and S*/T*-P (where * represents the phosphorylated residue and x is any amino acid) that are utilized by many members of the AGC and MAPK family of kinases, respectively [28, 29]. Our findings revealed that ECs induce a significant increase in the phosphorylation of Raptor on S*/T*-P directed motifs, but not RxRxxS*/T* directed motifs (Fig. 1B). In order to further confirm the specificity of these antibodies, we also incubated the immunoprecipitated Raptor with, or without, λ phosphatase. The results demonstrated that λ phosphatase treatment completely eliminated the immunoreactivity with both phospho-motif antibodies (Fig. 1C). Thus, our findings indicated that ECs promote an increase in the phosphorylation of Raptor on residues that fall within S*/T*-P consensus motifs.
Figure 1. Mechanical Stimulation Activates mTOR Signaling and Induces an Increase in the Phosphorylation of Raptor on Proline-Directed Motifs.

(A) Mouse TA muscles were collected 40 min after a bout of eccentric contractions (EC), or the control condition, and subjected to Western blot analysis with the indicated antibodies. (B–C) Mouse TA muscles were transfected with plasmid DNA encoding FLAG-Raptor or GFP as a negative control. At 7 days post transfection, the muscles were subjected to a bout of ECs, or the control condition, and collected 40 min later. The samples were then subjected to Western blot analysis, or immunoprecipitation (IP) for the FLAG tag followed by Western blot analysis, with the indicated antibodies. (B) The values at the top of the blots represent the ratio of the phosphorylated protein to the total protein and were expressed as a percentage of the values obtained in the FLAG-Raptor control muscles for P-Raptor images or the GFP control muscles for P-p70(T389). (C) Following IP, the samples were either subjected to Western blot analysis or treated with 400 Units of λ phosphatase (λ PPase) and then subjected to Western blot analysis with the indicated antibodies. All values are expressed as the mean, n = 3–7 / group. * Significantly different from control, P ≤ 0.05.
Mechanical Stimulation Induces an Increase in the Phosphorylation of Raptor on the S696, T706, and S863 Residues
In order to identify the specific phosphorylation sites on Raptor that are altered by ECs, we performed LC/MS/MS analysis on FLAG-Raptor immunoprecipitated from TA muscles subjected to the control or EC conditions. Our analysis yielded 66% and 70% sequencing coverage in the control and EC samples, respectively (Fig. 2). Furthermore, with the use of a website developed by Kinexus Bioinformatics Co. © (http://www.phosphonet.ca), we determined that our analysis yielded 78% and 79% sequencing coverage of the predicted phosphorylation sites on Raptor in the control and EC sample, respectively. In total, we identified 14 different phosphorylation sites (Table 1) and four of these sites (S696, T706, S863, and S877) conformed to the S*/T*-P consensus motif. Interestingly, the S696 and T706 residues were found to be phosphorylated in the EC sample, but were not detected in the control sample.
Figure 2. Sequencing Coverage Map of Peptides Detected From Samples Subjected to Eccentric Contractions or the Control Condition.

Mouse TA muscles were transfected with FLAG-Raptor. At 7 days post transfection, the muscles were subjected to a bout of eccentric contractions (EC), or the control condition, and collected 40 min later. The samples were then subjected to immunoprecipitation for the FLAG tag and resolved on a SDS-PAGE gel. The FLAG-Raptor band was cut-out of the gel, digested with Trypsin and then submitted for LC/MS/MS analysis as detailed in the methods. The sequencing coverage and phosphorylated residues detected in the control and EC samples are depicted in the figure.
Table 1.
Mass Spectrometric Analysis of Raptor Phosphorylation.
| Residues | Peptide Sequence | Phosphorylated Residue(s) | CNT | EC |
|---|---|---|---|---|
| 691–709 | NYALPsPATTEGGSLTPVR | S696 | − | + |
| 691–716 | NYALPSPATTEGGsLTPVRDSPCTPR | S704 | − | + |
| 691–709 | NYALPSPATTEGGSLtPVR | T706 | − | + |
| 691–709 | NYALPsPATTEGGSLtPVR | S696 & T706 | − | + |
| 719–727 | SVSsYGNIR | S722 | + | − |
| 790–813 | ASsYSSLNSLIGVSFNSVYTQIWR | S792 | + | + |
| 850–867 | VLDTSSLtQSAPASPTNK | T857 | − | + |
| 850–867 | VLDTSSLTQsAPASPTNK | S859 | + | − |
| 850–867 | VLDTSSLTQSAPAsPTNK | S863 | + | + |
| 850–867 | VLDTSSLTQsAPAsPTNK | S859 & S863 | + | + |
| 850–867 | VLDTSSLTQSAPASPtNK | T865 | − | + |
| 868–894 | GVHIHQAGGsPPASSTSSSSLTNDVAK | S877 | + | + |
| 868–894 | GVHIHQAGGSPPASsTSSSSLTNDVAK | S882 | + | − |
| 868–894 | GVHIHQAGGSPPASSTSSSsLTNDVAK | S887 | + | − |
Mouse TA muscles were transfected with FLAG-Raptor. At 7 days post transfection, the muscles were subjected mechanical stimulation via a bout of eccentric contractions (EC), or the control condition, and collected 40 min later. The samples were then subjected to immunoprecipitation for the FLAG tag and resolved on a SDS-PAGE gel. The FLAG-Raptor band was cut-out of the gel, digested with Trypsin and then submitted for LC/MS/MS analysis as detailed in the methods. Fourteen different sites of phosphorylation were identified in control and EC samples and are summarized in the table. + indicates that the phosphorylated peptide was detected during the mass spectrometric analysis of the respective sample and the lower-case letter signifies the phosphorylated amino acid.
In addition to performing the LC/MS/MS analysis, we also probed Raptor immunoprecipitated from control and EC samples with phospho-specific antibodies. Consistent with our MS analysis, we found that ECs induced a significant increase in the phosphorylation of Raptor on the S696 and T706 residues. Furthermore, we found that the phosphorylation of Raptor was significantly elevated on the S863 residue following ECs (Fig. 3). Taken together, our findings indicate that ECs induce an increase in the phosphorylation of Raptor on the S696, T706, and S863 residues, and all of these residues fall within S*/T*-P consensus motifs.
Figure 3. Mechanical Stimulation Induces an Increase in the Phosphorylation of Raptor on the S696, T706, and S863 Residues.

Mouse TA muscles were transfected with plasmid DNA encoding FLAG-Raptor or GFP as a negative control. At 7 days post transfection, the muscles were subjected to a bout of eccentric contractions (EC), or the control condition, and collected 40 min later. The samples were then subjected to immunoprecipitation (IP) for the FLAG tag followed by Western blot analysis with the indicated antibodies. The values in the graph represent the P-Raptor / total Raptor ratios that were obtained for the different phosphorylation sites and are expressed as a percentage of the values obtained in the FLAG-Raptor control muscles. All values are presented as the mean + SEM, n = 4–8 / group. * Significantly different from control, P ≤ 0.05.
Rapamycin does not Inhibit the Mechanically-Induced Increase in Raptor S696, T706, and S863 Phosphorylation
Previous work has demonstrated that the activation of mTOR is associated with an increase in the phosphorylation of Raptor on the S863 residue, and this effect can be inhibited by rapamycin [20]. Furthermore, with the use of PhosphoNET (Kinexus Bioinformatics Co. ©), we found that mTOR is highly predicted to be a kinase that can directly phosphorylate Raptor on the S696 and T706 residues. Thus, we set out to determine if rapamycin would inhibit the EC-induced increase in Raptor S696, T706, and S863 phosphorylation. To accomplish this, we treated animals expressing FLAG-Raptor and Myc-tagged p70S6k with rapamycin, or the vehicle, 100 min prior to the initiation of ECs. Following ECs, immunoprecipitated p70S6k was probed for phosphorylation on the T389 residue. Consistent with previous studies, we found that the EC-induced increase in p70S6k(T389) phosphorylation was completely abolished by rapamycin and, therefore, confirmed that we had successfully inhibited rapamycin-sensitive mTOR signaling (Fig. 4A). In addition, we also found that rapamycin weakened the interaction of Raptor with mTOR (Fig. 4B). Next, we probed immunoprecipitated Raptor with phospho-specific antibodies against the S696, T706, and S863 residues and surprisingly found that rapamycin did not block the EC-induced increase in the phosphorylation of these sites (Fig. 4C). Based on this observation, we reasoned that changes in the phosphorylation of Raptor might actually be part of an upstream event in the pathway through which mechanical stimuli activate mTOR signaling.
Figure 4. Rapamycin does not Inhibit the Mechanically-Induced Increase in Raptor S696, T706, and S863 Phosphorylation.

(A–C) Mouse TA muscles were co-transfected with plasmid DNA encoding Myc-tagged p70S6k and FLAG-Raptor. At 7 days post transfection, the mice were given an injection of rapamycin (2.0 mg/kg), or the vehicle control, 100 min prior to the initiation of eccentric contractions (EC). The muscles were subjected to a bout of ECs, or the control condition, and collected 40 min later. Samples were then subjected to immunoprecipitation (IP) for the FLAG or Myc tag followed by Western blot analysis with the indicated antibodies. (B) The values at the top of the blot represent the amount of coimmunoprecipitated mTOR/Raptor expressed relative to the values obtained in the vehicle control condition. All values are expressed as the mean, n = 6–10 / group. The bar over the values indicates a significant main effect of rapamycin, P ≤ 0.05.
The Phosphorylation of Raptor on the S696, T706, and/or S863 Residues Contributes to the Mechanical Activation of mTOR Signaling
To determine if the phosphorylation of Raptor on the S696, T706, and/or S863 residues contributes to the mechanical activation of mTOR, we employed a FLAG-tagged mutant of Raptor where each of the three residues (S696, T706, S863) were mutated to non-phosphorylatable alanines (3A). To confirm these mutations, we expressed either wild type (WT) FLAG-Raptor or FLAG-Raptor 3A along with Myc-p70S6k, and then subjected the animals to ECs. Raptor was immunoprecipitated and probed with phospho-specific antibodies against the S696, T706, and S863 residues. Our results demonstrated that phosphorylation of all three residues was completely abolished in the Raptor 3A mutant (Fig. 5A). We also probed the immunoprecipitates with the S*/T*-P consensus motif antibody and found that both the basal level, and the EC-induced increase, of phosphorylation was eliminated. Thus, it can be concluded that the S696, T706, and S863 residues were the primary S*/T*-P phosphorylation sites detected in our analyses.
Figure 5. The Phosphorylation of Raptor on the S696, T706, and/or S863 Residues Contributes to the Mechanical Activation of mTOR Signaling.

(A–C) Mouse TA muscles were co-transfected with plasmid DNA encoding Myc-tagged p70S6k and either wild type FLAG-Raptor (WT) or a FLAG-tagged mutant of Raptor (S696A, T706A, S863A) (3A). At 7 days post transfection, the muscles were subjected to a bout of eccentric contractions (EC), or the control condition, and collected 40 min later. In some cases, the mice were also given an injection of insulin (20 U/kg) 30 min prior to collection. Samples were then subjected to Western blot analysis, or immunoprecipitation (IP) for the FLAG or Myc tag followed by Western blot analysis with the indicated antibodies. (A) Representative images of the Western blot analysis from FLAG immunoprecipitates. (B) Representative images of the Western blot analysis from Myc immunoprecipitates and whole muscles lysates. The values at the top of the blot represent the ratio of p70S6k phosphorylated on the Threonine 389 residue [P-p70(T389)] to the amount of total p70S6k and were expressed relative to the values obtained in the WT control group. (C) The P-p70(T389) / total p70S6k ratio was expressed as a percentage of the values obtained in the control muscles within each plasmid condition (i.e. WT or 3A). All values are expressed as the mean (+ SEM in graphs), n = 3–12 / group. * Significant effect of EC within a given plasmid condition, # Significant difference between WT control and 3A control, † Significant difference between EC and EC + Insulin within the 3A plasmid condition, • Significant difference between WT EC and 3A EC, P ≤ 0.001.
To study changes in mTOR signaling, we analyzed immunoprecipitated Myc-p70S6k for T389 phosphorylation. As expected, ECs induced a significant increase in mTOR signaling in samples expressing WT Raptor (Fig. 5B). In samples expressing Raptor 3A, ECs also induced a significant increase in mTOR signaling, however, the magnitude of this increase was reduced by more than 65% when compared to the magnitude of the effect observed in WT Raptor samples (P ≤ 0.001, Fig. 5C). We also noted that the basal level of mTOR signaling was elevated in samples expressing Raptor 3A (Fig. 5B), and for this reason we were concerned that the smaller EC-induced activation of mTOR signaling might be an artifact that resulted from p70S6k becoming maximally phosphorylated. To address this concern, we stimulated muscles expressing Raptor 3A with insulin following the completion of ECs. As shown in Fig 5B, the combination of ECs and insulin resulted in a dramatically greater increase in T389 phosphorylation. This finding confirmed that p70S6k was not maximally phosphorylated. Therefore, our results suggest that the phosphorylation of Raptor on the S696, T706, and/or S863 residues plays an important role in the pathway through which mechanical stimuli activate mTOR signaling.
The Effects of Mechanical Stimulation and Raptor Phosphorylation on the Interaction of mTORC1 Associated Proteins
Previous studies have shown that the interaction of proteins associated with the mTORC1 complex can be altered by various stimuli, and that these alterations can contribute to the regulation of mTOR signaling [30–32]. Thus, we wanted to determine if mechanical stimulation altered the interaction of the mTORC1-associated proteins, and whether any of these changes were regulated by Raptor phosphorylation. To accomplish this, we immunoprecipitated equal amounts of WT Raptor and Raptor 3A from control and EC samples, and then probed the immunoprecipitates with antibodies against mTOR and PRAS40. The results indicated that neither ECs, nor the Raptor 3A condition, altered the interaction of Raptor with mTOR. Furthermore, EC's did not alter the interaction of Raptor with PRAS40 (Fig. 6A). However, samples expressing Raptor 3A revealed a significantly weaker association with PRAS40 under both the control and EC conditions. Thus, it can be concluded that the phosphorylation of Raptor on the S696, T706, and/or S863 residues at least partially regulates it's interaction with PRAS40.
Figure 6. The Effects of Mechanical Stimulation and Raptor Phosphorylation on the Interaction of mTORC1 Associated Proteins.

(A–B) Mouse TA muscles were transfected with plasmid DNA encoding wild type FLAG-Raptor (WT), a FLAG-tagged mutant of Raptor (S696A, T706A, S863A) (3A), or GFP as a negative control, and in certain cases (B), GST-tagged p70S6k. At 7 days post transfection, the muscles were subjected to a bout of eccentric contractions (EC), or the control condition, and collected 40 min later. Samples were then subjected to Western blot analysis, or immunoprecipitation (IP) for the FLAG tag followed by Western blot analysis with the indicated antibodies. The values at the top of the blots represent the amount of co-immunoprecipitated protein (i.e mTOR, PRAS40, or p70S6k) as a ratio of the amount of Raptor immunoprecipitated and are expressed relative to the values obtained in the WT control condition. All values are expressed as the mean, n = 5–6 / group. * Significant effect of EC within a given plasmid condition (i.e. WT or 3A). The bar over the values indicates a significant main effect of WT vs. 3A, P ≤ 0.05.
Previous reports have also established that Raptor and p70S6k can interact [33]. Therefore, to determine if the interaction between Raptor and p70S6k was altered by ECs, we expressed WT Raptor, or Raptor 3A, along with GST-tagged p70S6k. Raptor was then immunoprecipitated and probed with an antibody against total p70S6k. We found that ECs resulted in a significant dissociation of p70S6kfrom Raptor in samples expressing WT Raptor, but not from samples expressing Raptor 3A, suggesting that the phosphorylation of the S696, T706, and/or S863 residues is necessary for this event (Fig. 6B). Furthermore, in the control condition, samples expressing Raptor 3A revealed a significantly reduced association with p70S6k. This indicates that, like PRAS40, the phosphorylation of Raptor on the S696, T706, and/or S863 residues partially regulates it's interaction with p70S6k.
DISCUSSION
The goal of this study was to determine if changes in the phosphorylation of Raptor contribute to the pathway through which mechanical stimuli regulate mTOR signaling. Our findings revealed that mechanical stimulation induces an increase in the phosphorylation of Raptor on the S696, T706, and S863 residues, all of which lie within S*/T*-P directed motifs. To the best of our knowledge, this is the first study to show that mechanical stimulation can induce an increase in the phosphorylation of these sites.
Previous studies have shown that a rapamycin-sensitive component of mTOR signaling, as well as members of the Ras/MAPK kinase family, can directly phosphorylate the S696, T706, and S863 residues, and that the phosphorylation of these sites can regulate mTORC1 activity. For example, in response to osmotic stress, JNK can phosphorylate Raptor on the S696, T706, and S863 residues [21]. Furthermore, p38 has been shown to phosphorylate Raptor on the S863 residue in response to aresnite, and the activation of mTOR by Rheb overexpression is associated with an increase in S696, T706, and S863 phosphorylation [20, 34]. Finally, insulin has been shown to induce an increase in S863 phosphorylation via a rapamycin-sensitive mechanism, and mutation of the S696, T706, and/or S863 residues impairs the insulin-induced activation of mTORC1 activity as assessed in-vitro [20, 22]. With this information in mind, we wanted to determine if rapamycin-sensitive mTOR signaling was responsible for the EC-induced phosphorylation of the S696, T706 and S863 residues. Interestingly, our findings revealed that the EC-induced phosphorylation of Raptor on these residues was not inhibited by rapamycin. This was important because it indicated that the increase in phosphorylation might be regulated by kinases that have been shown to lie upstream to the activation of mTOR (e.g. p38 and JNK) [21, 34]. Unfortunately though, non-specific actions and/or issues associated with in-vivo applications of currently available p38 and JNK inhibitors prohibited us from determining if p38 or JNK are the kinases that phosphorylate these residues in response to ECs [35]. Nonetheless, previous work from our lab has demonstrated that mechanical stimulation robustly induces the phosphorylation, and presumably activation, of p38 and JNK [26]. Thus, it is highly possible that p38 and/or JNK play a role in the mechanically-induced phosphorylation of Raptor, and this will certainly be an interesting topic for future investigations.
Given that Raptor S696, T706 and S863 phosphorylation has been implicated in the regulation of mTOR activity, and that rapamycin did not prevent the EC-induced increase in the phosphorylation of these sites, we reasoned that changes in the phosphorylation of Raptor might be an upstream event in the pathway through which mechanical stimuli activate mTOR signaling. In support of this possibility, we found that the magnitude of the EC-induced activation of mTOR signaling was substantially reduced in muscles expressing the 3A mutant. Thus, in an attempt to understand how Raptor exerts this effect, we examined if ECs, and changes in Raptor phosphorylation, alter the interaction of the mTORC1-associated proteins. Our results revealed that ECs do not alter the interaction of Raptor with mTOR or PRAS40 in WT Raptor or Raptor 3A expressing samples. This result indicates that mechanical stimulation does not regulate mTOR signaling by altering the association of Raptor with mTOR or PRAS40. However, less PRAS40 was associated with Raptor 3A when compared to WT Raptor, suggesting that the phosphorylation of Raptor on the S696, T706, and/or S863 residue(s) can at least partially regulate the Raptor/PRAS40 interaction. This finding was particularly interesting because PRAS40 has been shown to function as a negative regulator of mTOR signaling [32]. Thus, the reduced Raptor/PRAS40 interaction observed in the Raptor 3A samples might explain why higher basal levels of mTOR signaling were observed in muscles expressing this mutant.
We also examined if mechanical stimulation, and changes in Raptor phosphorylation, alters the interaction of Raptor with p70S6k. For the first time, we demonstrate that mechanical stimulation results in a significant dissociation of p70S6k from WT Raptor, and interestingly, this effect was not observed in the Raptor 3A samples. This suggests that the phosphorylation of the S696, T706, and/or S863 residue(s) is necessary for the mechanically-induced dissociation of Raptor from p70S6k. Furthermore, in the basal state, the amount of p70S6k associated with Raptor was lower in the Raptor 3A samples, suggesting that Raptor S696, T706, and/or S863 phosphorylation also regulates the basal interaction of Raptor with p70S6k.
Previous studies have demonstrated that mechanical stimuli induce p70S6k(T389) phosphorylation through a rapamycin-sensitive mechanism, and that mTOR is the rapamycin-sensitive element that confers this event [9, 33]. Hence, it is clear that mechanical stimuli activate mTOR signaling; however, the role of mTORC1 in this process has not been defined. This is an important point because it was recently demonstrated that, in the absence of Raptor, mTOR can still induce p70S6k(T389) phosphorylation, and contrary to previous assumptions, this effect occurs through a rapamycin-sensitive mechanism [36]. In other words, an emerging body of evidence indicates that there is a rapamycin-sensitive pool of mTOR that does not involve the classic Raptor-associated mTORC1 complex, and it is currently not known if mechanical stimuli activate this rapamycin-sensitive pool of mTOR and/or mTORC1. Furthermore, we and others have obtained evidence which indicates that Raptor can actually function as an inhibitor of mTOR signaling both in-vivo and in-vitro [19, 37]. For example, in this study we found that the overexpression of WT Raptor in-vivo results in a substantial knockdown of p70S6k(T389) phosphorylation and that the in-vitro kinase activity of mTOR towards p70S6k(T389) is significantly repressed when mTOR is associated with Raptor (Fig. 7). Therefore, we have to remain open to the following possibilities; 1) that changes in Raptor phosphorylation could directly regulate mTOR signaling via an mTORC1-dependent mechanism, and/or 2) that changes in Raptor phosphorylation regulate mTOR signaling via an mTORC1-independent mechanism that involves an inhibition of the suppressive effects that Raptor can exert on mTOR signaling (e.g. controlling the access to available substrates etc.).
Figure 7. Evidence that Raptor can Function as a Negative Regulator of mTOR Signaling.
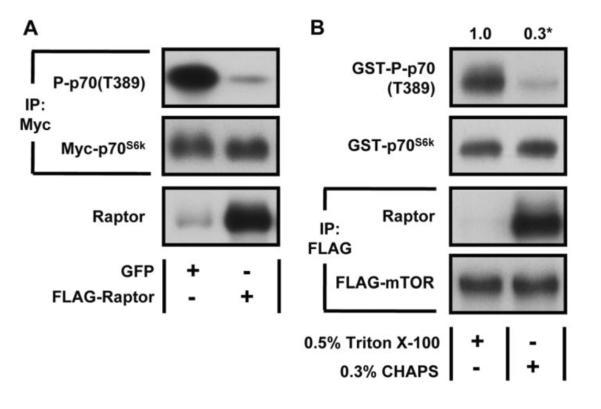
(A) Mouse TA muscles were co-transfected with plasmid DNA encoding Myc-tagged p70S6k and either GFP or wild type FLAG-Raptor (WT). At 7 days post transfection, the muscles were collected and then subjected to Western blot analysis, or immunoprecipitation (IP) for the Myc tag followed by Western blot analysis with the indicated antibodies. (B) C2C12 myoblasts stably expressing FLAG-tagged mTOR were serum starved overnight, collected in either buffer A containing 0.5% Triton X-100 (to dissociate mTOR/Raptor interaction) or CHAPS lysis buffer (to preserve mTOR/Raptor interaction). The cell lysates were then subjected to immunoprecipitation (IP) for the FLAG tag and the kinase activity of mTOR was assayed with GST-p70S6k as a substrate. The resulting samples were subjected to Western blot analysis, and the P-p70(T389) / total p70S6k ratios were expressed relative to the values obtained in the samples collected in buffer A containing 0.5% Triton X-100. All values are presented as the mean and were obtained from at least three independent experiments, n = 3–9 / group. * Significant difference in the activity from Raptor free mTOR, P ≤ 0.05.
CONCLUSION
In summary, this study demonstrates that mechanical stimuli induce an increase in the phosphorylation of Raptor on the S696, T706, and S863 residues and it appears that these changes significantly contribute to the pathway through which mechanical stimuli activate mTOR signaling. Additional studies will now be needed to further define the exact mechanism(s) through which changes in Raptor phosphorylation contribute to the mechanical activation of mTOR signaling, and if these changes ultimately play a role in the mechanical regulation of skeletal muscle mass.
HIGHLIGHTS
Mechanical stimulation induces multisite phosphorylation of Raptor
The S696, T706, and S863 residues are the primary sites of regulation
Changes in Raptor phosphorylation alter its interaction PRAS40 and p70S6k
Raptor phosphorylation contributes to the mechanical activation of mTOR signaling.
ACKNOWLEDGEMENTS
This work was supported by the National Institutes of Health grant [AR057347] to TAH. We would like to thank Dr. Sung Ho Ryu (Pohang University of Science and Technology, Pohang, Kyungbuk, Korea) and Dr. Diane Fingar (University of Michigan Medical School, Ann Arbor, Michigan, USA) for providing the FLAG-tagged Raptor plasmids and P-Raptor antibodies, respectively. We would also like to thank Grzegorz Sabat, of the University of Wisconsin - Madison Mass Spectrometric facility, for his assistance with the mass spectrometric analysis.
ABBREVEATIONS
- EC
eccentric contraction
- GβL
G-protein β-subunit-like protein
- GFP
green fluorescent protein
- JNK
c-jun n-terminal kinase
- MAPK
mitogen-activated protein kinase
- mLST8
lethal with sec13 protein 8
- mTOR
mammalian [or mechanistic] target of rapamycin
- mTORC1
mTOR complex 1
- mTORC2
mTOR complex 2
- p38
p38 mitogen-activated protein kinase
- p70S6k
ribosomal S6 kinase 1
- PI3K
phosphotidylinositol-3-kinase
- PRAS40
proline-rich Akt substrate of 40 kDa
- Raptor
regulatory associated protein of mTOR
- TA
tibialis anterior muscle
Footnotes
Publisher's Disclaimer: This is a PDF file of an unedited manuscript that has been accepted for publication. As a service to our customers we are providing this early version of the manuscript. The manuscript will undergo copyediting, typesetting, and review of the resulting proof before it is published in its final citable form. Please note that during the production process errors may be discovered which could affect the content, and all legal disclaimers that apply to the journal pertain.
REFERENCES
- [1].Izumiya Y, Hopkins T, Morris C, Sato K, Zeng L, Viereck J, Hamilton JA, Ouchi N, LeBrasseur NK, Walsh K. Cell Metab. 2008;7:159–172. doi: 10.1016/j.cmet.2007.11.003. [DOI] [PMC free article] [PubMed] [Google Scholar]
- [2].Srikanthan P, Karlamangla AS. The Journal of clinical endocrinology and metabolism. 2011;96:2898–2903. doi: 10.1210/jc.2011-0435. [DOI] [PubMed] [Google Scholar]
- [3].Hurley BF, Hanson ED, Sheaff AK. Sports Med. 2011;41:289–306. doi: 10.2165/11585920-000000000-00000. [DOI] [PubMed] [Google Scholar]
- [4].Goldberg AL, Etlinger JD, Goldspink DF, Jablecki C. Med Sci Sports. 1975;7:185–198. [PubMed] [Google Scholar]
- [5].Hornberger TA. Int J Biochem Cell Biol. 2011;43:1267–1276. doi: 10.1016/j.biocel.2011.05.007. [DOI] [PMC free article] [PubMed] [Google Scholar]
- [6].Baar K, Esser K. Am J Physiol. 1999;276:C120–127. doi: 10.1152/ajpcell.1999.276.1.C120. [DOI] [PubMed] [Google Scholar]
- [7].Hornberger TA, Hunter RB, Kandarian SC, Esser KA. Am J Physiol Cell Physiol. 2001;281:C179–187. doi: 10.1152/ajpcell.2001.281.1.C179. [DOI] [PubMed] [Google Scholar]
- [8].Goodman CA, Miu MH, Frey JW, Mabrey DM, Lincoln HC, Ge Y, Chen J, Hornberger TA. Mol Biol Cell. 2010;21:3258–3268. doi: 10.1091/mbc.E10-05-0454. [DOI] [PMC free article] [PubMed] [Google Scholar]
- [9].Goodman CA, Frey JW, Mabrey DM, Jacobs BL, Lincoln HC, You JS, Hornberger TA. J Physiol. 2011;589:5485–5501. doi: 10.1113/jphysiol.2011.218255. [DOI] [PMC free article] [PubMed] [Google Scholar]
- [10].Zoncu R, Efeyan A, Sabatini DM. Nat Rev Mol Cell Biol. 2011;12:21–35. doi: 10.1038/nrm3025. [DOI] [PMC free article] [PubMed] [Google Scholar]
- [11].Drummond MJ, Fry CS, Glynn EL, Dreyer HC, Dhanani S, Timmerman KL, Volpi E, Rasmussen BB. J Physiol. 2009;587:1535–1546. doi: 10.1113/jphysiol.2008.163816. [DOI] [PMC free article] [PubMed] [Google Scholar]
- [12].Hornberger TA, Esser KA. The Proceedings of the Nutrition Society. 2004;63:331–335. doi: 10.1079/PNS2004357. [DOI] [PubMed] [Google Scholar]
- [13].Hara K, Maruki Y, Long X, Yoshino K, Oshiro N, Hidayat S, Tokunaga C, Avruch J, Yonezawa K. Cell. 2002;110:177–189. doi: 10.1016/s0092-8674(02)00833-4. [DOI] [PubMed] [Google Scholar]
- [14].Kim DH, Sarbassov DD, Ali SM, Latek RR, Guntur KV, Erdjument-Bromage H, Tempst P, Sabatini DM. Molecular cell. 2003;11:895–904. doi: 10.1016/s1097-2765(03)00114-x. [DOI] [PubMed] [Google Scholar]
- [15].Laplante M, Horvat S, Festuccia WT, Birsoy K, Prevorsek Z, Efeyan A, Sabatini DM. Cell metabolism. 2012;16:202–212. doi: 10.1016/j.cmet.2012.07.008. [DOI] [PMC free article] [PubMed] [Google Scholar]
- [16].Oshiro N, Takahashi R, Yoshino K, Tanimura K, Nakashima A, Eguchi S, Miyamoto T, Hara K, Takehana K, Avruch J, Kikkawa U, Yonezawa K. J Biol Chem. 2007;282:20329–20339. doi: 10.1074/jbc.M702636200. [DOI] [PMC free article] [PubMed] [Google Scholar]
- [17].Bentzinger CF, Romanino K, Cloetta D, Lin S, Mascarenhas JB, Oliveri F, Xia J, Casanova E, Costa CF, Brink M, Zorzato F, Hall MN, Ruegg MA. Cell Metab. 2008;8:411–424. doi: 10.1016/j.cmet.2008.10.002. [DOI] [PubMed] [Google Scholar]
- [18].Bentzinger CF, Lin S, Romanino K, Castets P, Guridi M, Summermatter S, Handschin C, Tintignac LA, Hall MN, Ruegg MA. Skeletal muscle. 2013;3:6. doi: 10.1186/2044-5040-3-6. [DOI] [PMC free article] [PubMed] [Google Scholar]
- [19].Kim DH, Sarbassov DD, Ali SM, King JE, Latek RR, Erdjument-Bromage H, Tempst P. Sabatini DM, Cell. 2002;110:163–175. doi: 10.1016/s0092-8674(02)00808-5. [DOI] [PubMed] [Google Scholar]
- [20].Foster KG, Acosta-Jaquez HA, Romeo Y, Ekim B, Soliman GA, Carriere A, Roux PP, Ballif BA, Fingar DC. J Biol Chem. 2010;285:80–94. doi: 10.1074/jbc.M109.029637. [DOI] [PMC free article] [PubMed] [Google Scholar]
- [21].Kwak D, Choi S, Jeong H, Jang JH, Lee Y, Jeon H, Lee MN, Noh J, Cho K, Yoo JS, Hwang D, Suh PG, Ryu SH. The Journal of biological chemistry. 2012;287:18398–18407. doi: 10.1074/jbc.M111.326538. [DOI] [PMC free article] [PubMed] [Google Scholar]
- [22].Wang L, Lawrence JC, Jr., Sturgill TW, Harris TE. J Biol Chem. 2009;284:14693–14697. doi: 10.1074/jbc.C109.002907. [DOI] [PMC free article] [PubMed] [Google Scholar]
- [23].Gwinn DM, Shackelford DB, Egan DF, Mihaylova MM, Mery A, Vasquez DS, Turk BE, Shaw RJ. Mol Cell. 2008;30:214–226. doi: 10.1016/j.molcel.2008.03.003. [DOI] [PMC free article] [PubMed] [Google Scholar]
- [24].Carriere A, Cargnello M, Julien LA, Gao H, Bonneil E, Thibault P, Roux PP. Current biology : CB. 2008;18:1269–1277. doi: 10.1016/j.cub.2008.07.078. [DOI] [PubMed] [Google Scholar]
- [25].Carriere A, Romeo Y, Acosta-Jaquez HA, Moreau J, Bonneil E, Thibault P, Fingar DC, Roux PP. The Journal of biological chemistry. 2011;286:567–577. doi: 10.1074/jbc.M110.159046. [DOI] [PMC free article] [PubMed] [Google Scholar]
- [26].O'Neil TK, Duffy LR, Frey JW, Hornberger TA. J Physiol. 2009;587:3691–3701. doi: 10.1113/jphysiol.2009.173609. [DOI] [PMC free article] [PubMed] [Google Scholar]
- [27].You JS, Frey JW, Hornberger TA. PloS one. 2012;7:e47258. doi: 10.1371/journal.pone.0047258. [DOI] [PMC free article] [PubMed] [Google Scholar]
- [28].Pearce LR, Komander D, Alessi DR. Nat Rev Mol Cell Biol. 2010;11:9–22. doi: 10.1038/nrm2822. [DOI] [PubMed] [Google Scholar]
- [29].Pearson G, Robinson F, Beers Gibson T, Xu BE, Karandikar M, Berman K, Cobb MH. Endocrine reviews. 2001;22:153–183. doi: 10.1210/edrv.22.2.0428. [DOI] [PubMed] [Google Scholar]
- [30].Kim DH, Sabatini DM. Current topics in microbiology and immunology. 2004;279:259–270. doi: 10.1007/978-3-642-18930-2_15. [DOI] [PubMed] [Google Scholar]
- [31].Sancak Y, Peterson TR, Shaul YD, Lindquist RA, Thoreen CC, Bar-Peled L, Sabatini DM. Science. 2008;320:1496–1501. doi: 10.1126/science.1157535. [DOI] [PMC free article] [PubMed] [Google Scholar]
- [32].Sancak Y, Thoreen CC, Peterson TR, Lindquist RA, Kang SA, Spooner E, Carr SA, Sabatini DM. Mol Cell. 2007;25:903–915. doi: 10.1016/j.molcel.2007.03.003. [DOI] [PubMed] [Google Scholar]
- [33].Nojima H, Tokunaga C, Eguchi S, Oshiro N, Hidayat S, Yoshino K, Hara K, Tanaka N, Avruch J, Yonezawa K. J Biol Chem. 2003;278:15461–15464. doi: 10.1074/jbc.C200665200. [DOI] [PubMed] [Google Scholar]
- [34].Wu XN, Wang XK, Wu SQ, Lu J, Zheng M, Wang YH, Zhou H, Zhang H, Han J. J Biol Chem. 2011;286:31501–31511. doi: 10.1074/jbc.M111.233122. [DOI] [PMC free article] [PubMed] [Google Scholar]
- [35].Bain J, Plater L, Elliott M, Shpiro N, Hastie CJ, McLauchlan H, Klevernic I, Arthur JS, Alessi DR, Cohen P. The Biochemical journal. 2007;408:297–315. doi: 10.1042/BJ20070797. [DOI] [PMC free article] [PubMed] [Google Scholar]
- [36].Yip CK, Murata K, Walz T, Sabatini DM, Kang SA. Molecular cell. 2010;38:768–774. doi: 10.1016/j.molcel.2010.05.017. [DOI] [PMC free article] [PubMed] [Google Scholar]
- [37].Yang H, Rudge DG, Koos JD, Vaidialingam B, Yang HJ, Pavletich NP. Nature. 2013;497:217–223. doi: 10.1038/nature12122. [DOI] [PMC free article] [PubMed] [Google Scholar]