

Abstract
Background
The Mexican population and others with Amerindian heritage exhibit a substantial predisposition to dyslipidemias and coronary heart disease. Yet, these populations remain underinvestigated by genomic studies, and to date, no genome-wide association (GWA) studies have been reported for lipids in these rapidly expanding populations.
Methods and Findings
We performed a two-stage GWA study for hypertriglyceridemia and low high-density lipoprotein cholesterol (HDL-C) in Mexicans (n=4,361) and identified a novel Mexican-specific genome-wide significant locus for serum triglycerides (TGs) near the Niemann-Pick type C1 protein (NPC1) gene (P=2.43×10−08). Furthermore, three European loci for TGs (APOA5, GCKR, and LPL) and four loci for HDL-C (ABCA1, CETP, LIPC and LOC55908) reached genome-wide significance in Mexicans. We utilized cross-ethnic mapping to narrow three European TG GWA loci, APOA5, MLXIPL, and CILP2 that were wide and contained multiple candidate variants in the European scan. At the APOA5 locus, this reduced the most likely susceptibility variants to one, rs964184. Importantly, our functional analysis demonstrated a direct link between rs964184 and postprandial serum apoAV protein levels, supporting rs964184 as the causative variant underlying the European and Mexican GWA signal. Overall, 52 of the 100 reported associations from European lipid GWA meta-analysis generalized to Mexicans. However, in 82 of the 100 European GWA loci, a different variant other than the European lead/best-proxy variant had the strongest regional evidence of association in Mexicans.
Conclusions
This first Mexican GWA study of lipids identified a novel GWA locus for high TG levels; utilized the inter-population heterogeneity to significantly restrict three previously known European GWA signals; and surveyed whether the European lipid GWA SNPs extend to the Mexican population.
Introduction
Mexicans are an admixed population of European, Native American, and a small percentage of African (1-3%) ancestries.1 Mexican national surveys have consistently confirmed that Mexicans have an alarmingly high prevalence of multiple types of dyslipidemias.2,3 Based on the most recent survey,2 31.5 % of Mexicans have hypertriglyceridemia (defined as serum triglycerides (TGs) >150 mg/dl), 43.6% hypercholesterolemia (total cholesterol >200 mg/dl), and 60.5% low high-density lipoprotein cholesterol level (HDL-C) (HDL-C<40 mg/dl), respectively. Elevated levels of serum TGs and low serum HDL-C are well established risk factors of coronary heart disease (CHD [MIM 607339]) independent of other lipoproteins.4 A previous study based on 72,200 subjects also underlines the significant life-long CHD risk of TG-increasing variants.5,6
A meta-analysis of genome-wide association (GWA) studies comprising 100,000 European origin individuals identified 95 loci for serum lipids, of which 24 were implicated for TGs and 38 for HDL-C.7 Taken together the identified variants explain 10-12% of TG and HDL-C variances.7 These results cannot, however, be directly extended to other populations due to inter-population differences in genetic architecture. Amerindian populations have been under-represented in GWA studies, although they have a high susceptibility for metabolic diseases and represent the ethnic groups with a rapid population growth. Therefore, it is critical to investigate diverse populations, such as Mexicans and other groups with Amerindian heritage, in order to determine which variants and genes are shared across populations. Furthermore, GWA studies in diverse populations may reveal novel genes and variants that are either population-specific or due to differences in allele frequencies, patterns of linkage disequilibrium (LD), disease prevalence, and gene-environment interactions.8
The GWA meta-analysis for serum lipids in European origin subjects7 demonstrated well one of the major challenges in GWA studies: the identified GWA loci tend to remain wide due to extended LD, making it very difficult to pinpoint the actual underlying variant(s) or even gene(s). Thus, conversion of the European original GWA signals to functional knowledge about the underlying mechanisms has been a slow process, further hampered by the small effect sizes of the common GWA variants and the fact that these variants are often intronic or intergenic. We recently demonstrated that taking advantage of the inter-population heterogeneity using Mexicans in cross-ethnicity mapping can help narrow the GWA loci and assist in dissecting the functional susceptibility variants underlying the European original GWA signals.9
Importantly, despite the high prevalence of unfavorable lipid levels in Mexicans, there has been no genomic study for lipids in this population thus far. Here we report the first Mexican GWA study for lipids in Mexican hypertriglyceridemia cases and controls.
Results
We performed a two-stage GWA study to identify variants for hypertriglyceridemia in Mexicans. Positive signals of stage 1 were genotyped in stage 2, and a combined analysis of the two stages was performed to identify genome-wide significant variants. Clinical characteristics of the stage 1 and 2 study samples are shown in Supplementary Table 1. After quality-control procedures, 2,240 samples, 563,599 genotyped SNPs, and 769,042 SNPs imputed based on the HapMapIII Mexican-American (MEX) sample were available for stage 1 analysis. This case-control study sample was ascertained based on the serum TG levels (see Methods). Thus, we performed association analysis for the binary TG-affection status using logistic regression and adjusted for population admixture using ancestry estimates from principal component analysis (PCA) as a covariate (see the Supplementary Methods).
For stage 2, we selected all non-redundant (LD r2≤0.3) genotyped SNPs that provided the strongest evidence of association (P≤2.5×10⁻³) in stage 1 as well as imputed SNPs with P≤8.0×10−04 (Supplementary Table 2 and Supplementary Fig. 1A-B). The same SNPs were selected after adjustment for gender (Supplementary Fig. 1C), and they also remained significant with correction for BMI (P≤0.01). Conditional association analyses at the top 12 genotyped loci did not reveal additional independent SNPs with P≤2.5×10⁻³. To validate our selection strategy and assure that all significant loci are captured by the two-stage GWA design, we compared the phenotypic variance explained on the disease liability scale by all stage 1 SNPs to the variance explained by the SNPs selected for stage 2 by breaking down the genetic relationship matrix (GRM) to the selected SNPs and the rest of the genome (see the Supplementary Methods).10 The proportion of variation in the disease liability captured by all the GWA SNPs is 64% (±16), whereas the selected SNPs explain 63% (±3) of the variation, and the remaining GRM component explains practically none of the variation in the disease liability (3×10−06±0.12), indicating that virtually all contributing loci were selected for stage 2.
We examined whether adjusting for locus-specific ancestry proportions in the regression analysis in addition to the global ancestry correction would reveal SNPs that were missed by the traditional GWA analysis (Supplementary Fig. 2). We identified only 40 additional SNPs that became significant at the stage 2 selection threshold (P-value=1.2×10−04‒ 2.5×10−03) when including local ancestry estimates. However, these SNPs were not selected for follow up in stage 2 as a dense marker sets are needed for local ancestry assessment. Overall in stage 2, we successfully tested for association 2,121 additional subjects and 1,235 SNPs using logistic regression with individual ancestry estimates as a covariate. A joint analysis of the stage 1 and 2 data (n=4,361 subjects) was performed using a fixed-effects meta-analysis11 (Fig. 1 and Supplementary Table 3).
Figure 1. Manhattan plots of GWA results for hypertriglyceridemia (HTG) and HDL-C levels.

The −log10 of the P-values obtained in stage I and in the combined stage I+II samples are shown in open and red solid circles, respectively. Loci surpassing the genome-wide significance threshold (-log10(5×10−08)=7.3) are designated.
A novel locus for elevated TG levels identified in Mexicans
The combined analysis of stage 1 and 2 revealed a novel TG locus, rs9949617 at chr18q11, that reached the genome-wide significance (OR=0.78 [CI950.69-0.86], P=2.43×10−08). Importantly, a SNP in LD with rs9949617 (rs4800467, r2=0.9), also approached the genome-wide significance level, thus supporting this locus (Fig. 2A), and both SNPs (rs9949617 and rs4800467) were directly genotyped. The MAF of rs9949617 is substantially lower in the HapMapIII CEU (European ancestry) sample (19%) than in the Mexican controls (40%). Inter-ethnic differences in allele frequencies can lead to power differences and apparent population-specific findings. Furthermore, we also found a significant difference in LD between the CEU and MEX populations of HapMapIII at this locus (PvarLD=2.6×10−06) (see the Supplementary methods).12 The observed variation in LD is at the top 1 percentile of the genome-wide distribution based on the comparisons of all autosomal chromosomes (Supplementary Fig. 3).
Figure 2. Regional association plots for the novel and APOA5 loci in the Mexican GWA study.

Regional plots for both genotyped and imputed (based on the 1000 Genomes Project) SNPs are displayed. The −log10 of the P-values obtained in stage I and in the combined stage I+II samples are shown within circle and diamond shapes, respectively, as a function of genomic distance (NCBI Build 36.1 build hg18) for NPC1 (A), and APOA5 (B) gene region. SNPs are color-coded according to LD with the lead SNP (large red diamond). In B, the arrow indicates the SNP previously suggested as the most plausible functional variant19 in the APOA5 region. Light blue lines indicate the estimated recombination hot spots in HapMap. The bottom panel shows the genes at each locus as annotated in the UCSC Genome Browser Database. The gray bar indicates associated interval determined as the region spanning SNPs in LD of r2 ≥ 0.5 with the lead Mexican SNP50. Plots were generated using SNAP.51
To investigate whether any of the regional genes (±500 kb) (Fig. 2A) influence serum lipids, we tested them for differential expression in 70 adipose tissue samples from Mexican hyperlipidemic cases and controls. We observed a significant association after correcting for multiple tested genes (n=5) between the expression of the Niemann-Pick type C1 (NPC1) gene and hyperlipidemia case-control status (P-unadjusted=6.36×10−03, Supplementary Table 4). Furthermore, the expression of Npc1 was also correlated with serum TGs in adipose tissue from the Hybrid Mouse Diversity Panel (HMDP)13 (P=2.03×10−04). No other regional gene probed by the arrays was significantly differentially expressed at multiple correction level.
We further genotyped three novel signals (rs2215964, rs805743 and rs4951964) that did not reach the genome-wide significance threshold in the combined analysis of stage 1 and 2 but were strongly associated with TGs (P≤5×10−05) (Supplementary Table 3) in 1,712 additional Mexican subjects. The combined P-value of rs805743 slightly improved (P= 6.6×10−06) but none of the three SNPs surpassed the genome-wide significance level with the increased total sample size of 6,073 Mexican samples.
Cross-ethnic mapping of European GWA loci for TGs
The combined stage 2 analysis revealed genome-wide significant signals for hypertriglyceridemia at the previously reported European GWA loci,7 APOA5, GCKR, and LPL, as well as smaller effects (P< 5×10−05) at the ANGPTL3, TIMD4-HAVCR1, MLXIPL, and CILP2 regions. The lead SNPs of these loci were all directly genotyped (Table 1). To narrow these European GWA loci utilizing cross-ethnic mapping, we first assessed whether the Mexican associations were in LD with the lead European TG signals. We considered a locus as independent if the LD between the lead Mexican and European SNPs is low (r2≤0.3) in CEU, and no association was reported in Europeans7 at P<1×10−06 for the Mexican lead SNP, and as shared if the LD is high in CEU r2 ≥0.5.
Table 1.
Association results and cross-ethnic LD mapping at shared European and Mexican loci
| HTG Locus |
Pos. | Mexican Lead SNP |
MA1 | MAF2 | Effect3 (CI95) |
P-Value | European Lead SNP4 |
MAF | r2 | r2 | |||
|---|---|---|---|---|---|---|---|---|---|---|---|---|---|
| MX | CEU | MA | MX | CEU | CEU5 | MX6 | |||||||
| APOA5 | 11q23 | rs964184 | G | 0.30 | 0.12 | 1.77 (1.68-1.86) |
5.5E-35 | rs964184 | G | 0.30 | 0.12 | 1.0 | 1.0 |
| GCKR | 2p23 | rs1260326 | T | 0.26 | 0.42 | 1.41 (1.32-1.5) |
2.2E-13 | rs1260326 | T | 0.26 | 0.42 | 1.0 | 1.0 |
| LPL | 8p21 | rs12678919 | G | 0.05 | 0.12 | 0.53 (0.34-0.73) |
2.7E-10 | rs12678919 | G | 0.05 | 0.12 | 1.0 | 1.0 |
| MLXIPL | 7q11 | rs2286276 | T | 0.12 | 0.26 | 0.72 (0.59-0.86) |
2.2E-06 | rs17145738 | T | 0.06 | 0.12 | 0.5 | 0.5 |
| TIMD4 | 5q33 | rs2036402 | C | 0.45 | 0.25 | 1.23 (1.14-1.32) |
3.4E-06 | rs1363232 | A | 0.10 | 0.30 | 0.1 | 0.1 |
| CILP2 | 19p13 | rs2228603 | T | 0.03 | 0.10 | 0.34 (0-0.84) |
3.0E-05 | rs10401969 | C | 0.05 | 0.10 | 0.7 | 0.2 |
| ANGPTL3 | 1p31 | rs10889337 | A | 0.45 | 0.35 | 0.83 (0.75-0.92) |
3.3E-05 | rs2131925 | G | 0.45 | 0.33 | 1.0 | 1.0 |
|
| |||||||||||||
| HDL-C Locus |
Pos. | Mexican Lead SNP |
MA1 | MAF2 | Effect3 (s.e) |
P-Value | European Lead SNP4 |
MA | MAF | r2 | r2 | ||
| MX | CEU | MX | CEU | CEU5 | MX6 | ||||||||
|
| |||||||||||||
| CETP | 16q13 | rs1532624 | A | 0.42 | 0.46 | 0.23 (0.02) |
1.39E-24 | rs3764261 | A | 0.40 | 0.35 | 0.5 | 0.7 |
| LIPC | 15q21 | rs1077835 | A | 0.38 | 0.75 | −0.17 (0.02) |
2.1E-14 | rs1532085 | A | 0.36 | 0.41 | 0.0 | 0.0 |
| LOC55908 | 19p13 | rs2278426 | T | 0.30 | 0.04 | −0.14 (0.02) |
3.44E-09 | rs737337 | C | 0.32 | 0.07 | 0.5 | 0.9 |
| rs9282541 | A | 0.11 | 0.0 | −0.37 (0.04) |
6.4E-26 | rs1883025 | T | 0.28 | 0.20 | 0.0 | 0.0 | ||
| ABCA1 | 9q31 | rs4149310 | A | 0.36 | 0.14 | 0.12 (0.02) |
5.54E-08 | 0.0 | 0.0 | ||||
MA, minor allele
MAF in 200 Mexican control samples (MX) versus MAF in the CEU samples of HapMapIII.
The effect size represents the odds-ratio (the 95% confidence interval) of each copy of the minor allele for the TG affection status and the proportion of 1 s.d change (standard error) for each copy of the minor allele for the continuous HDL-C levels.
The lead SNP in Teslovich et al.7 European GWA meta-analysis.
r2 CEU, pairwise LD in r2 between the lead Mexican SNP and lead European SNP in the CEU samples.
r2 MX, pairwise LD in r2 between the lead Mexican SNP and lead European SNP in 200 Mexican control samples.
We observed an independent Mexican signal at the TIMD4-HAVCR1 locus. The predominant Mexican SNP rs2036402 (OR=1.23 [CI951.14-1.32], P=3.41×10−06) was not associated with TGs (P=0.07) in the Europeans, or in LD with the European lead SNP rs1363232 (Table 1, Supplementary Fig. 4A). Accordingly, rs2036402 remained significant when including the genotype counts of rs1363232 as a covariate in a conditional analysis (P= 3.79×10−05). Differences in allele frequencies (Table 1), and LD patterns (PvarLD=9.2×10−07) may account for this apparent independent signal. Importantly, rs2036402 is in strong LD with a missense variant rs12522248 in HAVCR1 (r2=0.9), suggesting HAVCR1 as the underlying gene at this uncharacterized GWA locus.
The associations at the APOA5, GCKR, LPL, ANGPTL3, MLXIPL, and CILP2 loci were shared between Mexicans and Europeans (Table 1). However, the functional gene or variant(s) have not been established yet, except for GCKR and LPL.14,15 Therefore, we investigated the remaining four loci for variation in LD patterns across Mexicans and Europeans to narrow down the candidate regions. Using the dense 1000 Genomes data16 and genotyping imputation in the stage 1 Mexican sample (see the Supplementary Methods), we evaluated the number of SNPs highly correlated (r2≥0.5) with both the European index SNP in the CEU sample and the Mexican index SNP in the Mexican controls versus the total number of SNPs correlated with the European index SNP in CEU (Fig. 3). We found three loci (APOA5, MLXIPL, and CILP2) in which the cross-ethnic LD comparisons suggest a smaller region and a reduced number of SNPs underlying the shared signal (Fig. 3, and Supplementary Fig. 4).
Figure 3. Cross-ethnic LD comparisons at the shared GWA loci restricted the European GWA signals at APOA5, MLXIPL, and CILP2.

The x-axis displays the pair-wise LD in r2 with the lead European SNP7 using the 1000 Genomes CEU data. The y-axis displays pair-wise LD in r2 with the lead Mexican SNP (±500 kb) using genotyped and imputed SNPs (based on the 1000 Genomes Project) in 200 Mexican controls. SNPs are color-coded according to the shared LD: the SNPs in high LD (r2≥0.5) with both the lead European and Mexican SNPs in CEU and Mexicans are shown in red; the SNPs in high LD with only the European lead SNPs are shown in green; the SNPs in high LD with only the Mexican lead SNPs are in blue; and the SNPs that are not in high LD with either SNP are shown in gray, respectively. Based on the association and LD data in Mexicans, SNPs color-coded in green are no longer potential functional candidates underlying the GWA signal.
The SNP rs964184, at the APOA5 region, obtained the strongest evidence for hypertriglyceridemia in Mexicans (OR=1.8 [CI95 1.68-1.86], P=5.5×10⁻³⁵). The rs964184 was also the lead SNP for TGs in the European GWA meta-analysis,7 and showed genome-wide significant associations for CHD and other related traits in European GWA studies.17,18 We found that in Europeans, 26 other SNPs are in high LD (r2≥0.5) with rs964184, whereas in Mexicans, no other SNP is in high LD with rs964184, suggesting that this variant is the more plausible susceptibility variant (Fig. 3). The nonsynonymous APOA5 SNP rs3135506 (S19W) that was suggested as the putative functional variant19 had substantially lower evidence than rs964184 in the imputed stage 1 sample (P=3.24×10−07 versus P=6.31×10⁻¹⁹, respectively, Fig. 2B). Furthermore, including the genotype counts of rs964184 as a covariate in a multivariate analysis completely abolished the association with rs3135506 (P=0.7), as well as with other SNPs, suggesting that in Mexicans the SNP rs964184 accounts for the strong signals near APOA5.
To functionally investigate the effect of rs964184 on serum apoAV protein levels, we performed an oral fat-tolerance test in 41 Mexicans with serum apoAV protein levels measured at fasting and 3, 4, 6 and 8 hours postprandially (see the Supplementary Methods). We observed differences in serum apoAV protein levels between the rs964184 genotype groups (C/C=14, C/G=16, and G/G=11) at 3-6 hours postprandially, with small to no difference at fasting or 8 hours. During the response time (3-6 hours), apoAV levels in the group with the rs964184 TG-increasing allele (G) were lower than in the common allele carriers (C), in agreement with the known inverse relationship between apoAV and TG levels.20 We quantified this response by calculating the area under the incremental curve (AUIC) and observed a significant association between the apoAV AUIC levels and rs964184 genotypes using an additive genetic model (P=0.009, and non-parametric P=0.02) (Fig. 4). These results demonstrate for the first time a direct relationship between the well established TG and CHD susceptibility variant, rs964184, and the APOA5 gene, as well as suggest plausible mechanism of action for this TG and CHD GWA variant.
Figure 4. Differential postprandial response of apoAV protein levels between the rs964184 genotype groups.
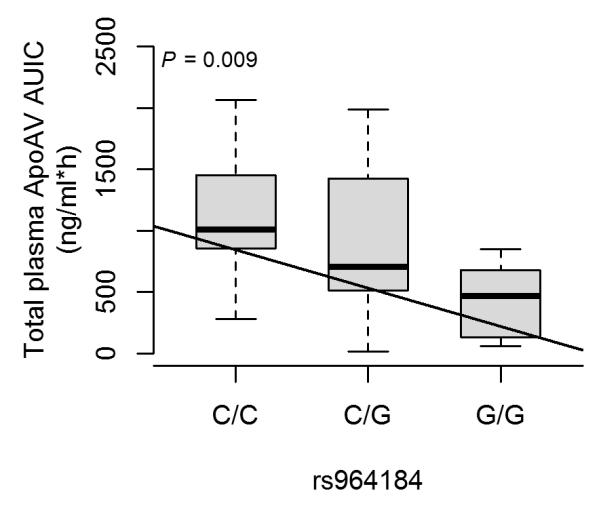
Boxplots show the postprandial response of apoAV calculated as an area under the incremental curve (AUIC) stratified based on the rs964184 genotype groups. The P-value and linear regression line for the additive model has been added to the plot to show the significance and trend of the difference in means.
Association Analysis with HDL-C levels
As a secondary analysis, we tested the stage 1 genotyped SNPs for association with HDL-C levels using linear regression with adjustments for gender and the TG case-control status to avoid sampling bias. For stage 2, we selected all non-redundant (r2≤0.3) SNPs that provided the strongest evidence of association (P ≤ 5×10⁻⁴) for HDL-C (Supplementary Table 2 and Supplementary Fig. 1D). Furthermore, these SNPs remained significant (P≤0.01) using association analysis in SPREG, which further accounts for the non-random sampling of the cases and controls by incorporating the known disease prevalence (see Methods). The correlation between the test statistics from SPREG and linear regression was r=0.99, suggesting that the SNP selection for stage 2 is very well-controlled for the hypertriglyceridemia affection status. We performed a joint analysis of both stages using a fixed-effects meta-analysis (Fig. 1 and Supplementary Table 5). Four previously known HDL-C loci from European GWA study, ABCA1, CETP, LIPC and LOC55908, surpassed genome-wide significance in Mexicans. All of these GWA signals were directly genotyped. We assessed whether these associations were shared with the European signals (Table 1). At ABCA1, we identified independent associations (Table 1) at two non-redundant (r2=0.06) SNPs, rs4149310 and rs928254 that were associated with HDL-C in Mexicans but not in Europeans.7 Accordingly, these SNPs remain genome-wide significant in a conditional analysis, including the genotype counts of rs2575876 a proxy (r2=0.9) of the lead European SNP as a covariate (P<2×10⁻¹⁰). The associations at the loci CETP, LIPC, and LOC55908 were shared between Mexicans and Europeans (Table 1 and Fig. 3). Among these loci, the underlying gene(s) at the LOC55908-DOCK6 region have not been established yet. In Mexicans, SNP rs2278426 reached genome-wide significance (P=3.44×10−09, β=−0.14±0.02, Supplementary Fig. 4D). This SNP is a missense variant (R59W) in LOC55908, a hepatocellular carcinoma-associated protein.
Generalization of European lipid risk variants to the Mexican population
Thus far, in GWA studies of European descent cohorts, 102 SNPs have been implicated for lipids (TG, HDL-C, TC and LDL-C).7 However, inter-population heterogeneity could limit the applicability of these SNPs for therapies and risk models across populations. We therefore performed a meta-analysis of the stage 1 and 2 samples for the reported European GWA SNPs (n=41) or their proxies (n=59). The average r2 of the proxies with the lead European SNP in CEU was 0.96 (Supplementary Table 6). Two European GWA SNPs rs13238203 near TYW1B and rs4420638 near APOE could not be genotyped or tagged as these SNPs failed the primer design, and are not in LD (r2<0.3) with any other SNP in the HapMapIII CEU dataset. We examined whether the SNPs are associated in Mexicans in the same direction and lipid trait as in Europeans (one-sided significance threshold of 0.05) using the dichotomous TG status and continuous HDL-C and TC levels while adjusting for the TG affection status. We found evidence of generalization to Mexicans at 52 of the SNPs (Table 2). Supplementary Table 6 provides the detailed results for each SNP by the lipid trait. Overall, of the 100 tested SNPs, 83 had an effect in the same direction as reported in the Europeans7 (binomial P=1.31×10⁻¹¹). The number of observed significant associations is not significantly different from the expected number (51) based on the cumulative power of all SNPs (Table 2), suggesting that overall the European risk variants generalize to the Mexicans. However, several loci (LPA, LRP4, and PCSK9) did not generalize although we had sufficient power to detect associations of the effect sizes observed in Europeans (≥80%) (Supplementary Table 6).
Table 2.
Observed versus expected number of generalizations of European risk-variants to Mexicans by lipid trait
| #Total | Generalization | Directionality | |||
|---|---|---|---|---|---|
| Trait | Tests | #Observed | #Expected1 | #Observed | #Expected2 |
| TG | 23 | 11 | 12.6 | 20 | 11.5 |
| HDL-C | 38 | 17 | 18.9 | 31 | 19.0 |
| TC | 25 | 14 | 11.3 | 20 | 12.5 |
| LDL-C | 14 | 10 | 8.6 | 12 | 7.0 |
|
| |||||
| P value3 | 100 | 9.21E-01 | 1.31E-11 | ||
The expected number of significant associations based on the cumulative power of all loci. Power calculations were performed using Quanto49 with an additive genetic model; the reported effect size from the European GWA meta-analysis7; the sample size and MAF of the Mexican study sample (Supplementary Table 6); as well as the trait mean and standard deviation based on a Mexican population cross-sectional cohort.44
The expected number of consistent directions of effect by chance (probability=0.5).
One-sample binomial test for the difference between the observed and the expected value.
Besides power, inter-population heterogeneity is another explanation for non-generalization. In non-European populations other SNPs may represent better proxies or population-specific variants. Accordingly, we observed that in 82 of the 100 loci a SNP other than the European lead/best-proxy SNP (r2<0.3) obtained the strongest evidence of association in the region (±500kb) in the Mexican stage 1 GWA (Supplementary Table 6), indicating that risk assessment models should be based on high resolution data from each population in order to capture the distinct proxies and causal variants.
Discussion
We performed a GWA study to search for variants conferring the high susceptibility of Mexicans to hypertriglyceridemia and low HDL-C. We identified a novel Mexican-specific locus for high TGs, rs9949617 near the NCP1 gene that surpassed the genome-wide significance level. In addition, three European TG GWA loci (APOA5, GCKR, and LPL) and four European HDL-C loci (ABCA1, CETP, LIPC and LOC55908) reached genome-wide significance in Mexicans. Furthermore, we found evidence of generalization to the Mexican population for ~50% of the European GWA variants for TGs and HDL-C. By utilizing cross-ethnic LD comparisons we were able to refine three loci, APOA5, CILP2, and MLXIPL.7 Most striking is the APOA5 locus that was restricted from 26 SNPs to the lead SNP rs964184, for which we demonstrate specific association with postprandial serum apoAV protein levels. The LD analysis also suggests independent Mexican variants in two European GWA loci (TIMD4 and ABCA1).
The novel TG locus near NCP1 was not significantly associated with TGs in Europeans.7 Possible explanations for the population specificity are the low MAF of rs9949617 in Europeans compared to Mexicans (19% versus 40%), thereby reducing the power for detecting the signal in Europeans and the difference in regional LD, which is at the top 1 percentile of the genome-wide distribution based on the comparisons of all autosomal chromosomes. Expression of NPC1 was significantly correlated with TG levels both in human and mouse adipose tissue. In the mouse adipose tissue, expression levels were also significantly correlated with HDL-C, unesterified cholesterol, and non-HDL-C (data not shown). NPC1 is a transmembrane protein containing a sterol-sensing domain that participates in cholesterol trafficking from the late endosome/lysosome to the plasma membrane.21 Rare mutations in NPC1 cause an autosomal recessive disorder, Niemann-Pick type C disease (MIM 257220), characterized by accumulation of unesterified cholesterol and other lipids in late endosomes and lysosomes.21 NPC patients often have low levels of HDL-C, LDL-C, and TC, while their TG levels tend to be increased.22 A nonsynonymous variant in NPC1 was associated with early-onset and morbid adult obesity in a GWA study of European descent.23 The association with plasma TG levels is beyond the NPC1-obesity association, since the signal of association persisted after the confounding effect of BMI was controlled in our statistical analyses. NPC1 gene is regulated through the sterol regulatory element-binding protein (SREBP) pathway,22 suggesting that the NPC1 protein plays a central role in maintaining lipid homeostasis. Evidence derived from animal models shows that NPC1 haploinsufficiency results in weight gain, adipocyte hypertrophy, hepatic steatosis, impaired fasting glucose, glucose intolerance, hyperinsulinemia, hyperleptinemia, and hypertriglyceridemia.24 Since NPC1-deficient cells fail to deliver LDL-derived free cholesterol to mitochondria and ER, they have impaired synthesis of endogenous liver X receptor (LXR) ligands and LXR target genes are downregulated. These changes may stimulate de novo lipogenesis and result in TG synthesis. Alternatively, decreased intracellular free cholesterol concentrations in NPC1-deficient cells could lead to SREBP activation and increased de novo lipogenesis.25 However, extensive targeted resequencing is warranted to identify the full spectrum of causative variants in the NPC1 region.
ApoAV is emerging as a potent modulator of serum TG levels.26 The SNP rs964184 located near the APOA1/C3/A4/A5 gene cluster, 11kb upstream of the APOA5 gene has been associated with both TGs and CHD in large European GWA meta-analyses.7,17 In Mexicans it was the lead signal for TGs with a significantly higher MAF and thus attributable risk than in Europeans (30% versus 12%). However, no direct link between rs964184 and APOA5 has been established as of yet. Furthermore, rs964184 failed to regulate the gene expression levels of the APOA1/C3/A4/A5 cluster genes or other nearby genes (i.e. cis-expression quantitative trait loci) in large human tissue samples from liver and fat.7 However, several studies have demonstrated postprandial TG levels as a risk factor for CHD.27,28 Our data show that postprandially the TG-increasing allele (G) group had a significantly lower serum apoAV response than the common allele carriers (C), demonstrating for the first time a direct link between rs964184 and serum apoAV protein levels. Given these functional data and the fact that rs964184 is not in LD with other regional variants in Mexicans, we speculate a regulatory mechanism of action for this variant responsive to the postprandial state. Several nuclear receptors involved in energy metabolism are known to regulate APOA5 expression (e.g. FXR and PPARa),26 and recently an orphan nuclear receptor Nur77 has also been shown to bind and regulate the human APOA5 promoter region,29 suggesting that there might be other regulatory factors and elements of APOA5 that have not been identified as of yet. Furthermore, the molecular mechanisms by which apoAV regulates plasma TG in vivo is still debated. It has been suggested that apoAV (1) enhances the catabolism of TG-rich lipoproteins by LPL or (2) it inhibits the rate of production of VLDL.20 Our data supports the stimulation of LPL-mediated removal of TG-rich lipoproteins mechanism. Taken together, the regional cross-ethnic LD comparison and functional data pinpoint rs964184 as the causative variant underlying the GWA signal as well as suggest postprandial transcriptional regulation as a plausible molecular mechanism for this TG and CHD-GWA variant. This potential mechanism of action warrants investigation in future functional studies.
The unique LD architecture of Mexicans enabled us to significantly reduce the associated region of three European GWA loci for TGs: APOA5, CILP2, and MLXIPL.7 In the CILP2 region that has also shown genome-wide significant associations for CHD,7 the strongest signal in Mexicans was obtained with rs2228603, a missense variant in the NCAN gene. Importantly, in a recent European GWA for fatty liver disease, this SNP was genome-wide significant for hepatic steatosis with the same T risk allele as in Mexicans.30 Fatty liver disease is characterized by increased accumulation of fat, especially TGs, in the liver cells, and is associated with increased TGs.31 Thus, this independent finding further supports the nonsynonymous variant rs2228603 in NCAN (P91S) as the functional variant underlying the wide GWA signal.
Similarly, at the LOC55908-DOCK6 locus for HDL-C, we observed a genome-wide significant signal with rs2278426, whereas the lead European SNP rs737337 was slightly less significant in Mexicans. The MAFs of rs2278426 and rs737337 are high in Mexicans (30% and 32%), and low in Europeans (4% and 7%), making it more difficult to reliably impute and compare their evidence of association in Europeans. As rs2278426 is a missense variant (R59W), predicted to be damaging32 in LOC55908, the association data in Mexicans also revealed the putative functional variant and gene underlying this uncharacterized GWA signal. However, it should be noted that only a limited number of loci associated with HDL-C have also been shown to be associated with CHD33,34, challenging the concept that raising of plasma HDL-C would uniformly translate into reductions in risk of myocardial infarction. However, as HDLs are a heterogeneous group of particles, it is likely that some HDL particles and subspecies may predict the underlying genotype-phenotype correlation and CHD risk better than the conventional serum HDL-C levels.
We observed generalization from Europeans to Mexicans at 52 of the 100 tested SNPs. Taking into account the power, most SNPs generalized to Mexicans. However, it should be noted that the analyzed lipid traits were somewhat different between the studies (e.g. dichotomous vs. continuous) which could potentially influence the generalization results. Furthermore, since the European lead variants typically represent tag-SNPs rather than the actual functional variants, another possible explanation for non-generalization is differences in the surrounding LD. Accordingly, we detected more regional differences in LD patterns between the CEU and MEX populations of HapMapIII at the non-generalized than at the generalized loci (52% versus 32%). Furthermore, we detected considerable allelic heterogeneity because at 82 of the 100 loci we identified a different, more strongly associated SNP than the lead European SNP. These data suggest that high resolution genomic data from each population is needed for accurate cardiovascular risk assessment.
We observed population-specific variants within the known risk loci TIMD4 and ABCA1. The functionally important missense variant rs9282541 in ABCA1 (R230C) indeed seems to be exclusive to Amerindian-derived populations such as Mexicans.35 However, the frequencies of the independent SNPs rs2036402 near TIMD4 and rs4149310 near ABCA1 are substantially lower in the HapMapIII CEU panel than in Mexicans. These inter-population differences in allele frequency can lead to association signals at different SNPs in different populations which do not necessarily mean that the causal variant is also population specific. Furthermore, as the current GWA platforms were designed based on European populations, they are not ideal for comprehensive assessment of population-specific variants. Thus, it is crucial to further investigate these associations as more GWA studies, custom-made arrays, and sequencing data become available in Mexicans.
Thus far most GWA studies for lipids have been performed in European origin cohorts. The current study is the first Mexican GWA study for lipids. The same is true for other populations with Amerindian heritage. When compared to the European GWA consortium, the study sample of this GWA is small. Therefore, we employed a two-stage GWA design which was shown to reduce the cost of genotyping while maintaining the overall power of the study.36 We further demonstrate that the phenotypic variance explained by all the stage 1 SNPs versus the SNPs selected for stage 2 is virtually the same. It is also worth noting that unlike the study samples of the European GWA consortia7 that are predominantly from unascertained population-based cohorts or from case-control studies ascertained for a non-lipid trait (e.g. type 2 diabetes), the Mexican GWA study sample was specifically ascertained for hypertriglyceridemia. Such a disorder-oriented case/control design has been shown to have superior power over non-ascertained study samples in genetic association studies.37
To conclude, this Mexican GWA study has several novel findings. First, it identified a novel Mexican-specific locus for high TGs near the NPC1 gene. Second, utilizing cross-ethnic mapping we refined three GWA regions (APOA5, MLXIPL, and CILP2) that in the European scan contained multiple candidates due to extended LD. In the APOA5 region the LD restriction resulted in a single variant for which we demonstrated a direct effect on postprandial apoAV protein levels. Third, we observed that although 52% of the European lipid variants generalized to Mexicans, in 82% of the European loci a variant differing from the European lead signal had the strongest regional evidence of association in Mexicans. These data demonstrate the importance of utilizing genetic heterogeneity in GWA studies.
Materials and Methods
Additional Methods in the Supplementary Material describe (1) SNP imputation; (2) estimation of the variance explained; (3) LD analysis; (4) gene-expression analysis; (6) oral fat tolerance test; and (7) ancestry analyses.
Study Participants
A total of 6,073 participants were included in the study. All participants were recruited at the Instituto Nacional de Ciencias Médicas y Nutrición Salvador Zubirán (INCMNSZ), Mexico City. The study design was approved by the ethics committees of the INCMNSZ and University of California, Los Angeles (UCLA), and all subjects provided a written informed consent. A total of 4,400 Mexican hypertriglyceridemic cases and normotriglyceridemic controls were included in stage 1 and 2 (see Supplementary Table 1 for clinical characteristics). The inclusion criteria were fasting serum TGs > 2.3 mmol/L (200 mg/dL) for the cases and < 1.7 mmol/L (150 mg/dL) for the controls.38 Exclusion criteria were type2 diabetes or morbid obesity (BMI > 40 kg/m2), TGs > 6.8 mmol/L (600 mg/dL) for the cases, and the use of lipid lowering drugs for the controls. Measurements of fasting lipid levels were performed with commercially available standardized methods.39 We also investigated 1,712 additional Mexican subjects (1,056 hypertriglyceridemia cases and controls and 656 family members from 77 Mexican dyslipidemic families40) for the follow-up of the novel SNPs that did not pass the genome-wide significance level but provided P-values ≤5×10−05 in the combined analysis of stage 1 and 2.
Genotyping and quality controls
The stage 1 genotyping of 592,394 bi-allelic SNPs was performed using the Illumina Human 610 BeadChip (Illumina Inc.) at the Southern California Genotyping Consortium. The following quality control (QC) inclusions were applied using the PLINK41 software: Subject and SNP genotyping success rate ≥95%; minor allele frequency ≥1%; departure from Hardy-Weinberg equilibrium (HWE) at P-value ≥ 1×10⁻⁶; subject heterozygosity rate < 4 standard-deviations; identity-by-descent (IBD) proportion <0.25 (excluding duplicates, 1st and 2nd degree relatives); and heterozygosity rates of the X-chromosome to verify the reported gender. Gender inconsistencies were clarified and corrected, and we excluded samples with ambiguous sex (inbreeding coefficient between 0.3-0.8). After the QC steps, 563,599 SNPs and 2,240 Mexican individuals were available for the analysis of stage 1.
For stage 2 genotyping, we selected 1,326 SNPs as described in Supplementary Table 2. Genotyping of the 1,326 stage 2 SNPs was performed using the Illumina Goldengate custom panel at the Southern California Genotyping Consortium. IBD analysis was performed to identify duplicated samples (proportion IBD=1). SNPs and samples with low genotyping call rate (<95%), and SNPs with HWE P-value < 1×10⁻⁶ were excluded, resulting in 1,235 SNPs and 2,121 samples available for analysis. Genotyping of the follow-up SNPs rs2215964, rs805743 and rs4951964 was performed using the TaqMan genotyping platform (Applied Biosystems). These SNPs had ≥95% genotype call rate and were in HWE (P>0.05) in the normotriglyceridemic controls, as well as in the unrelated family members.
Association analyses
We used a two-stage GWA design. All GWA SNPs passing QC are tested for association in stage 1. Positive signals with P≤2.5×10⁻³ for hypertriglyceridemia, and P≤5.0×10⁻⁴ for HDL-C were genotyped in the stage 2 samples, and a combined analysis of the two stages was performed to identify genome-wide significant variants.36 These significance thresholds were used as higher P-values are unlikely to reach the genome-wide significance level in the combined stage1 and 2 analysis given the sample size. Furthermore, a more stringent selection criterion (P≤8.0×10−04) was applied in the association analysis of hypertriglyceridemia with imputed SNPs because of the imputation uncertainty. We employed multivariate logistic regression using an additive genetic model to analyze the hypertriglyceridemia affection status, as the study case-control samples were specifically ascertained based on the TG levels, and multivariate linear regression with sex as a covariate to assess the effects of the SNPs on continuous log transformed HDL-C levels. Continuous TC levels were also analyzed to examine the association of 48 European-GWA SNPs for TC and LDL-C levels.7 Subjects with trait levels more than 4 standard deviations from the mean or on lipid lowering therapy at the time of the blood drawing were excluded from the quantitative analyses. TC and HDL-C levels were also adjusted for the hypertriglyceridemia affection status in order to avoid possible sampling bias. Association analyses of the genotyped SNPs were performed using the PLINK41 software, and the imputed SNPs were analyzed using the expectation-maximization (EM) option in SNPTEST v2.1.142 software in order to incorporate the imputation uncertainties in the regression models described above. Association analyses of the secondary phenotype HDL-C were also performed using SPREG,43 which further accounts for the non-random sampling of the cases and controls by incorporating the known disease prevalence. A hypertriglyceridemia prevalence of 25% was used in the SPREG regression models, because in all stage 1 cases serum TG levels were above the 75th age-sex specific Mexican percentile.44 To search for additional independent SNPs (r2<0.3) in the stage 1 analysis we performed association analyses for the top 12 genotyped loci (P<2×10−05) in stage 1 by including the minor allele counts (0-2) of the lead SNP as a covariate in the regression analyses of the surrounding SNPs (±500kb) (i.e. conditional analysis). Conditional analyses were also performed in the APOA5, TIMD4 and ABCA1 gene regions by including the allele counts of the SNPs rs964184, rs1363232 and rs2575876, respectively. To account for population admixture, the first principal component was included in the stage 1 analyses. Individual ancestry proportions estimated by the STRUCTURE45 method with 67 evenly distributed ancestry informative markers (AIMs) were used in stage 2, as high-density whole-genome data are necessary for PCA. The ancestry analyses by STRUCTURE and PCA46 were compatible and are described in detail in the Supplementary Methods. Genomic control was applied to the stage1 association statistics. The genomic inflation factors and the QQ plots are presented in Supplementary Table 7 and Supplementary Figure 5, respectively. Association results of stage 1 and 2 were combined as implemented in METAL11 using a fixed-effects meta-analysis approach where the weights are proportional to the square-root of the number of individuals examined, and the estimates of the beta effect were combined by METAL using inverse variance weights.
In the additional follow-up family and case-control study samples, the ‘egscore’ function from the R library GenABEL47 was utilized to test for association between the 3 follow-up SNPs and hypertriglyceridemia while adjusting for familial relationships using a kinship matrix.
To adjust for locus-specific ancestry in the stage 1 hypertriglyceridemia GWA analysis we included as covariates in the logistic regression model both the local ancestry estimates as the proportion of number of copies inherited from the Amerindian ancestry (0, 0.5, or 1), and global ancestry estimates from PCA using R software package (v2.15.0). Locus-specific ancestry was estimated by the LAMPv.2.548 program as described in the Supplementary Methods.
Supplementary Material
Acknowledgments
We thank the Mexican individuals who participated in this study. We also thank Cindy Montes and Rosario Rodríguez-Guillén for laboratory technical assistance.
Funding This research was supported by the NIH grants HL-095056 and HL-28481. The funders had no role in study design, data collection and analysis, decision to publish, or preparation of the manuscript.
Footnotes
Conflicts of interest The authors have declared that no conflict of interest exists.
References
- 1.Price AL, Patterson N, Yu F, Cox DR, Waliszewska A, McDonald GJ, Tandon A, Schirmer C, Neubauer J, Bedoya G, Duque C, Villegas A, Bortolini MC, Salzano FM, Gallo C, Mazzotti G, Tello-Ruiz M, Riba L, Aguilar-Salinas CA, Canizales-Quinteros S, Menjivar M, Klitz W, Henderson B, Haiman CA, Winkler C, Tusie-Luna T, Ruiz-Linares A, Reich D. A genomewide admixture map for Latino populations. Am J Hum Genet. 2007;80:1024–36. doi: 10.1086/518313. [DOI] [PMC free article] [PubMed] [Google Scholar]
- 2.Aguilar-Salinas CA, Gómez-Pérez FJ, Rull J, Villalpando S, Barquera S, Rojas R. Prevalence of dyslipidemias in the Mexican National Health and Nutrition Survey 2006. Salud Publica Mex. 2010;52(Suppl 1):S44–53. doi: 10.1590/s0036-36342010000700008. [DOI] [PubMed] [Google Scholar]
- 3.Aguilar-Salinas CA, Rojas R, Gómez-Pérez FJ, Valles V, Ríos-Torres JM, Franco A, Olaiz G, Rull JA, Sepúlveda J. High prevalence of metabolic syndrome in Mexico. Arch Med Res. 2004;35:76–81. doi: 10.1016/j.arcmed.2003.06.006. [DOI] [PubMed] [Google Scholar]
- 4.Lloyd-Jones D, Adams RJ, Brown TM, Carnethon M, Dai S, De Simone G, Ferguson TB, Ford E, Furie K, Gillespie C, Go A, Greenlund K, Haase N, Hailpern S, Ho PM, Howard V, Kissela B, Kittner S, Lackland D, Lisabeth L, Marelli A, McDermott MM, Meigs J, Mozaffarian D, Mussolino M, Nichol G, Roger VL, Rosamond W, Sacco R, Sorlie P, Stafford R, Thom T, Wasserthiel-Smoller S, Wong ND, Wylie-Rosett J. Executive summary: heart disease and stroke statistics--2010 update: a report from the American Heart Association. Circulation. 2010;121:948–54. doi: 10.1161/CIRCULATIONAHA.109.192666. [DOI] [PubMed] [Google Scholar]
- 5.Hegele RA, Ban MR, Hsueh N, Kennedy BA, Cao H, Zou GY, Anand S, Yusuf S, Huff MW, Wang J. A polygenic basis for four classical Fredrickson hyperlipoproteinemia phenotypes that are characterized by hypertriglyceridemia. Hum Mol Genet. 2009;18:4189–94. doi: 10.1093/hmg/ddp361. [DOI] [PMC free article] [PubMed] [Google Scholar]
- 6.Sarwar N, Sandhu MS, Ricketts SL, Butterworth AS, Di Angelantonio E, Boekholdt SM, Ouwehand W, Watkins H, Samani NJ, Saleheen D, Lawlor D, Reilly MP, Hingorani AD, Talmud PJ, Danesh J. Triglyceride-mediated pathways and coronary disease: collaborative analysis of 101 studies. Lancet. 2010;375:1634–9. doi: 10.1016/S0140-6736(10)60545-4. [DOI] [PMC free article] [PubMed] [Google Scholar]
- 7.Teslovich TM, Musunuru K, Smith AV, Edmondson AC, Stylianou IM, Koseki M, Pirruccello JP, Ripatti S, Chasman DI, Willer CJ, Johansen CT, Fouchier SW, Isaacs A, Peloso GM, Barbalic M, Ricketts SL, Bis JC, Aulchenko YS, Thorleifsson G, Feitosa MF, Chambers J, Orho-Melander M, Melander O, Johnson T, Li X, Guo X, Li M, Shin Cho Y, Jin Go M, Jin Kim Y, Lee J-Y, Park T, Kim K, Sim X, Twee-Hee Ong R, Croteau-Chonka DC, Lange LA, Smith JD, Song K, Hua Zhao J, Yuan X, Luan J, Lamina C, Ziegler A, Zhang W, Zee RYL, Wright AF, Witteman JCM, Wilson JF, Willemsen G, Wichmann H-E, Whitfield JB, Waterworth DM, Wareham NJ, Waeber G, Vollenweider P, Voight BF, Vitart V, Uitterlinden AG, Uda M, Tuomilehto J, Thompson JR, Tanaka T, Surakka I, Stringham HM, Spector TD, Soranzo N, Smit JH, Sinisalo J, Silander K, Sijbrands EJG, Scuteri A, Scott J, Schlessinger D, Sanna S, Salomaa V, Saharinen J, Sabatti C, Ruokonen A, Rudan I, Rose LM, Roberts R, Rieder M, Psaty BM, Pramstaller PP, Pichler I, Perola M, Penninx BWJH, Pedersen NL, Pattaro C, Parker AN, Pare G, Oostra BA, O’Donnell CJ, Nieminen MS, Nickerson DA, Montgomery GW, Meitinger T, McPherson R, McCarthy MI, McArdle W, Masson D, Martin NG, Marroni F, Mangino M, Magnusson PKE, Lucas G, Luben R, Loos RJF, Lokki M-L, Lettre G, Langenberg C, Launer LJ, Lakatta EG, Laaksonen R, Kyvik KO, Kronenberg F, König IR, Khaw K-T, Kaprio J, Kaplan LM, Johansson A, Jarvelin M-R, Cecile JW, Janssens A, Ingelsson E, Igl W, Kees Hovingh G, Hottenga J-J, Hofman A, Hicks AA, Hengstenberg C, Heid IM, Hayward C, Havulinna AS, Hastie ND, Harris TB, Haritunians T, Hall AS, Gyllensten U, Guiducci C, Groop LC, Gonzalez E, Gieger C, Freimer NB, Ferrucci L, Erdmann J, Elliott P, Ejebe KG, Döring A, Dominiczak AF, Demissie S, Deloukas P, De Geus EJC, De Faire U, Crawford G, Collins FS, Chen YI, Caulfield MJ, Campbell H, Burtt NP, Bonnycastle LL, Boomsma DI, Boekholdt SM, Bergman RN, Barroso I, Bandinelli S, Ballantyne CM, Assimes TL, Quertermous T, Altshuler D, Seielstad M, Wong TY, Tai E-S, Feranil AB, Kuzawa CW, Adair LS, Taylor HA, Borecki IB, Gabriel SB, Wilson JG, Holm H, Thorsteinsdottir U, Gudnason V, Krauss RM, Mohlke KL, Ordovas JM, Munroe PB, Kooner JS, Tall AR, Hegele RA, Kastelein JJP, Schadt EE, Rotter JI, Boerwinkle E, Strachan DP, Mooser V, Stefansson K, Reilly MP, Samani NJ, Schunkert H, Cupples LA, Sandhu MS, Ridker PM, Rader DJ, Van Duijn CM, Peltonen L, Abecasis GR, Boehnke M, Kathiresan S. Biological, clinical and population relevance of 95 loci for blood lipids. Nature. 2010;466:707–13. doi: 10.1038/nature09270. [DOI] [PMC free article] [PubMed] [Google Scholar]
- 8.Rosenberg NA, Huang L, Jewett EM, Szpiech ZA, Jankovic I, Boehnke M. Genome-wide association studies in diverse populations. Nat Rev Genet. 2010;11:356–66. doi: 10.1038/nrg2760. [DOI] [PMC free article] [PubMed] [Google Scholar]
- 9.Weissglas-Volkov D, Calkin AC, Tusie-Luna T, Sinsheimer JS, Zelcer N, Riba L, Tino AMV, Ordoñez-Sánchez ML, Cruz-Bautista I, Aguilar-Salinas CA, Tontonoz P, Pajukanta P. The N342S MYLIP polymorphism is associated with high total cholesterol and increased LDL receptor degradation in humans. J Clin Invest. 2011;121:3062–71. doi: 10.1172/JCI45504. [DOI] [PMC free article] [PubMed] [Google Scholar]
- 10.Yang J, Lee SH, Goddard ME, Visscher PM. GCTA: a tool for genome-wide complex trait analysis. Am J Hum Genet. 2011;88:76–82. doi: 10.1016/j.ajhg.2010.11.011. [DOI] [PMC free article] [PubMed] [Google Scholar]
- 11.Willer CJ, Li Y, Abecasis GR. METAL: fast and efficient meta-analysis of genomewide association scans. Bioinformatics. 2010;26:2190–1. doi: 10.1093/bioinformatics/btq340. [DOI] [PMC free article] [PubMed] [Google Scholar]
- 12.Ong RT-H, Teo Y-Y. varLD: a program for quantifying variation in linkage disequilibrium patterns between populations. Bioinformatics. 2010;26:1269–70. doi: 10.1093/bioinformatics/btq125. [DOI] [PubMed] [Google Scholar]
- 13.Bennett BJ, Farber CR, Orozco L, Kang HM, Ghazalpour A, Siemers N, Neubauer M, Neuhaus I, Yordanova R, Guan B, Truong A, Yang W, He A, Kayne P, Gargalovic P, Kirchgessner T, Pan C, Castellani LW, Kostem E, Furlotte N, Drake TA, Eskin E, Lusis AJ. A high-resolution association mapping panel for the dissection of complex traits in mice. Genome Res. 2010;20:281–90. doi: 10.1101/gr.099234.109. [DOI] [PMC free article] [PubMed] [Google Scholar]
- 14.Orho-Melander M, Melander O, Guiducci C, Perez-Martinez P, Corella D, Roos C, Tewhey R, Rieder MJ, Hall J, Abecasis G, Tai ES, Welch C, Arnett DK, Lyssenko V, Lindholm E, Saxena R, De Bakker PIW, Burtt N, Voight BF, Hirschhorn JN, Tucker KL, Hedner T, Tuomi T, Isomaa B, Eriksson K-F, Taskinen M-R, Wahlstrand B, Hughes TE, Parnell LD, Lai C-Q, Berglund G, Peltonen L, Vartiainen E, Jousilahti P, Havulinna AS, Salomaa V, Nilsson P, Groop L, Altshuler D, Ordovas JM, Kathiresan S. Common missense variant in the glucokinase regulatory protein gene is associated with increased plasma triglyceride and C-reactive protein but lower fasting glucose concentrations. Diabetes. 2008;57:3112–21. doi: 10.2337/db08-0516. [DOI] [PMC free article] [PubMed] [Google Scholar]
- 15.Hokanson JE. Lipoprotein lipase gene variants and risk of coronary disease: a quantitative analysis of population-based studies. Int J Clin Lab Res. 1997;27:24–34. doi: 10.1007/BF02827239. [DOI] [PubMed] [Google Scholar]
- 16.Consortium T. 1000 GP. A map of human genome variation from population-scale sequencing. Nature. 2010;467:1061–73. doi: 10.1038/nature09534. [DOI] [PMC free article] [PubMed] [Google Scholar]
- 17.Schunkert H, König IR, Kathiresan S, Reilly MP, Assimes TL, Holm H, Preuss M, Stewart AFR, Barbalic M, Gieger C, Absher D, Aherrahrou Z, Allayee H, Altshuler D, Anand SS, Andersen K, Anderson JL, Ardissino D, Ball SG, Balmforth AJ, Barnes TA, Becker DM, Becker LC, Berger K, Bis JC, Boekholdt SM, Boerwinkle E, Braund PS, Brown MJ, Burnett MS, Buysschaert I, Carlquist JF, Chen L, Cichon S, Codd V, Davies RW, Dedoussis G, Dehghan A, Demissie S, Devaney JM, Diemert P, Do R, Doering A, Eifert S, Mokhtari NEE, Ellis SG, Elosua R, Engert JC, Epstein SE, De Faire U, Fischer M, Folsom AR, Freyer J, Gigante B, Girelli D, Gretarsdottir S, Gudnason V, Gulcher JR, Halperin E, Hammond N, Hazen SL, Hofman A, Horne BD, Illig T, Iribarren C, Jones GT, Jukema JW, Kaiser MA, Kaplan LM, Kastelein JJP, Khaw K-T, Knowles JW, Kolovou G, Kong A, Laaksonen R, Lambrechts D, Leander K, Lettre G, Li M, Lieb W, Loley C, Lotery AJ, Mannucci PM, Maouche S, Martinelli N, McKeown PP, Meisinger C, Meitinger T, Melander O, Merlini PA, Mooser V, Morgan T, Mühleisen TW, Muhlestein JB, Münzel T, Musunuru K, Nahrstaedt J, Nelson CP, Nöthen MM, Olivieri O, Patel RS, Patterson CC, Peters A, Peyvandi F, Qu L, Quyyumi AA, Rader DJ, Rallidis LS, Rice C, Rosendaal FR, Rubin D, Salomaa V, Sampietro ML, Sandhu MS, Schadt E, Schäfer A, Schillert A, Schreiber S, Schrezenmeir J, Schwartz SM, Siscovick DS, Sivananthan M, Sivapalaratnam S, Smith A, Smith TB, Snoep JD, Soranzo N, Spertus JA, Stark K, Stirrups K, Stoll M, Tang WHW, Tennstedt S, Thorgeirsson G, Thorleifsson G, Tomaszewski M, Uitterlinden AG, Van Rij AM, Voight BF, Wareham NJ, Wells GA, Wichmann H-E, Wild PS, Willenborg C, Witteman JCM, Wright BJ, Ye S, Zeller T, Ziegler A, Cambien F, Goodall AH, Cupples LA, Quertermous T, März W, Hengstenberg C, Blankenberg S, Ouwehand WH, Hall AS, Deloukas P, Thompson JR, Stefansson K, Roberts R, Thorsteinsdottir U, O’Donnell CJ, McPherson R, Erdmann J, Samani NJ. Large-scale association analysis identifies 13 new susceptibility loci for coronary artery disease. Nat Genet. 2011;43:333–8. doi: 10.1038/ng.784. [DOI] [PMC free article] [PubMed] [Google Scholar]
- 18.Grallert H, Dupuis J, Bis JC, Dehghan A, Barbalic M, Baumert J, Lu C, Smith NL, Uitterlinden AG, Roberts R, Khuseyinova N, Schnabel RB, Rice KM, Rivadeneira F, Hoogeveen RC, Fontes JD, Meisinger C, Keaney JF, Jr, Lemaitre R, Aulchenko YS, Vasan RS, Ellis S, Hazen SL, Van Duijn CM, Nelson JJ, März W, Schunkert H, McPherson RM, Stirnadel-Farrant HA, Psaty BM, Gieger C, Siscovick D, Hofman A, Illig T, Cushman M, Yamamoto JF, Rotter JI, Larson MG, Stewart AFR, Boerwinkle E, Witteman JCM, Tracy RP, Koenig W, Benjamin EJ, Ballantyne CM. Eight genetic loci associated with variation in lipoprotein-associated phospholipase A2 mass and activity and coronary heart disease: meta-analysis of genome-wide association studies from five community-based studies. Eur Heart J. 2012;33:238–51. doi: 10.1093/eurheartj/ehr372. [DOI] [PMC free article] [PubMed] [Google Scholar]
- 19.Dumitrescu L, Carty CL, Taylor K, Schumacher FR, Hindorff LA, Ambite JL, Anderson G, Best LG, Brown-Gentry K, Bůžková P, Carlson CS, Cochran B, Cole SA, Devereux RB, Duggan D, Eaton CB, Fornage M, Franceschini N, Haessler J, Howard BV, Johnson KC, Laston S, Kolonel LN, Lee ET, MacCluer JW, Manolio TA, Pendergrass SA, Quibrera M, Shohet RV, Wilkens LR, Haiman CA, Le Marchand L, Buyske S, Kooperberg C, North KE, Crawford DC. Genetic Determinants of Lipid Traits in Diverse Populations from the Population Architecture using Genomics and Epidemiology (PAGE) Study. PLoS Genet. 2011;7:e1002138. doi: 10.1371/journal.pgen.1002138. [DOI] [PMC free article] [PubMed] [Google Scholar]
- 20.Garelnabi M, Lor K, Jin J, Chai F, Santanam N. The paradox of ApoA5 modulation of triglycerides: Evidence from clinical and basic research. Clin Biochem. doi: 10.1016/j.clinbiochem.2012.09.007. Published Online First: 19 September 2012. doi:10.1016/j.clinbiochem.2012.09.007. [DOI] [PMC free article] [PubMed] [Google Scholar]
- 21.Ikonen E, Hölttä-Vuori M. Cellular pathology of Niemann-Pick type C disease. Semin Cell Dev Biol. 2004;15:445–54. doi: 10.1016/j.semcdb.2004.03.001. [DOI] [PubMed] [Google Scholar]
- 22.Garver WS, Jelinek D, Meaney FJ, Flynn J, Pettit KM, Shepherd G, Heidenreich RA, Vockley CMW, Castro G, Francis GA. The National Niemann-Pick Type C1 Disease Database: correlation of lipid profiles, mutations, and biochemical phenotypes. J Lipid Res. 2010;51:406–15. doi: 10.1194/jlr.P000331. [DOI] [PMC free article] [PubMed] [Google Scholar]
- 23.Meyre D, Delplanque J, Chèvre J-C, Lecoeur C, Lobbens S, Gallina S, Durand E, Vatin V, Degraeve F, Proença C, Gaget S, Körner A, Kovacs P, Kiess W, Tichet J, Marre M, Hartikainen A-L, Horber F, Potoczna N, Hercberg S, Levy-Marchal C, Pattou F, Heude B, Tauber M, McCarthy MI, Blakemore AIF, Montpetit A, Polychronakos C, Weill J, Coin LJM, Asher J, Elliott P, Järvelin M-R, Visvikis-Siest S, Balkau B, Sladek R, Balding D, Walley A, Dina C, Froguel P. Genome-wide association study for early-onset and morbid adult obesity identifies three new risk loci in European populations. Nat Genet. 2009;41:157–9. doi: 10.1038/ng.301. [DOI] [PubMed] [Google Scholar]
- 24.Jelinek D, Millward V, Birdi A, Trouard TP, Heidenreich RA, Garver WS. Npc1 haploinsufficiency promotes weight gain and metabolic features associated with insulin resistance. Hum Mol Genet. 2011;20:312–21. doi: 10.1093/hmg/ddq466. [DOI] [PMC free article] [PubMed] [Google Scholar]
- 25.Korach-André M, Archer A, Gabbi C, Barros RP, Pedrelli M, Steffensen KR, Pettersson AT, Laurencikiene J, Parini P, Gustafsson J-Å. Liver X receptors regulate de novo lipogenesis in a tissue-specific manner in C57BL/6 female mice. Am J Physiol Endocrinol Metab. 2011;301:E210–222. doi: 10.1152/ajpendo.00541.2010. [DOI] [PubMed] [Google Scholar]
- 26.Nilsson SK, Heeren J, Olivecrona G, Merkel M. Apolipoprotein A-V; a potent triglyceride reducer. Atherosclerosis. 2011;219:15–21. doi: 10.1016/j.atherosclerosis.2011.07.019. [DOI] [PubMed] [Google Scholar]
- 27.Karpe F. Postprandial lipoprotein metabolism and atherosclerosis. J Intern Med. 1999;246:341–55. doi: 10.1046/j.1365-2796.1999.00548.x. [DOI] [PubMed] [Google Scholar]
- 28.Nordestgaard BGBM. NOnfasting triglycerides and risk of myocardial infarction, ischemic heart disease, and death in men and women. 2007;298:299–308. doi: 10.1001/jama.298.3.299. [DOI] [PubMed] [Google Scholar]
- 29.Song K-H. Orphan nuclear receptor Nur77 participates in human apolipoprotein A5 gene expression. Biochemical and Biophysical Research Communications. 2010;392:63–6. doi: 10.1016/j.bbrc.2009.12.168. [DOI] [PubMed] [Google Scholar]
- 30.Speliotes EK, Yerges-Armstrong LM, Wu J, Hernaez R, Kim LJ, Palmer CD, Gudnason V, Eiriksdottir G, Garcia ME, Launer LJ, Nalls MA, Clark JM, Mitchell BD, Shuldiner AR, Butler JL, Tomas M, Hoffmann U, Hwang S-J, Massaro JM, O’Donnell CJ, Sahani DV, Salomaa V, Schadt EE, Schwartz SM, Siscovick DS, Voight BF, Carr JJ, Feitosa MF, Harris TB, Fox CS, Smith AV, Kao WHL, Hirschhorn JN, Borecki IB, NASH CRN, GIANT Consortium, MAGIC Investigators, GOLD Consortium Genome-Wide Association Analysis Identifies Variants Associated with Nonalcoholic Fatty Liver Disease That Have Distinct Effects on Metabolic Traits. PLoS Genet. 2011;7:e1001324. doi: 10.1371/journal.pgen.1001324. [DOI] [PMC free article] [PubMed] [Google Scholar]
- 31.Feldstein AE. Novel insights into the pathophysiology of nonalcoholic fatty liver disease. Semin Liver Dis. 2010;30:391–401. doi: 10.1055/s-0030-1267539. [DOI] [PubMed] [Google Scholar]
- 32.Adzhubei IA, Schmidt S, Peshkin L, Ramensky VE, Gerasimova A, Bork P, Kondrashov AS, Sunyaev SR. A method and server for predicting damaging missense mutations. Nat Methods. 2010;7:248–9. doi: 10.1038/nmeth0410-248. [DOI] [PMC free article] [PubMed] [Google Scholar]
- 33.Voight BF, Peloso GM, Orho-Melander M, Frikke-Schmidt R, Barbalic M, Jensen MK, Hindy G, Hólm H, Ding EL, Johnson T, Schunkert H, Samani NJ, Clarke R, Hopewell JC, Thompson JF, Li M, Thorleifsson G, Newton-Cheh C, Musunuru K, Pirruccello JP, Saleheen D, Chen L, Stewart AFR, Schillert A, Thorsteinsdottir U, Thorgeirsson G, Anand S, Engert JC, Morgan T, Spertus J, Stoll M, Berger K, Martinelli N, Girelli D, McKeown PP, Patterson CC, Epstein SE, Devaney J, Burnett M-S, Mooser V, Ripatti S, Surakka I, Nieminen MS, Sinisalo J, Lokki M-L, Perola M, Havulinna A, De Faire U, Gigante B, Ingelsson E, Zeller T, Wild P, De Bakker PIW, Klungel OH, Maitland-van der Zee A-H, Peters BJM, De Boer A, Grobbee DE, Kamphuisen PW, Deneer VHM, Elbers CC, Onland-Moret NC, Hofker MH, Wijmenga C, Verschuren WMM, Boer JMA, Van der Schouw YT, Rasheed A, Frossard P, Demissie S, Willer C, Do R, Ordovas JM, Abecasis GR, Boehnke M, Mohlke KL, Daly MJ, Guiducci C, Burtt NP, Surti A, Gonzalez E, Purcell S, Gabriel S, Marrugat J, Peden J, Erdmann J, Diemert P, Willenborg C, König IR, Fischer M, Hengstenberg C, Ziegler A, Buysschaert I, Lambrechts D, Van de Werf F, Fox KA, El Mokhtari NE, Rubin D, Schrezenmeir J, Schreiber S, Schäfer A, Danesh J, Blankenberg S, Roberts R, McPherson R, Watkins H, Hall AS, Overvad K, Rimm E, Boerwinkle E, Tybjaerg-Hansen A, Cupples LA, Reilly MP, Melander O, Mannucci PM, Ardissino D, Siscovick D, Elosua R, Stefansson K, O’Donnell CJ, Salomaa V, Rader DJ, Peltonen L, Schwartz SM, Altshuler D, Kathiresan S. Plasma HDL cholesterol and risk of myocardial infarction: a mendelian randomisation study. Lancet. 2012;380:572–80. doi: 10.1016/S0140-6736(12)60312-2. [DOI] [PMC free article] [PubMed] [Google Scholar]
- 34.Weissglas-Volkov D, Pajukanta P. Genetic causes of high and low serum HDL-cholesterol. J Lipid Res. 2010;51:2032–57. doi: 10.1194/jlr.R004739. [DOI] [PMC free article] [PubMed] [Google Scholar]
- 35.Villarreal-Molina MT, Aguilar-Salinas CA, Rodríguez-Cruz M, Riaño D, Villalobos-Comparan M, Coral-Vazquez R, Menjivar M, Yescas-Gomez P, Königsoerg-Fainstein M, Romero-Hidalgo S, Tusie-Luna MT, Canizales-Quinteros S. The ATP-binding cassette transporter A1 R230C variant affects HDL cholesterol levels and BMI in the Mexican population: association with obesity and obesity-related comorbidities. Diabetes. 2007;56:1881–7. doi: 10.2337/db06-0905. [DOI] [PubMed] [Google Scholar]
- 36.Skol AD, Scott LJ, Abecasis GR, Boehnke M. Joint analysis is more efficient than replication-based analysis for two-stage genome-wide association studies. Nat Genet. 2006;38:209–13. doi: 10.1038/ng1706. [DOI] [PubMed] [Google Scholar]
- 37.Li B, Leal SM. Methods for detecting associations with rare variants for common diseases: application to analysis of sequence data. Am J Hum Genet. 2008;83:311–21. doi: 10.1016/j.ajhg.2008.06.024. [DOI] [PMC free article] [PubMed] [Google Scholar]
- 38.Executive Summary of The Third Report of The National Cholesterol Education Program (NCEP) Expert Panel on Detection, Evaluation, And Treatment of High Blood Cholesterol In Adults (Adult Treatment Panel III) Jama. 2001;285:2486–97. doi: 10.1001/jama.285.19.2486. [DOI] [PubMed] [Google Scholar]
- 39.Weissglas-Volkov D, Huertas-Vazquez A, Suviolahti E, Lee J, Plaisier C, Canizales-Quinteros S, Tusie-Luna T, Aguilar-Salinas C, Taskinen MR, Pajukanta P. Common hepatic nuclear factor-4alpha variants are associated with high serum lipid levels and the metabolic syndrome. Diabetes. 2006;55:1970–7. doi: 10.2337/db06-0035. [DOI] [PubMed] [Google Scholar]
- 40.Weissglas-Volkov D, Plaisier CL, Huertas-Vazquez A, Cruz-Bautista I, Riaño-Barros D, Herrera-Hernandez M, Riba L, Cantor RM, Sinsheimer JS, Aguilar-Salinas CA, Tusie-Luna T, Pajukanta P. Identification of Two Common Variants Contributing to Serum Apolipoprotein B Levels in Mexicans. Arterioscler Thromb Vasc Biol. doi: 10.1161/ATVBAHA.109.196402. Published Online First: 3 December 2009. doi:10.1161/ATVBAHA.109.196402. [DOI] [PMC free article] [PubMed] [Google Scholar]
- 41.Purcell S, Neale B, Todd-Brown K, Thomas L, Ferreira MA, Bender D, Maller J, Sklar P, De Bakker PI, Daly MJ, Sham PC. PLINK: a tool set for whole-genome association and population-based linkage analyses. Am J Hum Genet. 2007;81:559–75. doi: 10.1086/519795. [DOI] [PMC free article] [PubMed] [Google Scholar]
- 42.Marchini J, Howie B, Myers S, McVean G, Donnelly P. A new multipoint method for genome-wide association studies by imputation of genotypes. Nat Genet. 2007;39:906–13. doi: 10.1038/ng2088. [DOI] [PubMed] [Google Scholar]
- 43.Lin DY, Zeng D. Proper Analysis of Secondary Phenotype Data in Case-Control Association Studies. Genet Epidemiol. 2009;33:256–65. doi: 10.1002/gepi.20377. [DOI] [PMC free article] [PubMed] [Google Scholar]
- 44.Barquera S, Tovar-Guzman V, Campos-Nonato I, Gonzalez-Villalpando C, Rivera-Dommarco J. Geography of diabetes mellitus mortality in Mexico: an epidemiologic transition analysis. Arch Med Res. 2003;34:407–14. doi: 10.1016/S0188-4409(03)00075-4. [DOI] [PubMed] [Google Scholar]
- 45.Pritchard JK, Stephens M, Donnelly P. Inference of population structure using multilocus genotype data. Genetics. 2000;155:945–59. doi: 10.1093/genetics/155.2.945. [DOI] [PMC free article] [PubMed] [Google Scholar]
- 46.Price AL, Patterson NJ, Plenge RM, Weinblatt ME, Shadick NA, Reich D. Principal components analysis corrects for stratification in genome-wide association studies. Nature Genetics. 2006;38:904–9. doi: 10.1038/ng1847. [DOI] [PubMed] [Google Scholar]
- 47.Aulchenko YS, Ripke S, Isaacs A, Van Duijn CM. GenABEL: an R library for genome-wide association analysis. Bioinformatics. 2007;23:1294–6. doi: 10.1093/bioinformatics/btm108. [DOI] [PubMed] [Google Scholar]
- 48.Sankararaman S, Sridhar S, Kimmel G, Halperin E. Estimating local ancestry in admixed populations. Am J Hum Genet. 2008;82:290–303. doi: 10.1016/j.ajhg.2007.09.022. [DOI] [PMC free article] [PubMed] [Google Scholar]
- 49.Gauderman WJ. Sample size requirements for matched case-control studies of gene-environment interaction. Stat Med. 2002;21:35–50. doi: 10.1002/sim.973. [DOI] [PubMed] [Google Scholar]
- 50.Kathiresan S, Willer CJ, Peloso GM, Demissie S, Musunuru K, Schadt EE, Kaplan L, Bennett D, Li Y, Tanaka T, Voight BF, Bonnycastle LL, Jackson AU, Crawford G, Surti A, Guiducci C, Burtt NP, Parish S, Clarke R, Zelenika D, Kubalanza KA, Morken MA, Scott LJ, Stringham HM, Galan P, Swift AJ, Kuusisto J, Bergman RN, Sundvall J, Laakso M, Ferrucci L, Scheet P, Sanna S, Uda M, Yang Q, Lunetta KL, Dupuis J, De Bakker PI, O’Donnell CJ, Chambers JC, Kooner JS, Hercberg S, Meneton P, Lakatta EG, Scuteri A, Schlessinger D, Tuomilehto J, Collins FS, Groop L, Altshuler D, Collins R, Lathrop GM, Melander O, Salomaa V, Peltonen L, Orho-Melander M, Ordovas JM, Boehnke M, Abecasis GR, Mohlke KL, Cupples LA. Common variants at 30 loci contribute to polygenic dyslipidemia. Nat Genet. 2009;41:56–65. doi: 10.1038/ng.291. [DOI] [PMC free article] [PubMed] [Google Scholar]
- 51.Johnson AD, Handsaker RE, Pulit SL, Nizzari MM, O’Donnell CJ, De Bakker PIW. SNAP: a web-based tool for identification and annotation of proxy SNPs using HapMap. Bioinformatics. 2008;24:2938–9. doi: 10.1093/bioinformatics/btn564. [DOI] [PMC free article] [PubMed] [Google Scholar]
Associated Data
This section collects any data citations, data availability statements, or supplementary materials included in this article.