

Abstract
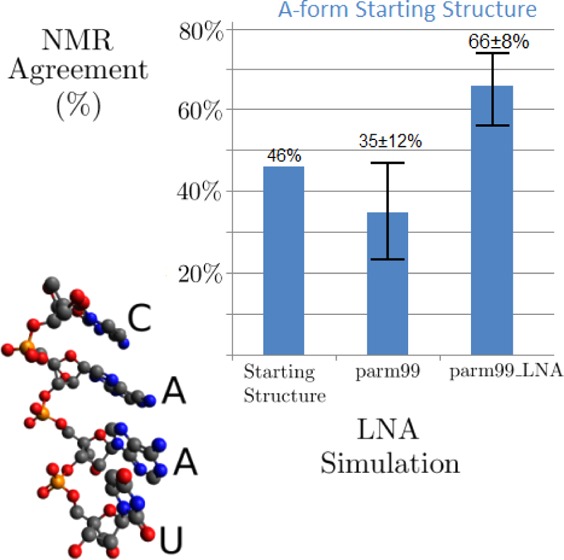
Locked Nucleic Acids (LNAs) are RNA analogues with an O2′-C4′ methylene bridge which locks the sugar into a C3′-endo conformation. This enhances hybridization to DNA and RNA, making LNAs useful in microarrays and potential therapeutics. Here, the LNA, L(CAAU), provides a simplified benchmark for testing the ability of molecular dynamics (MD) to approximate nucleic acid properties. LNA χ torsions and partial charges were parametrized to create AMBER parm99_LNA. The revisions were tested by comparing MD predictions with AMBER parm99 and parm99_LNA against a 200 ms NOESY NMR spectrum of L(CAAU). NMR indicates an A-Form equilibrium ensemble. In 3000 ns simulations starting with an A-form structure, parm99_LNA and parm99 provide 66% and 35% agreement, respectively, with NMR NOE volumes and 3J-couplings. In simulations of L(CAAU) starting with all χ torsions in a syn conformation, only parm99_LNA is able to repair the structure. This implies methods for parametrizing force fields for nucleic acid mimics can reasonably approximate key interactions and that parm99_LNA will improve reliability of MD studies for systems with LNA. A method for approximating χ population distribution on the basis of base to sugar NOEs is also introduced.
Introduction
Locked Nucleic Acids,1−9 or LNAs, are synthetic nucleic acid analogues with a methylene bridge between O2′ and C4′, i.e., ribose replaced with 2′-O-4′ C-methylene-β-d-ribofuranose (Figure 1). The methylene bridge ensures a C3′-endo, or North (N)10 conformation, restricting the sugar to a pseudorotation phase angle between approximately 15° and 25°, similar to A-form RNA. The restricted mobility of LNA results in more favorable thermodynamic stability3,6,11−13 of duplexes containing LNA, presumably because there is less loss in conformational entropy upon duplex formation compared to RNA, 2′-O-methyl RNA, or DNA. LNAs are effective in intracellular inhibition of gene expression by a variety of mechanisms, including siRNA,14−22 and are used in array assays.23,24 Here, the LNA, L(CAAU), is used to provide a simplified benchmark for testing the ability of molecular dynamics (MD) to approximate properties of nucleic acids. In particular, MD simulations are compared to ensemble averages of 1H–1H distances and of torsion angles detected by NMR.
Figure 1.
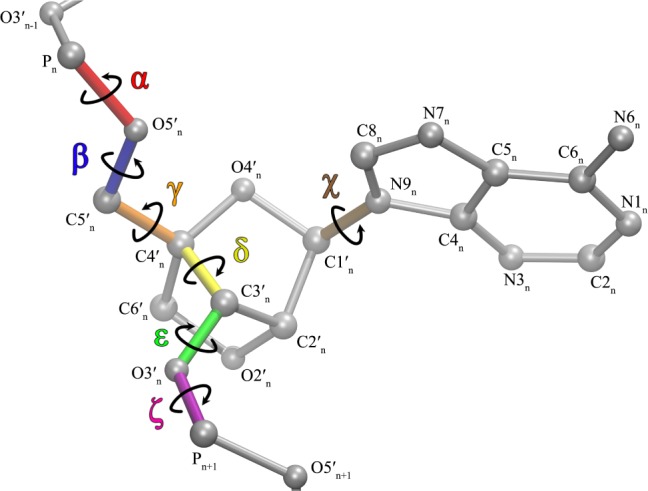
LNA torsion and atom nomenclature conventions. LNA differs from RNA in that it has atoms C6′, H6′, and H6″, while it lacks an H4′. Hydrogens are omitted for clarity.
Molecular dynamics simulations of LNA duplexes have been investigated25−28 with CHARMM2729,30 and AMBER.31−34 Both force fields were developed for DNA and RNA but were also used for LNA. Recent MD studies of RNA, however, have shown that reparametrization of a single torsion angle, χ, greatly improves agreement with a variety of experimental benchmarks.35−41 Here, we report parametrization of χ torsions and RESP charges for LNA residues to create AMBER force field parameters, parm99_LNA. A separate parametrization of the LNA glycosidic torsion is necessary because LNAs and RNAs have different quantum mechanical energy profiles, due to the flexibility of the ribose in contrast to rigidity of the LNA sugar, as χ and sugar pucker are highly, though not perfectly, correlated.42−45 The LNA sugar is covalently locked, and so any inaccuracies in sugar stretching/bending, torsions, etc., will be greatly reduced and the predicted structures and dynamics should be more accurate than for RNA. Thus, LNA minimizes the negative effects of inaccurate sugar torsions and makes a simpler system for testing other components of nucleic acid force fields.
NMR46−48 probes the ensemble average of states rapidly exchanging in solution. In particular, mean distances and torsional angles can be determined from NOE volumes and J-couplings, respectively. Thus, results from NMR spectra can be compared to predictions from an ensemble generated by MD simulation.
Unpaired L(CAAU) provides a good test system for aspects of force field development for nucleic acids because only a limited number of parameters are important. The sugar conformation is fixed and there is no Watson–Crick49 hydrogen bonding. Both terminal and internal stacking of bases are present, however. Moreover, the single strand allows relatively unrestricted fast movement, so that simulations can sample a range of structures and also test simulations with a different starting structure than implied by NMR.41
Here, the force field is parametrized on the basis of quantum mechanical (QM) calculations which can be applied to any of the many modifications being used in practical applications of oligonucleotides. This contrasts with methods that parametrize on the basis of crystal structures of natural RNAs to give “knowledge-based” force fields suitable for RNA.50−53 The QM approach is more general, as illustrated by this modified force field, parm99_LNA.
Experimental and Theoretical Methods
NMR Experiments
L(CAAU) was synthesized by methods previously described.54,55 The sample was dissolved in 80 mM NaCl, 20 mM phosphate, 0.1 mM Na2EDTA, pH 7 in H2O, and twice redissolved in 99.9% D2O (Cambridge Isotope Laboratories) after vacuum centrifugation overnight, and finally dissolved in 99.99% D2O (Aldrich). The concentration of L(CAAU) was 1.1 mM. 1H and 31P spectra were taken, respectively, with Varian Inova 500 and 600 MHz (1H resonance frequency) spectrometers and indirectly referenced to the HDO signal. 1H–31P scalar coupling56 was determined by comparing 31P coupled and decoupled 800 ms NOESY spectra. NMR processing made use of NMRPipe,57 and assignments were made from 200, 600, and 1000 ms mixing time NOESY experiments and a 40 ms TOCSY. All experiments were run at 2 °C, which maximized NOE volumes. NOE volumes were obtained from the 200 ms NOESY spectrum with the box method in Sparky 3.113.58
NMR Distances and Error Limits
It is assumed that the dynamics of the tetramer are dominated by global motions which are faster than local motions, i.e., that all NOEs59,60 within the molecule will scale similarly in relation to distance. Such global motion is represented by the rotational relaxation time τr. This is predicted to be about 1 ns for a sphere of radius 8 Å at 275 K according to eq 1(61)
| 1 |
where η is the solvent viscosity (1.79 × 10⁻³ Pa·s),62V is molecular volume, kB is Boltzmann’s constant, and T is temperature in kelvin. Stacking/unstacking motions should be less important as they occur on a time scale of approximately 100 ns.63−65
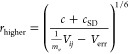
The locked distances within the LNA bicyclic ribose facilitate NMR analysis because they provide fixed distances (Table S1) to solve for the NOE scaling factor. The scaling factor, c, relating a NOESY volume between hydrogens i and j, Vij, to distance r is defined by eq 2
| 2 |
A set of fixed sugar distances (Table S1) was used to solve for the mean scaling factor, c, and its standard deviation, cSD. Although the H5–H6 distances are also fixed, they could not be used because of zero quantum coherence effects.66 The fixed distances were determined from a ωB97X-D/6-311G(2d,p)67,68in vacuo minimization of the LNA nucleoside cytidine. The ωB97X-D functional was selected as it was shown to have good results in test sets of dispersion-corrected DFT functionals.69 The distances were checked against an LNA X-ray structure (PDB ID 2X2Q),70−72 which confirmed that the heavy-atom distances were accurate within 0.055 Å (Table S2).
Equation 2 was expanded to account for measurement errors,41 which come from three principal effects: baseline noise, uncertainty in scale factor, and measurement error. The standard deviation of 20 blank peak-sized regions’ “volumes,” Verr, was measured to compensate for baseline noise error. The systematic error in measurement of Vij was accounted for by parameter mv, which reflects that variations in choice of dimensions of the box integrals can produce changes in Vij. The mv was conservatively chosen to be 4/3 (Table S1). The higher uncertainty limit in each NOE distance, r, is provided by eq 3a which has the largest possible numerator and the smallest possible denominator. The lower uncertainty limit is given by eq 3b, which has the smallest possible numerator and the largest possible denominator.
 |
3a |
| 3b |
For each of the fixed distances, the experimental NOESY volume and mean scaling factor, c, were used to calculate the distance. All the fixed distances fell within the range predicted by eqs 3a and 3b.
Evaluation of χ Torsion Populations from NOESY Spectrum
The χ torsion populations were inferred from sugar (H1′, H2′, H3′) to base proton (H6 for C and U, or H8 for A) distances. Model systems for C, A, and U nucleosides (Figure 2) were rotated at 5° intervals around χ.
Figure 2.
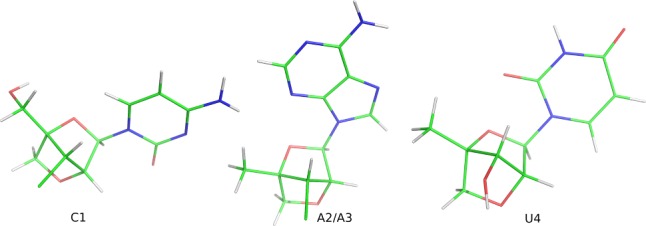
Models used to estimate glycosidic torsion minima by calculating QM energy vs χ angle. The 5′ terminal C (C1) included its 5′ OH and the 3′ terminal U4 included its 3′ OH, as they are present in solution and could form possible H-bonds. There is a 3′ chloride in C1 and A2/A3 to preserve the oxidation state in C3′ without a 3′ OH that might distort the torsion profile. Image was made with PyMol.73
With the χ torsional angles fixed, Gaussian0968 was used to optimize and calculate QM energies for each nucleoside with the hybrid DFT functional and basis ωB97X-D/6-311G(2d,p) to yield energy vs torsional angle curves. For each nucleoside, there were three minima (Figure S1), labeled G+, T, and G– as each falls within one of those regions following IUPAC conventions (Table 1).74−76
Table 1. IUPAC Torsion Terms and Symbols.
| IUPAC Term | IUPAC Symbol | IUPAC Range | Yildirim et al.37 | Richardson et al.75 |
|---|---|---|---|---|
| synperiplanar | C | 330–360°, 0–30° | ||
| +synclinal | G+ | 30–90° | 20° < syn <120° | gauche+ ≈ 60° |
| +anticlinal | A+ | 90–150° | 0° < syn <120° | |
| antiperiplanar | T | 150–210° | 180° < anti <250° | anti ≥180° |
| -anticlinal | A- | 210–270° | ||
| -synclinal | G- | 270–330° | 280° < anti <360° |
IUPAC regions C, A+, and A- were ignored as they are rare in RNA crystal structures77 and in the MD simulations. If any one of the C, A+, or A- torsions were highly populated, then it would not be possible to distinguish between more than three conformations using only three NMR distances. For example, the first minimum (Figure S1) is near 35°, and is referred to as G+; the second minimum occurs around 190°, and is referred to as T; and the third minimum is near 290° and is referred to as G-. Each minimum yields a distance between H8 or H6 and each of the H1′, H2′, and H3′ atoms, or 3 × 3 = nine distances for each nucleoside. For each of the nine QM predicted distances, the larger and smaller predicted NOE volumes were calculated from eqs 4a and 4b to allow comparisons to measured NOE volumes.
| 4a |
| 4b |
Force Field Parameters of LNA Residues
The AMBER force field calculates potential energy in a classical manner, as a function of bond stretching (1–2 interactions), angle bending (1–3 interactions), torsion rotation (1–4 interactions), van der Waals interactions,78 and electrostatic potential.31,79 To modify AMBER parm99 for LNA, the atomic partial charges and torsion potentials for χ were parametrized as described below.
RESP Charge Calculation for LNA Nucleosides
Charges were derived for LNA nucleosides, A, C, G, and U, following the RESP protocol (Tables S3–S6),79−81 as previously described for RNA.81 These RESP charges were used in all LNA simulations. A library of 16 residues was created: LXN, LX, LX5, and LX3. Here, X = A, C, G, and U, and N represents the nucleoside. LX is an internal nucleotide; LX5 and LX3 are the 5′ and 3′ terminal residues, respectively.
LNA nucleosides, A, C, G, and U, were created with the LEaP module of AMBER9. The molecules were optimized and the electrostatic potentials at a set of grid points were calculated with HF/6-31G(d)82−84 QM level of theory using Gaussian03.85 Charges for these nucleosides were then calculated with the RESP module. The sugar atoms were made equivalent,81 except for C1′ and H1′.
Ab Initio Potential Energy Surface (PES) Scan and Force Field Fitting of χ Torsions for LNA Residues
For each LNA residue, four different initial geometries were chosen. For β = H5T-O5′-C5′-C4′, γ = O5′-C5′-C4′-C3′, and ε = C4′–C3′–O3′-H3T, the combinations were (173°, 172°, 208°), (180°, 55°, 208°), (70°, 63°, 170°), and (70°, 63°, 208°), respectively. Note that H5T and H3T refer to hydrogen atoms at 5′ and 3′ ends, respectively. These torsion angles were chosen as they are common in X-ray databases and result in smooth QM energy profiles.
For each conformation, a potential energy surface (PES) scan was done around the glycosidic torsion angle, χ, with increments of 10°, where χs for pyrimidines and purines are defined as O4′-C1′–N1-C2 and O4′-C1′–N9-C4, respectively (Figure 1). For each conformation in the PES scan, the structures were first optimized with HF/6-31G(d) level of theory and QM energies were calculated with MP2/6-31G(d) level of theory.86 Separate χ parameters for purines and pyrimidines were calculated following a published procedure.35 A total of 2 × 4 × 36 = 288 QM data points were used in the fitting for purines (A, G) and for pyrimidines (C, U). These were fit to eq 5.35
| 5 |
In eq 5, ϕ1 and ϕ2 are the O4′-C1′–N1-C6 and C2′-C1′–N1-C6 torsion angles, respectively, for pyrimidines, and O4′-C1′–N9-C8, and C2′-C1′–N9-C8 for purines (Figure 1) where ϕ1 – ϕ2 ≈ 120°. Vn1 and Vn2 are the new torsional energy barriers calculated after fitting data by linear least-squares to the Fourier series shown in eq 5 (see Table S6A for frcmod87 file).
Starting Structures
Multiple starting structures provide rigorous benchmarks of a force field by testing whether a highly unstable structure can be restored to one consistent with experimental data. Multiple starting structures also assist with convergence, which can be difficult even in 2 μs replica exchange simulations of the tetramer r(GACC).88 Two different starting structures were used here: (I) an A-form-like structure generated with AMBER’s nucgen program and modified by removing H4′ atoms and adding C6′, H6′, and H6′′ atoms (Figure 1), and (II) a syn structure generated from simulated annealing as described below and outlined in Table S7.
The syn starting structure was generated with 2000 simulated annealing runs of 5 ns each with torsional restraints on χ. Each succeeding simulation started from the previous one. The implicit solvent generalized Born method was used during simulated annealing. Minimization, Particle Mesh Ewald, and periodic boundaries were disengaged, with a 10 Å cutoff for long-range nonbonding interactions. Chiral restraints were used to prevent chiral inversions. Velocity limit was set to 10 AMBER units, or 0.49 Å/ps. The weak temperature coupling algorithm was employed. Salt concentration was set at 1.0 M. The seed for the random number generator was set at 398. Both starting structures were solvated in a truncated octahedral 8.65 Å box with TIP3P water and neutralized with three Na+ ions using AMBER9’s LEaP program.
Details of MD Production Runs
L(CAAU) was held fixed using positional restraints of 500 kcal/(mol Å2) while the surrounding water was minimized with the steepest descent method for 500 steps and then conjugate gradient method for 500 steps. Constant volume dynamics with nonbonded cutoff of 10 Å were used. The whole system was then minimized with the steepest descent method for 1000 steps, and then the conjugate gradient method for 1500 steps with a 10 Å cutoff for nonbonded interactions.
The final minimized structure was equilibrated for 200 ps with positional restraints on L(CAAU). Temperature was gradually increased at constant volume to the NMR temperature of 275 K using Langevin dynamics with a collision frequency of 1/ps. This step also used a 10 Å cutoff of nonbonded interactions. During the equilibration, bonds involving hydrogen atoms were constrained with SHAKE.89,90
The system was again equilibrated for 100 ps starting at 300 K and cooling to 275 K using production parameters described below. During these preliminary minimizations and equilibrations, the A-form starting structure remained relatively constant but the all-syn structure changed, in particular, each nucleotide left the syn conformation.
Production runs were done with a 2 fs time step at 275 K to match the NMR temperature, and with 10 Å nonbonded cutoff, 1 atm constant pressure, isotropic position scaling, 2 ps pressure relaxation time, with no position restraints. SHAKE was used to provide bond length restraints for H atoms. MD simulations were run for 3000 ns to allow stacking and unstacking of bases. Previous studies have shown that such interactions in RNA are on the order of approximately 100 ns.63−65 The trajectory file was written every 0.1 ns. Production runs were executed on the University of Rochester’s IBM BlueHive cluster, where the simulations progressed at approximately 25–30 ns/day on 8 Xeon processors requesting 499 MB RAM.
Comparison between MD and NMR
MD simulations with the parm99 and parm99_LNA force fields were run with A-form and all-syn starting structures. Each simulation was scored by taking MD structures generated every 0.1 ns and averaging them over 20 ns stepped every 0.1 ns and over the entire 3000 ns according to how well the predictions matched NMR spectra. There were two components to the scoring program: (I) 28 observed distances and (II) five torsional angles based on scalar couplings, H3′-P3′ for C1, A2, and A3 related to three ε torsions, and a combination of H5′-P5′ and H5″-P5′ for A3 and U4 related to two β torsions. The first predicted NMR ensemble average is reported at 20 ns, and the 20 ns window is shifted in 0.1 ns steps to the end of the simulation at 3000 ns. Each point reports the percentage of the predicted structural properties from the MD simulation that are consistent with NMR spectra within error limits (vide infra). Thus, the score as a function of time provides an indication of how similar the ensemble of structures in each 20 ns interval is to the ensemble average reported by NMR. The average over the entire 3000 ns provides a comparison between the ensemble average of the MD simulation and that reported by NMR. Obtaining a 100% score should only be possible if the simulation is accurate and long enough to sample the entire ensemble. Reservoir replica exchange MD (R-REMD)91 on the RNA, GACC, indicate that 3000 ns MD is not long enough to sample the entire ensemble, but can generate the species most populated when R-REMD is used to reach convergence.88
NMR-Observed Distances
For each of the 28 measured NMR distances, rNOE trajectory time points were read into an array as ri–6, for a total of 30 000 ri. Then, the mean for each 20 ns interval, according to eq 6, was written to an array of means with 29 800 points.
| 6 |
An MD predicted distance was scored +1 if it agreed with the NMR distance within error limits described by eqs 3a and 3b and 0 if it was predicted to be outside the experimental range.
3J Scalar Coupling
The MD predicted standard mean of J-coupling was calculated for torsions β3, β4, and ε with eqs 7a(92) and 7b.93
| 7a |
| 7b |
Here, θ = β – 120° for H5′-P5′, θ = β + 120° for H5″-P5′, and θ = ε + 120° for H3′-P3′. Because eqs 7a and 7b give nearly identical predicted 3J(1H–31P), only eq 7a was used for comparisons between MD and NMR.
Karplus functions, such as eqs 7a and 7b, are trigonometric. Therefore, multiple different angles can give the same 3J scalar coupling. Furthermore, a given error in Hz cannot be easily equated to an error in degrees. Thus, one cannot say that the simulation has a correct β or ε torsion angle, only that the torsion is consistent or inconsistent with the measured scalar coupling.
For scoring of predictions from MD simulations, the MD-generated β torsions were stored as predicted H5′-P5′ and H5″-P5′ scalar couplings. If the MD-predicted scalar couplings were within 1 Hz of the NMR value, then that time interval was scored +1.
The ε torsions were interpreted directly instead of as scalar couplings. NMR 3J scalar coupling gives four possible ranges for torsional angles, but only the range near 195° is energetically favorable for a C3′-endo sugar.93 The width of the range is also dependent on the 3J value. For example, with a value of 8.6 ± 0.5 Hz for 3J1H–31P, eq 7a gives possible ranges for ε1 of 358–3° (i.e., −2 to 3°), 117–122°, 209–221°, and 259–271° while eq 7b gives ranges of 358–3°, 117–122°, 210–223°, and 257–270°. This implies a range of 209–223° for ε1.
Comparisons to A-Form
Each trajectory point was also scored by resemblance to A-form. Each of 19 backbone torsional angles in L(CAAU), excluding δ, was given ranges based on RNA X-ray data (Table 2). Each trajectory point was then scored according to how many of the torsions were within the specified limits.
Table 2. A-Form Torsion Regionsa.
| α | β | γ | ε | ζ |
|---|---|---|---|---|
| 280 – 310° | 165 – 195° | 45 – 75° | 195 – 225° | 275 – 305° |
| (150 – 190°) | (120 – 250°) | (160 – 190°) | (180 – 300°) | (50 – 350°) |
| (50 – 90°) | (290 – 310°) |
Limits were chosen based on inspection of X-ray torsion histograms of the ribosome.77 The top row shows the ranges that were scored A-form in the simulations and which represent the highest populations in the X-ray crystal structure. The bottom two rows show minor ranges for α and γ, while broader, less represented ranges are shown for β, ε, and ζ.
Results and Discussion
Comparison of LNA χ Torsional Profiles
The energy profiles of LNA nucleosides with respect to χ torsions are shown in Figure 3. Table 3 contains the revised χ torsional parameters derived from fitting the QM energies. The QM profiles are different from those of RNA parm99, i.e., the minima and barrier heights are different. As was the case for RNA, the altered shapes will affect thermodynamic equilibria and increased barriers to rotation should slow predicted kinetics determined by the χ torsion. The LNA parameters show lower barrier heights than RNA parm99 χ_Yil,35 however, suggesting LNA χ torsions have faster dynamics than RNA, especially for A and G.
Figure 3.

Total energy (kcal/mol) vs (χ + 180°) of LNA residues (a) adenosine, (b) guanosine, (c) cytidine, and (d) uridine with parm99_LNA (red), RNA parm99 (black), RNA parm99_Yil (blue), and MP2/6-31G(d) (green). Note that O4′-C1′–N9-C8 and O4′-C1′–N1-C6 defined for purines and pyrimidines, respectively, represent χ +180. These plots can be compared to Figures 2–5 of Yildirim et al.35 and Figure 6 of Zgarbová et al.38 The figures indicate that LNA and RNA residues do not behave identically. Note also that RNA parm99χ_Yil is shown only for comparison.
Table 3. AMBER LNA χ Parameters.a.
| nucleoside | torsion | n | Vn |
|---|---|---|---|
| LNA Purines (A,G) | O4′-C1′–N9-C8 | 1 | 1.75141 |
| 2 | 1.06497 | ||
| 3 | –1.73368 | ||
| 4 | 0.238361 | ||
| C2′-C1′–N9-C8 | 1 | 0.4216 | |
| 2 | 0.624584 | ||
| 3 | 1.13323 | ||
| 4 | 0.165055 | ||
| LNA Pyrimidines (C,U) | O4′-C1′–N1-C6 | 1 | 0.815398 |
| 2 | 1.15517 | ||
| 3 | –2.78597 | ||
| 4 | 0.138464 | ||
| C2′-C1′–N1-C6 | 1 | 0.592887 | |
| 2 | 0.104606 | ||
| 3 | 2.02548 | ||
| 4 | –0.128426 |
Values are results after fitting data (A,G for purines; C,U for pyrimidines) by linear least-squares to the Fourier series shown in eq 5. This fitting method assumes that the phase, γ, in Vn(1 + cos(nϕ + γ), which represents the potential energy of torsions, is either 0° (Vn > 0) or 180° (Vn < 0) (see Table S6A).
NMR
Figures S2 and S3 show chemical shift temperature dependence for L(CAAU). No cooperative transitions were observed from 0 to 81 °C, indicating that L(CAAU) is single-stranded. Figure 4 shows a NOESY walk for L(CAAU), and resonance assignments are presented in Table S8. All H1′ resonances are singlets, consistent with the expected C3′-endo conformation. Table 4 compares the NMR distances with those from MD simulations. Figure 5 compares average A-form distances94−97 to NMR distances. The results imply that L(CAAU) is approximately A-form, but NOEs for nH2′ to (n + 1)H6/8 are weaker than expected for A-form (Table S9A), indicating a slight deviation from A-form. However, these deviations are predicted by the force-fields (Table 4).
Figure 4.

NOESY walk region from a 200 ms mixing time spectrum of 1.1 mM L(CAAU) in 80 mM NaCl, 0.1 mM Na2EDTA, and 20 mM phosphate at pH 7, 2 °C.
Table 4. Comparison of NMR-Measured and MD-Predicted 1H–1H Distances (Å)a.
| NOE | NMR lower limit - measured - upper limit | parm99 | parm99_LNA | parm99 syn | parm99_LNA syn |
|---|---|---|---|---|---|
| C1H1′-C1H6 | 3.34–3.80–4.37 | 3.38 | 3.58 | 3.46 | 4.75 |
| C1H2′-C1H6 | 3.84–4.52–6.19 | 2.27 | 3.39 | 2.18 | 4.49 |
| C1H2′-A2H1′ | 3.67–4.25–5.25 | 3.78 | 3.45 | 4.16 | 4.70 |
| C1H2′-A2H8 | 3.43–3.92–4.56 | 5.14 | 4.07 | 5.16 | 5.47 |
| C1H3′-C1H6 | 2.29–2.55–2.80 | 2.41 | 2.45 | 2.39 | 3.25 |
| C1H3′-A2H8 | 2.54–2.83–3.12 | 4.52 | 3.21 | 6.73 | 4.26 |
| C1H6-A2H8 | 3.40–3.88–4.50 | 4.60 | 3.88 | 4.50 | 5.11 |
| A2H1′-A2H8 | 3.37–3.84–4.43 | 3.45 | 3.70 | 3.66 | 4.97 |
| A2H2′-A2H8 | 3.48–3.99–4.68 | 2.32 | 3.24 | 2.29 | 4.56 |
| A2H3′-A2H8 | 2.27–2.53–2.78 | 2.57 | 2.53 | 2.47 | 3.31 |
| A2H3′-A3H8 | 2.81–3.14–3.49 | 3.83 | 3.34 | 6.83 | 4.60 |
| A2H2′-A3H1′ | 3.26–3.70–4.22 | 4.15 | 3.30 | 4.10 | 4.52 |
| A2H2′-A3H8 | 3.01–3.38–3.79 | 4.79 | 3.37 | 5.22 | 4.35 |
| A2H3′-A3H1′ | 3.46–3.96–4.63 | 5.41 | 4.91 | 6.50 | 6.97 |
| A2H8-A3H8 | 3.68–4.27–5.29 | 4.53 | 4.09 | 4.45 | 5.43 |
| A3H1′-A2H2 | 3.02–3.39–3.80 | 4.89 | 3.35 | 8.14 | 4.41 |
| A3H1′-A3H8 | 3.32–3.77–4.33 | 3.66 | 3.75 | 3.65 | 4.97 |
| A3H1′-U4H1′ | 3.54–4.06–4.83 | 5.58 | 5.76 | 5.76 | 7.95 |
| A3H2′-U4H1′ | 3.44–3.93–4.59 | 4.02 | 4.20 | 4.36 | 5.36 |
| A3H2′-U4H3′ | 3.76–4.39–5.64 | 3.91 | 4.22 | 3.82 | 4.02 |
| A3H2′-U4H6 | 2.83–3.17–3.52 | 3.63 | 3.15 | 4.89 | 4.01 |
| A3H3′-A3H8 | 2.26–2.52–2.76 | 2.47 | 2.52 | 2.50 | 3.30 |
| A3H3′-U4H6 | 3.03–3.41–3.82 | 3.85 | 3.46 | 5.69 | 5.00 |
| A3H2′-A3H8 | 3.63–4.20–5.11 | 2.43 | 4.14 | 2.28 | 4.56 |
| A3H2-U4H1′ | 3.09–3.48–3.91 | 4.00 | 3.20 | 8.70 | 4.65 |
| U4H1′-U4H6 | 3.24–3.67–4.18 | 3.12 | 3.63 | 3.15 | 4.76 |
| U4H2′-U4H6 | 3.69–4.28–5.31 | 2.41 | 4.06 | 2.28 | 4.62 |
| U4H3′-U4H6 | 2.09–2.32–2.55 | 2.47 | 2.40 | 2.47 | 3.22 |
Parm99_LNA syn distances are averaged only after 2443 ns. Table S9 lists X-ray distances not detected by NMR and for NOEs listed above. Only two of the X-ray distances undetected by NMR were shorter than 5.0 Å: C1H2′-A2H3′ (4.32 ± 0.09 Å) and A2H2′-A3H3′ (4.45 ± 0.07 Å) and X-ray distances averaging above 5.0 Å were only detected twice by NMR.
Figure 5.
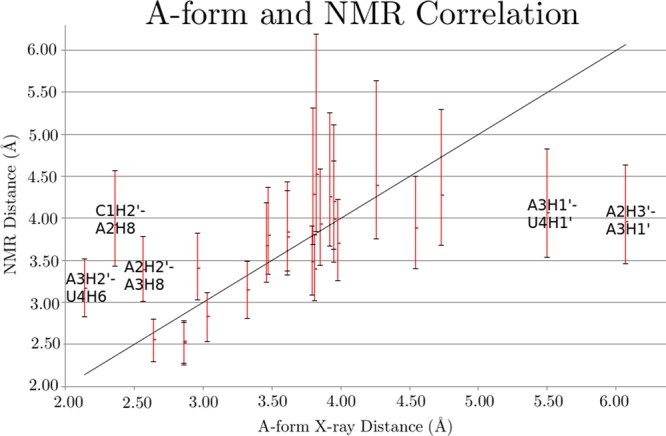
Comparison between A-form distances averaged from RNA PDB structures 157D,941QC0,951QCU,953NJ6,963ND3,97 and 3ND4(97) and NMR distances for L(CAAU). Points fall on line if NMR and A-form distances are equal. Red vertical bars represent NMR error ranges. A3H1′-U4H1′ and A2H3′-A3H1′ may appear much shorter in NMR than in reality due to spin diffusion through U4H6 and A2H8 or A3H8, and/or A3H2′ and A2H2′, respectively. The long nH2′ to (n + 1)H8/6 measured distances are consistent with MD predictions.
Inferring χ Torsions from Base to Sugar NOE Distances
QM calculations on models of C, A, and U defined three energy minima for the χ torsion (Figures 2 and S1), corresponding to G+ (syn), T (anti), and G- (high-anti) conformations. Equations 2, 4a, and 4b were used to predict the NOE volumes and their experimental limits for intranucleotide cross peaks between the H6 (C and U) or H8 (A) and their H1′, H2′, and H3′ sugar protons (Table 5). The results indicate that the NOEs to H1′ and H3′ can identify a G+ conformation and those to H2′ can identify a G- conformation. As shown in Table 5, only the T conformation is consistent with NOEs to H1′, H2′, and H3′. Evidently, all nucleotides are majority T in solution. Attempts to determine χ on the basis of 1H–13C scalar coupling constants and 13C chemical shifts were unsuccesful due to the low concentration of the natural abundance sample synthesized.
Table 5. Comparison between Predicted and Measured Intranucleotide Sugar-Base NOEs Used to Deduce χ Torsion Populations.a Predictions are from A, C, and U Structures Minimized with QM (Figure 2).
| predicted
NOE volumes (range of predicted volumes) |
|||||||
|---|---|---|---|---|---|---|---|
| NOE | G+ (syn) | T (anti) | G- (high-anti) | measured volumes | consistent torsion (s) | inconsistent torsion (s) | dominant torsion |
| C1H6–H1′ | 5480 (2860–9480) | 502 (213–918) | 511 (218–934) | 278 | T,G- | G+ | |
| C1H6–H2′ | 633 (282–1140) | 143 (22–300) | 9700 (5100–16800) | 97.4 | T | G+,G- | T |
| C1H6–H3′ | 83 (0–197) | 3410 (1760–5920) | 9700 (5100–16800) | 3020 | T | G+,G- | |
| A2H8–H1′ | 2460 (1250–4290) | 402 (160–746) | 330 (121–621) | 261 | T,G- | G+ | |
| A2H8–H2′ | 568 (248–1030) | 100 (0–226) | 4690 (2440–8140) | 207 | T | G+,G- | T |
| A2H8–H3′ | 84 (0–199) | 1290 (631–2270) | 6950 (3640–12000) | 3170 | None | G+,T,G- | |
| A3H8–H1′ | 2460 (1250–4290) | 402 (160–746) | 330 (121–621) | 289 | T,G- | G+ | |
| A3H8–H2′ | 568 (248–1030) | 100 (0–226) | 4690 (2440–8140) | 152 | T | G+,G- | T |
| A3H8–H3′ | 84 (0–199) | 1290 (631–2270) | 6950 (3640–12000) | 3280 | None | G+,T,G- | |
| U4H6–H1′ | 6590 (3450–11400) | 485 (204–889) | 430 (175–794) | 340 | T,G- | G+ | |
| U4H6–H2′ | 437 (179–807) | 158 (30–326) | 7340 (3850–12700) | 136 | T | G+,G- | T,G- |
| U4H6–H3′ | 61 (0–159) | 2820 (1450–4910) | 9700 (5100–16800) | 5320 | G- | G+,T | |
Volumes are in arbitrary relative units. Base proton to sugar proton volumes are used to evaluate whether a given χ torsion exists in a certain population. Predicted and measured NOE volumes for torsions are listed along with the range of predicted volumes in parentheses considering experimental errors in NMR measured volumes as calculated via eqs 4a and 4b. The dominant torsion for each nucleotide is listed with the H2′ proton.
Scalar Coupling Interpretation
The lack of an LNA H4′ atom means that the γ torsion is not directly observable by 1H–1H scalar coupling. Measured β and ε scalar couplings are presented, respectively, in the caption and the third column of Table 6. The 3JH5′-P5′ and 3JH5″-P5′ couplings for the β3 and β4 torsions were 5.0 and <1 Hz, respectively, which implies from eqs 7a and 7b two possible ranges for β: 162–166° or 194–198°. Alternatively, the β torsion could also rapidly change between the two regions and still show the same scalar coupling values. The β torsion range for an A-form structure is approximately 165–195°.
Table 6. NMR Scalar Couplings (Hz), Deduced Torsion Angles (°), and MD Predictions.a.
| A-form | NMR | parm99 | parm99 syn | parm99_LNA | parm99_LNA syn | |
|---|---|---|---|---|---|---|
| ε1 | 7.4/208° | 8.6/216° | 5.5/203° | 4.7/195° | 7.3/223° | 7.3/222° |
| ε2 | 7.4/208° | 7.2/207° | 4.3/192° | 4.3/193° | 6.4/210° | 6.7/210° |
| ε3 | 7.4/208° | 7.2/207° | 4.8/195° | 4.5/194° | 6.5/205° | 5.8/202° |
| β3 | 191° | 162–166°; 194–198° | 180.2° | 177.3° | 181.9° | 172.1° |
| β4 | 177° | 162–166°; 194–198° | 179.3° | 178.3° | 175.4° | 180.9° |
The ε torsion couplings (H3′-P3′) are quadruply degenerate at the measured values, and the angles presented are the torsion angles consistent with A-form geometry. parm99_LNA with the syn starting orientation is scored after the 2443 ns transition. The β torsion is not directly observable, but can be determined from the H5′-P5′ and H5″-P5′ scalar couplings, which are 5 Hz and <1 Hz. H5′ and H5″ were not stereotypically assigned. These scalar couplings allow for two possible ranges of β. The β and ε 3J scalar couplings have an error of ∼0.5 Hz. Equation 7a was used to convert measured 3J scalar couplings to torsion angles. The Karplus functions are likely accurate within 1 Hz.
Molecular Dynamics
Table S10 contains means of backbone and glycosidic torsion angles, corrected for circular discontinuity,98 from the nucgen A-form-like and the all-syn starting structures and the average values from MD simulations. Backbone and glycosidic torsions are defined following standard conventions.92 Unminimized starting PDB files are printed in Tables S11A and S11B.
A-Form Starting Structure with parm99
The AMBER parm99 simulation starting from an A-form structure is shown in Figure S6A. Tables 4 and 6 compare MD predictions to NMR distances and torsions, respectively.
L(CAAU) maintained a relatively stable A-form like structure and agreement with NMR values until approximately 190 ns (Figure S6A). The pseudorotation phase angle for each of the nucleotides varied from −4° to 44° with a mean of 20° and a standard deviation of approximately 5°, which is consistent with a C3′-endo sugar. The time before collapse from the A-form was longer for L(CAAU) than the ∼10 ns and ∼50 ns observed for A-form r(GACC)37 and r(CCCC),41 respectively, presumably due to the more restricted LNA sugar. The collapse of L(CAAU) was started by an intercalation of C1 between A2 and A3, with sharp changes in χ2, ε2, ζ2, α3, β3, and γ3 (Figures S6 and S6A at 200 ns). The simulation only briefly recovered an A-form like structure. At ∼800 ns, the molecule adopted C1-A3 and A2-U4 stacks, which are not consistent with NOESY spectra as there are neither C1-A3 nor A2-U4 cross-peaks. This transition is correlated with sharp changes in χ and ζ. From 1640 to 1850 ns, the structure primarily sampled random-coil structures, although an A-form structure with an inverted C1 was present from ∼1751 to 1805 ns. This structure may have a small population in solution, although no NOEs indicate this.
Measured and predicted mean 3J scalar couplings and β and ε angles are presented in Table 6 and its caption. Measured and predicted χ torsions, respectively, are in Table 5 and Figure 6. With parm99, all of the χ torsions are predicted to have substantial populations in the G- (high-anti) conformation (Figure 6), which does not agree with NMR (Table 5). The proclivity of AMBER parm99 to prefer high-anti (G-) over anti (T) orientations has also been seen in other RNA simulations.37,38
Figure 6.
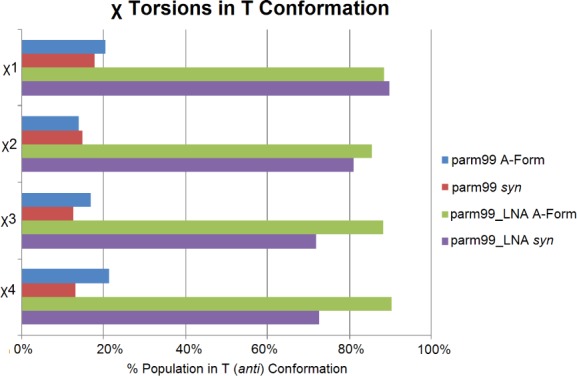
The percentage of each nucleotide predicted to be in the T (anti) configuration is shown for each of the four MD simulations. The parm99_LNA simulations show much closer agreement with NMR, which is consistent with nearly 100% T in solution. Simulations were scored for the entire 3000 ns. A maximum of 1.8% of a G+ (syn) population was observed so most of the non-T population was G- (high-anti). Population details are in Table S12.
Distributions of MD-predicted torsions for parm99 simulations are plotted in Figure S5. The β torsions clustered at a T orientation, making occasional transitions to G+ and G-. For A3 and U4, the MD simulation predicted relatively stable β torsions of ∼180°, which is between the regions around 164° and 196° consistent with the H5′/5″-P5′ scalar couplings according to eqs 7. The MD-predicted ε torsions all clustered at T positions, i.e., between 150° and 210°.
Overall, parm99 did not do well in reproducing features of the NMR spectra (Tables 4 and 6). The NMR scores range from 3% to 76% with a mean of 35% and a standard deviation of 12%.
The α, γ, and ζ torsions cannot be directly determined by NMR, so these torsions are compared to the RNA crystal database. LNA backbone torsions in crystal structure 2X2Q(70) exhibit similar clustering behavior as RNA torsions, even though structures are not identical. With this caveat, the LNA α torsions are expected to cluster into one major G- (270–330°) conformation and two minor G+ (30–90°)/T (150–210°) conformations, which are similar to the distributions predicted from MD simulations (Figure S5). The γ torsion, which is closely coupled with α, was mainly G+ with a T minor form; RNA X-ray structures have a major form at 60° (G+) with two minor forms at 180° (T) and 300° (G-). Thus, this parm99 simulation predicts expected populations of α/γ. The ζ torsion in the parm99 simulation prefers a G- conformation with a minor conformation at G+. In the ribosome crystal structure,77 ζ is mostly found in the G- geometry. However, it also shows a greater variability in the crystal than in the LNA simulation. This suggests the ζ profile may be prejudiced toward a certain orientation by inaccurate force field parameters, by a difference between LNA and RNA, by the relatively small sample size for the simulation, or because ζ torsions in rRNA are affected by tertiary and quaternary interactions.
Syn Starting Structure with parm99
The parm99 simulation starting with the syn structure is shown in Figure S7A, and comparison to NMR data is presented in Tables 4 and 6. After initial minimization and equilibration, the starting structure had no base–base stacking (Figure S7A) and an NMR score of 18%. The average pseudorotation phase angles generated during the simulations were nearly identical to those in the A-form simulation, i.e., as expected for the constrained sugar, that parameter is not affected by starting structure. The maximum NMR score during the simulation was 42%. At 200 ns, the simulation reached an NMR score of 36%, and oscillated around that for the remainder of the simulation. At 255 ns, the molecule adopted an A-form like arrangement that endured until 850 ns, and reappeared from 1220 to 1780 ns. Here, the A-form is defined as a four-way stack of all nucleotides. This structure never entered a truly A-form arrangement or substantial agreement with NMR, as the χ torsions were never all in a T conformation. At 860 ns, U4 left the helix to form a 3′ terminal unstacked conformation. The terminal unstacked form does not show a substantial change within a 1-D RMSD plot, but is easily seen in the 2-D RMS plot (Figure S7A). After 1780 ns, U4 again briefly became 3′ terminal unstacked, before stacking on top of C1. There is no NMR evidence for this structure as there are no C1–U4 NOEs. None of the non-A-form structures in this simulation were seen in the parm99 simulation starting with A-form. The backbone torsion population distribution, however, was very similar to that with the A-form starting structure (Figure S5, red curves). Thus, the backbone torsion population distribution was not very dependent on starting structure. If a force field were perfect, then an infinitely long simulation would drive any starting structure to something in agreement with experimental data. In the 3000 ns simulation, parm99 did not drive the all-syn structure to a reasonable equilibrium that agreed with NMR data, although it moved in that direction.
The syn starting structure was consistent with only 3% of NMR distances, but the parm99 parameters were able to improve the structure during the minimization and equilibration steps. The NMR scores ranged from 9% to 42% with a mean of 33% and a standard deviation of 5%. If the first 200 ns are discounted, the score increases by <1%. Thus, the mean NMR scores for the parm99 simulations with A-form and syn starting structure are within one standard deviation of each other.
A-Form Starting Structure with parm99_LNA
The parm99_LNA simulation for L(CAAU) starting with A-form is shown in Figure 7, and comparisons to NMR data are presented in Tables 4 and 6. The average pseudorotation phase angles were not affected by the new parameters. The tetramer preferred A-form, but cycled through approximately 22 non-A-form structures throughout the 3000 ns simulation (see structures for 580, 1620, and 1800 ns in Figure 7). For example, at approximately 580 ns, C1 left the helix to create a 5′ terminal unstacked LNA which persisted for ∼10 ns. A transient 3′ terminal unstacked LNA was seen at 990 ns. As with the parm99 results, it is possible that such structures have a small population in solution. Only two structures seen would be considered “random-coil”, defined as an entirely unstacked structure, which is unlikely given stabilizing base stacking interactions.99−101 The totally unstacked structures are transient, persisting for approximately 40 and 150 ns, respectively. Unlike parm99 simulations, there were no intercalations during this simulation. Relative to the parm99 simulation, the parm99_LNA simulation that started with an A-form structure substantially improved agreement with NMR data for L(CAAU) (Tables 4, 6, and Figure 6). In contrast to parm99 simulations (Figure S6A and Figure S7A) which preferred a G- (high-anti) χ, parm99_LNA favors a T (anti) orientation (Figures 6, S6A, and S10). Similar results were seen for RNA χ revisions.35,37,38 This parm99_LNA simulation with LNA-specific χ and RESP parameters showed improvement over both parm99 MD simulations. NMR scores ranged from 39% to 76% with a mean of 66% and a standard deviation of 8%.
Figure 7.

L(CAAU) parm99_LNA simulation starting with the same A-form structure as the parm99 A-form simulation. The top two graphs are, respectively, the time dependence of NMR score averaged over 20 ns intervals and the A-form score in 0.1 ns intervals. The quilt plot is a 2D-RMS plot, where x and y axes are time, with blue and yellow areas representing, respectively, low and high RMSD (Å) between structures. The plot is perfectly symmetric along the diagonal. This allows visualization of structural clustering in the simulation. The bottom four plots represent χ torsions for nucleotides C1, A2, A3, and U4. All 2D-RMS plots were graphed with GNUPlot v 4.4. The mean NMR score is 66 ± 8%. The NMR distances for A3H1′-U4H1′ and A2H3′-A3H1′ are likely too short (Figure 5) due to spin diffusion, but were included in the scoring.
Syn Starting Structure with parm99_LNA
The L(CAAU) parm99_LNA simulation starting in an all syn conformation is plotted in Figure 8; Tables 4 and 6 compare predictions against NMR data. The mean pseudorotation phase angles were nearly identical to the other three simulations. NMR agreement was very poor until approximately 2440 ns. From 2440 to 2450 ns, the molecule showed a substantial increase in agreement with NMR data (Figure 8), so parm99_LNA is able to repair an unrealistic structure. This improvement was due to C1 stacking on A2 and on U4 entering the helix. This A-form like structure was largely maintained until the end of the simulation at 3000 ns. The simulation even experienced a brief dip in NMR agreement at 2930 ns due to C1 flipping outside of the helix, but was able to repair itself within 20 ns. From 2443 to 3000 ns, the parm99_LNA simulation scored a mean of 61% of the NMR observables correctly. This speaks well of the new parameters. The backbone torsion populations did not differ a great deal between the two parm99_LNA simulations (Figure S10).
Figure 8.

L(CAAU) parm99_LNA simulation starting with the same all syn structure as in Figure S7A. See Figure 7 caption for details. The mean NMR score from 2443 to 3000 ns is 61 ± 11%. Structures before and after the sharp transition at 2443 ns are shown.
Conclusions
LNA-specific χ torsional and RESP parameters were created that improve agreement between computational predictions and NMR spectra for L(CAAU) as illustrated in Figure 9. To evaluate computational predictions against NMR data, new methods for estimating χ torsion ranges and for scoring the NMR agreement of the simulation are introduced. Comparisons to NMR spectra indicate that parm99_LNA parameters will improve predictions for LNA nucleotides, particularly if starting structures are not far removed from the true structures or if simulations are run for very long times.
Figure 9.

NMR agreement is compared between the A-form and syn starting structures and simulations. I-shaped bars are written at ±1 standard deviation for 20 ns windows of each simulation.
It has recently been found that reducing van der Waals interactions between bases and also changing base–water interactions improves structural predictions for three RNA tetraloops.102 These revisions may also reduce intercalated species of the type seen in MD simulations of r(GACC)37 and r(CCCC),41 as well as in L(CAAU) with parm99. The lack of intercalation in L(CAAU) with parm99_LNA, however, suggests that improved parametrization of ribose may also improve RNA simulations. The results support assumptions that fitting energy functions derived from QM calculations can provide reasonable approximations for force fields required for artificial nucleic acids. Moreover, improved modeling of ribose is likely to substantially improve RNA simulations, but more modifications are also necessary to provide agreement with NMR data.
Acknowledgments
We are very appreciative for the help and resource time of the University’s Computing Research Center. Grateful appreciation is extended to Dr. Harry Stern and users at Ubuntu Forums who helped with programming questions, and also the AMBER Mailing List, which has been invaluable and patient with questions. This work was supported by National Institutes of Health (NIH) grant R01 GM22939. The content is the sole responsibility of the authors and does not necessarily represent the official views of the National Institutes of Health.
Supporting Information Available
Tables showing fixed LNA distances used to calculate NMR scaling factor, comparison of QM to X-ray distances, basis sets used during QM minimization, RESP charges, simulated annealing protocol, chemical shift assignments, starting structure and simulation predicted torsion values, starting structure coordinates, and figures of torsion population histograms and backbone torsion performance. This material is available free of charge via the Internet at http://pubs.acs.org/.
The authors declare no competing financial interest.
Funding Statement
National Institutes of Health, United States
Supplementary Material
References
- Obika S.; Nanbu D.; Hari Y.; Morio K.; In Y.; Ishida T.; Imanishi T. Synthesis of 2′-O,4′-C-methyleneuridine and -Cytidine. Novel Bicyclic Nucleosides Having a Fixed C3′, -endo sugar puckering. Tetrahedron Lett. 1997, 38, 8735–8738. [Google Scholar]
- Obika S.; Nanbu D.; Hari Y.; Andoh J.-i.; Morio K.; Doi T.; Imanishi T. Stability and Structural Features of the Duplexes Containing Nucleoside Analogues with a Fixed N-type Conformation, 2′-O,4′-C-methyleneribonucleosides. Tetrahedron Lett. 1998, 39, 5401–5404. [Google Scholar]
- Singh S. K.; Nielsen P.; Koshkin A. A.; Wengel J. LNA (Locked Nucleic Acids): Synthesis and High-Affinity Nucleic Acid Recognition. Chem. Commun. 1998, 455–456. [Google Scholar]
- Egli M.; Minasov G.; Teplova M.; Kumar R.; Wengel J. X-ray Crystal Structure of a Locked Nucleic Acid (LNA) Duplex Composed of a Palindromic 10-mer DNA Strand Containing one LNA Thymine Monomer. Chem. Commun. 2001, 651–652. [Google Scholar]
- Vester B.; Lundberg L. B.; Sørensen M. D.; Babu B. R.; Douthwaite S.; Wengel J. LNAzymes: Incorporation of LNA-Type Monomers into DNAzymes Markedly Increases RNA Cleavage. J. Am. Chem. Soc. 2002, 124, 13682–13683. [DOI] [PubMed] [Google Scholar]
- Nielsen K. E.; Spielmann H. P. The Structure of a Mixed LNA/DNA: RNA Duplex is Driven by Conformational Coupling Between LNA and Deoxyribose Residues as Determined from C-13 Relaxation Measurements. J. Am. Chem. Soc. 2005, 127, 15273–15282. [DOI] [PubMed] [Google Scholar]
- You Y.; Moreira B. G.; Behlke M. A.; Owczarzy R. Design of LNA Probes that Improve Mismatch Discrimination. Nucleic Acids Res. 2006, 34, e60. [DOI] [PMC free article] [PubMed] [Google Scholar]
- Srivastava P.; Barman J.; Pathmasiri W.; Plashkevych O.; Wenska M.; Chattopadhyaya J. Five- and Six-Membered Conformationally Locked 2′,4′-Carbocyclic ribo-Thymidines: Synthesis, Structure, and Biochemical Studies. J. Am. Chem. Soc. 2007, 129, 8362–8379. [DOI] [PubMed] [Google Scholar]
- Hirva P.; Nielsen A.; Bond A. D.; McKenzie C. J. Potential Cross-Linking Transition Metal Complexes (M = Ni, Cu, Zn) in the Ligand-Modified LNA Duplexes. J. Phys. Chem. B 2010, 114, 11942–11948. [DOI] [PubMed] [Google Scholar]
- Altona C.; Sundaralingam M. Conformational-Analysis of Sugar Ring in Nucleosides and Nucleotides - New Description Using Concept of Pseudorotation. J. Am. Chem. Soc. 1972, 94, 8205–8212. [DOI] [PubMed] [Google Scholar]
- Koshkin A. A.; Nielsen P.; Meldgaard M.; Rajwanshi V. K.; Singh S. K.; Wengel J. LNA (Locked Nucleic Acid): An RNA Mimic Forming Exceedingly Stable LNA: LNA Duplexes. J. Am. Chem. Soc. 1998, 120, 13252–13253. [Google Scholar]
- Kierzek E.; Ciesielska A.; Pasternak K.; Mathews D. H.; Turner D. H.; Kierzek R. The Influence of Locked Nucleic Acid Residues on the Thermodynamic Properties of 2′-O-methyl RNA/RNA Heteroduplexes. Nucleic Acids Res. 2005, 33, 5082–5093. [DOI] [PMC free article] [PubMed] [Google Scholar]
- Pasternak A.; Kierzek E.; Pasternak K.; Fratczak A.; Turner D. H.; Kierzek R. The Thermodynamics of 3′-Terminal Pyrene and Guanosine for the Design of Isoenergetic 2′-O-methyl-RNA-LNA Chimeric Oligonucleotide Probes of RNA Structure. Biochemistry 2008, 47, 1249–1258. [DOI] [PubMed] [Google Scholar]
- Wahlestedt C.; Salmi P.; Good L.; Kela J.; Johnsson T.; Hokfelt T.; Broberger C.; Porreca F.; Lai J.; Ren K. K. Potent and Nontoxic Antisense Oligonucleotides Containing Locked Nucleic Acids. Proc. Natl. Acad. Sci. U.S.A. 2000, 97, 5633–5638. [DOI] [PMC free article] [PubMed] [Google Scholar]
- Hutvagner G.; Simard M. J.; Mello C. C.; Zamore P. D. Sequence-Specific Inhibition of Small RNA function. PLoS Biol. 2004, 2, 465–475. [DOI] [PMC free article] [PubMed] [Google Scholar]
- Elmén J.; Thonberg H.; Ljungberg K.; Frieden M.; Westergaard M.; Xu Y. H.; Wahren B.; Liang Z. C.; Urum H.; Koch T. Locked Nucleic Acid (LNA) Mediated Improvements in siRNA Stability and Functionality. Nucleic Acids Res. 2005, 33, 439–447. [DOI] [PMC free article] [PubMed] [Google Scholar]
- Elmén J.; Lindow M.; Silahtaroglu A.; Bak M.; Christensen M.; Lind-Thomsen A.; Hedtjärn M.; Hansen J. B.; Hansen H. F.; Straarup E. M.; et al. Antagonism of microRNA-122 in mice by Systemically Administered LNA-antimiR Leads to up-Regulation of a Large Set of Predicted Target mRNAs in the Liver. Nucleic Acids Res. 2008, 36, 1153–1162. [DOI] [PMC free article] [PubMed] [Google Scholar]
- Elmén J.; Lindow M.; Schütz S.; Lawrence M.; Petri A.; Obad S.; Lindholm M.; Hedtjärn M.; Hansen H. F.; Berger U. LNA-mediated microRNA Silencing in non-Human Primates. Nature 2008, 452, 896–899. [DOI] [PubMed] [Google Scholar]
- Braasch D. A.; Liu Y.; Corey D. A. Antisense Inhibition of Gene Expression in Cells by Oligonucleotides Incorporating Locked Nucleic Acids: Effect of mRNA Target Sequence and Chimera Design. Nucleic Acids Res. 2002, 30, 5160–5167. [DOI] [PMC free article] [PubMed] [Google Scholar]
- Kore A. R.; Shanmugasundaram M.; Charles I.; Vlassov A. V.; Barta T. J. Locked Nucleic Acid (LNA)-Modified Dinucleotide mRNA Cap Analogue: Synthesis, Enzymatic Incorporation, and Utilization. J. Am. Chem. Soc. 2009, 131, 6364–6365. [DOI] [PubMed] [Google Scholar]
- Gupta N.; Fisker N.; Asselin M. C.; Lindholm M.; Rosenbohm C.; Orum H.; Elmen J.; Seidah N. G.; Straarup E. M. A Locked Nucleic Acid Antisense Oligonucleotide (LNA) Silences PCSK9 and Enhances LDLR Expression In Vitro and In Vivo. PLoS One 2010, 5, e10682. [DOI] [PMC free article] [PubMed] [Google Scholar]
- Barrey E.; Saint-Auret G.; Bonnamy B.; Damas D.; Boyer O.; Gidrol X. Pre-microRNA and Mature microRNA in Human Mitochondria. PLoS One 2011, 6, e20220. [DOI] [PMC free article] [PubMed] [Google Scholar]
- Kierzek E.; Christensen S. M.; Eickbush T. H.; Kierzek R.; Turner D. H.; Moss W. N. Secondary Structures for 5′ Regions of R2 Retrotransposon RNAs Reveal a Novel Conserved Pseudoknot and Regions that Evolve under Different Constraints. J. Mol. Biol. 2009, 390, 428–442. [DOI] [PMC free article] [PubMed] [Google Scholar]
- Fang S. P.; Lee H. J.; Wark A. W.; Corn R. M. Attomole Microarray Detection of MicroRNAs by Nanoparticle-Amplified SPR Imaging Measurements of Surface Polyadenylation Reactions. J. Am. Chem. Soc. 2006, 128, 14044–14046. [DOI] [PMC free article] [PubMed] [Google Scholar]
- Nielsen C. B.; Singh S. K.; Wengel J.; Jacobsen J. P. The Solution Structure of a Locked Nucleic Acid (LNA) Hybridized to DNA. J. Biomol. Struct. Dyn. 1999, 17, 175–191. [DOI] [PubMed] [Google Scholar]
- Petersen M.; Hakansson A. E.; Wengel J.; Jacobsen J. P. α-L-LNA (α-i-ribo Configured Locked Nucleic Acid) Recognition of RNA. A Study by NMR Spectroscopy and Molecular Dynamics Simulations. J. Am. Chem. Soc. 2001, 123, 7431–7432. [DOI] [PubMed] [Google Scholar]
- Pande V.; Nilsson L. Insights into Structure, Dynamics and Hydration of Locked Nucleic Acid (LNA) Strand-Based Duplexes from Molecular Dynamics Simulations. Nucleic Acids Res. 2008, 36, 1508–1516. [DOI] [PMC free article] [PubMed] [Google Scholar]
- Suresh G.; Priyakumar U. D. Structures, Dynamics, and Stabilities of Fully Modified Locked Nucleic Acid (β-d-LNA and α-l-LNA) Duplexes in Comparison to Pure DNA and RNA Duplexes. J. Phys. Chem. B 2013, 117, 5556–5564. [DOI] [PubMed] [Google Scholar]
- Brooks B. R.; Bruccoleri R. E.; Olafson B. D.; States D. J.; Swaminathan S.; Karplus M. Charmm - a Program for Macromolecular Energy, Minimization, and Dynamics Calculations. J. Comput. Chem. 1983, 4, 187–217. [Google Scholar]
- Brooks B. R.; Brooks C. L.; Mackerell A. D.; Nilsson L.; Petrella R. J.; Roux B.; Won Y.; Archontis G.; Bartels C.; Boresch S.; et al. CHARMM: The Biomolecular Simulation Program. J. Comput. Chem. 2009, 30, 1545–1614. [DOI] [PMC free article] [PubMed] [Google Scholar]
- Cornell W. D.; Cieplak P.; Bayly C. I.; Gould I. R.; Merz K. M.; Ferguson D. M.; Spellmeyer D. C.; Fox T.; Caldwell J. W.; Kollman P. A. A 2nd Generation Force-Field for the Simulation of Proteins, Nucleic-Acids, and Organic-Molecules. J. Am. Chem. Soc. 1995, 117, 5179–5197. [Google Scholar]
- Cheatham T. E.; Miller J. L.; Fox T.; Darden T. A.; Kollman P. A. Molecular-Dynamics Simulations on Solvated Biomolecular Systems - the Particle Mesh Ewald Method Leads to Stable Trajectories of DNA, RNA, and Proteins. J. Am. Chem. Soc. 1995, 117, 4193–4194. [Google Scholar]
- Cheatham T. E.; Cieplak P.; Kollman P. A. A Modified Version of the Cornell et al. Force Field with Improved Sugar Pucker Phases and Helical Repeat. J. Biomol. Struct. Dyn. 1999, 16, 845–862. [DOI] [PubMed] [Google Scholar]
- Case D. A.; Cheatham T. E.; Darden T.; Gohlke H.; Luo R.; Merz K. M.; Onufriev A.; Simmerling C.; Wang B.; Woods R. J. The Amber Biomolecular Simulation Programs. J. Comput. Chem. 2005, 26, 1668–1688. [DOI] [PMC free article] [PubMed] [Google Scholar]
- Yildirim I.; Stern H. A.; Kennedy S. D.; Tubbs J. D.; Turner D. H. Reparameterization of RNA χ Torsion Parameters for the AMBER Force Field and Comparison to NMR Spectra for Cytidine and Uridine. J. Chem. Theory Comput. 2010, 6, 1520–1531. [DOI] [PMC free article] [PubMed] [Google Scholar]
- Banáš P.; Hollas D.; Zgarbová M.; Jurec̆ka P.; Orozco M.; Cheatham T. E.; Šponer J.; Otyepka M. Performance of Molecular Mechanics Force Fields for RNA Simulations: Stability of UUCG and GNRA Hairpins. J. Chem. Theory Comput. 2010, 6, 3836–3849. [DOI] [PMC free article] [PubMed] [Google Scholar]
- Yildirim I.; Stern H. A.; Tubbs J. D.; Kennedy S. D.; Turner D. H. Benchmarking AMBER Force Fields for RNA: Comparisons to NMR Spectra for Single-Stranded r(GACC) Are Improved by Revised chi χ Torsions. J. Phys. Chem. B 2011, 115, 9261–9270. [DOI] [PMC free article] [PubMed] [Google Scholar]
- Zgarbová M.; Otyepka M.; Šponer J.; Mládek A.; Banáš P.; Cheatham T. E.; Jurec̆ka P. Refinement of the Cornell et al. Nucleic Acids Force Field Based on Reference Quantum Chemical Calculations of Glycosidic Torsion Profiles. J. Chem. Theory Comput. 2011, 7, 2886–2902. [DOI] [PMC free article] [PubMed] [Google Scholar]
- Eryazici I.; Yildirim I.; Schatz G. C.; Nguyen S. T. Enhancing the Melting Properties of Small Molecule-DNA Hybrids through Designed Hydrophobic Interactions: An Experimental-Computational Study. J. Am. Chem. Soc. 2012, 134, 7450–7458. [DOI] [PubMed] [Google Scholar]
- Yildirim I.; Kennedy S. D.; Stern H. A.; Hart J. M.; Kierzek R.; Turner D. H. Revision of AMBER Torsional Parameters for RNA Improves Free Energy Predictions for Tetramer Duplexes with GC and iGiC Base Pairs. J. Chem. Theory Comput. 2012, 8, 172–181. [DOI] [PMC free article] [PubMed] [Google Scholar]
- Tubbs J. D.; Condon D. E.; Kennedy S. D.; Hauser M.; Bevilacqua P. C.; Turner D. H. The Nuclear Magnetic Resonance of CCCC RNA Reveals a Right-Handed Helix, and Revised Parameters for AMBER Force Field Torsions Improve Structural Predictions from Molecular Dynamics. Biochemistry 2013, 52, 996–1010. [DOI] [PMC free article] [PubMed] [Google Scholar]
- Sundaralingam M. Stereochemistry of Nucleic Acids and Their Constituents 4. Allowed and Preferred Conformations of Nucleosides, Nucleoside Mono-, Di-, Tri-, Tetraphosphates, Nucleic Acids and Polynucleotides. Biopolymers 1969, 7, 821–860. [Google Scholar]
- Arnott S.; Hukins D. W. L. Conservation of Conformation in Mono and Poly-Nucleotides. Nature 1969, 224, 886–888. [DOI] [PubMed] [Google Scholar]
- Low J. N.; Tollin P.; Wilson H. R. Correlation between Glycosyl Torsion Angle and Sugar Ring Pucker Does Not Always Exist. Nucleic Acids Res. 1982, 10, 5599–5604. [DOI] [PMC free article] [PubMed] [Google Scholar]
- Sokoloski J. E.; Godfrey S. A.; Dombrowski S. E.; Bevilacqua P. C. Prevalence of syn Nucleobases in the Active Sites of Functional RNAs. RNA 2011, 17, 1775–1787. [DOI] [PMC free article] [PubMed] [Google Scholar]
- Wüthrich K. Protein-Structure Determination in Solution by Nmr-Spectroscopy. J. Biol. Chem. 1990, 265, 22059–22062. [PubMed] [Google Scholar]
- Anderson W. A.; Freeman R. Influence of a Second Radiofrequency Field on High-Resolution Nuclear Magnetic Resonance Spectra. J. Chem. Phys. 1962, 37, 85–103. [Google Scholar]
- Griesinger C.; Otting G.; Wuthrich K.; Ernst R. R. Clean Tocsy for H-1 Spin System-Identification in Macromolecules. J. Am. Chem. Soc. 1988, 110, 7870–7872. [Google Scholar]
- Watson J. D.; Crick F. H. C. Molecular Structure of Nucleic Acids: A Structure for Deoxyribose Nucleic Acid. Nature 1953, 171, 737–738. [DOI] [PubMed] [Google Scholar]
- Das R.; Baker D. Automated de novo Prediction of Native-Like RNA Tertiary Structures. Proc. Natl. Acad. Sci. U.S.A. 2007, 104, 14664–14669. [DOI] [PMC free article] [PubMed] [Google Scholar]
- Das R.; Baker D. Macromolecular Modeling with Rosetta. Annu. Rev. Biochem. 2008, 77, 363–382. [DOI] [PubMed] [Google Scholar]
- Sripakdeevong P.; Kladwang W.; Das R. An Enumerative Stepwise Ansatz Enables Atomic-Accuracy RNA Loop Modeling. Proc. Natl. Acad. Sci. U.S.A. 2011, 108, 20573–20578. [DOI] [PMC free article] [PubMed] [Google Scholar]
- Bernauer J.; Huang X. H.; Sim A. Y. L.; Levitt M. Fully Differentiable Coarse-Grained and All-Atom Knowledge-Based Potentials for RNA Structure Evaluation. RNA 2011, 17, 1066–1075. [DOI] [PMC free article] [PubMed] [Google Scholar]
- Koshkin A. A.; Fensholdt J.; Pfundheller H. M.; Lomholt C. A Simplified and Efficient Route to 2′-O, 4′-C-methylene-Linked Bicyclic Ribonucleosides (Locked Nucleic Acid). J. Org. Chem. 2001, 66, 8504–8512. [DOI] [PubMed] [Google Scholar]
- Pedersen D. S.; Rosenbohm C.; Koch T. Preparation of LNA Phosphoramidites. Synthesis (Stuttgart) 2002, 802–808. [Google Scholar]
- Vokác̆ová Z.; Budĕšinský M.; Rosenberg I.; Schneider B.; Šponer J.; Sychrovský V. Structure and Dynamics of the ApA, ApC, CpA, and CpC RNA Dinucleoside Monophosphates Resolved with NMR Scalar Spin-Spin Couplings. J. Phys. Chem. B 2009, 113, 1182–1191. [DOI] [PubMed] [Google Scholar]
- Delaglio F.; Grzesiek S.; Vuister G. W.; Zhu G.; Pfeifer J.; Bax A. Nmrpipe - a Multidimensional Spectral Processing System Based on Unix Pipes. J. Biomol. NMR 1995, 6, 277–293. [DOI] [PubMed] [Google Scholar]
- Kneller D. G.; Kuntz I. D. UCSF Sparky - an NMR Display, Annotation and Assignment Tool. J. Cell. Biochem. 1993, 254–254. [Google Scholar]
- Overhauser A. W. Polarization of Nuclei in Metals. Phys. Rev. 1953, 92, 411–415. [Google Scholar]
- Carver T. R.; Slichter C. P. Polarization of Nuclear Spins in Metals. Phys. Rev. 1953, 92, 212–213. [Google Scholar]
- Wüthrich K.NMR of Proteins and Nucleic Acids; Wiley-Interscience: New York, 1986; p 95. [Google Scholar]
- Lide D. R.CRC Handbook of Chemistry and Physics, 88th ed.; CRC Press, 2007. [Google Scholar]
- Dewey T. G.; Turner D. H. Laser Temperature-Jump Study of Stacking in Adenylic Acid Polymers. Biochemistry 1979, 18, 5757–5762. [DOI] [PubMed] [Google Scholar]
- Freier S. M.; Hill K. O.; Dewey T. G.; Marky L. A.; Breslauer K. J.; Turner D. H. Solvent Effects on the Kinetics and Thermodynamics of Stacking in Poly(Cytidylic Acid). Biochemistry 1981, 20, 1419–1426. [DOI] [PubMed] [Google Scholar]
- Pörchke D. Molecular States in Single-Stranded Adenylate Chains by Relaxation Analysis. Biopolymers 1978, 17, 315–323. [Google Scholar]
- Muller L.; Ernst R. R. Coherence Transfer in the Rotating Frame - Application to Heteronuclear Cross-Correlation Spectroscopy. Mol. Phys. 1979, 38, 963–992. [Google Scholar]
- Chai J. D.; Head-Gordon M. Long-Range Corrected Hybrid Density Functionals with Damped Atom-Atom Dispersion Corrections. Phys. Chem. Chem. Phys. 2008, 10, 6615–6620. [DOI] [PubMed] [Google Scholar]
- Frisch M. J.; Trucks G. W.; Schlegel H. B.; Scuseria G. E.; Robb M. A.; Cheeseman J. R.; Scalmani G.; Barone V.; Mennucci B.; Petersson G. A.; et al. Gaussian 09, revision A.1; Gaussian Inc.; Wallingford CT, 2009.
- Riley K. E.; Pitoňák M.; Jurec̆ka P.; Hobza P. Stabilization and Structure Calculations for Noncovalent Interactions in Extended Molecular Systems Based on Wave Function and Density Functional Theories. Chem. Rev. 2010, 110, 5023–5063. [DOI] [PubMed] [Google Scholar]
- Eichert A.; Behling K.; Betzel C.; Erdmann V. A.; Furste J. P.; Forster C. The Crystal Structure of an “All Locked” Nucleic Acid Duplex. Nucleic Acids Res. 2010, 38, 6729–6736. [DOI] [PMC free article] [PubMed] [Google Scholar]
- Bernstein F. C.; Koetzle T. F.; Williams G. J. B.; Meyer E. F.; Brice M. D.; Rodgers J. R.; Kennard O.; Shimanouchi T.; Tasumi M. Protein Data Bank - Computer-Based Archival File for Macromolecular Structures. J. Mol. Biol. 1977, 112, 535–542. [DOI] [PubMed] [Google Scholar]
- Berman H. M.; Westbrook J.; Feng Z.; Gilliland G.; Bhat T. N.; Weissig H.; Shindyalov I. N.; Bourne P. E. The Protein Data Bank. Nucleic Acids Res. 2000, 28, 235–242. [DOI] [PMC free article] [PubMed] [Google Scholar]
- Schrödinger L.L.C.The PyMOL Molecular Graphics System, version 1.3r1 2010.
- Jenkins A. D. Stereochemical Definitions and Notations Relating to Polymers. Pure Appl. Chem. 1981, 53, 733–752. [Google Scholar]
- Richardson J. S.; Schneider B.; Murray L. W.; Kapral G. J.; Immormino R. M.; Headd J. J.; Richardson D. C.; Ham D.; Hershkovits E.; Williams L. D.; et al. RNA backbone: Consensus All-Angle Conformers and Modular String Nomenclature (an RNA Ontology Consortium Contribution). RNA 2008, 14, 465–481. [DOI] [PMC free article] [PubMed] [Google Scholar]
- Moss G. P. Basic Terminology of Stereochemistry. Pure Appl. Chem. 1996, 68, 2193–2222. [Google Scholar]
- Schneider B.; Moravek Z.; Berman H. M. RNA Conformational Classes. Nucleic Acids Res. 2004, 32, 1666–1677. [DOI] [PMC free article] [PubMed] [Google Scholar]
- Ferguson D. M.; Kollman P. A. Can the Lennard-Jones 6–12 Function Replace the 10–12 Form in Molecular Mechanics Calculations?. J. Comput. Chem. 1991, 12, 620–626. [Google Scholar]
- Cornell W. D.; Cieplak P.; Bayly C. I.; Kollman P. A. Application of RESP Charges to Calculate Conformational Energies, Hydrogen-Bond Energies, and Free-Energies of Solvation. J. Am. Chem. Soc. 1993, 115, 9620–9631. [Google Scholar]
- Bayly C. I.; Cieplak P.; Cornell W. D.; Kollman P. A. A Well-Behaved Electrostatic Potential Based Method Using Charge Restraints for Deriving Atomic Charges - the Resp Model. J. Phys. Chem. 1993, 97, 10269–10280. [Google Scholar]
- Cieplak P.; Cornell W. D.; Bayly C.; Kollman P. A. Application of the Multimolecule and Multiconformational Resp Methodology to Biopolymers - Charge Derivation for DNA, RNA, and Proteins. J. Comput. Chem. 1995, 16, 1357–1377. [Google Scholar]
- Hartree D. R. The Wave Mechanics of an Atom with a non-Coulomb Central Field Part I Theory and Methods. Proceedings of the Cambridge Philosophical Society 1928, 24, 89–110. [Google Scholar]
- Slater J. C. A Simplification of the Hartree-Fock Method. Phys. Rev. 1951, 81, 385–390. [Google Scholar]
- Hehre W. J.; Ditchfield R.; Pople J. A. Self-Consistent Molecular Orbital Methods. XII. Further Extensions of Gaussian-Type Basis Sets for Use in Molecular Orbital Studies of Organic Molecules. J. Chem. Phys. 1972, 56, 2257–2261. [Google Scholar]
- Frisch M. J.; Trucks G. W.; Schlegel H. B.; Scuseria G. E.; Robb M. A.; Cheeseman J. R.; Montgomery J. A. Jr.; Vreven T.; Kudin K. N.; Burant J. C.; et al. Gaussian 03, revision C.02; Gaussian, Inc.
- Moller C.; Plesset M. S. Note on an approximation treatment for many-electron systems. Phys. Rev. 1934, 46, 0618–0622. [Google Scholar]
- Wang J.; Kollman P. A. Automatic Parameterization of Force Field by Systematic Search and Genetic Algorithms. J. Comput. Chem. 2001, 22, 1219–1228. [Google Scholar]
- Henriksen N. M.; Roe D. R.; Cheatham T. E. Reliable Oligonucleotide Conformational Ensemble Generation in Explicit Solvent for Force Field Assessment Using Reservoir Replica Exchange Molecular Dynamics Simulations. J. Phys. Chem. B 2013, 117, 4014–4027. [DOI] [PMC free article] [PubMed] [Google Scholar]
- Ryckaert J.-P.; Ciccotti G.; Berendsen H. J. Numerical Integration of the Cartesian Equations of Motion of a System with Constraints: Molecular Dynamics of n-Alkanes. J. Comput. Phys. 1977, 23, 327–341. [Google Scholar]
- Miyamoto S.; Kollman P. A. Settle: An Analytical Version of the SHAKE and RATTLE Algorithm for Rigid Water Models. J. Comput. Chem. 1992, 13, 952–962. [Google Scholar]
- Cheng X.; Cui G.; Hornak V.; Simmerling C. Modified Replica Exchange Simulation Methods for Local Structure Refinement. J. Phys. Chem. B 2005, 109, 8220–8230. [DOI] [PMC free article] [PubMed] [Google Scholar]
- Marino J. P.; Schwalbe H.; Griesinger C. J-Coupling Restraints in RNA Structure Determination. Acc. Chem. Res. 1999, 32, 614–623. [Google Scholar]
- Wijmenga S. S.; van Buuren B. N. The use of {NMR} Methods for Conformational Studies of Nucleic Acids. Prog. Nucl. Magn. Reson. Spectrosc. 1998, 32, 287–387. [Google Scholar]
- Leonard G. A.; Mcauleyhecht K. E.; Ebel S.; Lough D. M.; Brown T.; Hunter W. N. Crystal and Molecular Structure of r(CGCGAAUUAGCG): an RNA Duplex Containing Two G(anti) A(anti) Base Pairs. Structure 1994, 2, 483–494. [DOI] [PubMed] [Google Scholar]
- Klosterman P. S.; Shah S. A.; Steitz T. A. Crystal Structures of Two Plasmid Copy Control Related RNA Duplexes: An 18 Base Pair Duplex at 1.20 Å Resolution and a 19 Base Pair Duplex at 1.55 ÅResolution. Biochemistry 1999, 38, 14784–14792. [DOI] [PubMed] [Google Scholar]
- Kiliszek A.; Kierzek R.; Krzyzosiak W. J.; Rypniewski W. Atomic Resolution Structure of CAG RNA Repeats: Structural Insights and Implications for the Trinucleotide Repeat Expansion Diseases. Nucleic Acids Res. 2010, 38, 8370–8376. [DOI] [PMC free article] [PubMed] [Google Scholar]
- Mooers B. H. M.; Singh A. The Crystal Structure of an oligo(U): pre-mRNA Duplex from a Trypanosome RNA Editing Substrate. RNA 2011, 17, 1870–1883. [DOI] [PMC free article] [PubMed] [Google Scholar]
- Altis A.; Nguyen P. H.; Hegger R.; Stock G. Dihedral Angle Principal Component Analysis of Molecular Dynamics Simulations. J. Chem. Phys. 2007, 126, 244111. [DOI] [PubMed] [Google Scholar]
- Šponer J.; Leszczyński J.; Hobza P. Nature of Nucleic Acid-Base Stacking: Nonempirical ab initio and Empirical Potential Characterization of 10 Stacked Base Dimers. Comparison of Stacked and H-bonded Base Pairs. J. Phys. Chem. 1996, 100, 5590–5596. [Google Scholar]
- Morgado C. A.; Jurečka P.; Svozil D.; Hobza P.; Šponer J. Reference MP2/CBS and CCSD(T) Quantum-Chemical Calculations on Stacked Adenine dimers. Comparison with DFT-D, MP2.5, SCS(MI)-MP2, M06-2X, CBS(SCS-D) and Force Field Descriptions. Phys. Chem. Chem. Phys. 2010, 12, 3522–3534. [DOI] [PubMed] [Google Scholar]
- Svozil D.; Hobza P.; Šponer J. Comparison of Intrinsic Stacking Energies of Ten Unique Dinucleotide Steps in A-RNA and B-DNA Duplexes. Can We Determine Correct Order of Stability by Quantum-Chemical Calculations?. J. Phys. Chem. B 2010, 114, 1191–1203. [DOI] [PubMed] [Google Scholar]
- Chen A. A.; García A. E. High-Resolution Reversible Folding of Hyperstable RNA Tetraloops Using Molecular Dynamics Simulations. Proc. Natl. Acad. Sci. U.S.A. 2013, 110, 16820–16825. [DOI] [PMC free article] [PubMed] [Google Scholar]
Associated Data
This section collects any data citations, data availability statements, or supplementary materials included in this article.