Abstract
Background
The purpose of this study was to synthesize and evaluate hyperbranched cationic glycogen derivatives as an efficient nonviral gene-delivery vector.
Methods
A series of hyperbranched cationic glycogen derivatives conjugated with 3-(dimethylamino)-1-propylamine (DMAPA-Glyp) and 1-(2-aminoethyl) piperazine (AEPZ-Glyp) residues were synthesized and characterized by Fourier-transform infrared and hydrogen-1 nuclear magnetic resonance spectroscopy. Their buffer capacity was assessed by acid–base titration in aqueous NaCl solution. Plasmid deoxyribonucleic acid (pDNA) condensation ability and protection against DNase I degradation of the glycogen derivatives were assessed using agarose gel electrophoresis. The zeta potentials and particle sizes of the glycogen derivative/pDNA complexes were measured, and the images of the complexes were observed using atomic force microscopy. Blood compatibility and cytotoxicity were evaluated by hemolysis assay and MTT (3-[4,5-dimethylthiazol-2-yl]-2,5-diphenyltetrazolium bromide) assay, respectively. pDNA transfection efficiency mediated by the cationic glycogen derivatives was evaluated by flow cytometry and fluorescence microscopy in the 293T (human embryonic kidney) and the CNE2 (human nasopharyngeal carcinoma) cell lines. In vivo delivery of pDNA in model animals (Sprague Dawley rats) was evaluated to identify the safety and transfection efficiency.
Results
The hyperbranched cationic glycogen derivatives conjugated with DMAPA and AEPZ residues were synthesized. They exhibited better blood compatibility and lower cytotoxicity when compared to branched polyethyleneimine (bPEI). They were able to bind and condense pDNA to form the complexes of 100–250 nm in size. The transfection efficiency of the DMAPA-Glyp/pDNA complexes was higher than those of the AEPZ-Glyp/pDNA complexes in both the 293T and CNE2 cells, and almost equal to those of bPEI. Furthermore, pDNA could be more safely delivered to the blood vessels in brain tissue of Sprague Dawley rats by the DMAPA-Glyp derivatives, and then expressed as green fluorescence protein, compared with the control group.
Conclusion
The hyperbranched cationic glycogen derivatives, especially the DMAPA-Glyp derivatives, showed high gene-transfection efficiency, good blood compatibility, and low cyto toxicity when transfected in vitro and in vivo, which are novel potential nonviral gene vectors.
Keywords: glycogen, blood compatibility, cytotoxicity, gene delivery
Introduction
Gene therapy is considered a promising method to cure various diseases, such as cancer, diabetes, and genetic and autoimmune diseases.1 Although significant advances have been made in this research area, progress has been limited by the difficulties associated with delivery of negatively charged gene molecules into cells, because of their bulky volume and repulsion by the cell membranes. Furthermore, gene molecules are readily degraded by nuclease enzymes in the blood and cells. With this in mind, successful gene therapy would rely heavily on the development of effective gene-delivery vectors with high transfection efficiency and minimal cytotoxicity.2 Nonviral gene-delivery vectors, especially cationic polymers and liposomes, have attracted much attention in gene therapy. Recent work has established that the architecture of cationic polymers affects the stability, delivery, and transfection efficiency of their complexes with deoxyribonucleic acid (DNA).3–8 In contrast to linear cationic polymers, hyperbranched cationic polymers exhibit higher levels of gene expression, probably because of the following two factors: 1) they present compact and globular structures in combination with a significant number and variety of different amine groups, which are advantageous for the binding and condensation of DNA into compact particles, resulting in improved protection and endocytosis of DNA;4–7 and 2) they exhibit better proton-buffer capacity, which is beneficial for the escape of DNA from endosomes.4,8 Synthetic hyperbranched cationic polymers, however, such as branched polyethyleneimine (bPEI) and poly(amidoamine) (PAMAM) dendrimers, are still associated with cytotoxicity, biocompatibility, and biodegradability issues, which need to be overcome to allow for in vivo application.9,10
Natural polysaccharides, due to their outstanding nontoxicity, good biocompatibility and biodegradability, and molecular diversity for chemical modification, have received increasing attention as gene-delivery vectors.11 Following amination, various cationized polysaccharide derivatives have been designed and synthesized as gene-delivery vectors, with high transfection efficiency.3,11–18 Glycogen is a storage form of glucose that occurs predominantly in the liver and skeletal muscles of mammalian and shellfish species.19 It is a natural hyperbranched polysaccharide with high weight-average molecular weight: about 106–107 g/mol.20,21 The individual linear chains of glycogen are composed of between ten and 14 glucose residues on average, with approximately one branching point for every ten glucose residues.19 Glycogen consists of a protein core and approximately 30,000 glucose units forming the branch-on-branch topological structure.22 Further studies have shown that glycogen exhibits a spherical and particular compact conformation with densely branched chains in aqueous solutions.20
Since glycogen comes from animals, good biocompatibility of glycogen derivatives is anticipated, which will be advantageous for gene therapy, such as for ischemic stroke. In this work, hyperbranched cationic glycogen derivatives conjugated with 3-(dimethylamino)-1-propylamine (DMAPA) and 1-(2-aminoethyl) piperazine (AEPZ) residues were synthesized (Figure 1), and evaluated for their potential as nonviral gene-delivery vectors. The formation process of cationic glycogen derivative/plasmid DNA (pDNA) complexes was characterized using agarose gel electrophoresis, zeta potential analysis, and atomic force microscopy (AFM). Blood compatibility and cytotoxicity were evaluated using the hemolysis assay and the 3-(4,5-dimethylthiazol-2-yl)-2,5-diphenyltetrazolium bromide (MTT) assay, respectively. pDNA transfection efficiency mediated by the cationic glycogen derivatives was evaluated by flow cytometry and fluorescence microscopy in the 293T (human embryonic kidney) and the CNE2 (human nasopharyngeal carcinoma) cell lines. In vivo delivery of pDNA in model animals (Sprague Dawley rats) was evaluated to identify safety and transfection efficiency.
Figure 1.
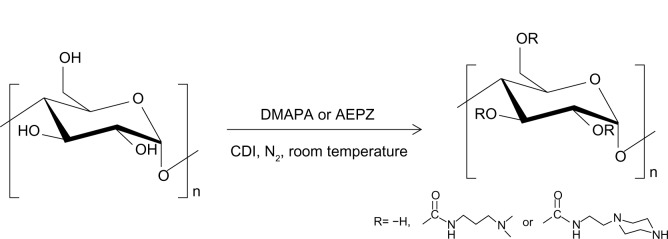
Synthesis of the hyperbranched cationic glycogen derivatives conjugated with 3-(dimethylamino)-1-propylamine (DMAPA) and 1-(2-aminoethyl) piperazine (AEPZ) residues.
Abbreviation: cDI, N,N’-carbonyldiimidazole.
Materials and methods
Materials
Glycogen (from oysters), Triton X-100, ethidium bromide, DNase I, MTT, Hoechst 3334, and bPEI (25 kDa) were purchased from Sigma-Aldrich (St Louis, MO, USA). N,N′-carbonyldiimidazole (CDI), DMAPA, AEPZ, and dimethyl sulfoxide (DMSO) were acquired from Aladdin Reagent (Shanghai, People’s Republic of China). DMSO was dried for 1 week prior to use by soaking in molecular sieves and calcium hydride. Fetal bovine serum (FBS), Dulbecco’s Modified Eagle’s Medium (DMEM), penicillin-streptomycin, and trypsin were purchased from Life Technologies (Carlsbad CA, USA). The reporter pDNA, plasmid enhanced green fuorescent protein (GFP)-N1 (4.7 kb), was supplied by Promega (Fitchburg, WI, USA). All of the other reagents were purchased as analytical grade and used without further purification.
Synthesis and characterization of hyperbranched cationic glycogen derivatives
DMAPA and AEPZ were introduced to the hydroxyl groups of glycogen according to the CDI activation method.3,12 Glycogen (0.62 mmol glucose units, 0.1000 g) was dissolved in 10 mL of anhydrous DMSO, and subsequently activated by the addition of CDI (5.58 mmol, 0.9045 g). The resulting mixture was then stirred for 1 hour in a nitrogen atmosphere at room temperature. DMAPA or AEPZ was added to the glycogen reaction solution according to the listed amounts (Table 1). The reaction was allowed to proceed for 24 hours in a nitrogen atmosphere at room temperature. The reaction solution was then dialyzed against the distilled water in a dialysis bag (molecular weight cutoff 14,000) for 3 days and lyophilized to yield the solid products, which were subsequently named DMAPA-Glyp and AEPZ-Glyp.
Table 1.
Amounts of added oligoamines for synthesis of the cationic glycogen derivatives and their degrees of substitution
| Samplea | DMAPA (mmol, g) | AEPZ (mmol, g) | DSb |
|---|---|---|---|
| DMAPA-Glyp-0.6 | 3.1, 0.3168 | – | 0.6 |
| DMAPA-Glyp-1.5 | 6.2, 0.6335 | – | 1.5 |
| DMAPA-Glyp-2.1 | 18.6, 1.9005 | – | 2.1 |
| DMAPA-Glyp-2.5 | 27.9, 2.8508 | – | 2.5 |
| DMAPA-Glyp-2.8 | 37.2, 3.8011 | – | 2.8 |
| AEPZ-Glyp-0.25 | – | 6.2, 0.8024 | 0.25 |
| AEPZ-Glyp-0.29 | – | 12.4, 1.6049 | 0.29 |
| AEPZ-Glyp-0.35 | – | 22.1, 2.857 | 0.35 |
Notes:
The numbers following DMAPA-Glyp and AEPZ-Glyp are the DS values
degree of substitution.
Abbreviations: DMAPA, 3-(dimethylamino)-1-propylamine; AEPZ, 1-(2-aminoethyl) piperazine; Glyp, glycogen; DS, degree of substitution.
Fourier-transform infrared (FTIR) measurements were performed with a Nicolet/Nexus 670 FTIR analyzer (Thermo Fisher Scientific, Waltham, MA, USA) at a resolution of 4 cm−1 using the KBr method. Hydrogen-1 nuclear magnetic resonance (1H NMR) analysis was carried out on a Varian Mercury Plus 300 NMR spectrometer (Varian, Palo Alto, CA, USA) at 35°C using deuterated water as the solvent. The signal at δ4.67 ppm for single-deuterated water was used as the internal standard.23 The degree of substitution (DS) of the oligoamine residues on the glycogen, defined as the number of oligoamine residues per glucose unit of glycogen, was determined by the integration of the resonance signal for the protons of the oligoamine residues and H1 of the glycogen.
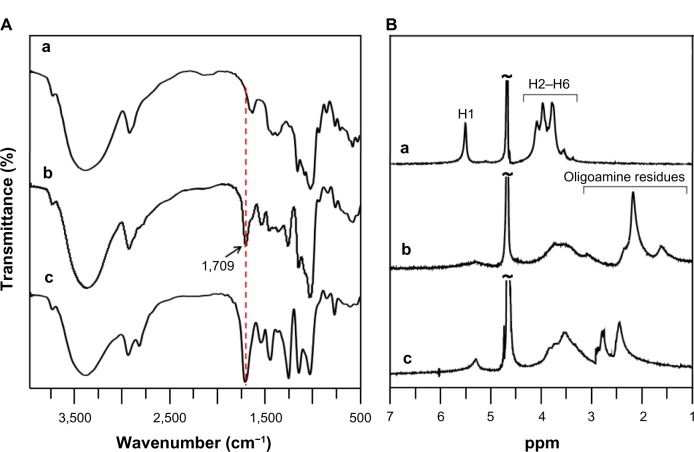
DMAPA-Glyp: FTIR: 3,325 cm−1 (ν−OH), 2,819 and 2,776 cm−1 1,709, 1,546 and 1,265 cm−1 (ν−C=O, δ−NH–, and ν−C–N of carbamate groups), 1,459 cm−1 (deformation vibration of −CH2– and −CH3 groups of DMAPA residues), 1,153 and 1,036 cm−1 (ν−C–O–C– of glycogen); 1H NMR (D2O, ppm): 5.30 (glucose unit, H1), 4.50–03.50 (glucose unit, H2–H6), 3.10 (−CONH–CH2–), 2.34 (−CH2–N<), 2.18 (−N[CH3]2), and 1.63 (−CH2–).18 DS =0.6, 1.5, 2.1, 2.5, and 2.8.
AEPZ-Glyp: FTIR: 3,390 cm−1 (ν−OH, ν−NH–), 2,824 cm−1 , 1,709, 1,542, and 1,252 cm−1 (ν−C=O, δ−NH– and ν−C–N of carbamate groups), 1,446 cm−1 (deformation vibration of −CH2– groups of AEPZ residue), 1,144 and 1,027 cm−1 (ν−C–O–C– of glycogen); 1H NMR (D2O, ppm): 5.30 (glucose unit, H1), 4.50–3.50 (glucose unit, H2–H6), 2.80 (−CH2–N< of ring), and 2.47 (−CH2–NH– of ring).24 DS =0.25, 0.29, and 0.35.
Hemolysis assay
The hemolytic activities of the cationic glycogen derivatives and bPEI were investigated according to a method previously published in the literature.25 Sprague Dawley (SD) rats (weighing between 100 and 120 g) were provided by the Center of Experimental Animals of Sun Yat-sen University and approved by the University Animal Study Committee. The erythrocytes were isolated from the blood of the SD rats by centrifugation at 111.8 × g for 5 minutes and were washed in 0.9% NaCl solution until the supernatant was clear. Then, the erythrocytes were diluted in a 0.9% NaCl solution to 5×10⁹ cells/mL. The obtained suspension (100 μL) was incubated with 1 mL of the solution of glycogen derivatives and bPEI at different concentrations (16–500 μg/mL) at 37°C for 90 minutes. Following centrifugation at 111.8 × g for 5 minutes, the supernatant was applied to a 96-well plate, and hemoglobin release was measured as the absorbance at 560 nm using a microplate reader (Wellscan MK3; Labsystems Dragon, Helsinki, Finland). A negative control solution (0% hemolysis) was prepared by adding a 0.9% NaCl solution to the erythrocyte suspension, and a positive control solution (100% hemolysis) was prepared by adding 10% Triton X-100 to the erythrocyte suspension. The hemolysis rate was calculated according to the following equation:
| (1) |
where A, A0, and A100 represent the absorbance values of the hemoglobin released solution incubated with the polymers and the values of the negative and positive control solutions, respectively. All of the samples were analyzed in triplicate. The morphology of the erythrocytes was observed on an Olympus (Tokyo, Japan) IX71 microscope.
Buffer capacity
The buffer capacity of the cationic glycogen derivatives and bPEI was determined by acid–base titration in accordance with procedures previously published in the literature.4,16 Each sample solution (0.2 mg/mL) was prepared in 30 mL of an aqueous NaCl solution (0.15 mol/mL). The sample solutions were initially titrated with a 0.1 mol/mL NaOH solution to a pH of 10.0. Known volumes of a 0.1 mol/mL HCl solution were then added to the mixture to give solutions with different pH values, which were measured using a microprocessor pH meter (Shanghai Shengke Instrument and Equipment, Shanghai, People’s Republic of China).
Preparation of the cationic glycogen derivative/pDNA complexes
The cationic glycogen derivatives (10 mg) were dissolved in phosphate-buffered saline (PBS; pH 7.4) solution at a concentration of 2 mg/mL and then filtered through a membrane filter (nominal pore size of 0.22 μm). A stock solution of pDNA (250 ng/μL) was prepared in PBS (pH 7.4). A portion of pDNA solution (4 μL) was then added to the glycogen derivative solutions at different glycogen derivative/pDNA weight ratios. The resulting mixtures were then gently agitated for 5 seconds on a vortex agitator before being incubated at 37°C for 30 minutes prior to use.
Agarose gel electrophoresis
Electrophoresis was performed to assess pDNA-condensation ability of the glycogen derivatives and protection against DNase I degradation. pDNA was visualized and photographed using a Gel Doc XR gel image machine (Syngene, Cambridge, UK).
pDNA condensation ability of the glycogen derivatives
Twenty microliters of the glycogen derivative/pDNA complexes with different glycogen derivative/pDNA weight ratios in the range of 0.1–20 were loaded onto 0.8% agarose gels with ethidium bromide (0.1 μg/mL) and run with Tris-acetate running buffer at 90 V for 1 hour. DNA retardation was then observed by agarose gel electrophoresis.
Protection against DNase I degradation
DNase I (10 units, 2 μL) was added to 1 μg of naked pDNA or glycogen derivative/pDNA complexes (with weight ratios of 2, 5, 10, and 20) and incubated at 37°C with shaking at 100 rpm for 30 minutes. The DNase I degradation process was then stopped by the addition of an ethylenediaminetetraacetic acid (EDTA) solution (4 μL, 250 mM), and pDNA was released following incubation with a heparin solution (5 μL, 0.1%, w/v) at 37°C with shaking at 100 rpm over a period of 3.5 hours. The samples were loaded onto the gel and electrophoresed to examine the integrity of pDNA.
Measurements of zeta potentials and particle sizes
Solutions of glycogen derivative/DNA complexes with different weight ratios (2 mL) were prepared in double-distilled water to a final concentration of 1.0 μg/mL for pDNA. The sample mixtures were gently agitated on a vortex agitator for 5 seconds before being incubated at 37°C for 30 minutes, and then filtered through a membrane filter (nominal pore size of 0.45 μm). The particle sizes and zeta potentials of the glycogen derivative/pDNA complexes were measured using ZetaPALS (Brookhaven Instruments, Holtsville, NY, USA) at 25°C with a 90° scattering angle. All of the measurements were performed in triplicate.
AFM observations
One milliliter of solutions of pDNA and the DMAPA-Glyp-2.8/pDNA complex (with weight ratios of 0.3, 0.5, 2, and 20) were prepared in the AFM buffer to a final concentration of 2.5 μg/mL for pDNA. The AFM buffer included Tris-EDTA buffer (10 mmol/L Tris-HCl and 1 mmol/L EDTA, pH 8.0) and 5 mmol/L MgCl2. To successfully image pDNA molecules and investigate the interactions between pDNA and the DMAPA-Glyp-2.8 derivative, pDNA molecules were extended following the methods used in a previous work.26 The sample solution (20 μL) was dropped on a freshly cleaved mica surface and left to stand for 5 minutes. Then, the mica surface was tilted at 45° from level, allowing the solution to slide slowly to the bottom edge. The treated mica surface was washed with distilled water eight times by the same method. The distilled water was then evaporated at room temperature under vacuum for 2 weeks. AFM images of 256×256 pixels were performed on a MultiMode 8 atomic force microscope (Bruker Optics, Billerica, MA, USA) in tapping mode, and the images were analyzed using NanoScope software (Bruker). Silicon tips (TESP; Bruker) were used with a force constant of 40 N/m.
Cytotoxicity assay
Cells from the 293T and CNE2 cell lines were seeded in 96-well plates at a density of 1×10⁴ cells/well in 200 μL DMEM containing 10% FBS and subsequently cultured at 37°C for 24 hours. The medium was then replaced with a fresh serum-free medium, and the solutions of the glycogen derivatives and bPEI at different concentrations were added to the culture medium of each well to assess their cytotoxicity. In addition, 200 μL of the glycogen derivative/pDNA complexes with different weight ratios were added for the cytotoxicity assay. The content of pDNA was set at 0.2 μg for each complex. The bPEI and the bPEI/pDNA complex were used as the positive controls. After the cells were incubated for an additional 24 hours, 20 μL of MTT (5 mg/mL) in PBS (pH 7.4) was added to each well to give a final concentration of 0.5 mg/mL. The cells were further incubated for 4 hours, and DMSO (150 μL) was then added to dissolve the formazan crystals formed in the live cells. Using a spectrometer, the absorbance values of the samples were measured at 560 nm. Cell viability was then calculated according to the following equation:
| (2) |
where A560–sample and A560–control were obtained in the presence and absence of the glycogen derivatives, respectively. All of the experiments were conducted five times.
In vitro transfection by flow cytometry and fluorescence microscopy
Cells from the 293T and CNE2 cell lines were plated in 24-well plates at a density of 1×10⁵ cells/well in 200 μL of DMEM containing 10% FBS and subsequently cultured at 37°C for 24 hours. The media were then replaced with serum-free media containing the glycogen derivative/pDNA complexes and the bPEI/pDNA complex at different weight ratios, as well as 2 μg of pDNA. The bPEI/pDNA complex was used as the positive control, whereas the naked pDNA was used as the negative control. Following a 4-hour period of incubation, the serum-free media were changed with fresh media containing 10% serum. Following a further 36-hour period of incubation, the cells were directly observed on a DMI4000B fluorescence microscope (Leica Microsystems, Wetzlar, Germany). The transfected cells were then washed once with PBS (pH 7.4) and detached with 0.25% trypsin. Using an FACSAria flow cytometer (BD Biosciences, San Jose, CA, USA), the gene-transfection efficiency was evaluated by scoring the percentage of cells expressing GFP. All of the experiments were conducted in triplicate.
Observation of intracellularly expressed GFP
The glycogen derivative/pDNA complexes (w/w =20) were incubated with cells from the 293T cell line for 4 hours under the conditions mentioned earlier. Following a further incubation period of 36 hours, the cells were washed with PBS (pH 7.4) before being fixed in 4% paraformaldehyde for 30 minutes. For the labeling of the nucleus, the fixed cells were washed three times with PBS (pH 7.4) before being incubated with Hoechst 33342 for 10 minutes. The cells were then washed three times with PBS (pH 7.4), and the intracellular expression of GFP in the cells was observed with an LSM710 confocal microscope (Carl Zeiss Meditec, Jena, Germany) equipped with argon (488 nm) and He–Ne (543 nm) lasers.
In vivo evaluation of GFP expression
SD rats (weighing 200–250 g) were obtained from the Center of Experimental Animals of Sun Yat-sen University. All procedures were approved by the Animal Care and Use Committee of Sun Yat-sen University, and in accordance with National Institutes of Health’s Guide for the Care and Use of Laboratory Animals. The SD rats were anesthetized by intramuscular injection of a 10% chloral hydrate solution. Then, an animal model of middle cerebral artery occlusion (MCAO) was established. A solution of the DMAPA-Glyp-2.5/pDNA complex (0.6 mL, w/w =20, a final concentration of 50 μg/mL for pDNA) was injected into the carotid by the improved catheter method in the experimental groups (n=3). The SD rats with MCAO were injected with saline as the control group (n=3). On the fifth day, the SD rats were killed with a lethal dose of chloral hydrate, and were transcardially perfused with a saline solution, followed by adding 400 mL paraformaldehyde (4%) in 0.1 mol/L PBS. The brain tissues were then taken out, fixed overnight in the paraformaldehyde solution, and cryoprotected in 30% sucrose. After they were embedded in an optimum cutting temperature compound, the brain tissues were cut into cryosections of 4 μm thickness on a cryostat (Microtome Cryostat HM 550; Microm International, Walldorf, Germany). The cryosections were washed three times with PBS before being stained with Hoechst 33342 for 10 minutes, and finally the expression of GFP in blood vessels of brain tissue was observed with the Zeiss LSM710 confocal microscope.
Statistical analysis
Statistical analyses were performed by one-factor analysis of variance (SPSS version 13.0; IBM, Armonk, NY, USA). The results were expressed as means ± standard deviation, with a value of P<0.05 being considered statistically significant.
Results and discussion
Synthesis of hyperbranched cationic glycogen derivatives
To form complexes with negatively charged pDNA, the cationic glycogen derivatives were synthesized under mild conditions by conjugation of DMAPA or AEPZ with the hydroxyl groups of glycogen using the conventional CDI activation method at room temperature.3,12 From the FTIR spectra shown in Figure 2A, it was clear that a strong absorption peak of glycogen derivatives at 1,709 cm−1 was different from that of glycogen, which could be assigned to the –C=O vibration of the carbamate groups.18 Furthermore, the absorption peaks at 1,540–1,550 and 1,250–1,270 cm−1 were attributed to the −NH– and C–N vibrations of the carbamate groups, respectively.18 These results indicated that the DMAPA or AEPZ residues were conjugated to glycogen with carbamate linkages. In the 1H NMR spectra of DMAPA-Glyp and AEPZ-Glyp derivatives (Figure 2B), the proton resonance peaks at 1.0–3.2 ppm provided further confirmation that the oligoamine residues were conjugated with glycogen.18,24 The DS values of the AEPZ-Glyp derivatives, however, were lower than those of the DMAPA-Glyp derivatives (Table 1), because of the steric hindrance between the AEPZ residues and the glucose units of glycogen.
Figure 2.
(A) Fourier-transform infrared spectra and (B) hydrogen-1 nuclear magnetic resonance spectra of glycogen and its derivatives: glycogen (a), DMAPA-Glyp-0.6 (b), and AEPZ-Glyp-0.35 (c).
Abbreviations: DMAPA, 3-(dimethylamino)-1-propylamine; AEPZ, 1-(2-aminoethyl) piperazine; Glyp, glycogen.
Blood compatibility analysis
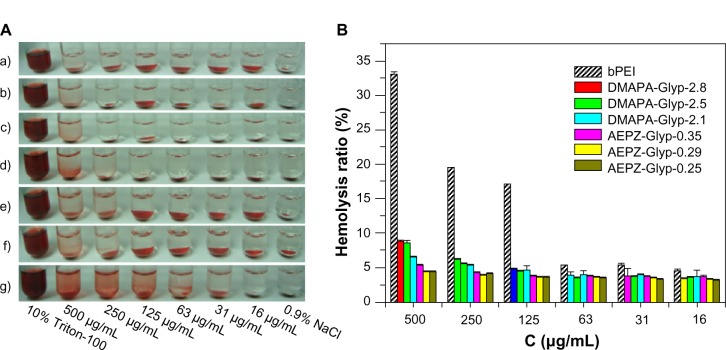
The nonspecific interactions of the cationic polymers with components in the blood could severely diminish the half-life and targetability of complexes, as well as the reproducibility of such therapies.27 The poor stability of these delivery vehicles in the blood has therefore been considered to be one of the serious limitations in the therapeutic application of cationic polymers.27,28 As shown in Figure 3A (a–f), the hemolytic phenomenon was only observed at high concentrations of the glycogen derivatives (≥250 μg/mL), after they were incubated with the erythrocytes. The hemolytic phenomenon became more pronounced, however, in the presence of bPEI (Figure 3A [g]), mainly because of the erythrocyte membrane disruption. The blood compatibility of the cationic glycogen derivatives was further assessed by spectrophotometric measurement of hemoglobin release from the erythrocytes following the polymer treatment. The result indicated that the hemolysis rates for all of the glycogen derivatives were less than 9%, suggesting low hemolytic activity, because of the good biocompatibility of glycogen (Figure 3B). In addition, the hemolysis rates of both glycogen derivatives were similar at the lower concentration (≤63 μg/mL). At the higher concentration (≥125 μg/mL), the hemolysis rates of the DMAPA-Glyp derivative groups were gradually higher than those of the AEPZ-Glyp derivative groups, and the hemolysis rates generally increased with increasing DS values. This implied that blood compatibility was related to the type and content of the oligoamine residues conjugated to each of the different glycogen derivatives. The AEPZ-Glyp derivatives, which were composed of a low content of ring oligoamine residues, exhibited better blood compatibility than the DMAPA-Glyp derivatives, which were composed of a high content of linear high-density tertiary amines. In contrast, bPEI caused serious hemolysis in a _concentration-dependent manner. The majority of erythrocytes appeared as normal cells in the shape of biconcave discs after they were incubated with the glycogen derivatives, which showed no obvious change compared with those in a 0.9% NaCl solution (Figure S1). However, the erythrocytes incubated with bPEI deformed and aggregated because of stronger interactions between the erythrocytes and bPEI. These results indicated that the blood compatibility of the glycogen derivatives was better than that of bPEI.
Figure 3.
(A) Visual observation of hemolysis caused by AEPZ-Glyp-0.25 (a), AEPZ-Glyp-0.29 (b), AEPZ-Glyp-0.35 (c), DMAPA-Glyp-2.1 (d), DMAPA-Glyp-2.5 (e), DMAPA-Glyp-2.8 (f), and bPEI (g). (B) Change of hemolysis rate with the concentration of glycogen derivatives and bPEI (n=3).
Abbreviations: DMAPA, 3-(dimethylamino)-1-propylamine; AEPZ, 1-(2-aminoethyl) piperazine; Glyp, glycogen; bPEI, branched polyethyleneimine; C, concentration.
Buffer capacity
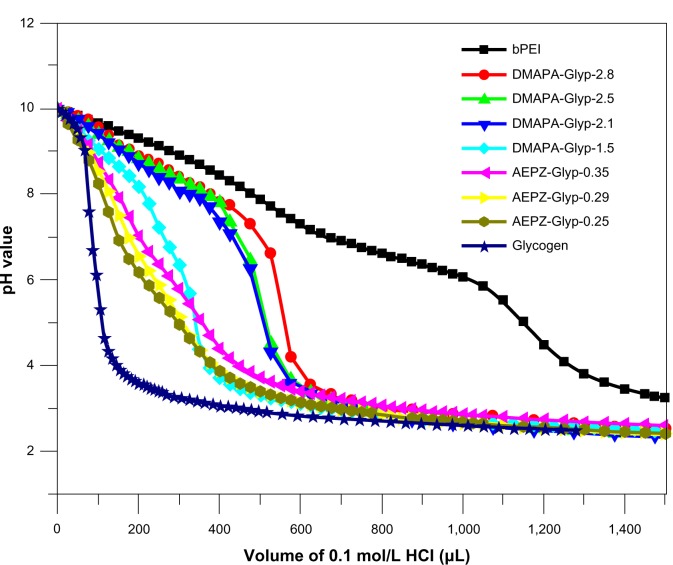
PEI and PAMAM are known as “proton-sponge” polymers, which have high buffer capacity over a broad pH value. Therefore, they can lead an increase of swelling of endocytic vesicles to help DNA complexes escape into the cytoplasm, resulting in relatively high gene-transfer activity.29,30 This unique property is due to a large number of secondary and tertiary amines of the polymers.29,30 The buffer capacity of cationic glycogen derivatives in aqueous NaCl solution was assessed by acid–base titration. As shown in Figure 4, the buffer capability of glycogen was improved after being conjugated with oligoamine residues. The DMAPA-Glyp derivatives (DS > 2.0) exhibited significantly higher buffer capability than the AEPZ-Glyp and DMAPA-Glyp-1.5 derivatives, owing to their different type and content of oligoamine residues. However, the glycogen derivatives exhibited lower buffer capability than bPEI, due to the presence of relatively fewer amine groups on the derivatives.
Figure 4.
Acid–base titration profiles of cationic glycogen derivatives and bPEI in aqueous 0.15 mol/L NaCl solutions (sample solution, 0.2 mg/mL).
Abbreviations: DMAPA, 3-(dimethylamino)-1-propylamine; AEPZ, 1-(2-aminoethyl) piperazine; Glyp, glycogen; bPEI, branched polyethyleneimine.
Complex formation of cationic glycogen derivatives with pDNA
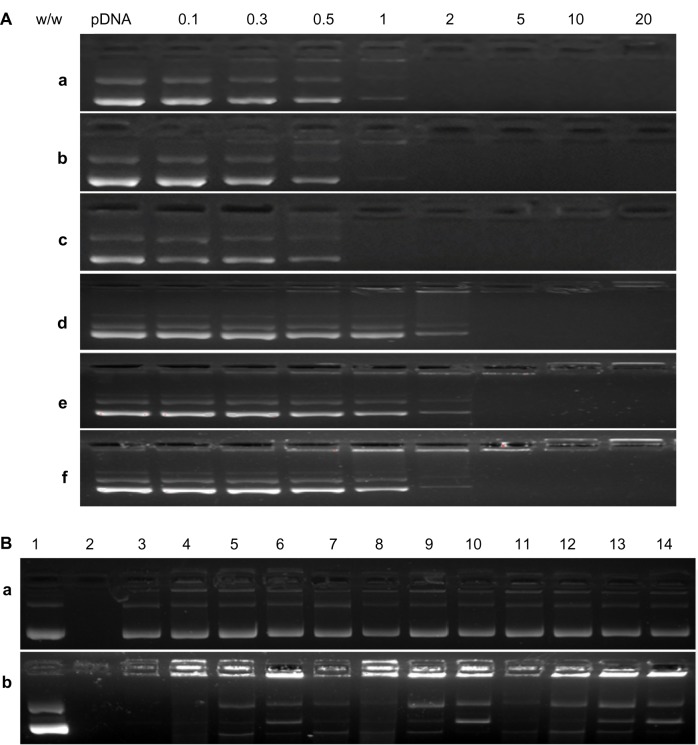
The formation of the cationic glycogen derivative/pDNA complexes was examined by agarose gel electrophoresis using pDNA as a control. As shown in Figure 5A, the migration of pDNA was retarded when the DMAPA-Glyp derivative/pDNA and the AEPZ-Glyp derivative/pDNA weight ratios exceeded 1 and 5, respectively. The result suggested that the glycogen derivatives possessed good pDNA-binding ability because of their cationic oligoamine residues. The higher binding ability of the DMAPA-Glyp derivatives with pDNA arises from their higher DS values, ie, more oligoamine residues are widely distributed in the DMAPA-Glyp derivatives compared with the AEPZ-Glyp derivatives.
Figure 5.
(A) Agarose gel electrophoresis retardation assay of glycogen derivative/pDNA complexes at different weight ratios: DMAPA-Glyp-2.1 (a), DMAPA-Glyp-2.5 (b), DMAPA-Glyp-2.8 (c), AEPZ-Glyp-0.25 (d), AEPZ-Glyp-0.29 (e), and AEPZ-Glyp-0.35 (f). (B) Protection and release assay of pDNA. Lane 1, naked pDNA; lane 2, naked pDNA digested by DNase I; lanes 3–14, glycogen derivative/pDNA complexes (w/w =2, 5, 10, and 20) digested by DNase I and treated with heparin solution (lanes a3–a6, DMAPA-Glyp-2.1; lanes a7–a10, DMAPA-Glyp-2.5; lanes a11–a14, DMAPA-Glyp-2.8; lanes b3–b6, AEPZ-Glyp-0.25; lanes b7–b10, AEPZ-Glyp-0.29; lanes b11–b14, AEPZ-Glyp-0.35).
Abbreviations: DMAPA, 3-(dimethylamino)-1-propylamine; AEPZ, 1-(2-aminoethyl) piperazine; Glyp, glycogen; pDNA, plasmid deoxyribonucleic acid.
We recently reported hyperbranched cationic amylopectin derivatives conjugated with the same content of DMAPA residues as the DMAPA-Glyp-2.8 derivative for gene delivery, named the DMAPA-Amp-2.8 derivative.18 It should be noted that the weight ratio of the DMAPA-Glyp-2.8 derivative/pDNA complex (at 1) was lower than that of the DMAPA-Amp-2.8 derivative/pDNA complex (at 5),18 when the migration of pDNA was completely retarded. In contrast to amylopectin, the fraction of branching units for glycogen is higher at 8%, whereas the value is 5%–6% for amylopectin.21 Therefore, the result may indicate that pDNA-binding and -condensation abilities are enhanced with the increase in the fraction of branching units of the hyperbranched polysaccharide derivatives, in agreement with the literature.4–7 This is closely related to their gene-delivery efficacy, which needs to be investigated in the future.
Protection of pDNA by the cationic glycogen derivatives
The protection effect of the complexes against DNA degradation by DNase I is shown in Figure 5B. While naked pDNA was completely digested (lane 2), the migration of pDNA was observed after the glycogen derivatives/pDNA complexes were digested by DNase I and treated with heparin solution, at weight ratios above 2 and 5 for the DMAPA-Glyp/pDNA and the AEPZ-Glyp/pDNA complexes, respectively (lanes 3–14). This demonstrated that the glycogen derivatives exhibited distinct protective effects against DNase I.
Analysis of zeta potentials and particle sizes
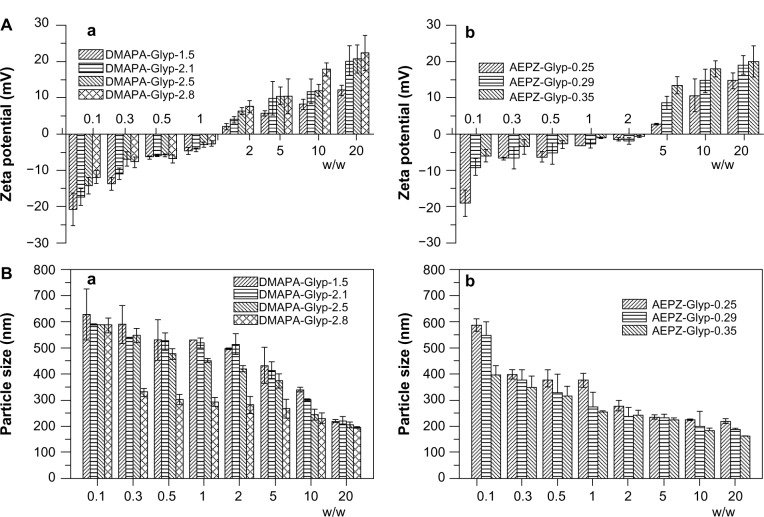
It has been reported that cationic polymers/DNA complexes with positive surface charge and sizes between 50 to several hundred nanometers would be suitable for the endocytosis of complexes and efficient gene delivery.16,29,31 As shown in Figure 6A, the zeta potential of the glycogen derivative/pDNA complexes increased with increasing weight ratios. After the complexes formed, their zeta potentials became positive, which is amenable to the effective condensation of DNA. For example, the zeta potential of the DMAPA-Glyp/pDNA complexes increased from 2 mV to 23 mV when the weight ratio increased from 2 to 20. In addition, the result revealed that the content and type content of the oligoamine residues of the cationic glycogen derivatives had a small effect on the zeta potential. The pDNA condensation of the glycogen derivatives was attributed to their cationic properties, of which zeta potentials were all in the range of 15–35 mV, and increased with increased DS values (Figure S2). As expected, the average particle size of the glycogen derivative/pDNA complexes decreased with increased weight ratios, ie, the complexes became progressively smaller during the pDNA-condensation process (Figure 6B). For example, the complexes condensed from about 600 nm (w/w =0.1) to 150–250 nm (w/w =20).
Figure 6.
(A) Zeta potential and (B) average particle size of glycogen derivative/pDNA complexes at various weight ratios: the DMAPA-Glyp/pDNA complexes (a), and the AEPZ-Glyp/pDNA complexes (n=3) (b).
Abbreviations: DMAPA, 3-(dimethylamino)-1-propylamine; AEPZ, 1-(2-aminoethyl) piperazine; Glyp, glycogen; pDNA, plasmid deoxyribonucleic acid.
Observation of complex-formation process by AFM
The process of DMAPA-Glyp-2.8 derivative/pDNA complex formation was observed by AFM (Figure 7). The extended pDNA molecules can be clearly seen in the AFM images of pDNA following the stretch orientation (Figure 7A), which matches the pDNA images reported in the literature.26 It was observed that the pDNA molecules gradually attached to the DMAPA-Glyp-2.8 derivative with increased weight ratio from 0.3 to 0.5 (Figure 7B and C). When the weight ratio exceeds 2, the DMAPA-Glyp-2.8 derivative can condense pDNA into global particles with size ranging from 90 to 140 nm (Figure 7D and E). These results further confirm that the DMAPA-Glyp-2.8 derivative and pDNA can form a condensed complex.
Figure 7.
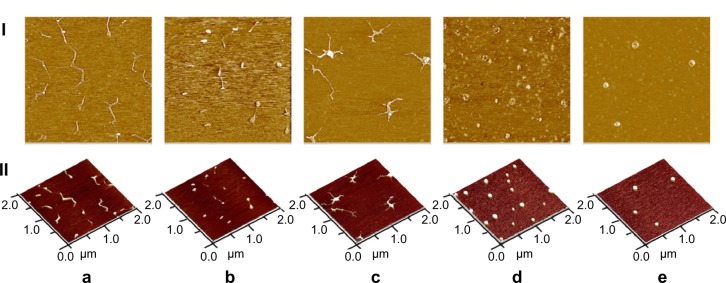
Atomic force microscopy images of (a) pDNA and the pDNA/DMAPA-Glyp-2.8 complex with different weight ratios: (b) w/w =0.3, (c) w/w =0.5, (d) w/w =2, and (e) w/w =20. I: Phase-mode images. Each image represents a 2×2 μm scan. II: Height-mode images.
Abbreviations: DMAPA 3-(dimethylamino)-1-propylamine; Glyp, glycogen; pDNA, plasmid deoxyribonucleic acid.
Cytotoxicity analysis
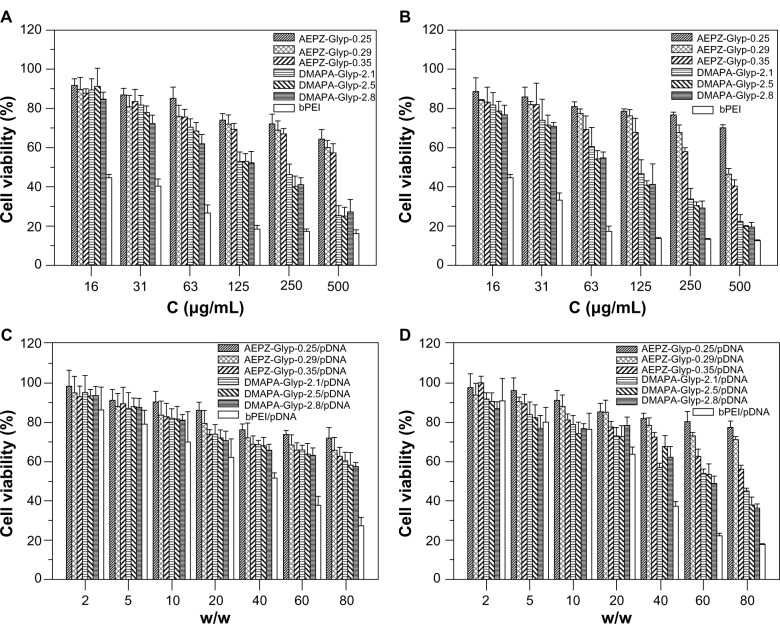
It is considered that cytotoxicity of cationic polymers is another important factor of biocompatibility together with blood compatibility.25 In vitro cytotoxicity of the glycogen derivatives and bPEI was thus assessed at concentrations ranging from 16 to 500 μg/mL by MTT assay in the 293T and CNE2 cells. As shown in Figure 8A and B, the cell viability of the AEPZ-Glyp derivatives was generally higher than that of DMAPA-Glyp, implying that cytotoxicity was related to the type and content of the oligoamine residues conjugated to the glycogen derivatives. However, the result also revealed that the cell viability of the glycogen derivatives was higher than that of bPEI, indicating the glycogen derivatives exhibited lower cytotoxicity. This difference could be attributed to the biocompatibility of glycogen.
Figure 8.
Viability of (A) 293T cells and (B) CNE2 cells incubated with the glycogen derivatives and bPEI at various concentrations for 24 hours (n=5), and viability of (C) 293T cells and (D) CNE2 cells incubated with the glycogen derivative/pDNA and bPEI/pDNA complexes at various weight ratios for 24 hours (n=5).
Abbreviations: bPEI, branched polyethyleneimine; pDNA, plasmid deoxyribonucleic acid; DMAPA, 3-(dimethylamino)-1-propylamine; AEPZ, 1-(2-aminoethyl) piperazine; Glyp, glycogen.
The cytotoxicity of the glycogen derivative/pDNA complexes with various weight ratios was further evaluated in the 293T and CNE2 cells by MTT assay. As a result of the lower cytotoxicity of the glycogen derivatives, the cell viability of the glycogen derivative/pDNA complexes was higher than that of the bPEI/pDNA complexes at weight ratios ranging from 2 to 80 (Figure 8C and D).
In vitro transfection of pDNA
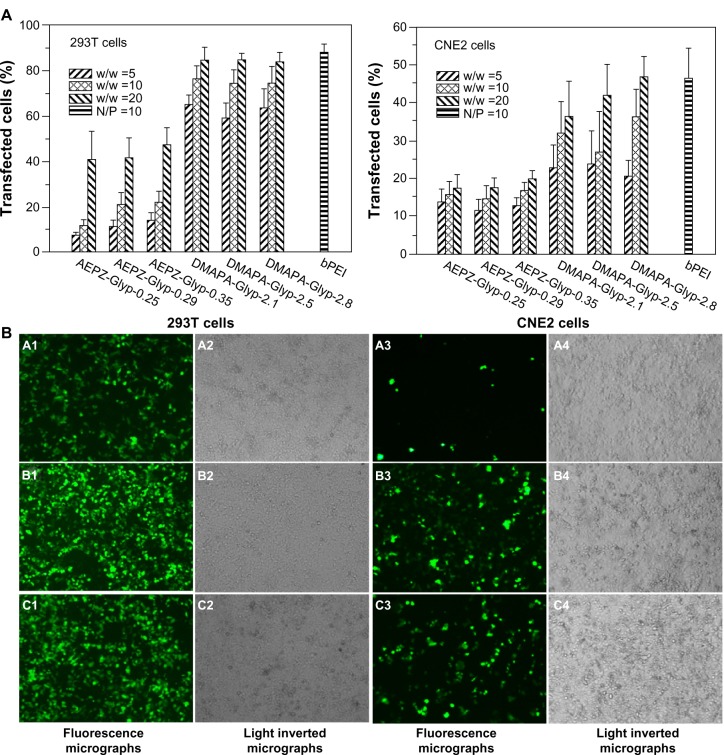
The gene-transfer capacity of the cationic glycogen derivatives was evaluated in the 293T and CNE2 cell lines. Transfection efficiency was quantitatively determined using flow cytometry to assess the actual percentage of GFP-expressing cells. According to previous work,29 the bPEI/pDNA complex (N/P =10, N/P ratio refers to the ratio of moles of the amine groups of bPEI to moles of phosphates of pDNA) was used as a control. As shown in Figure 9A, the transfection efficiency of the DMAPA-Glyp/pDNA complexes was significantly higher than that of the AEPZ-Glyp/pDNA complexes in both cells. Noticeably, the transfection efficiency of the DMAPA-Glyp-2.8/pDNA complex (w/w =20) was almost equal to that of the bPEI/pDNA complex. The high transfection efficiency of the DMAPA-Glyp derivatives is likely related to their good buffer capability and high pDNA-condensation ability. In addition, it was found that the gene-transfection efficiency of the cationic glycogen derivative/pDNA complexes was dependent on the weight-ratio values, the cell types, and the oligoamine residues of the glycogen derivatives. At the weight ratio of 5, the complexes exhibited low gene-transfer capacity in the two cell lines. However, the transfection efficiency of the complexes increased with increasing weight ratios. The gene-transfer capacity of the cationic glycogen derivatives in the 293T cells was higher than that observed in the CNE2 cells, attributed to distinct endocytosis ability of the 293T cells. The transfection of naked pDNA was less than 0.3% in the two cell lines, further confirming that the cationic glycogen derivatives have the capability to protect pDNA and improve expression levels of GFP.
Figure 9.
(A) Transfection efficiency of glycogen derivative/pDNA complexes at various weight ratios (w/w =5, 10, and 20) and the bPEI/pDNA complex (N/P =10) determined by flow cytometry in 293T cells and CNE2 cells (n=3). (B) Fluorescence micrographs and light-inverted micrographs of 293T cells and CNE2 cells transfected by the glycogen derivative/pDNA complexes (w/w =20): AEPZ-Glyp-0.35/pDNA (a), DMAPA-Glyp-2.8/pDNA (b), and bPEI/pDNA (N/P =10) (×100) (c).
Abbreviations: bPEI, branched polyethyleneimine; pDNA, plasmid deoxyribonucleic acid; N/P, N/P ratio refers to the ratio of moles of the amine groups of bPEI to moles of phosphates of pDNA; DMAPA, 3-(dimethylamino)-1-propylamine; AEPZ, 1-(2-aminoethyl) piperazine; Glyp, glycogen.
GFP-expressing cells were observed using an inverted fluorescence microscope to further visualize the transfection efficiency of the glycogen derivative/pDNA complexes (w/w =20). In comparison with the AEPZ-Glyp-0.35/pDNA group (Figure 9B [a1]), a strong green fluorescent signal was observed in 293T cells transfected with the complexes of DMAPA-Glyp-2.8/pDNA and bPEI/pDNA (9B [b1, c1]), further highlighting the high transfection efficiency found by flow cytometry. Additionally, the transfection efficiency of the glycogen derivatives was found to be higher in the 293T cells than in the CNE2 cells.
The expressed GFP was observed throughout the cytoplasm and nuclei of the 293T cells in the laser-scanning confocal images (Figure S3). The GFP fluorescence intensity in the cells incubated with the DMAPA-Glyp-2.8/pDNA complex was much stronger than that in the cells incubated with the AEPA-Glyp-0.35/pDNA complex, further confirming the higher gene-transfer efficiency of the DMAPA-Glyp-2.8/pDNA complex. In comparison, the nuclei became bright blue, shrank, and deformed following incubation of the cells with bPEI/pDNA, suggesting that apoptosis occurred as a consequence of the cytotoxicity of bPEI.
In vivo evaluation of GFP expression
All SD rats were still alive on the fifth day following injection of the DMAPA-Glyp-2.5/pDNA complex (Figure 10A), confirming the in vivo safety of the DMAPA-Glyp derivatives (n=3). The GFP expression in the blood vessels of the brain was then evaluated by laser-scanning confocal microscopy. As shown in Figure 10B, it was observed that the nuclei were stained blue, and a majority of GFP was expressed in cells of the vascular wall around blood vessels. These results indicated that the pDNA could be safely delivered to the cells of the vascular wall around brain blood vessels of SD rats by the DMAPA-Glyp derivatives, and then expressed as GFP. However, the green fluorescence was hardly observed in cells of the vascular wall around blood vessels in the control group (Figure 10C), confirming that the fluorescence was not the result of autofluorescence in tissue.
Figure 10.

(A) A Sprague Dawley rat on the fifth day following injection of the DMAPA-Glyp-2.5/pDNA complex (w/w =20). (B and C) Laser-scanning confocal images of brain cryosections of the rat, stained by Hoechst 33342 (×200). (B) The experimental group expressed green fluorescent protein (region 1, cells of vascular wall; region 2, cells of brain tissue); (C) the control group.
Abbreviations: DMAPA, 3-(dimethylamino)-1-propylamine; AEPZ, 1-(2-aminoethyl) piperazine; Glyp, glycogen.
Overall, the results of in vivo evaluations confirmed that the hyperbranched glycogen derivatives could transfect pDNA efficiently and express as GFP in the blood vessels of the brains of SD rats. The mechanism of gene transfection may be explained based on the literature.32,33 The DMAPA-Glyp derivatives could be able to bind and condense pDNA to form the positive complexes, and protect pDNA from degradation by nuclease. The complexes entered the endosomes through endocytosis, owing to the electrostatic attraction between the complexes and the cell membranes. With the proton-sponge effect, the complexes escaped from the endosomes. The pDNA was finally released inside the cytoplasm and expressed as GFP. Furthermore, hypoxia–ischemia could promote the opening of the blood–brain barrier tight junction and increase the permeability of the blood–brain barrier.34,35 Therefore, the mechanism of the expression of GFP may be due to two factors: electrostatic attraction and the improved permeability of the blood–brain barrier.
Conclusion
A series of hyperbranched cationic glycogen derivatives conjugated with DMAPA and AEPZ oligoamine residues were synthesized, which exhibited better blood compatibility and lower cytotoxicity when compared to bPEI. They were able to bind and condense pDNA to form complexes of 100–250 nm in size. The transfection efficiency of the DMAPA-Glyp/pDNA complexes was higher than that of the AEPZ-Glyp/pDNA complexes in both the 293T and CNE2 cells, and almost equal to that of bPEI. The pDNA could be safely delivered to the blood vessels in the brains of SD rats with the MCAO model by the DMAPA-Glyp derivatives and then expressed as GFP. The DMAPA-Glyp derivatives are thus anticipated as a novel nonviral gene vector for future gene-therapy applications, such as in ischemic stroke.
Supplementary materials
Morphology of erythrocytes incubated with (A) AEPZ-Glyp-0.25, (B) AEPZ-Glyp-0.29, (C) AEPZ-Glyp-0.35, (D) DMAPA-Glyp-2.1, (E) DMAPA-Glyp-2.5, (F) DMAPA-Glyp-2.8, (G) bPEI, (H) 0.9% NaCl, and (I) 10% Triton X-100 (×400, with a polymer concentration of 125 μg/mL).
Abbreviations: bPEI, branched polyethyleneimine; DMAPA, 3-(dimethylamino)-1-propylamine; AEPZ, 1-(2-aminoethyl) piperazine; Glyp, glycogen.
Zeta potentials of the cationic glycogen derivatives.
Abbreviations: DMAPA, 3-(dimethylamino)-1-propylamine; AEPZ, 1-(2-aminoethyl) piperazine; Glyp, glycogen; DS, degree of substitution.
Laser-scanning confocal images of 293T cells transfected by the glycogen derivative/pDNA complexes (w/w =20): (A) AEPZ-Glyp-0.35/pDNA, (B) DMAPA-Glyp-2.8/pDNA, and (C) bPEI/pDNA (N/P =10). 1, Nuclei stained by Hoechst 33342; 2, green fluorescent protein; 3, images 1 and 2 merged (×400).
Abbreviations: bPEI, branched polyethyleneimine; pDNA, plasmid deoxyribonucleic acid; N/P, N/P ratio refers to the ratio of moles of the amine groups of bPEI to moles of phosphates of pDNA; DMAPA, 3-(dimethylamino)-1-propylamine; AEPZ, 1-(2-aminoethyl) piperazine; Glyp, glycogen.
Acknowledgments
This work was supported by the National Natural Science Foundation of the People’s Republic of China (21244005, 20974130), and the Science and Technology Planning Project of Guangdong Province, People’s Republic of China (2012B091100457).
Footnotes
Disclosure
The authors report no conflicts of interest in this work.
References
- 1.Selvam S, Thomas PB, Hamm-Alvarez SF, et al. Current status of gene delivery and gene therapy in lacrimal gland using viral vectors. Adv Drug Deliv Rev. 2006;58:1243–1257. doi: 10.1016/j.addr.2006.07.021. [DOI] [PMC free article] [PubMed] [Google Scholar]
- 2.Varkouhi AK, Scholte M, Storm G, Haisma HJ. Endosomal escape pathways for delivery of biologicals. J Control Release. 2011;151:220–228. doi: 10.1016/j.jconrel.2010.11.004. [DOI] [PubMed] [Google Scholar]
- 3.Toita S, Morimoto N, Akiyoshi K. Functional cycloamylose as a polysaccharide-based biomaterial: application in a gene delivery system. Biomacromolecules. 2010;11:397–401. doi: 10.1021/bm901109z. [DOI] [PubMed] [Google Scholar]
- 4.Wang R, Zhou L, Zhou Y, et al. Synthesis and gene delivery of poly(amido amine)s with different branched architecture. Biomacromolecules. 2010;11:489–495. doi: 10.1021/bm901215s. [DOI] [PubMed] [Google Scholar]
- 5.Malmo J, Varum KM, Strand SP. Effect of chitosan chain architecture on gene delivery: comparison of self-branched and linear chitosans. Biomacromolecules. 2011;12:721–729. doi: 10.1021/bm1013525. [DOI] [PubMed] [Google Scholar]
- 6.Fischer D, Harpe A, Kunath K, Petersen H, Li Y, Kissel T. Copolymers of ethylene imine and N-(2-hydroxyethyl)-ethylene imine as tools to study effects of polymer structure on physicochemical and biological properties of DNA complexes. Bioconjug Chem. 2002;13:1124–1133. doi: 10.1021/bc025550w. [DOI] [PubMed] [Google Scholar]
- 7.Schallon A, Jérome V, Walther A, Synatschke CV, Müller AHE, Freitag R. Performance of three PDMAEMA-based polycation architectures as gene delivery agents in comparison to linear and branched PEI. React Funct Polym. 2010;70:1–10. [Google Scholar]
- 8.Yamagata M, Kawano T, Shiba K, Mori T, Katayama Y, Niidome T. Structural advantage of dendritic poly(L-lysine) for gene delivery into cells. Bioorg Med Chem. 2007;15:526–532. doi: 10.1016/j.bmc.2006.09.033. [DOI] [PubMed] [Google Scholar]
- 9.Zintchenko A, Philipp A, Dehshahri A, Wagner E. Simple modifications of branched PEI lead to highly efficient siRNA carriers with low toxicity. Bioconjug Chem. 2008;19:1448–1455. doi: 10.1021/bc800065f. [DOI] [PubMed] [Google Scholar]
- 10.Kim T, Seo HJ, Choi JS, et al. PAMAM-PEG-PAMAM: novel triblock copolymer as a biocompatible and efficient gene delivery carrier. Biomacromolecules. 2004;5:2487–2492. doi: 10.1021/bm049563j. [DOI] [PubMed] [Google Scholar]
- 11.Khan W, Hosseinkhani H, Ickowicz D, Hong PD, Yu DS, Domb AJ. Polysaccharide gene transfection agents. Acta Biomater. 2012;8:4224–4232. doi: 10.1016/j.actbio.2012.09.022. [DOI] [PubMed] [Google Scholar]
- 12.Jo J, Ikai T, Okazaki O, Yamamoto M, Hirano Y, Tabata Y. Expression profile of plasmid DNA by spermine derivatives of pullulan with different extents of spermine introduced. J Control Release. 2007;118:389–398. doi: 10.1016/j.jconrel.2007.01.005. [DOI] [PubMed] [Google Scholar]
- 13.Nagasaki T, Hojo M, Uno A, et al. Long-term expression with a cationic polymer derived from a natural polysaccharide: schizophyllan. Bioconjug Chem. 2004;15:249–259. doi: 10.1021/bc034178x. [DOI] [PubMed] [Google Scholar]
- 14.Katav T, Liu L, Traitel T, Goldbart R, Wolfson M, Kost J. Modified pectin-based carrier for gene delivery: cellular barriers in gene delivery course. J Control Release. 2008;130:183–191. doi: 10.1016/j.jconrel.2008.06.002. [DOI] [PubMed] [Google Scholar]
- 15.Wang ZH, Li WB, Ma J, Tang GP, Yang WT, Xu FJ. Functionalized nonionic dextran backbones by atom transfer radical polymerization for efficient gene delivery. Macromolecules. 2011;4:230–239. [Google Scholar]
- 16.Deng J, Zhou Y, Xu B, Mai K, Deng Y, Zhang L. Dendronized chitosan derivative as a biocompatible gene delivery carrier. Biomacromolecules. 2011;12:642–649. doi: 10.1021/bm101303f. [DOI] [PubMed] [Google Scholar]
- 17.Song Y, Sun Y, Zhang X, Zhou J, Zhang L. Homogeneous quaternization of cellulose in NaOH/urea aqueous solutions as gene carriers. Biomacromolecules. 2008;9:2259–2264. doi: 10.1021/bm800429a. [DOI] [PubMed] [Google Scholar]
- 18.Zhou Y, Yang B, Ren X, et al. Hyperbranched cationic amylopectin derivatives for gene delivery. Biomaterials. 2012;33:4731–4740. doi: 10.1016/j.biomaterials.2012.03.014. [DOI] [PubMed] [Google Scholar]
- 19.Putaux J, Potocki-Véronèse G, Remaud-Simeon M, Buleon A. Alpha-D-Glucan-based dendritic nanoparticles prepared by in vitro enzymatic chain extension of glycogen. Biomacromolecules. 2006;7:1720–1728. doi: 10.1021/bm050988v. [DOI] [PubMed] [Google Scholar]
- 20.Rolland-Sabaté A, Mendez-Montealvo MG, Colonna P, Planchot V. Online determination of structural properties and observation of deviations from power law behavior. Biomacromolecules. 2008;9:1719–1730. doi: 10.1021/bm7013119. [DOI] [PubMed] [Google Scholar]
- 21.Rolland-Sabaté A, Colonna P, Mendez-Montealvo MG, Planchot V. Branching features of amylopectins and glycogen determined by asymmetrical flow field flow fractionation coupled with multiangle laser light scattering. Biomacromolecules. 2007;8:2520–2532. doi: 10.1021/bm070024z. [DOI] [PubMed] [Google Scholar]
- 22.McArdle WD, Katch FI, Katch VL. Exercise Physiology: Energy, Nutrition, and Human Performance. Philadelphia: Lippincott Williams and Wilkins; 2006. p. 12. [Google Scholar]
- 23.Gottlieb HE, Kotlyar V, Nudelman A. NMR chemical shifts of common laboratory solvents as trace impurities. J Org Chem. 1997;62:7512–7515. doi: 10.1021/jo971176v. [DOI] [PubMed] [Google Scholar]
- 24.Wu DC, Loh XJ, Wu YL, Lay CL, Liu Y. ‘Living’ controlled in situ gelling systems: thiol-disulfide exchange method toward tailor-made biodegradable hydrogels. J Am Chem Soc. 2010;132:15140–15143. doi: 10.1021/ja106639c. [DOI] [PubMed] [Google Scholar]
- 25.Fischer D, Li Y, Ahlemeyer B, Krieglstein J, Kissel T. In vitro cytotoxicity testing of polycations: influence of polymer structure on cell viability and hemolysis. Biomaterials. 2003;24:1121–1131. doi: 10.1016/s0142-9612(02)00445-3. [DOI] [PubMed] [Google Scholar]
- 26.Liu Z, Li Z, Zhou H, Wei G, Song Y, Wang L. Imaging DNA molecules on mica surface by atomic force microscopy in air and in liquid. Microsc Res Tech. 2005;66:179–185. doi: 10.1002/jemt.20156. [DOI] [PubMed] [Google Scholar]
- 27.Kainthan RK, Gnanamani M, Ganguli M, et al. Blood compatibility of novel water soluble hyperbranched polyglycerol-based multivalent cationic polymers and their interaction with DNA. Biomaterials. 2006;27:5377–5390. doi: 10.1016/j.biomaterials.2006.06.021. [DOI] [PubMed] [Google Scholar]
- 28.Yang J, Liu Y, Wang H, et al. The biocompatibility of fatty acid modified dextran-agmatine bioconjugate gene delivery vector. Biomaterials. 2012;33:604–613. doi: 10.1016/j.biomaterials.2011.09.067. [DOI] [PubMed] [Google Scholar]
- 29.Lu B, Wang CF, Wu DQ, Li C, Zhang XZ, Zhuo RX. Chitosan based oligoamine polymers: synthesis, characterization, and gene delivery. J Control Release. 2009;137:54–62. doi: 10.1016/j.jconrel.2009.03.004. [DOI] [PubMed] [Google Scholar]
- 30.Pack DW, Hoffman AS, Pun S, Stayton PS. Design and development of polymers for gene delivery. Nat Rev Drug Discov. 2005;4:581–593. doi: 10.1038/nrd1775. [DOI] [PubMed] [Google Scholar]
- 31.Liu YM, Reineke TM. Hydroxyl stereochemistry and amine number within poly(glycoamidoamine)s affect intracellular DNA delivery. J Am Chem Soc. 2005;127:3004–3015. doi: 10.1021/ja0436446. [DOI] [PubMed] [Google Scholar]
- 32.Xiong X, Uludağ H, Lavasanifar A. Biodegradable amphiphilic poly(ethylene oxide)-block-polyesters with grafted polyamines as supramolecular nanocarriers for efficient siRNA delivery. Biomaterials. 2009;30:242–253. doi: 10.1016/j.biomaterials.2008.09.025. [DOI] [PubMed] [Google Scholar]
- 33.Lu W, Sun Q, Wan J, She Z, Jiang X. Cationic albumin-conjugated pegylated nanoparticles allow gene delivery into brain tumors via intravenous administration. Cancer Res. 2006;66:11878–11887. doi: 10.1158/0008-5472.CAN-06-2354. [DOI] [PubMed] [Google Scholar]
- 34.Sandoval KE, Witt KA. Blood-brain barrier tight junction permeability and ischemic stroke. Neurobiol Dis. 2008;32:200–219. doi: 10.1016/j.nbd.2008.08.005. [DOI] [PubMed] [Google Scholar]
- 35.Khan MM, Gandhi C, Chauhan N, et al. Alternatively-spliced extra domain A of fibronectin promotes acute inflammation and brain injury following cerebral ischemia in mice. Stroke. 2012;43:1376–1382. doi: 10.1161/STROKEAHA.111.635516. [DOI] [PMC free article] [PubMed] [Google Scholar]
Associated Data
This section collects any data citations, data availability statements, or supplementary materials included in this article.
Supplementary Materials
Morphology of erythrocytes incubated with (A) AEPZ-Glyp-0.25, (B) AEPZ-Glyp-0.29, (C) AEPZ-Glyp-0.35, (D) DMAPA-Glyp-2.1, (E) DMAPA-Glyp-2.5, (F) DMAPA-Glyp-2.8, (G) bPEI, (H) 0.9% NaCl, and (I) 10% Triton X-100 (×400, with a polymer concentration of 125 μg/mL).
Abbreviations: bPEI, branched polyethyleneimine; DMAPA, 3-(dimethylamino)-1-propylamine; AEPZ, 1-(2-aminoethyl) piperazine; Glyp, glycogen.
Zeta potentials of the cationic glycogen derivatives.
Abbreviations: DMAPA, 3-(dimethylamino)-1-propylamine; AEPZ, 1-(2-aminoethyl) piperazine; Glyp, glycogen; DS, degree of substitution.
Laser-scanning confocal images of 293T cells transfected by the glycogen derivative/pDNA complexes (w/w =20): (A) AEPZ-Glyp-0.35/pDNA, (B) DMAPA-Glyp-2.8/pDNA, and (C) bPEI/pDNA (N/P =10). 1, Nuclei stained by Hoechst 33342; 2, green fluorescent protein; 3, images 1 and 2 merged (×400).
Abbreviations: bPEI, branched polyethyleneimine; pDNA, plasmid deoxyribonucleic acid; N/P, N/P ratio refers to the ratio of moles of the amine groups of bPEI to moles of phosphates of pDNA; DMAPA, 3-(dimethylamino)-1-propylamine; AEPZ, 1-(2-aminoethyl) piperazine; Glyp, glycogen.


