Abstract
Tissue-specific knockout (KO) of atypical protein kinase C-λ (PKC-λ) impairs insulin-stimulated glucose transport in muscle (M) and lipid synthesis in liver (L), thereby producing insulin resistance in MλKO mice and insulin-hypersensitivity in LλKO mice. Here, we generated mice with KO of PKC-λ in adipocytes, i.e., AλKO mice. In isolated adipocytes of AλKO mice, insulin-stimulated aPKC activity and glucose transport were diminished, as were ERK levels and activity. Insulin-stimulated glucose transport and insulin activation of ERK in adipocytes of wild-type mice were similarly inhibited by acute inhibition of PKC-λ with a highly-specific chemical inhibitor. With impairments in glucose transport and ERK activation, AλKO mice had diminished adiposity and serum leptin levels. In addition, AλKO mice had normal glucose tolerance and insulin hypersensitivity owing to enhanced suppression of hepatic glucose output, which apparently reflected increases in Akt activity and FoxO1 phosphorylation, and subsequent decreases in expression of gluconeogenic phosphoenolpyruvate carboxykinase. We conclude that: PKC-λ is required for insulin-stimulated glucose transport and ERK signaling in mouse adipocytes; and diminution of these processes is attended by leanness and therefore hypoleptinemia. How these and perhaps other PKC-λ-dependent processes communicate to liver and improve insulin suppression of hepatic gluconeogenesis remains unclear.
Keywords: ERK, PKC-λ, adipocyte, diabetes, glucose transport, insulin, liver
Introduction
Adipocytes are major sites for synthesis and storage of lipids, and, moreover, release adipo/cytokines that influence metabolic processes in distant organs. Insulin regulates multiple processes in adipocytes, most notably, transport of glucose, which provides the glycerol backbone for glycerolipid synthesis. Insulin is postulated to stimulate glucose transport in adipocytes through activation of Akt/protein kinase B and atypical protein kinase C (aPKC) by phosphatidylinositol 3-kinase (PI3K). However, studies involving expression of kinase-inactive forms, or knockdown, of Akt and aPKC in cultured 3T3/L1 adipocytes have yielded conflicting results on requirements for these kinases (see review through 2005 in ref. 1 and follow-up report of knockdown studies in ref. 2). Presumably, clonal or methodological differences underlie the differences in findings.
Despite the usefulness of cell-culture studies, the determination of signaling requirements for insulin-regulated processes in tissues of intact animals is of paramount importance. An important approach to this end is tissue-specific knockout of a signaling factor, particularly in mice in which total body knockout is lethal. For example, muscle (M)-specific knockout (KO) of PKC-λ (MλKO), the major aPKC in mouse muscle (note that total body KO of PKC-λ is embryonic lethal), impairs insulin-stimulated Glut4 translocation and glucose transport. Moreover, this isolated defect in muscle induces a systemic syndrome of glucose intolerance, insulin resistance, islet β-cell hyperplasia, and hyperinsulinemia. In turn, hyperinsulinemia causes excessive activation of hepatic aPKC, which, in liver, inordinately increases: (a) activity and expression of sterol receptor element binding protein-1c (SREBP-1c), thereby increasing expression of multiple lipogenic enzymes, e.g., fatty acid synthase (FAS); and (b) activity of nuclear factor κ-B (NFκB), thereby increasing expression of hepatic proinflammatory cytokines.3-5 Also, as MλKO mice develop more overt diabetes, there are increases in expression of hepatic gluconeogenic enzymes, phosphoenolpyruvate carboxykinase (PEPCK) and glucose-6-phosphatase (G6Pase).4,5
The above-described increases in hepatic aPKC activity and expression of lipogenic, proinflammatory, and gluconeogenic factors in MλKO mice apparently contribute importantly to the development of clinical abnormalities, viz., abdominal obesity, hepatosteatosis, hypertriglyceridemia, and hypercholesterolemia. In support of this idea, inhibition of hepatic aPKC in MλKO mice by either adenovirally mediated expression of kinase-inactive aPKC4 or chemical PKC-λ inhibitors5 rapidly reverses aberrant increases in hepatic enzyme expression and associated clinical abnormalities. Similarly, inhibition of hepatic aPKC in high-fat-fed mice4 and rodents with type 2 diabetes mellitus (T2DM)6 diminishes expression of lipogenic, proinflammatory and gluconeogenic enzymes.
Opposite to findings in MλKO mice, liver-specific KO of PKC-λ (LλKO) is attended by diminished ability of insulin to activate hepatic SREBP-1c, diminished expression of SREBP-1c and SREBP-1c-dependent lipogenic enzymes, enhanced insulin sensitivity, increased glucose tolerance, and metabolic protection during high-fat feeding.7 Similarly, liver-specific KO of PKC-λ induced acutely by administration of adenovirus encoding Cre-recombinase to PKC-λ-floxed mice diminishes insulin-stimulated activation of both SREBP-1c and NFκB.4 Furthermore, direct inhibition of aPKC in hepatocytes of T2DM humans with two specific aPKC inhibitors reverses T2DM-dependent increases in activity of SREBP-1c and NFκB, and expression of SREBP-1c, FAS, interleukin-1β (IL-1β), tumor necrosis factor-α (TNF-α), PEPCK, and G6Pase.8
To further explore consequences of aPKC deficiency in key insulin-sensitive tissues, we developed mice with adipocyte-specific knockout of PKC-λ, the major aPKC in adipocytes, i.e., (AλKO) mice. The major objective of this study was to determine whether aPKC is required for insulin-stimulated glucose transport and perhaps other processes in adipocytes. We also wanted to examine phenotypic consequences of loss of aPKC in adipocytes. The latter objective is important, not only for comparison of AλKO mice to MλKO and LλKO mice, but also for comparison to mice with: (a) adipocyte-specific KO of the Glut4 glucose transporter (AG4KO), which is surprisingly attended by impairments in insulin signaling and actions in muscle and liver and induction of an insulin-resistant, hyperinsulinemic, glucose-intolerant state;9 and (b) fat-specific KO of the insulin receptor (FIRKO), which, very differently from AG4KO, have reduced adipose mass and increased longevity.10
Results
aPKC levels and activity in adipocytes
Relative to WT mice, PKC-λ levels were diminished (mean ± SEM relative values: 1 ± 0.05, WT vs. 0.51 ± 0.03 in AλKO mice; [n = 8; P < 0.001; KO vs. WT; t test]) in adipocytes of AλKO mice; in contrast, PKC-ζ levels were comparable (mean ± SEM relative values: 1 ± 0.17, WT vs. 1.04 ± 0.17, AλKO; n = 8) in WT and AλKO mice (blots in Fig. 1A). Consonant with the idea that PKC-λ is the major aPKC in mouse adipocytes, total aPKC levels (i.e., PKC-λ/ζ), like PKC-λ levels, were diminished in AλKO mice (mean ± SEM relative values: 1 ± 0.13, WT vs. 0.50 ± 0.12, AλKO; [n = 15; P < 0.01; t test]) (blots in Fig. 1A and B). The residual immunoreactivity seen in PKC-λ blots of isolated adipocytes of AλKO mice probably largely reflects incomplete knockdown of PKC-λ, but may also be due to contamination of adipocytes with fibroblasts or other cells that contain a full complement of PKC-λ. Different from adipocytes, PKC-λ and PKC-λ/ζ levels in muscle and liver were comparable in WT and AλKO mice (blots in Fig. 1C).
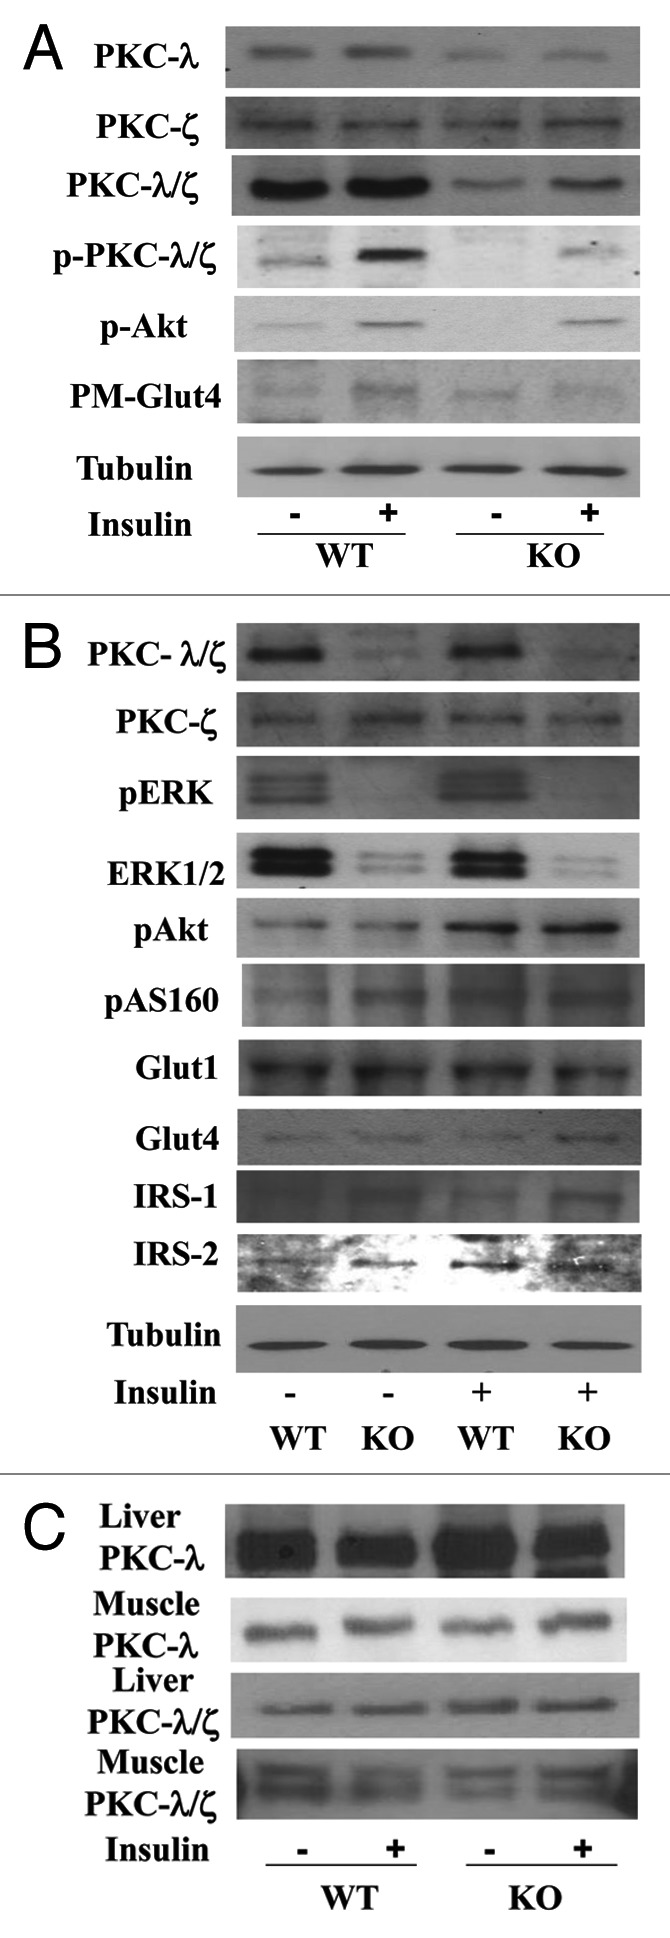
Figure 1. Levels of aPKCs and other insulin-sensitive signaling and effector factors in adipocytes and liver and muscle tissues of of control and insulin-stimulated wild-type (WT) and adipocyte-specific PKC-λ knockout (KO) mice. In (A and B), adipocytes were isolated from WT and KO mice and incubated for 30 min ± 10 nM insulin. In (C), tissues taken from of WT and KO mice treated for 10 min ± insulin (1 mU/g body weight), and were analyzed directly. Blots representative of 4 or more determinations are shown here. Constant levels of immunoreactivity in blots for PKC-ζ, Glut1, and tubulin show equal sample loading in (A and B). Mice in these studies were 5–7 mo old.
As with total aPKC levels insulin-stimulated total aPKC activity was markedly diminished in adipocytes isolated from AλKO mice, relative to WT mice, as evidenced by decreases in insulin-stimulated immunoprecipitable total aPKC enzyme activity (Fig. 2A) and diminished phosphorylation of threonine-555/560-PKC-λ/ζ, (Fig. 1A; quantitative phosphorylation data are given below), the autophosphorylation site, required for, and reflective of, aPKC activation.11
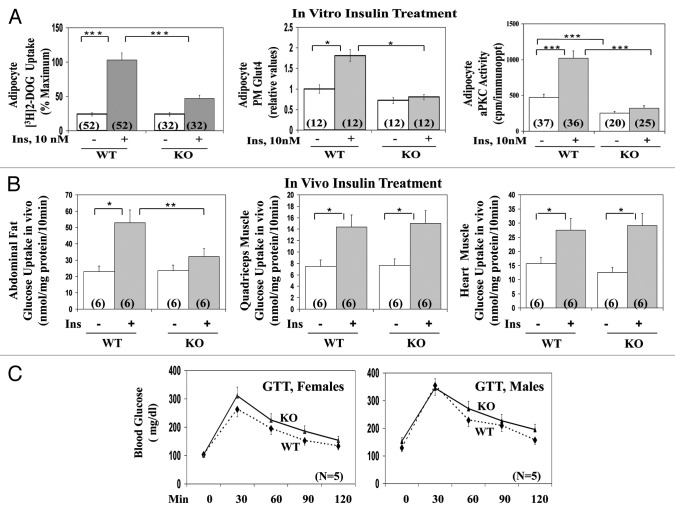
Figure 2. Effects of adipocyte-specific knockout (KO) of PKC-λ on: (A) basal and insulin-stimulated glucose transport, Glut4 translocation to the plasma membrane and aPKC activity in isolated adipocytes of wild-type (WT) and KO mice; (B) basal and insulin-stimulated glucose transport in vivo in adipose and muscle tissues of wild-type (WT) and KO mice; and (C) glucose tolerance in vivo in of wild-type (WT) and KO mice. Mice in these studies were 5–7 mo old. In (A), adipocytes were isolated from ad lib fed WT and AλKO mice and incubated for 30 min ± 10 nM insulin prior to measurement of Glut 4 translocation and glucose transport, i.e., [3H]2-deoxyglucose uptake over 1 min, as described in Methods. In (B), after an overnight fast, mice were injected with 0.2 ml physiologic saline containing, each per gram body weight, 0.05 μCi [3H]2-deoxyglucose (DOG; NEN/Life Science Products), 0.005 μCi [14C] L-glucose (NEN/Life Science Products), ± 1 mU insulin (Sigma), was administered intraperitoneally 10 min before killing. Glucose uptake into pooled abdominal, retroperitoneal, and perigonadal adipose tissues, and into hind limb muscle and heart muscle was measured by dividing the tissue [3H]-cpm (corrected for non-specific trapping of extracellular water as per [14C]-L-glucose radioactivity) by the specific 3H-radioactivity of serum glucose. In (C), glucose tolerance was measured after a 6-h fast by intraperitoneal injection of 2 mg d-glucose per kg body weight and tail vein blood samples were obtained at 0, 30, 60, 90, and 120 min for determination of blood glucose levels (glucometer method). Values are mean ± SEM of the number of determinations shown in parentheses. Asterisks indicate P values: *P < 0.05; **P < 0.01; ***P < 0.001. Abbreviations: p, phospho-; Ins, insulin; WT, wild type; KO, knockout; PM, plasma membrane; Glut4, glucose-4 transporter.
Glucose transport in adipocytes
In conjunction with decreased aPKC activity, insulin-stimulated [3H]-2-deoxyglucose uptake and translocation of the Glut4 transporter to the plasma membrane were diminished in adipocytes of AλKO mice, relative to WT adipocytes (Fig. 2A). In this regard, note that immunoreactive Glut4 levels (mean ± SEM relative values: 1 ± 0.13 in WT mice [n = 10] vs. 0.94 ± 0.14 in AλKO mice [n = 8]) and Glut1 levels (mean ± SEM relative values: 1 ± 0.08 in WT mice [n = 14] vs. 1.08 ± 0.12 in AλKO mice [n = 14]) were comparable in adipocytes of WT and AλKO mice (blots in Fig. 1B).
Glucose uptake in vivo
As in isolated adipocytes, insulin-stimulated glucose uptake in vivo was impaired in adipose tissues of AλKO mice, relative to uptake in adipose tissues of WT mice, (Fig. 2B). In contrast, insulin-stimulated glucose uptake in vivo was comparable in skeletal and heart muscles of WT and AλKO mice (Fig. 2B).
Insulin activation of Akt in adipocytes
Opposite to the deficiency in aPKC activation, basal and insulin-dependent phosphorylation of the PDK2-dependent activation site, Ser-473, in Akt was comparable in adipocytes of AλKO and WT mice (mean ± SEM relative values: 1 ± 0.10 basal and 1.58 ± 0.13 insulin-stimulated in WT mice [n = 13; P < 0.001; basal vs. insulin; t test], as compared with 1 ± 0.12 basal and 1.73 ± 0.16 insulin-stimulated in AλKO mice [n = 11; P < 0.005; basal vs. insulin; t test]; more Akt phosphorylation data are given below) (blots in Fig. 1A and B). Moreover, insulin-stimulated phosphorylation of Akt substrate, AS160, required for glucose transport, was similarly comparable in adipocytes of WT and AλKO mice (mean ± SEM relative values: 1 ± 0.22, insulin-stimulated in WT mice [n = 11] vs. 1.04 ± 0.25 insulin-stimulated in AλKO mice [n = 11]) (Fig. 1B).
As to upstream factors required for both aPKC and Akt activation, IRS-1 levels were increased in adipocytes of AλKO, relative to WT, mice (mean percent increase ± SEM, 111% ± 27% [n = 6; P < 0.001; paired t test]); on the other hand, IRS-2 levels (mean percent increase ± SEM, 27% ± 17% [n = 6]) and levels of the p85 subunit of PI3K (mean percent increase ± SEM, 5% ± 5% [n = 11]) were not significantly different in adipocytes of AλKO and WT mice (Fig. 1B).
Intraperitoneal glucose tolerance test (GTT)
Glucose tolerance in both male and female AλKO mice, measured following intraperitoneal administration of 2 mg glucose/kg body weight, was not significantly different (as per comparison of values at each time point) from that observed in WT mice (Fig. 2C).
Effects of specific inhibition of PKC-λ on glucose transport in WT adipocytes
To further test the requirement for PKC-λ during insulin-stimulated glucose transport in mouse adipocytes, we used a highly specific, potent inhibitor of PKC-λ/ι, viz., 1H-imidazole-4-carboxamide, 5-amino-1-[2,3-dihydroxy-4-[(phosphonooxy)methyl]cyclopentyl-[1R-(1a,2b,3b,4a)] (ICAPP). Note that ICAPP binds to the catalytic domain of PKC-λ/ι and thereby diminishes autophosphorylation and substrate phosphorylation; in contrast, ICAPP does not inhibit PKC-ζ, conventional PKCs, α and β, novel PKCs, δ, ε, and θ, Akt, or AMPK.5,8
In adipocytes isolated from WT mice, ICAPP potently (Ki, approx 10 nM) inhibited insulin activation of aPKC (Fig. 3B), but not Akt2 (Fig. 3C). Most importantly, the inhibition of aPKC in WT mice was attended by a comparable dose-dependent inhibition of [3H]-2-deoxyglucose uptake (Fig. 3A). As in studies of AλKO mice, residual effects of insulin on glucose transport in ICAPP-treated WT adipocytes may reflect activity of residual PKC-λ, unaltered PKC-ζ, or an aPKC-independent mechanism.

Figure 3. Effects of PKC-λ-specific inhibitor, ICAPP, on (A) insulin-stimulated glucose transport, (B) aPKC activity, and (C) Akt2 activity in adipocytes of wild-type (WT) mice. Mice in these studies were 5–7 mo old. Adipocytes were isolated from ad lib fed WT mice and incubated for 30 min with indicated concentrations of PKC-λ inhibitor ICAPP, and then for 30 min ± 10 nM insulin prior to measurement of [3H]2-deoxyglucose uptake over 1 min as described in Methods. Values are mean ± SEM of the number of determinations shown in parentheses. Asterisks indicate P values: *P < 0.05; **P < 0.01; ***P < 0.001.
Alterations in ERK
Insulin activation of ERK in rat adipocytes is dependent on PI3K12,13 and aPKC,12 but not Akt.14 Similarly, insulin-stimulated phosphorylation/activation of ERK in adipocytes of WT mice was blocked by a specific inhibitor of PKC-λ, ICAPP, in a dose-dependent manner comparable to decreases in insulin-stimulated phosphorylation of aPKC (Fig. 4A); (mean ± SEM relative values: basal and insulin-stimulated ERK phosphorylation in control/uninhibited adipocytes, 1 ± 0.003; [n = 4] and 1.77 ± 0.09 [n = 4; P < 0.001; basal vs. insulin-stimulated; ANOVA]; and basal and insulin-stimulated ERK phosphorylation in adipocytes inhibited by 100 nM ICAPP, 0.81 ± 0.05 [n = 4] and 0.94 ± 0.25; [n = 4; not significant, basal vs. insulin-stimulated]). Also note in Figure 4A: (a) comparable level of ERK1 in these samples indicates equal sample loading; (b) insulin-stimulated phosphorylation/activation of Akt was not diminished by ICAPP; and (c) the marked inhibitory effects of ICAPP, a specific inhibitor of PKC-λ, on the stimulatory effects of insulin on phosphorylation of PKC-λ/ζ (i.e., on total aPKC), provides further evidence that PKC-λ is the major aPKC in mouse adipocytes.
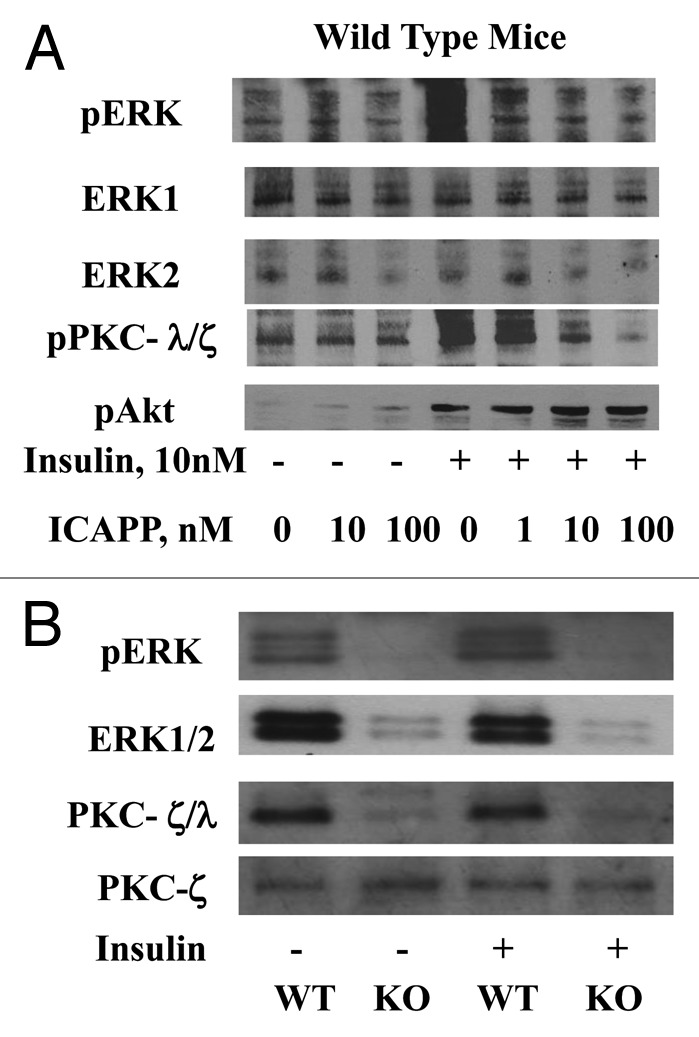
Figure 4. (A) The effects of PKC-λ-specific inhibitor, ICAPP, on insulin-stimulated phosphorylation/activation of ERK in adipocytes of wild-type (WT) mice and (B) the effects of adipocyte-specific knockout (KO) of PKC-λ on ERK activity and levels in adipocytes of WT and KO mice. Mice in these studies were 5–7 mo old. In (A), adipocytes were isolated from ad lib fed WT mice and incubated for 30 min with indicated concentrations of PKC-λ inhibitor ICAPP, and then for 10 min ± indicated concentrations of insulin. In (B), adipocytes were isolated from ad lib fed WT and KO mice.
As seen in Figure 4B, in adipocytes of AλKO mice, the loss of PKC-λ was surprisingly attended not only by diminished insulin-stimulated phosphorylation/activation of ERK (mean ± SEM relative values: basal and insulin-stimulated in WT mice, 1 ± 0.08 [n = 10] and 1.42 ± 0.11 [n = 13; P < 0.01; t test; basal vs. insulin-stimulated], as compared with basal and insulin-stimulated values in AλKO mice, 0.66 ± 0.08 [n = 9) and 0.70 ± 0.11 [n = 10; basal vs. insulin-stimulated, not significant]), but also by low levels of immunoreactive ERK (mean ± SEM relative values: 1 ± 0.09 in WT mice [n = 8] vs. 0.33 ± 0.07 in AλKO mice [n = 8; P < 0.001; t test; WT vs. AλKO]). Note that comparable levels of PKC-ζ in these samples of WT and AλKO mice indicate equal loading of samples in Figure 4B.
Hyperinsulinemic–euglycemic clamp studies
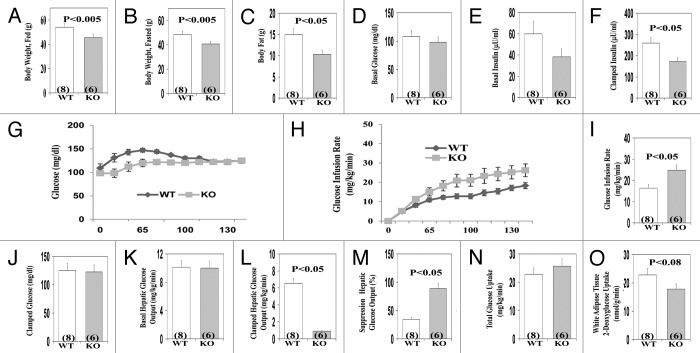
Characteristics of the male AλKO mice used in clamp studies (which were older, [owing to shipping and scheduling delays for clamp studies] than mice used in other studies) are illustrated in Figure 5A–C. Relative to WT mice, these AλKO mice had significantly lower fed and fasted body weights, and diminished total body fat content, as determined by proton-NMR. In contrast to adipose tissue, the weights of liver and muscle (not shown), and basal levels of serum glucose (Fig. 5D), serum insulin (Fig. 5E), and basal hepatic glucose output (Fig. 5K) were not significantly different in AλKO and WT mice.
Figure 5. Effects of adipocyte-specific knockout (KO) of PKC-λ on indicated parameters in clamp studies of overnight fasted mice. Mice in these studies were approximately 10 mo old. Values depicted in bargrams are mean ± SEM of the number of determinations shown in parentheses. Abbreviations: WT, wild-type mice; KO, knockout mice.
During the clamp, despite significantly lower insulin levels (Fig. 5F), insulin suppression of hepatic glucose output (Fig. 5M) was enhanced and was attended by an increase in the glucose infusion rate needed to maintain euglycemia in AλKO mice (Fig. 5G and I). Also note: (a), whereas total body glucose uptake (presumably largely in muscle) in AλKO mice was comparable to that of WT mice (Fig. 5N), 2-deoxyglucose uptake in white adipose tissue trended downward (P < 0.08) during the prolonged clamp period (140 min) in AλKO mice (Fig. 5O), in concert with the finding of significantly impaired glucose transport observed above in Figure 2A, wherein uptake was measured over a much shorter 10 min period.
Finally, note (a) in these fasted AλKO mice, that basal levels of serum free fatty acid (FFA) levels were comparable to those of WT mice (Fig. 6A), but, during the clamp, insulin suppression of serum FFA was significantly enhanced (Fig. 6B and C).
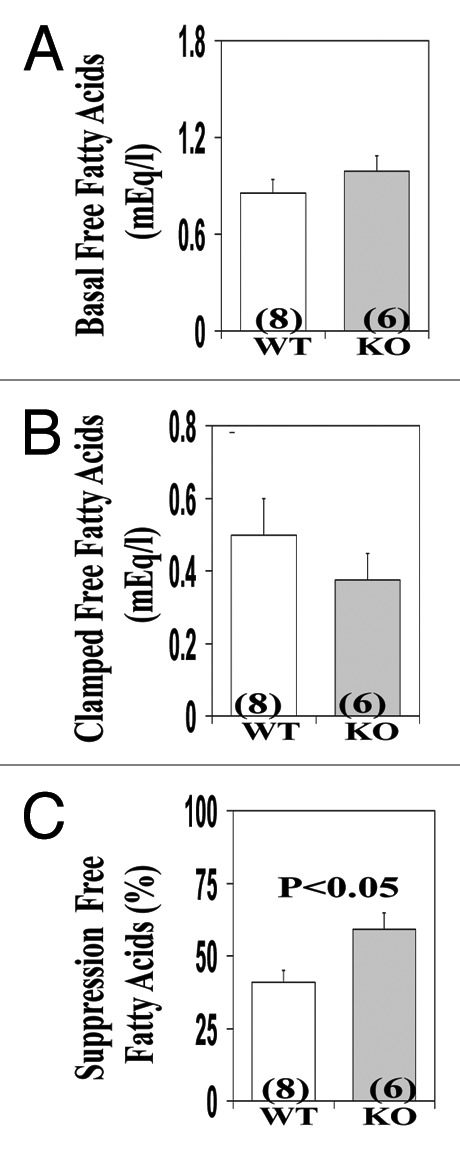
Figure 6. Effects of adipocyte-specific knockout (KO) of PKC-λ on serum levels of free fatty acids observed in clamp studies (see Fig. 5) of overnight fasted mice. Mice in these studies were approximaletly 10 mo old. Values depicted in bargrams are mean ± SEM of the number of determinations shown in parentheses. Abbreviations: mEq/l, milliequivalents per liter; WT, wild type mice; KO, knockout mice.
Weight, adiposity, food intake, and clinical findings
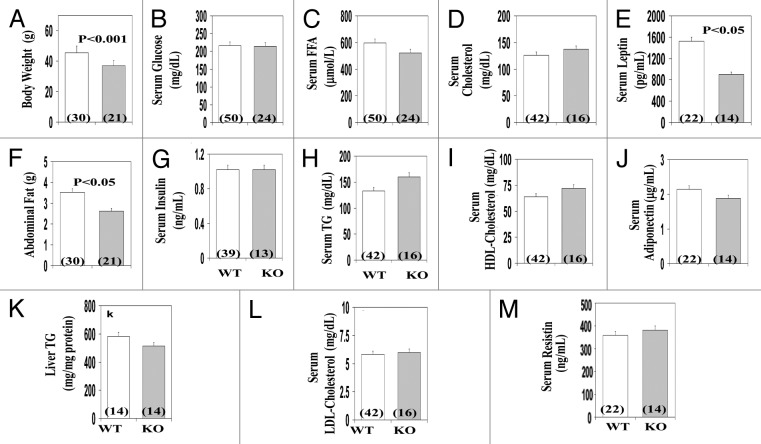
In ad lib fed males and females (findings were combined, as there were no significant sex-related differences in the measured parameters), body weight (Fig. 7A) and abdominal fat content (Fig. 7F) were diminished in AλKO mice, relative to WT littermates. On the other hand, AλKO and WT mice had comparable levels of liver triglycerides (Fig. 7K) and serum levels of glucose (Fig. 7B), insulin (Fig. 7G), triglycerides (Fig. 7H) and cholesterol (Fig. 7D, I, and L). In conjunction with lower body weight and diminished adiposity, serum leptin, but not resistin or adiponectin, levels were diminished in AλKO mice (Fig. 7E, J, and M, respectively). Of further note, daily food consumption trended 12% lower in AλKO vs. WT mice, but statistical significance was not achieved (not shown).
Figure 7. Effects of adipocyte-specific knockout of PKC-λ on indicated parameters in ad lib fed mice. Mice in these were 5–7 mo old, and samples from multiple experiments with multiple mice in each experiment were analyzed. Values depicted in bargrams are mean ± SEM of the number of determinations shown in parentheses. Abbreviations: WT, wild type mice; KO, knockout mice.
Hepatic enzyme expression
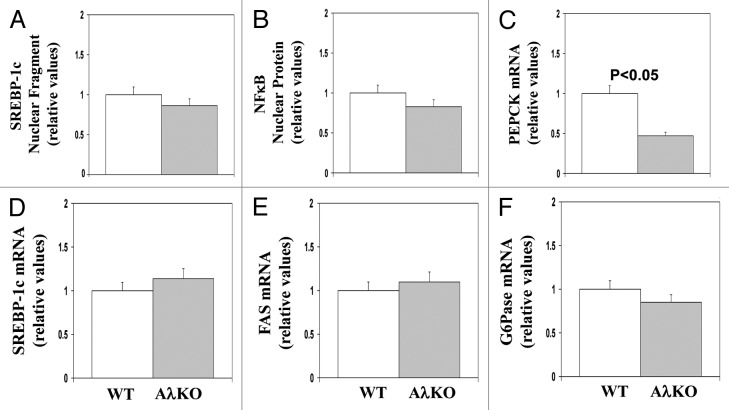
In comparisons of ad lib fed AλKO and WT mice, there were no significant differences in: (a) active nuclear levels of either the SREBP-1c fragment (Fig. 8A) or the NFκB p65/RelA subunit (Fig. 8B); or (b) mRNA levels of SREBP-1c (Fig. 8D) and FAS (Fig. 8E). On the other hand, expression of the gluconeogenic enzyme, PEPCK (Fig. 8C), but not G6Pase, was diminished in AλKO mice (Fig. 8F).
Figure 8. Effects of adipocyte-specific knockout of PKC-λ on expression of indicated hepatic enzymes in ad lib fed mice. Mice in these studies were 5–7 mo old. Values depicted in bargrams are mean ± SEM of 8 determinations. Abbreviations: WT, wild type mice; AλKO, knockout mice.
Effects of insulin on phosphorylation of hepatic Akt and FoxO1
Insulin diminishes hepatic PEPCK expression largely by activation of Akt and subsequent phosphorylation, and nuclear exclusion/inhibition of FoxO1.15,16 It was therefore interesting to find increases in basal FoxO1 phosphorylation and insulin-stimulated phosphorylation/activation of Akt and aPKC in livers of AλKO mice (Fig. 9).
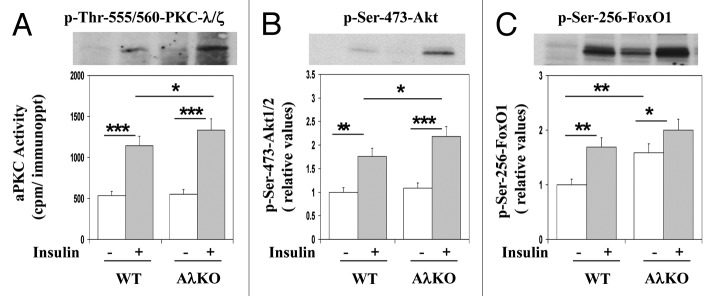
Figure 9. Effects of adipocyte-specific knockout of PKC-λ on and basal and insulin-stimulated (treatment for 10 min with 1 mU/g body weight injected intraperitoneally) phosphorylation states of hepatic aPKC, Akt1/2 and FoxO1 in ad lib fed mice. Mice in these studies were 5–7 mo old. Values are mean ± SEM of 6 determinations, and representative blots are shown above bargrams. Asterisks indicate P values: *P < 0.05; **P < 0.01; ***P < 0.001. Abbreviations: WT, wild type mice; AλKO, knockout mice.
Discussion
Our findings showed that PKC-λ is at least partly required for insulin-stimulated glucose transport in mouse adipocytes, as the loss of PKC-λ in adipocytes of AλKO mice was attended by substantial impairment of insulin-stimulated glucose transport in both adipose tissues harvested in vivo and isolated adipocytes incubated in vitro. Moreover, acute inhibition of insulin-stimulated glucose transport in adipocytes of WT mice by a highly specific PKC-λ/ι inhibitor suggested that the requirement for PKC-λ seen in adipocytes of AλKO mice was not due to chronic PKC-λ deficiency or factors other than PKC-λ.
In keeping with previous reports showing that insulin activation of ERK in rat adipocytes is dependent on PI3K12,13 and PI3K-dependent aPKC,12 we found that: (a) ERK activation by insulin in adipocytes of wild-type mice was blocked by a highly specific PKC-λ inhibitor; and (b) activation and activity of ERK was diminished in adipocytes of AλKO mice. In this regard, we have not observed any dependence of insulin-stimulated ERK activation on aPKC in either muscle or liver (unpublished). On the other hand, the activation of ERK by a variety of agonists in a number of cell types has been found to be dependent on PI3K and aPKC.
It was surprising to find that the decreases in ERK phosphorylation and activity in adipocytes of AλKO mice were due in part to diminished ERK levels. In this regard, we did not observe any alteration in ERK levels in muscles of MλKO mice, and we are unaware of reports of dependency of ERK levels on aPKC or other kinases in other cell types. The reason for diminished ERK levels (i.e., altered stability or expression) in adipocytes of AλKO mice requires further study.
An important alteration in AλKO mice was the decrease in adipose mass. This diminution in adiposity is probably at least partly due to the impairment in insulin-stimulated glucose transport, which, via glycolysis, supplies glycerol-3-PO4 needed for de novo synthesis of phosphatidic acid, the major glycerolipid precursor. Consonant with the idea that diminished lipid synthesis, rather than increased lipolysis, was responsible for decreases in adipose mass is the fact that the anti-lipolytic effect of insulin in adipocytes is dependent on Akt,14 whose activation was intact in AλKO mice. Nevertheless, other reasons for diminished adiposity may be operative in AλKO mice, including: decreased food intake (such a trend was presently noted here and see below) despite diminished serum leptin levels (suggesting enhanced sensitivity or exposure of hypothalamic appetite-centers to leptin); diminished levels of serum insulin, which increases fat synthesis and storage in adipose tissue; and diminished adipocyte levels and activity of ERK, which controls adipogenesis.17,18
The decrease in adiposity in AλKO mice may be relevant to increases in insulin sensitivity during clamp studies and trends to lower serum insulin levels. However, decreases in serum insulin levels during the hyperinsulinemic clamp procedure further suggested that insulin turnover is increased in AλKO mice. Whatever the reason, sensitivity to infused insulin was clearly increased during the clamp procedure in AλKO mice, and the glucose infusion rate needed to maintain euglycemia was increased, despite diminished serum insulin levels. Moreover, this increase in glucose infusion rate was largely explained by enhanced insulin suppression of hepatic glucose output, as total body glucose uptake, presumably reflecting disposal largely in muscle, was similar in WT and AλKO mice.
As alluded to above, aPKC is required for stimulatory effects of both insulin and feeding on: (a) activation/expression of hepatic SREBP-1c and expression of lipogenic enzymes; (b) hepatic NFκB activation and expression of proinflammatory cytokines; (c) fasting-dependent increases in PEPCK and G6Pase.1-4 It was therefore interesting to find in ad lib fed mice that, except for diminished expression of the hepatic gluconeogenic enzyme, PEPCK, in AλKO mice, hepatic activities (nuclear levels of active moieties) of SREBP-1c and NFκB, and mRNA levels of lipogenic enzymes, SREBP-1c and FAS, were comparable in AλKO and WT mice. Thus, except for diminished expression of the gluconeogenic enzyme, PEPCK, the activities of hepatic and lipogenic and proinflammatory pathways appeared to be functioning comparably in ad lib fed AλKO and WT mice. This conclusion is in keeping with our findings that, in these ad lib fed mice, resting activity of hepatic aPKC was and serum lipids were not significantly different in AλKO and WT mice; The decrease in hepatic PEPCK expression is also in keeping with the increase in insulin-mediated suppression of hepatic glucose output in clamp studies.
Mechanistically, the increase in hepatic responsiveness to insulin in AλKO mice appeared to be largely attributable to diminished hepatic expression of PEPCK, and this, in turn, appeared to reflect increased FoxO1 phosphorylation secondary to increased activity and/or effectiveness of Akt, which phosphorylates ser-256 of Foxo1. In this regard, liver-specific knockout of the leptin receptor increases insulin sensitivity, as evidenced by enhanced Akt activation and decreased hepatic glucose output in clamp studies19; by analogy, a similar hepatic alteration may exist in hypoleptinemic AλKO mice. Additionally, alterations in other adipokines or cytokines may have participated in hepatic sensitization to insulin in AλKO mice.
It may be noted that AλKO mice, derived from the same line of PKC-λ-floxed mice used in our study, have also been studied by another group,20 and, as in our study, were found to have normal glucose tolerance and a trend to diminished food intake. These AλKO mice were also found to have energy expenditure, respiratory quotients, and locomoter activity indistinguishable from that of wild-type mice.20 However, unlike the present finding of leanness, these AλKO mice did not have significant alterations in either adiposity during the first 25 weeks of life, or in body weight during the first 40 weeks of life.20 The reasons for these differences are unclear. In our studies, although we did not study mice younger than 5 mo of age, significant decreases in both adiposity and body weight mice were observed by 2 independent laboratories in AλKO that were approximately 5–7 mo of age in studies at Tampa, and approximately 10 mo of age in clamp studies at New Haven. As data on adiposity of AλKO mice were supplied only for the first 25 weeks of life in the previous report,18 it is entirely possible that differences in ages of AλKO mice used in the present and previous study may account for observed differences in adiposity. On the other hand, the previous failure to see a decrease in body weight in 40-week-old mice directly contrasts with our findings in 10-mo-old mice, and factors other than age may be operative. In any case, future longitudinal studies are needed to determine if loss of PKC-λ in adipocytes provides protection from developing age-related increases in adiposity.
The requirement for PKC-λ during insulin stimulation of glucose transport in adipocytes of AλKO mice is similar to the requirement found in muscles of MλKO mice.3 However, AλKO and MλKO mice are decidedly different, in that MλKO mice are glucose-intolerant, insulin-resistant, obese, and hyperinsulinemic, and, moreover, have hepatosteatosis, and increased serum levels of triglycerides, cholesterol, and fatty acids;3 in contrast, these abnormalities were absent in AλKO mice. Relevant to these differences, whereas the activation and expression of hepatic lipogenic, proinflammatory, and gluconeogenic factors are increased in MλKO mice;3-5 these abnormalities were absent in AλKO mice.
The difference in metabolic abnormalities that ensue from impairments in glucose transport in MλKO vs. AλKO mice may, in part, reflect that muscle is quantitatively more important than adipose tissue in determining overall extra-hepatic glucose disposal, and MλKO mice are therefore more likely to develop a greater degree of glucose intolerance and systemic insulin resistance. However, additional factors are probably in play, as the enhanced suppression of hepatic glucose by insulin presently seen in AλKO was not present in MλKO mice.3
To some extent, AλKO mice are similar to LλKO mice in that overall insulin sensitivity is increased in both models. Nevertheless, whereas LλKO mice have diminished activity of hepatic SREBP-1c, AλKO did not; and, whereas LλKO mice display increased glucose tolerance, AλKO mice did not. The latter difference may reflect that the glucose tolerance test is particularly dependent on extrahepatic glucose disposal, which was unaltered in AλKO mice.
As insulin-stimulated glucose transport is similarly impaired in adipocytes of AλKO and AG4KO mice, and, as both knockouts were generated with mice harboring the same FAB4/aP2-Cre transgene, it is interesting that AλKO and AG4KO mice are very different. Thus, in contrast to findings of normal adiposity, insulin resistance, hyperinsulinemia, and impaired action of insulin in both muscle and liver in AG4KO mice,9 AλKO mice displayed diminished adiposity, increased hepatic insulin sensitivity, normal or diminished serum insulin levels, normal insulin effects on glucose uptake in muscle, and increased insulin signaling and action in liver. Whereas the difference in adipose mass may partly reflect differences in insulin levels of AλKO and AG4KO mice, other differences most likely reflect alterations in adipokines and cytokines that influence glucose homeostasis in distant organs, such as liver and the CNS. How PKC-λ and Glut4 deficiency differentially regulate these adipokines and cytokines remains for future investigations.
It is also interesting that AλKO mice are similar to FIRKO mice (similarly developed with mice harboring a transgene containing a FAB4/aP2 promoter driving Cre-recombinase) in that adipose mass is diminished in both cases. Also note that FIRKO mice are protected from diet-induced obesity and have increased longevity,10 presumably reflecting alterations in abundance of multiple enzymes in adipocytes, including, increases in peroxisome proliferator-activated receptor-γ coactivator-1α/β (PGC-1α/β) and mitochondrial oxidative enzymes.21,22 It remains to be seen if deficient insulin signaling to aPKC contributes to these expression alterations in FIRKO mice.
Finally, it may be noted that the FAB4/aP2 promoter used to drive Cre-recombine production and subsequent generation of AλKO, AD4KO and FIRKO mice has been found to be operational in monocyte-derived macrophages, as well as adipocytes.23,24 Thus, although findings in isolated adipocytes seem to reflect the loss of PKC-λ per se in these cells, some of the systemic, particularly hepatic, alterations seen in AλKO mice may have been dependent on altered production of proinflammatory cytokines in macrophages, as well as adipocytes. Further work is needed to examine this question. In either case, improvements in insulin sensitivity that arise from inhibition of PKC-λ in adipocytes and/or macrophages are important to keep in mind when evaluating the salutary metabolic effects that are seen in mice treated with chemical inhibitors of PKC-λ.5
To summarize, knockout-induced loss of PKC-λ, or acute chemical inhibition of a normal complement of PKC-λ in isolated mouse adipocytes, resulted in impaired insulin stimulation of glucose transport. Accordingly, it seems clear that that PKC-λ is at least partly required for insulin-stimulated glucose transport in the mouse adipocyte. Of further note, this defect in transport of glucose, which provides the glycerol backbone for glycerolipid synthesis, along with a marked deficiency of ERK, which is required for adipogenesis, seem likely to have contributed importantly to decreases in adiposity in AλKO mice. Moreover, this decrease in adiposity, along with alterations in serum levels of leptin and presumably other adipokines and cytokines in AλKO mice, was attended by increased Akt-dependent FoxO1 phosphorylation, diminished expression of hepatic PEPCK, and increased suppression of hepatic glucose output by insulin. Further studies are needed to identify the factors responsible for increases in hepatic insulin sensitivity, in AλKO mice.
Materials and Methods
Adipocyte-specific knockout of PKC-λ
AλKO mice were generated essentially as described for MλKO, FIRKO, and AG4KO mice.3,9,10 In short, C57Bl/6–129P2/Sv mice with floxed PKC-λ (see ref. 1) were crossed with C57BL/6J mice (Jackson Laboratory) harboring a fatty acid binding protein-4(FAB4/aP2)-promoter-regulated, Cre-recombinase transgene to generate homozygous AλKO mice, and wild-type (WT) littermates. The presence of the FAB4/aP2-Cre transgene or the floxxed-PKC-λ allele alone yielded mice indistinguishable from WT mice and were included in the WT experimental groups. Genotyping was accomplished with tail-clip DNA and PCR with primers as described previously.3
Mouse care
Mice were maintained in light- (12 h, 0700–1900 h, light; 12 h, 1900–0700 h, dark) and temperature- (20–24 °C) controlled environments and fed standard chow in Vivaria of the James A. Haley Veterans Administration Hospital in Tampa, Florida and Yale University School of Medicine in New Haven, Connecticut. Mice in Tampa were used at 5–7 mo of age, except for mice that were sent to Yale, which were approximately 10 mo old at the time of the clamp studies. In each experiment, mice were age-matched. Protocols were approved by the Institutional Animal Care and Use Committees of the University of South Florida College of Medicine and Yale University School of Medicine. Studies were conducted in accordance with guidelines of the National Institutes of Health and Principles of the Declaration of Helsinki.
Glucose transport in vivo
As described in reference 3, following overnight fast, 0.2 ml physiologic saline containing, each per gram body weight, 0.05 μCi [3H]2-deoxyglucose (DOG; NEN/Life Science Products), 0.005 μCi [14C] L-glucose (NEN/Life Science Products), ± 1 mU insulin (Sigma), was administered intraperitoneally 10 min before killing. Glucose uptake into abdominal/retroperitoneal/perigonadal adipose tissue, hind limb muscle, and heart muscle was measured by dividing the tissue [3H]-cpm (corrected for non-specific trapping of extracellular water as per [14C]-L-glucose radioactivity) by the specific 3H-radioactivity of serum glucose.
Glucose transport in adipocytes
As described reference 3, in 8 experiments using 4 AλKO mice, and 13 experiments using WT mice, adipose tissues from ad lib fed male or female mice were digested with collagenase and isolated adipocytes were incubated for 30 min in glucose-free Krebs Ringer phosphate medium ± 10 nM insulin, and then incubated for 1 min with 50 μM [3H]2-deoxyglucose, following which label uptake was measured by flotation of adipocytes through oil.
In experiments, in which ad lib fed WT mice were used, isolated adipocytes were preincubated in glucose-free Krebs Ringer phosphate medium for 30 min ± PKC-λ inhibitor, ICAPP, prior to incubation as described above for determination of basal and insulin-stimulated [3H]2-deoxyglucose uptake.
aPKC activation
aPKC activity was measured as described.3-6,8 Briefly, aPKCs were immunoprecipitated with a rabbit polyclonal antiserum (Santa Cruz Biotechnology) that recognizes the C-termini of PKC-λ and PKC-ζ, collected on Sepharose-AG beads, and incubated for 8 min at 30 °C in 100 μl buffer containing 50 mM Tris/HCl (pH 7.5), 100 μM Na3VO4, 100 μM Na4P2O7, 1 mM NaF, 100 μM PMSF, 4 μg phosphatidylserine (Sigma), 50 μM [γ-32P]ATP (NEN/Life Science Products), 5 mM MgCl2, and, as substrate, 40 μM serine analog of the PKC-ε pseudosubstrate (BioSource). After incubation, 32P-labeled substrate was trapped on P-81 filter paper and counted in a liquid scintillation counter. aPKC activation was also assessed by immunoblotting for phospho-threonine (Thr)-555/560-PKC-λ/ζ, the autophosphorylation site required for, and reflective of,aPKC activation.11
Akt activation
Akt activation was assessed, as described,3-6,8 by: (a) western analysis and immunoblotting for phosphoinositide-dependent protein kinase-2 (PDK2)-dependent phosphorylation of serine(Ser)-473-Akt1/2; (b) enzymatic activity of immunoprecipitable Akt2 using antibodies and assay reagents from Upstate Cell Signaling Technologies; and/or (c) phosphorylation of Akt substrate-160 (pAS160).
Western analyses
As described,3-6,8 cell lysates were immunoblotted for: PKC-ζ/λ (rabbit polyclonal antiserum; Santa Cruz Biotechnology; recognizes C-termini of both aPKCs, λ and ζ); mouse monoclonal anti-PKC-λ antibody (Transduction Labs); rabbit polyclonal anti-PKC-ζ antiserum (kindly provided by Dr Todd Sacktor, State University of New York); rabbit polyclonal anti-Akt1/2 antiserum (Upstate Cell Signaling Technologies); rabbit polyclonal anti-phospho-Ser-473-Akt1/2 antiserum (Upstate Cell Signaling Technology); rabbit polyclonal anti-phospho-AS160 antiserum (Cell Signaling Technology); mouse monoclonal anti-GLUT4 glucose transporter antibody (AbDserotec); mouse monoclonal anti-SREBP-1c antibody (Neomarkers, Inc.); rabbit polyclonal anti-p65/RelA subunit of NFκB antiserum (Santa Cruz Biotechnologies); rabbit polyclonal anti-ERK1/2, ERK1 and ERL2 antisera (Santa Cruz Biotechnologies); rabbit polyclonal anti-phospho-ERK1/2 (Santa Cruz Biotechnologies); rabbit polyclonal anti-IRS-1 antiserum (Upstate Cell Signaling Technology); rabbit polyclonal anti-tubulin antiserum (Santa Cruz Biotechnologies); rabbit polyclonal anti-Glut1 antiserum (Santa Cruz Biotechnologies); and rabbit polyclonal anti-IRS-2 antiserum (Santa Cruz Biotechnologies).
Nuclear preparations
As described in references 4–6 and 8, nuclei were prepared with NE-PER Nuclear and Cytoplasmic Extraction Reagents (Pierce Biotechnology).
mRNA analyses
As described,4-6 tissues were added to Trizol reagent (Invitrogen) and RNA extracted and purified with RNA-Easy Mini-Kit and RNAase-free DNAase set (Qiagen), quantified (A260/A280, checked for integrity by electrophoresis on 1.2% agarose gels, and mRNA quantified by quantitative real-time reverse transcriptase-polymerase chain reaction (RT-PCR) in a Applied Biosystem ABI Prism 7900HT instrument, and SYBR Green Advantage qPCR kit (Clonetech Laboratories). All PCR reactions were run in triplicates and quantitated in the ABI Prism 7900HT sequence detection system. Ct values were normalized to mouse HPRT expression to the corresponding sample, and the results were expressed as fold change. All the primers were validated for amplification efficiency. The mouse primers as follows: SREBP-1c, ATCGGCGCGG AAGCTGTCGG GGTAGCGTC (forward) and ACTGTCTTGG TTGATGAGCT GGAGCAT (reverse); FAS, GAGGACACTC AAGTGGCTGA (forward) and GTGAGGTTGC TGTCGTCTGT (reverse); ACC, GACTTCATGA ATTTGCTGAT (forward) and AAGCTGAAAG CTTTCTGTCT (reverse); PEPCK, GACAGCCTGC CCCAGGCAGT GA (forward) and CTGGCCACAT CTCGAGGGTC AG (reverse); G6Pase, TGCTGCTCAC TTTCCCCACC AG (forward) and TCTCCAAAGT CCACAGGAGG T (reverse); Il-1β, TTGACGGACC CCAAAAGATG (forward) and AGAAGGTGCT CATGTCCTCA (reverse); TNF-α, ACGGCATGGA TCTCAAAGAC (forward) and AGATAGCAAA TCGGCTGACG (reverse); PKC-ζ, CATGCAGAGG CAGAGAAAAC T (forward) and TTAGGTCCCG GTAGATGATC C (reverse); PKC-λ, TCACTGACTA CGGCATGTGT AA (forward) and CGCAGAAAGT GCTGGTTG (reverse); and housekeeping gene, hypoxanthine phosphoribosyl-transferase (HPRT), TGAAAGACTT GCTCGAGATG T (forward) and AAAGAACTTA TAGCCCCCCT T (reverse).
Blood/serum/tissue analyses
The following were used to measure: glucose, Life Scan glucometer; immunoreactive insulin, mouse kit, Linco; free/non-esterified fatty acids, kit, Wako Chemicals; triglycerides, kit, Sigma; total cholesterol, LDL-cholesterol and HDL-cholesterol, Advia 1650 Autoanalyzer, Bayer Instruments; and adiponectin, leptin, and resistin, Quantikine kits, R and D Systems.
Hyperinsulinemic–euglycemic clamps
Following transfer to the Yale University School of Medicine, male mice were maintained for several months prior to conduct of clamp studies, as described.1 These mice were approximately 10 mo old at the time of the clamp studies.
Statistical methods
Data are expressed as mean ± SEM. Statistical differences between 2 and 3 or more groups were determined by the Student t test and one-way ANOVA (Sigma Stat Statistical Software; the Tukey test was used for comparison of mean responses), respectively.
Disclosure of Potential Conflicts of Interest
No potential conflicts of interest were disclosed.
Acknowledgments
Supported by funds from: the Department of Veterans Affairs Merit Review Program; the NIH/NIDDK (RO1-DK-065969 to RVF; RO1-DK-40936, P30-DK-45735, and Yale Metabolic Phenotyping Center U24-DK-059635, GIS); and the Deutsche Forschungsgemeinschaft Sta314/2-1 and KE246/7-2 (ML).
Footnotes
Previously published online: www.landesbioscience.com/journals/adipocyte/article/26305
References
- 1.Farese RV, Sajan MP, Standaert ML. Insulin-sensitive protein kinases (atypical protein kinase C and protein kinase B/Akt): actions and defects in obesity and type II diabetes. Exp Biol Med (Maywood) 2005;230:593–605. doi: 10.1177/153537020523000901. [DOI] [PubMed] [Google Scholar]
- 2.Sajan MP, Rivas J, Li P, Standaert ML, Farese RV. Repletion of atypical protein kinase C following RNA interference-mediated depletion restores insulin-stimulated glucose transport. J Biol Chem. 2006;281:17466–73. doi: 10.1074/jbc.M510803200. [DOI] [PubMed] [Google Scholar]
- 3.Farese RV, Sajan MP, Yang H, Li P, Mastorides S, Gower WR, Jr., Nimal S, Choi CS, Kim S, Shulman GI, et al. Muscle-specific knockout of PKC-λ impairs glucose transport and induces metabolic and diabetic syndromes. J Clin Invest. 2007;117:2289–301. doi: 10.1172/JCI31408. [DOI] [PMC free article] [PubMed] [Google Scholar]
- 4.Sajan MP, Standaert ML, Nimal S, Varanasi U, Pastoor T, Mastorides S, Braun U, Leitges M, Farese RV. The critical role of atypical protein kinase C in activating hepatic SREBP-1c and NFkappaB in obesity. J Lipid Res. 2009;50:1133–45. doi: 10.1194/jlr.M800520-JLR200. [DOI] [PMC free article] [PubMed] [Google Scholar]
- 5.Sajan MP, Nimal S, Mastorides S, Acevedo-Duncan M, Kahn CR, Fields AP, Braun U, Leitges M, Farese RV. Correction of metabolic abnormalities in a rodent model of obesity, metabolic syndrome, and type 2 diabetes mellitus by inhibitors of hepatic protein kinase C-ι. Metabolism. 2012;61:459–69. doi: 10.1016/j.metabol.2011.12.008. [DOI] [PMC free article] [PubMed] [Google Scholar]
- 6.Sajan MP, Standaert ML, Rivas J, Miura A, Kanoh Y, Soto J, Taniguchi CM, Kahn CR, Farese RV. Role of atypical protein kinase C in activation of sterol regulatory element binding protein-1c and nuclear factor kappa B (NFkappaB) in liver of rodents used as a model of diabetes, and relationships to hyperlipidaemia and insulin resistance. Diabetologia. 2009;52:1197–207. doi: 10.1007/s00125-009-1336-5. [DOI] [PMC free article] [PubMed] [Google Scholar]
- 7.Matsumoto M, Ogawa W, Akimoto K, Inoue H, Miyake K, Furukawa K, Hayashi Y, Iguchi H, Matsuki Y, Hiramatsu R, et al. PKClambda in liver mediates insulin-induced SREBP-1c expression and determines both hepatic lipid content and overall insulin sensitivity. J Clin Invest. 2003;112:935–44. doi: 10.1172/JCI18816. [DOI] [PMC free article] [PubMed] [Google Scholar]
- 8.Sajan MP, Farese RV. Insulin signalling in hepatocytes of humans with type 2 diabetes: excessive production and activity of protein kinase C-ι (PKC-ι) and dependent processes and reversal by PKC-ι inhibitors. Diabetologia. 2012;55:1446–57. doi: 10.1007/s00125-012-2477-5. [DOI] [PMC free article] [PubMed] [Google Scholar]
- 9.Minokoshi Y, Kahn CR, Kahn BB. Tissue-specific ablation of the GLUT4 glucose transporter or the insulin receptor challenges assumptions about insulin action and glucose homeostasis. J Biol Chem. 2003;278:33609–12. doi: 10.1074/jbc.R300019200. [DOI] [PubMed] [Google Scholar]
- 10.Blüher M, Kahn BB, Kahn CR. Extended longevity in mice lacking the insulin receptor in adipose tissue. Science. 2003;299:572–4. doi: 10.1126/science.1078223. [DOI] [PubMed] [Google Scholar]
- 11.Farese RV, Sajan MP. Metabolic functions of atypical protein kinase C: “good” and “bad” as defined by nutritional status. Am J Physiol Endocrinol Metab. 2010;298:E385–94. doi: 10.1152/ajpendo.00608.2009. [DOI] [PMC free article] [PubMed] [Google Scholar]
- 12.Sajan MP, Standaert ML, Bandyopadhyay G, Quon MJ, Burke TR, Farese RV. Protein kinase C-zeta and phosphoinositide-dependent protein kinase-1 are required for insulin-induced activation of ERK in rat adipocytes. J Biol Chem. 1999;274:30495–500. doi: 10.1074/jbc.274.43.30495. [DOI] [PubMed] [Google Scholar]
- 13.Liu H, Kublaoui B, Pilch PF, Lee J. Insulin activation of mitogen-activated protein (MAP) kinase and Akt is phosphatidylinositol 3-kinase-dependent in rat adipocytes. Biochem Biophys Res Commun. 2000;274:845–51. doi: 10.1006/bbrc.2000.3208. [DOI] [PubMed] [Google Scholar]
- 14.Berggreen C, Gormand A, Omar B, Degerman E, Göransson O. Protein kinase B activity is required for the effects of insulin on lipid metabolism in adipocytes. Am J Physiol Endocrinol Metab. 2009;296:E635–46. doi: 10.1152/ajpendo.90596.2008. [DOI] [PubMed] [Google Scholar]
- 15.Kitamura Y, Accili D. New insights into the integrated physiology of insulin action. Rev Endocr Metab Disord. 2004;5:143–9. doi: 10.1023/B:REMD.0000021436.91347.93. [DOI] [PubMed] [Google Scholar]
- 16.Matsumoto M, Pocai A, Rossetti L, Depinho RA, Accili D. Impaired regulation of hepatic glucose production in mice lacking the forkhead transcription factor Foxo1 in liver. Cell Metab. 2007;6:208–16. doi: 10.1016/j.cmet.2007.08.006. [DOI] [PubMed] [Google Scholar]
- 17.Rodriguez A, Durán A, Selloum M, Champy MF, Diez-Guerra FJ, Flores JM, Serrano M, Auwerx J, Diaz-Meco MT, Moscat J. Mature-onset obesity and insulin resistance in mice deficient in the signaling adapter p62. Cell Metab. 2006;3:211–22. doi: 10.1016/j.cmet.2006.01.011. [DOI] [PubMed] [Google Scholar]
- 18.Lee SJ, Pfluger PT, Kim JY, Nogueiras R, Duran A, Pagès G, Pouysségur J, Tschöp MH, Diaz-Meco MT, Moscat J. A functional role for the p62-ERK1 axis in the control of energy homeostasis and adipogenesis. EMBO Rep. 2010;11:226–32. doi: 10.1038/embor.2010.7. [DOI] [PMC free article] [PubMed] [Google Scholar]
- 19.Huynh FK, Levi J, Denroche HC, Gray SL, Voshol PJ, Neumann UH, Speck M, Chua SC, Covey SD, Kieffer TJ. Disruption of hepatic leptin signaling protects mice from age- and diet-related glucose intolerance. Diabetes. 2010;59:3032–40. doi: 10.2337/db10-0074. [DOI] [PMC free article] [PubMed] [Google Scholar]
- 20.Habegger KM, Matzke D, Ottaway N, Hembree J, Holland J, Raver C, Mansfeld J, Müller TD, Perez-Tilve D, Pfluger PT, et al. Role of adipose and hepatic atypical protein kinase C lambda (PKCλ) in the development of obesity and glucose intolerance. Adipocyte. 2012;1:203–14. doi: 10.4161/adip.20891. [DOI] [PMC free article] [PubMed] [Google Scholar]
- 21.Blüher M, Wilson-Fritch L, Leszyk J, Laustsen PG, Corvera S, Kahn CR. Role of insulin action and cell size on protein expression patterns in adipocytes. J Biol Chem. 2004;279:31902–9. doi: 10.1074/jbc.M404570200. [DOI] [PubMed] [Google Scholar]
- 22.Katic M, Kennedy AR, Leykin I, Norris A, McGettrick A, Gesta S, Russell SJ, Bluher M, Maratos-Flier E, Kahn CR. Mitochondrial gene expression and increased oxidative metabolism: role in increased lifespan of fat-specific insulin receptor knock-out mice. Aging Cell. 2007;6:827–39. doi: 10.1111/j.1474-9726.2007.00346.x. [DOI] [PMC free article] [PubMed] [Google Scholar]
- 23.Makowski L, Boord JB, Maeda K, Babaev VR, Uysal KT, Morgan MA, Parker RA, Suttles J, Fazio S, Hotamisligil GS, et al. Lack of macrophage fatty-acid-binding protein aP2 protects mice deficient in apolipoprotein E against atherosclerosis. Nat Med. 2001;7:699–705. doi: 10.1038/89076. [DOI] [PMC free article] [PubMed] [Google Scholar]
- 24.Koliwad SK, Streeper RS, Monetti M, Cornelissen I, Chan L, Terayama K, Naylor S, Rao M, Hubbard B, Farese RV., Jr. DGAT1-dependent triacylglycerol storage by macrophages protects mice from diet-induced insulin resistance and inflammation. J Clin Invest. 2010;120:756–67. doi: 10.1172/JCI36066. [DOI] [PMC free article] [PubMed] [Google Scholar]


